Article

Hollow-Fiber Membrane Contactor for Biogas Recovery from Real Anaerobic Membrane Bioreactor Permeate

Institut Européen des Membranes, IEM, Université de Montpellier, CNRS, ENSCM, 34090 Montpellier, France
*
Author to whom correspondence should be addressed.
Membranes 2022, 12(2), 112; https://doi.org/10.3390/membranes12020112
Submission received: 17 December 2021 / Revised: 12 January 2022 / Accepted: 16 January 2022 / Published: 19 January 2022
(This article belongs to the Special Issue Advanced Membrane Bioreactors for Wastewater Treatment)

Abstract

:
This study demonstrates the application of hollow-fiber membrane contactors (HFMCs) for the recovery of biogas from the ultrafiltration permeate of an anaerobic membrane bioreactor (AnMBR) and synthetic effluents of pure and mixed CH4 and CO2. The developed membrane degassing setup was coupled with a pilot-scale AnMBR fed with synthetic domestic effluent working at 25 °C. The membrane degassing unit was able to recover 93% of the total dissolved CH4 and 83% of the dissolved CO2 in the first two hours of permeate recirculation. The initial recovery rates were very high (0.21 mg CH4 L−1 min−1 and 8.43 mg CO2 L−1 min−1) and the membrane was able to achieve a degassing efficiency of 95.7% for CH4 and 76.2% for CO2, at a gas to liquid ratio of 1. A higher mass transfer coefficient of CH4 was found in all experimental and theoretical evaluations compared to CO2. This could also be confirmed from the higher transmembrane mass transport resistance to CO2 rather than CH4 found in this work. A strong dependency of the selective gas transport on the gas and liquid side hydrodynamics was observed. An increase in the liquid flow rate and gas flow rate favored CH4 transport and CO2 transport, respectively, over each component. The results confirmed the effectiveness of the collective AnMBR and membrane degassing setup for biogas recovery. Still, additional work is required to improve the membrane contactor’s performance for biogas recovery during long-term operation.

Graphical Abstract

1. Introduction

Wastewater, which is currently becoming a significant source for water reuse, is also a potential renewable energy and nutrient resource in the form of biogas and fertilizers [1,2]. The use of wastewater as a renewable energy resource could become more practical through the development and utilization of economical, energy-efficient, and ecofriendly technologies [3]. Aerobic treatment of wastewater has been practiced for a long time; however, this method has various disadvantages including a high energy demand, high maintenance cost, and large amount of sludge production [4]. Alternatively, anaerobic processes have received significant attention as they could overcome the above-mentioned disadvantages of the aerobic processes.
Domestic wastewater has a chemical oxygen demand (COD) lower or equal to 1 g L−1, thus categorized as low-strength wastewater, and requires a significant amount of heat for anaerobic treatment since domestic wastewater is discharged in low ambient conditions. However, if low-strength wastewater is treated at low temperatures, the anaerobic process is very attractive by making it cost effective and more energy efficient [5,6,7].
Anaerobic membrane bioreactor (AnMBR) technology has emerged as a potential alternative for low-strength wastewater treatment [8,9,10] by coupling anaerobic bioreactors and membrane separation. This technology requires low energy input, reduces the footprint, and provides an easy scale-up and selective separation between resources and nutrients [11,12]. This method could generate renewable energy in the form of biogas, containing 50–70% CH4 and 30–50% CO2 [13,14]. However, the discharged anaerobic permeate still contains a huge amount of dissolved methane (dCH4) and dissolved carbon dioxide (dCO2), which is desorbed into the atmosphere and contributes to greenhouse gas emissions [15]. The dCH4 content in the anaerobic effluent ranges from 10–25 mg L−1 while the super saturation indices reach as high as 6.9 [16]. Additionally, according to Crone et al., 2016 [17], the average CH4 loss in effluent ranges from 11% to 100% depending on the process temperature and other operating conditions. CO2 represents a significant contributor to greenhouse gases, with a recently reported tropospheric concertation of ~400 ppm [18]. CH4 emissions also affect the concentration of atmospheric greenhouse gas because it is the second largest contributor to global greenhouse gases (~1834 ppb tropospheric concertation), with a 28-fold higher global warming potential than carbon dioxide [15,18]. In addition to environmental concerns, this significant loss of dCH4 in effluent represents a significant loss of the produced biogas, which is an economic loss. Several authors have observed that by efficiently recovering the dissolved methane, the AnMBR could be operated without additional energy input. Crone et al., 2016 [17], applied an energy balance on a staged anaerobic fluidized bed-membrane bioreactor (SAF-MBR) system. The total energy requirement of the process (including recovery, upgrading, and compression of dissolved methane; upgrading and compression of headspace methane; and operation of the anaerobic fluidized-bed bioreactor-anaerobic fluidized membrane bioreactor (AFBR-AFMBR) system) was 1.6 × 10⁻⁴ kWh/L of treated effluent, while the collective dissolved and headspace methane energy value was 1.6 × 10⁻⁴ kWh/L of treated effluent. This makes the balanced energy requirement equal to zero kWh/L of the treated wastewater.
Several technologies, such as packed columns, aeration towers, freefall jet towers, and diffused aerators, have been implemented to recover dissolved gases from the liquid stream [19]. The above-mentioned degasification methods mostly involve direct contact between the gas and liquid, which creates operational problems, such as flooding, foaming, and emulsion [20]. Some biological methods have also been implemented to recover dissolved methane from anaerobic effluents, namely, aerobic methane oxidation and aerobic methanotrophy [21]. Alternatively, the implementation of membrane degassing (MD) technology using membrane contactors (MCs) has emerged as a promising method to recover methane from aqueous streams [22].
MCs transfer gas molecules across a porous or dense membrane without dispersion of the two phases. Here, the membrane is used as a support for the gas–liquid interface (porous membranes) or as a barrier between the two phases (dense membranes). High degassing efficiencies can be achieved with compact units of MCs as they provide high volumetric mass transfer coefficients [23]. The separation process with MCs is more advantageous over other conventional process as their avoids the problems of gas separation encountered when using conventional methods, such as flooding, foaming channeling, and emulsion formation [24,25,26]. Due to the enhanced gas transport of porous membranes, they are regarded as being suitable for gas/liquid separations and can effectively reduce the footprint and energy consumption [17]. A notable challenge of porous membranes is that they are more prone to wetting. Liquid solvents can penetrate the pores of a membrane, causing an increase in the membrane mass transfer resistance. Membrane wetting can be caused due to the high pressure drop in the membrane module, the transmembrane pressure being higher than the liquid entry pressure, long-term operation, low hydrophobicity of the membrane, low surface tension of the solvents, and large size of the membrane pores [27,28,29]. Increasing the hydrophobicity of the membrane and decreasing the pore size could prevent pore wetting of the membrane, but it also creates other challenges [30,31,32]. Indeed, an increase in the hydrophobicity of the membrane speeds up the process of fouling (organic and bio) [33,34], which can also change the membrane surface properties and thus favor wetting. On the one hand, reducing the porosity might delay the fouling process, but on the other hand, it might reduce the overall performance by reducing the mass transfer flux due to an increased membrane mass transfer resistance [16,35].
In the past, various authors have worked on the recovery of biogas from anaerobic effluents using membrane contactors. Sethunga et al., 2019 [32], investigated dissolved CH4 recovery from synthetic and AnMBR effluent using porous PVDF- and PDMS-modified PVDF membrane contactors. The author reported enhanced CH4 flux despite an increased layer thickness. The author also demonstrated the importance of preserving the bulk porosity for the recovery of CH4 while coating the membrane surface. Sanchis-Perucho et al., 2020 [36], used a commercial PDMS membrane for the recovery of dissolved CH4 from AnMBR effluent. However, the reported CH4 flux was very low compared to Sethunga et al., 2019 [32]. This lower flux again justifies the importance of using a porous membrane, as suggested by Sethunga et al., 2019 [32]. The findings suggested a high vacuum pressure (0.8 bar) and low liquid flowrates (833 mL min−1) for maximum methane recovery. A macroporous PP membrane was used by Jiménez-Robles et al., 2021 [37], for the recovery of CH4, from synthetic effluent (CH4 dissolved in water), by combining vacuum and sweep gas desorption. The author reported higher recovery efficiencies in the combination mode, rather than using vacuum and sweep gas separately. The combined sweep gas and vacuum desorption approach was able to achieve a CH4 efficiency of nearly 90%. In a very recent work by Jiménez-Robles et al., 2022 [38], a flat sheet membrane contactor was used in the sweep gas mode to analyze the performance of various (dense and porous) commercial membranes. The author used a synthetic CH4-water stream and reported an alteration in the hydrophobicity of membranes, during degassing operation. So far, most of the reported work (including the referenced studies) has either been based on a synthetic mixture or has only focused on the recovery of CH4. Real effluent contains a large amount of dissolved CO2, which cannot be neglected due to the mentioned critical environmental concerns. Although few works have considered the presence of CO2 during recovery analysis, there is still a huge gap regarding a detailed analysis of the simultaneous desorption of CH4 and CO2 and their binary interaction affecting the transmembrane transport of these gases. Therefore, a detailed study of biogas recovery from real AnMBR effluent in real conditions is required.
In this work, we coupled a membrane contactor degassing system with an anaerobic membrane bioreactor bench-scale unit and synthetic effluent preparation unit to study and compare the recovery of biogas from real AnMBR permeate and synthetically prepared mixtures. The desorption of biogas from both synthetic effluents and real AnMBR permeates was thoroughly investigated. AnMBR ultrafiltration permeate was directly used from the AnMBR unit while synthetic effluents were prepared using pure and mixed CH4 and CO2. This study considered the recovery of both CH4 and CO2, simultaneously, by investigating their recovery rates, recovery percentage, transmembrane flux, and theoretical and experimental mass transfer coefficients. Simultaneous recovery allowed us to investigate the selective transport of CH4 and CO2 and to study and compare their mass transfer coefficients and transmembrane mass transport resistance to each gas component.

2. Material and Methods

2.1. Materials

Analytical-grade pure methane (CH4), carbon dioxide (CO2), and mixed gas (60% CH4 and 40% CO2) were purchased from Linde France. Deionized water from the Millipore Elix® 35 Water Purification System was used.

2.2. Effluent Preparation and Analysis
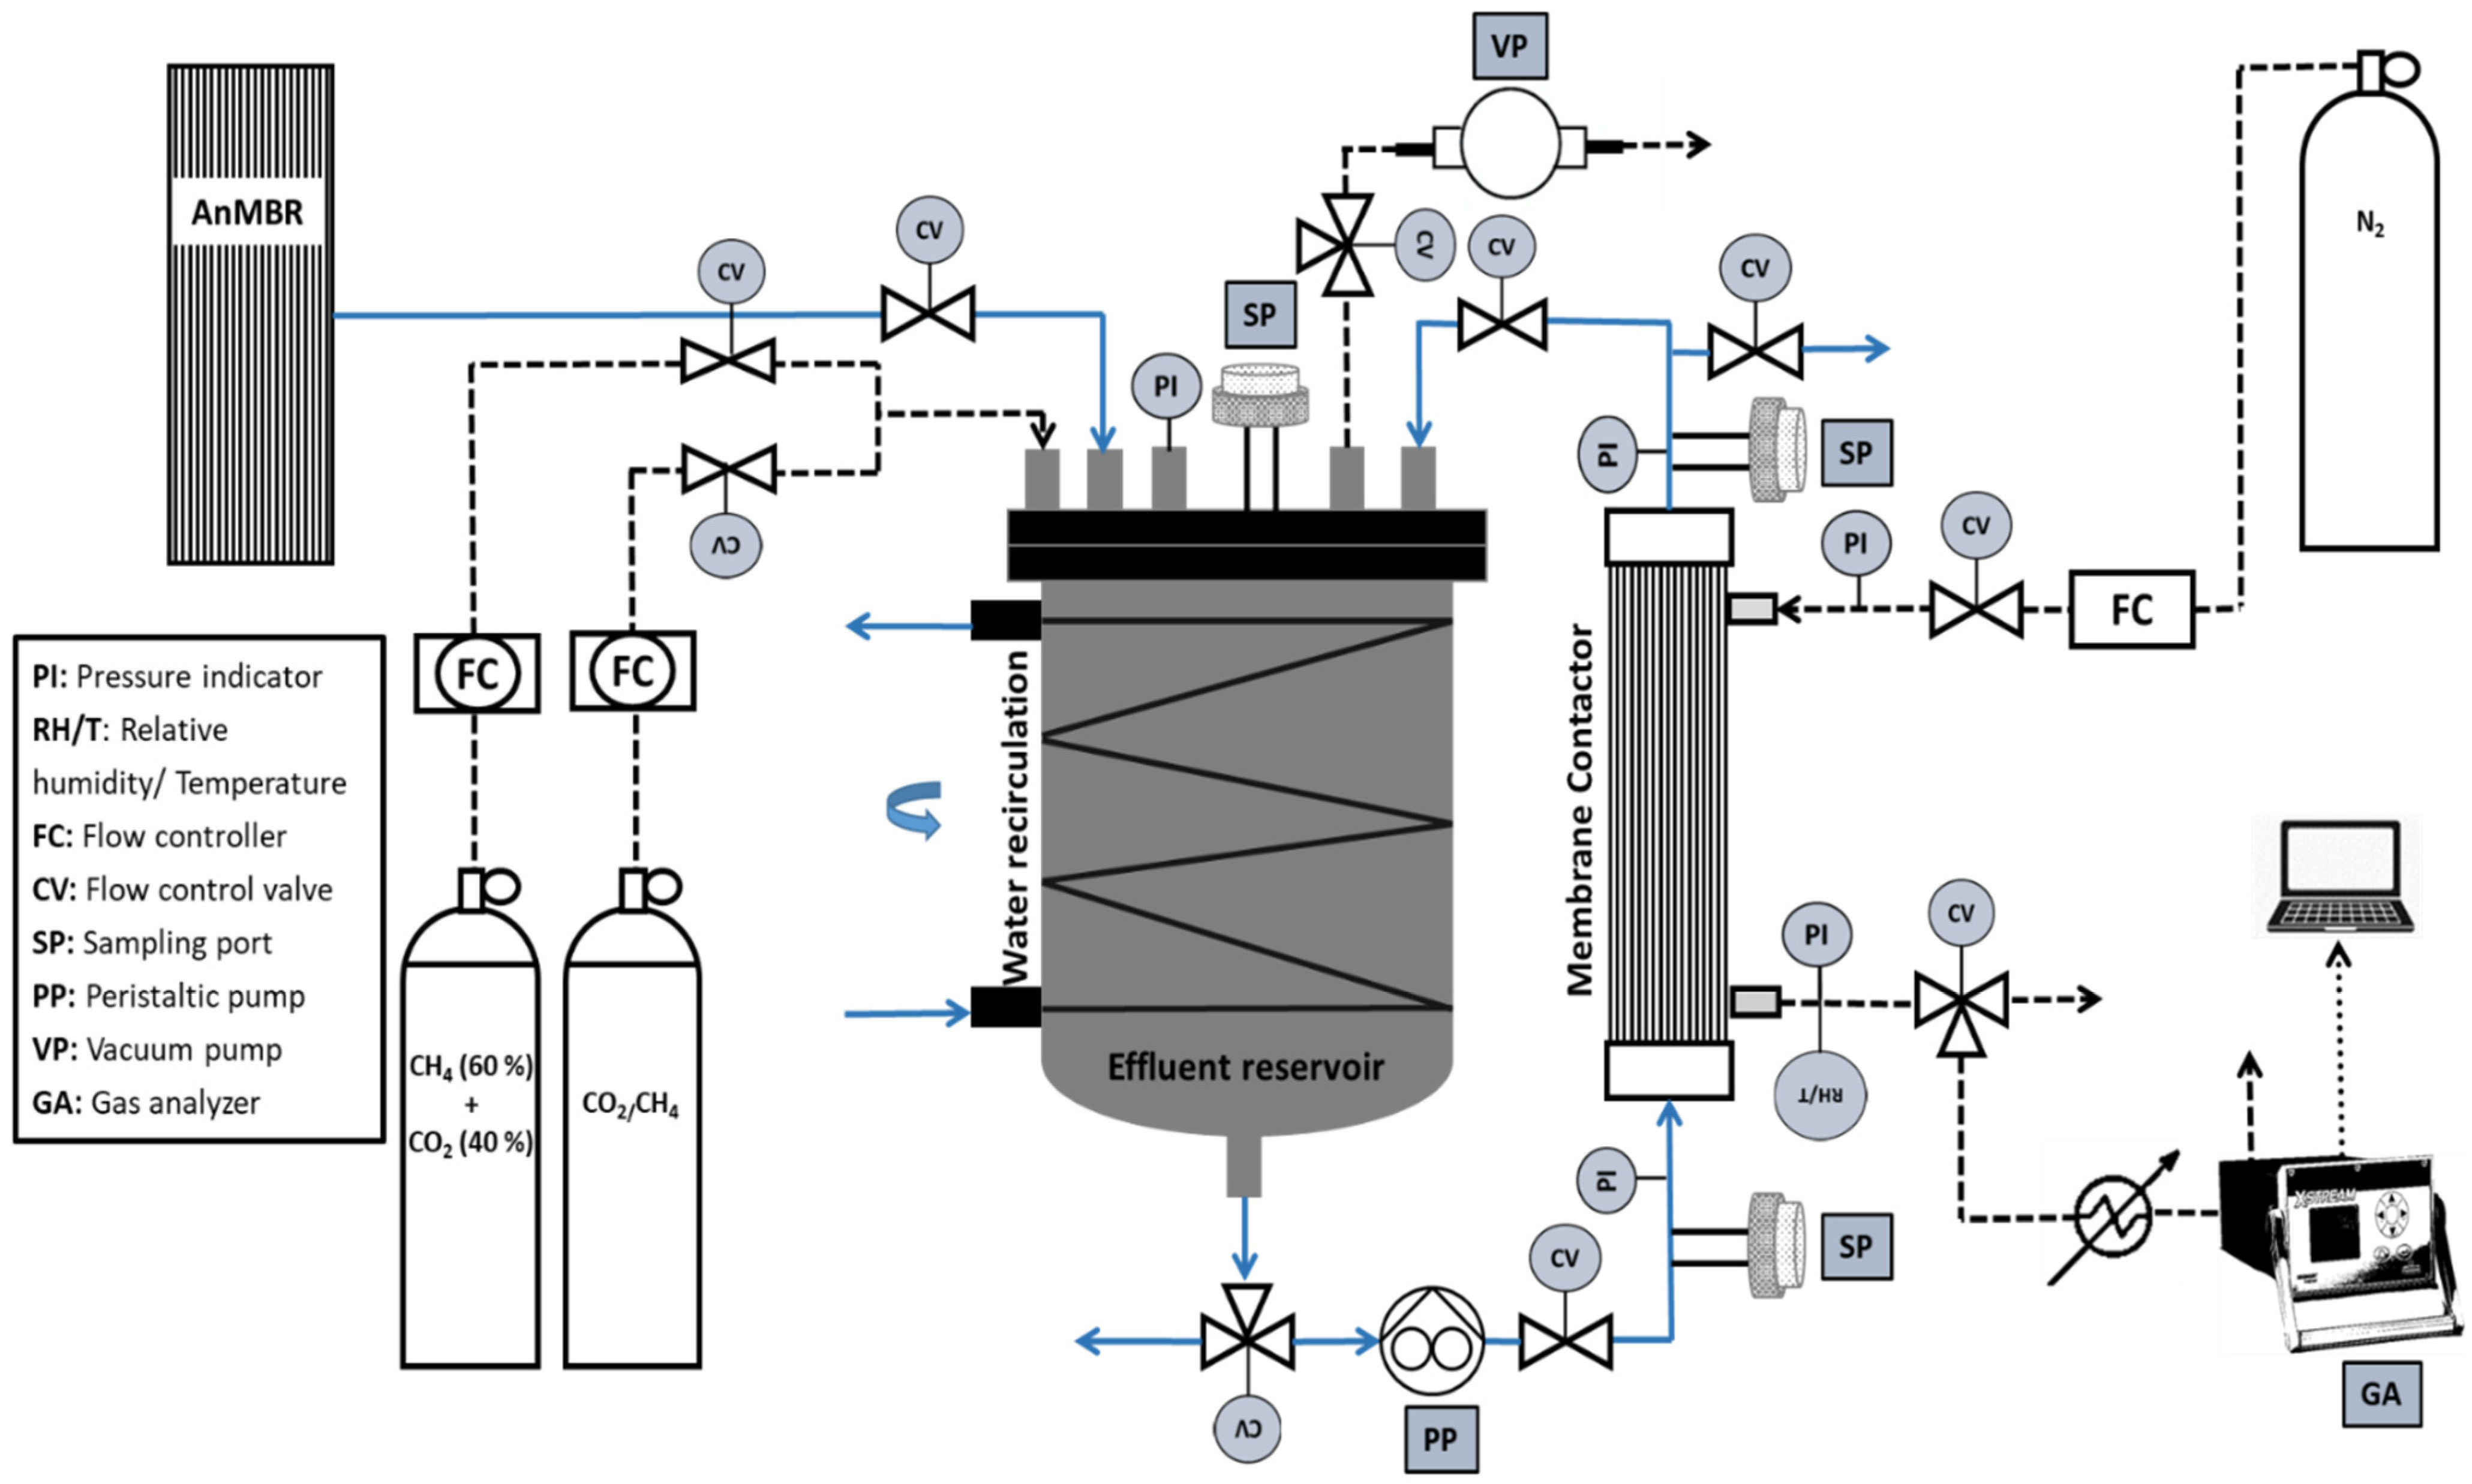
Synthetic effluents were prepared directly in an effluent tank using the pure and mixed gas cylinders, as presented in Figure 1. A vacuum pump was used to evacuate the air from the tank. Saturation was achieved by bubbling synthetic gas (for 1 h at 700 mL min−1) inside deionized water from the bottom of the tank using a submerged gas diffuser. The gas flow rate was controlled and adjusted using a gas flow meter, the AALBORG GFC17 mass flow controller. The pressure inside the tank during bubbling was monitored by a pressure transmitter STS ATM.1ST/T and was controlled using a control valve. The pressure was normally kept close to the atmospheric level while the temperature of the tank was kept at 25 °C using temperature controlling jacket around the tank.
The real AnMBR permeate (ultrafiltration permeate) was directly transferred to the effluent tank, from the exit of the membrane (AnMBR bench-scale unit), using a peristaltic pump. The main characteristics of the AnMBR permeate are presented in Table 1. The AnMBR unit is briefly described below.
The AnMBR unit was operated at ambient temperature (25 °C) for the treatment of 12 L per day of complex synthetic domestic wastewater (COD/N/P = 400/11/2) [39]. The lab-scale pilot consisted of a 6 L upflow anaerobic membrane bioreactor with a submerged flat sheet Microdyn Nadir® membrane (0.34 m²) with a 0.04 μm pore size and an initial hydraulic resistance of 1.2 1012 m–1. Additional details regarding the UFmembrane are available in Lahdhiri et al. [40]. A hydraulic retention time of 12h and an organic loading rate of 0.8 kg COD/m3/d were applied for more than 6 months before using the permeate for the degassing operation. Total solids and volatile solids were measured in the mixed liquor of the AnMBR tank at about 50 and 15 g/L, respectively.

2.3. Degassing

To recover the biogas from the effluents, a membrane contactor-based pilot setup was developed as presented in Figure 1 using porous hydrophobic membranes.
A hollow-fiber membrane contactor module (3M™ Liqui-Cel™ MM-1.7 × 5.5) with a parallel configuration and 0.58 m2 effective inner membrane area was supplied by 3M™, USA. The module contains hydrophobic polypropylene hollow fibers with a 40% porosity, potted with polyurethane. The specifications and operating conditions are presented in Table 2 (provided by the manufacturer).
The effluent was recirculated from the effluent reservoir to the lumen side of the module using an industrial peristaltic pump LONGER, G600-1J-1. The liquid flow rate varied from 100–400 mL min−1. The lumen side pressure drop was monitored by a differential pressure transmitter, MICROSENSOR, MDM490, which varied from 6.8–28.5 mbar depending on the flow rates. A sweep gas (N2) was allowed to flow counter currently through the shell side of the module. The flow rate of the sweep gas varied from 50–200 mL min−1 using the gas flow meter, AALBORG GFC17 mass flow controller. The gas side pressure at the inlet and outlet was monitored by a pressure transmitter, STS ATM.ECO. A hygro transmitter, Delta OHM HD48T was also installed at the gas outlet to measure the relative humidity (RH) and temperature of the exit gas. The temperature of the effluent tank was kept constant at 25 °C (similar to the one at which the AnMBR plant was operated) using a temperature-controlling jacket. The effluent was recirculated in a closed loop to the tank until the amount of biogas was degassed. The progress of the desorption was monitored on both the gas and liquid sides, as explained in Section 2.4. After each desorption with AnMBR permeate, the membrane was cleaned with deionized water by the countercurrent flow. Experiments were replicated three times and the data is presented as an average.

2.4. Determination of the Desorbed and Dissolved Biogas

The gas side concentration of the biogas at the module gas outlet was measured using a continuous biogas analyzer, Emerson X-Stream Enhanced XEGK. A condenser was installed before the analyzer to avoid water vapors. The analyzer indicated the biogas concentration in the dry gas. The biogas concentration in the wet gas (actual concentration of biogas at the immediate gas side exit) was calculated taking into consideration the water molar fraction and using RH (%) at the exit of the module (Equation (1)):
y H 2 O = % R H p H 2 O * 100 P
where yH2O (-) represents the molar fraction of water vapors at the membrane contactor gas side outlet, p*H2O (bar) is the saturated state water vapor pressure, and P (bar) represents the total gas pressure at the membrane contactor gas side outlet.
The water vapor molar fraction ranged from 0.026 to 0.03 for all experiments. All of the gas side results presented in this work are based on the wet biogas concentrations.
The liquid side concentrations of the biogas at the module liquid side inlet and outlet were measured by the headspace method as described by other authors [7,42,43]. The gas tight vials used an an 11.6 mL total volume (with a magnetic stirrer inside). Each vial was prepared for 10 min by passing helium gas through it to evacuate the air and finally to retrain helium at ~100 mbar. Helium gas was used as it is the carrier gas present in the gas chromatograph used for analysis. Samples of 6 mL were collected from the sampling port using the gastight syringe from Hamilton, gastight 1010, and injected through the prepared vials. The vials were then stirred at 500 rpm and 25 °C until equilibrium was reached (~10 min). Then, 300 μL of head space gas were collected using a 1 mL Hamilton gastight 1001 syringe, and injected through a PerkinElmer Gas Chromatograph, Clarus® 680, coupled with a thermal conductivity detector (TCD). The TCD temperature was 150 °C. The column used was RESTEK, ShinCarbon ST 100/120 with a 2 m length and 1 mm inner dial. The column temperature varied from 40–200 °C, with an initial pressure of 50 psi. The injection port temperature was kept at 200 °C. The carrier gas (He) flow rate ranged from 10–12 mL min−1. The gas chromatograph indicated the biogas concentration in the head space Cgh (mg L−1). The dissolved biogas concentration in the liquid phase Cl (mg L−1) was calculated from Equation (2):
C l = C g h ( V g h + V l H ) V l
where Vgh and Vl represent the head space volume and the liquid volume in the vial, respectively. H (C*gh/ C*l) in the equation represents the dimensionless Henry’s law constant for equilibrium between the mass gas (C*gh) and liquid (C*l) concentrations inside the vial. The temperature-dependent dimensionless Henry’s law constant H (—) was calculated from Equations (3) and (4) [44]:
H * ( mol   L 1   bar 1 ) = H θ e x p ( s o l H R ( 1 T 1 T θ ) )
H ( ) = 1 H * R   T
where Hθ (mol L−1 bar−1) and Tθ (°C) are the reference constants, R (L bar °C−1 mol−1) represents the gas constant, and ∆sol H (j mol−1) is the enthalpy of dissolution.

2.5. Performance Evaluation and Mass Transfer Calculations

The theoretical concentrations Ci (mg L−1) of the dissolved mixed and pure gases in the effluent were predicted based on the gas partial pressure approach using Henry’s law constant H* from Equation (3):
C i = H *   y i   P t
The degassing performance of the MC desorption setup was evaluated based on the membrane recovery percentage, recovery rate (mg L−1 min−1), degassing efficiency, gas side transmembrane flux, N (mg m−2 min−1), and experimental mass transfer coefficient (m s−1). The membrane biogas recovery (%) and recovery rate (mg L−1 min−1) over a time span, t, were calculated from the dissolved biogas concentration (initial = Cl-i, after time t = Cl-t) in the effluent tank following Equations (6) and (7):
%   R e c o v e r y t = C l i C l t C l i 100
R e c o v e r y   r a t e t = C l i C l t t
The membrane degassing efficiency was calculated using the dissolved biogas concentration at the module liquid side inlet Cl-in (mg L−1) and outlet Cl-out (mg L−1) using Equation (8):
D e g a s s i n g   e f f i c i e n c y = C l i n C l o u t C l i n 100
Transmembrane biogas molar flux (mg m−2 min−1) was calculated using Equation (9).
N = Q g o u t C g o u t Q g i n C g i n M g   A o = Q l i n C l i n Q g o u t C g o u t M g   A i
where Mg (mg mol−1) represents the molar mass of biogas, Ao (m2) is the effective area of the membrane, Cg-in (mg L−1) is the gas concentration at the module gas side inlet, Cg-out (mg L−1) is the gas concentration at the module gas side outlet, Qg-in (mL min−1) is the gas flowrate at the module gas side inlet, and Qg-out (mL min−1) is the gas flow rate at the module gas side outlet.
The overall experimental mass transfer coefficient, Kexp (m s−1), was calculated using the following equation [28]:
K e x p = Q l ( C l i n C l o u t ) A i C l m
where ∆Clm is the logarithmic mean of the driving force, which was calculated using Equation (11) [45]:
C l m = ( C l i n C l i n * ) ( C l o u t C l o u t * ) ln ( C l i n C l i n * C l o u t C l o u t * )
where C*l-in (C*l-in = Cg-out/H) and C*l-out (C*l-out = Cg-in/H) are the liquid phase biogas concentrations in equilibrium with the gas phase outlet (Cg-out) and inlet (Cg-in = 0) concentrations, respectively. The predicted values of H at 25 °C were 28.81 for CH4 and 1.22 for CO2.
The theoretical overall mass transfer coefficient Kov (m s−1) based on the liquid phase was calculated from the resistance in the series model for the liquid in the lumen side configuration, as presented in Equation (12) [46]:
1 K o v = d i H d o k g + d i H d l m k m + 1 k l
where di (m), do (m), and dlm (m) are the inner tube, outer tube, and log mean diameters; and kg (m s−1), km (m s−1), and kl (m s−1) represent the mass transfer coefficients of the gas membrane and liquid phases, respectively. H represents the dimensionless Henry’s law constant calculated from Equation (4). For a cylindrical geometry, such as MC, the overall resistance, Rov (s m−3), can be found by adding the resistance in all phases as shown in Equation (13) [37]:
R o v = 1 K o v A i = 1 H k g A o + 1 H k m A l m + 1 k l A i  
where Ai (m2), Ao (m2), and Alm (m2) are the inner, outer, and log mean membrane mass transfer areas, respectively.
In a similar way, the experimental resistance, Rexp (s m−3), was calculated using Equation (14):
R e x p = 1 K e x p A i
For the gas phase mass transfer coefficient kg, the correlation from Equation (15) was used [47]:
S h g = k g d h D g = 5.85   ( 1 ϕ ) ( d h L ) R e 0.6 S c 0.33   0 < R e < 500 ; 0.04 < ϕ < 0.4
For the liquid phase (flowing through the lumen), the mass transfer coefficient kl was estimated using the Leveque equation [48]:
S h l = k l d i D l = 1.62   ( d i L R e S c ) 1 / 3
For the gas-filled membrane, the mass transfer coefficient, km,g was estimated using Equation (17):
k m , g = ε τ δ D m , g
The physical parameters used to predict the above-mentioned mass transfer coefficients are listed in Table A1 of the Appendix A.
To predict the effect of pseudo-wetting, the back substitution method was implemented for the pseudo-wetted membrane mass transfer coefficient, km,w, using the experimental mass transfer coefficient Kexp in Equation (10) instead of the overall mass transfer coefficient Kov:
1 k m , w = ( 1 K e x p d i H d o k g 1 k l ) H d l m d i
The effective gas diffusion coefficient, Dm,eff, of the pseudo-wetted membrane was calculated from:
D m , e f f = k m , w τ δ ε

3. Results and Discussion

3.1. Degassing System Performance

Experiments were first conducted using synthetic effluents with pure CH4, pure CO2, and a mixture of CH4 and CO2. The initial biogas concentrations of the prepared synthetic mixtures (effluents) were measured using the head space method explained in the materials and methods section. The theoretical biogas concentrations were calculated based on the gas partial pressure approach and Henry’s solubility law (details are provided in Section 2.4 and Section 2.5) and are presented in Figure 2. Figure 2 shows that the theoretical values are close to the ones measured for the effluents in the effluent tank. The percent difference ranged from 1.3–5%. This validates the methods and protocols followed during the preparation of synthetic mixtures and the equilibrium protocols implemented for the vial preparation for the head space method.
The MC degassing progress was monitored by measuring the dissolved biogas concentration in the effluent tank at various operational times. Figure 2 shows a significant drop in the concentration of dissolved biogas in the effluent with the operational time of degassing. For example, in the first two hours, the concentration of pure dissolved CH4 dropped from 24.5 mg L−1 to 10.7 mg L−1 while the concentration of pure dissolved CO2 dropped from 1500 mg L−1 to 358.3 mg L−1. It is also evident that the concentration drop was faster at the beginning and slowed down with time. The high initial drop could have been caused by the high initial concentration of the dissolved gas in the liquid and hence the high driving force through the membrane. For the same reason, the drop was higher for pure CO2 than for pure CH4. Similar trends were observed for both CH4 and CO2 when they were mixed (Figure 2c,d). This significant drop in the concentration of dissolved biogas in the effluent provides evidence that the degassing method (followed here) was effective.
The recovery percentage (Equation (5)) of the biogas in the first two hours (2h-Recovery percentage) of the degassing operation is presented in Figure 3 for different values of the liquid side Reynolds number, Rel (1.30–5.19), and gas side Reynolds number, Reg (0.07) (Figure 3a), and for different values of Reg (0.04–0.15) and a fixed Rel (1.30) (Figure 3b). By fixing the liquid side Rel at 5.19 and Reg at 0.07, the achieved 2h-recovery percentages were 92.8%, 87.0%, 83.4%, and 89.2% for mix CH4, pure CH4, mix CO2, and pure CO2, respectively. The above-mentioned recovery percentages confirmed the recovery of most of the dissolved biogas in the first two hours of the degassing. A significant effect of the Reynold number on the 2h-recovery percentage was also observed. For example, for pure CH4 an, increase in the liquid side Reynold number from 1.29 to 5.19 increased the 2h-recovery percentage by 29.4%. The gas side Reynold number had similar effects on the 2h-recovery percentage. An increase of 9.6% and 25.2% in the 2h-recovery percentages was observed for mix CH4 and mix CO2, respectively, by increasing the gas Reynold number from 0.037 to 0.15.
The CH4 and CO2 recovery rates (mg L−1 min−1) were calculated from Equation (7). As the degassing process was not completely in steady state and the degassing rate changed with time, the recovery rate was also not constant. Therefore, we calculated average biogas recovery rate over 1-h and 2-h span of time. The average recovery rate for the mix (Figure 3c) and pure effluents (Figure 3d) is presented in Figure 3 for different Rel (1.30–5.19) and for a fixed Reg (0.07). The recovery rates of the dissolved CO2 were very high compared to the dissolved CH4, besides the fact that CH4 can be easily recovered (degassed) from water. By fixing Rel at 5.19 and Reg, at 0.07, the 1h-recovery rates of CH4 and CO2 were 0.21 and 8.4 mg L−1 min−1, respectively. The high CO2 recovery rates can be explained by the large quantity of CO2 dissolved in the effluent due to its nearly 24 times higher water solubility (considering Henry’s solubility law; Equations (3) and (4)) than CH4. The 1h recovery analysis gave nearly two times higher values that that of the 2h recovery, which explains why the recovery was faster in the initial hours of degassing. For example, at Rel of 5.19, the mix CH4 2h recovery rate was 0.11 mg L−1 min−1, nearly half of the 1h recovery rate (0.21 mg L−1 min−1). Additionally, a significant effect of the Reynolds number on both the 1h and 2h recovery rates was observed. For example, the 1h recovery rate of the mix CH4 increased from 0.12 mg L−1 min−1 to 0.21 mg L−1 min−1 by increasing Rel from 1.29 to 5.19. The effects of the gas and liquid side hydrodynamics on the membrane degassing efficiency will be further discussed in the following sections.

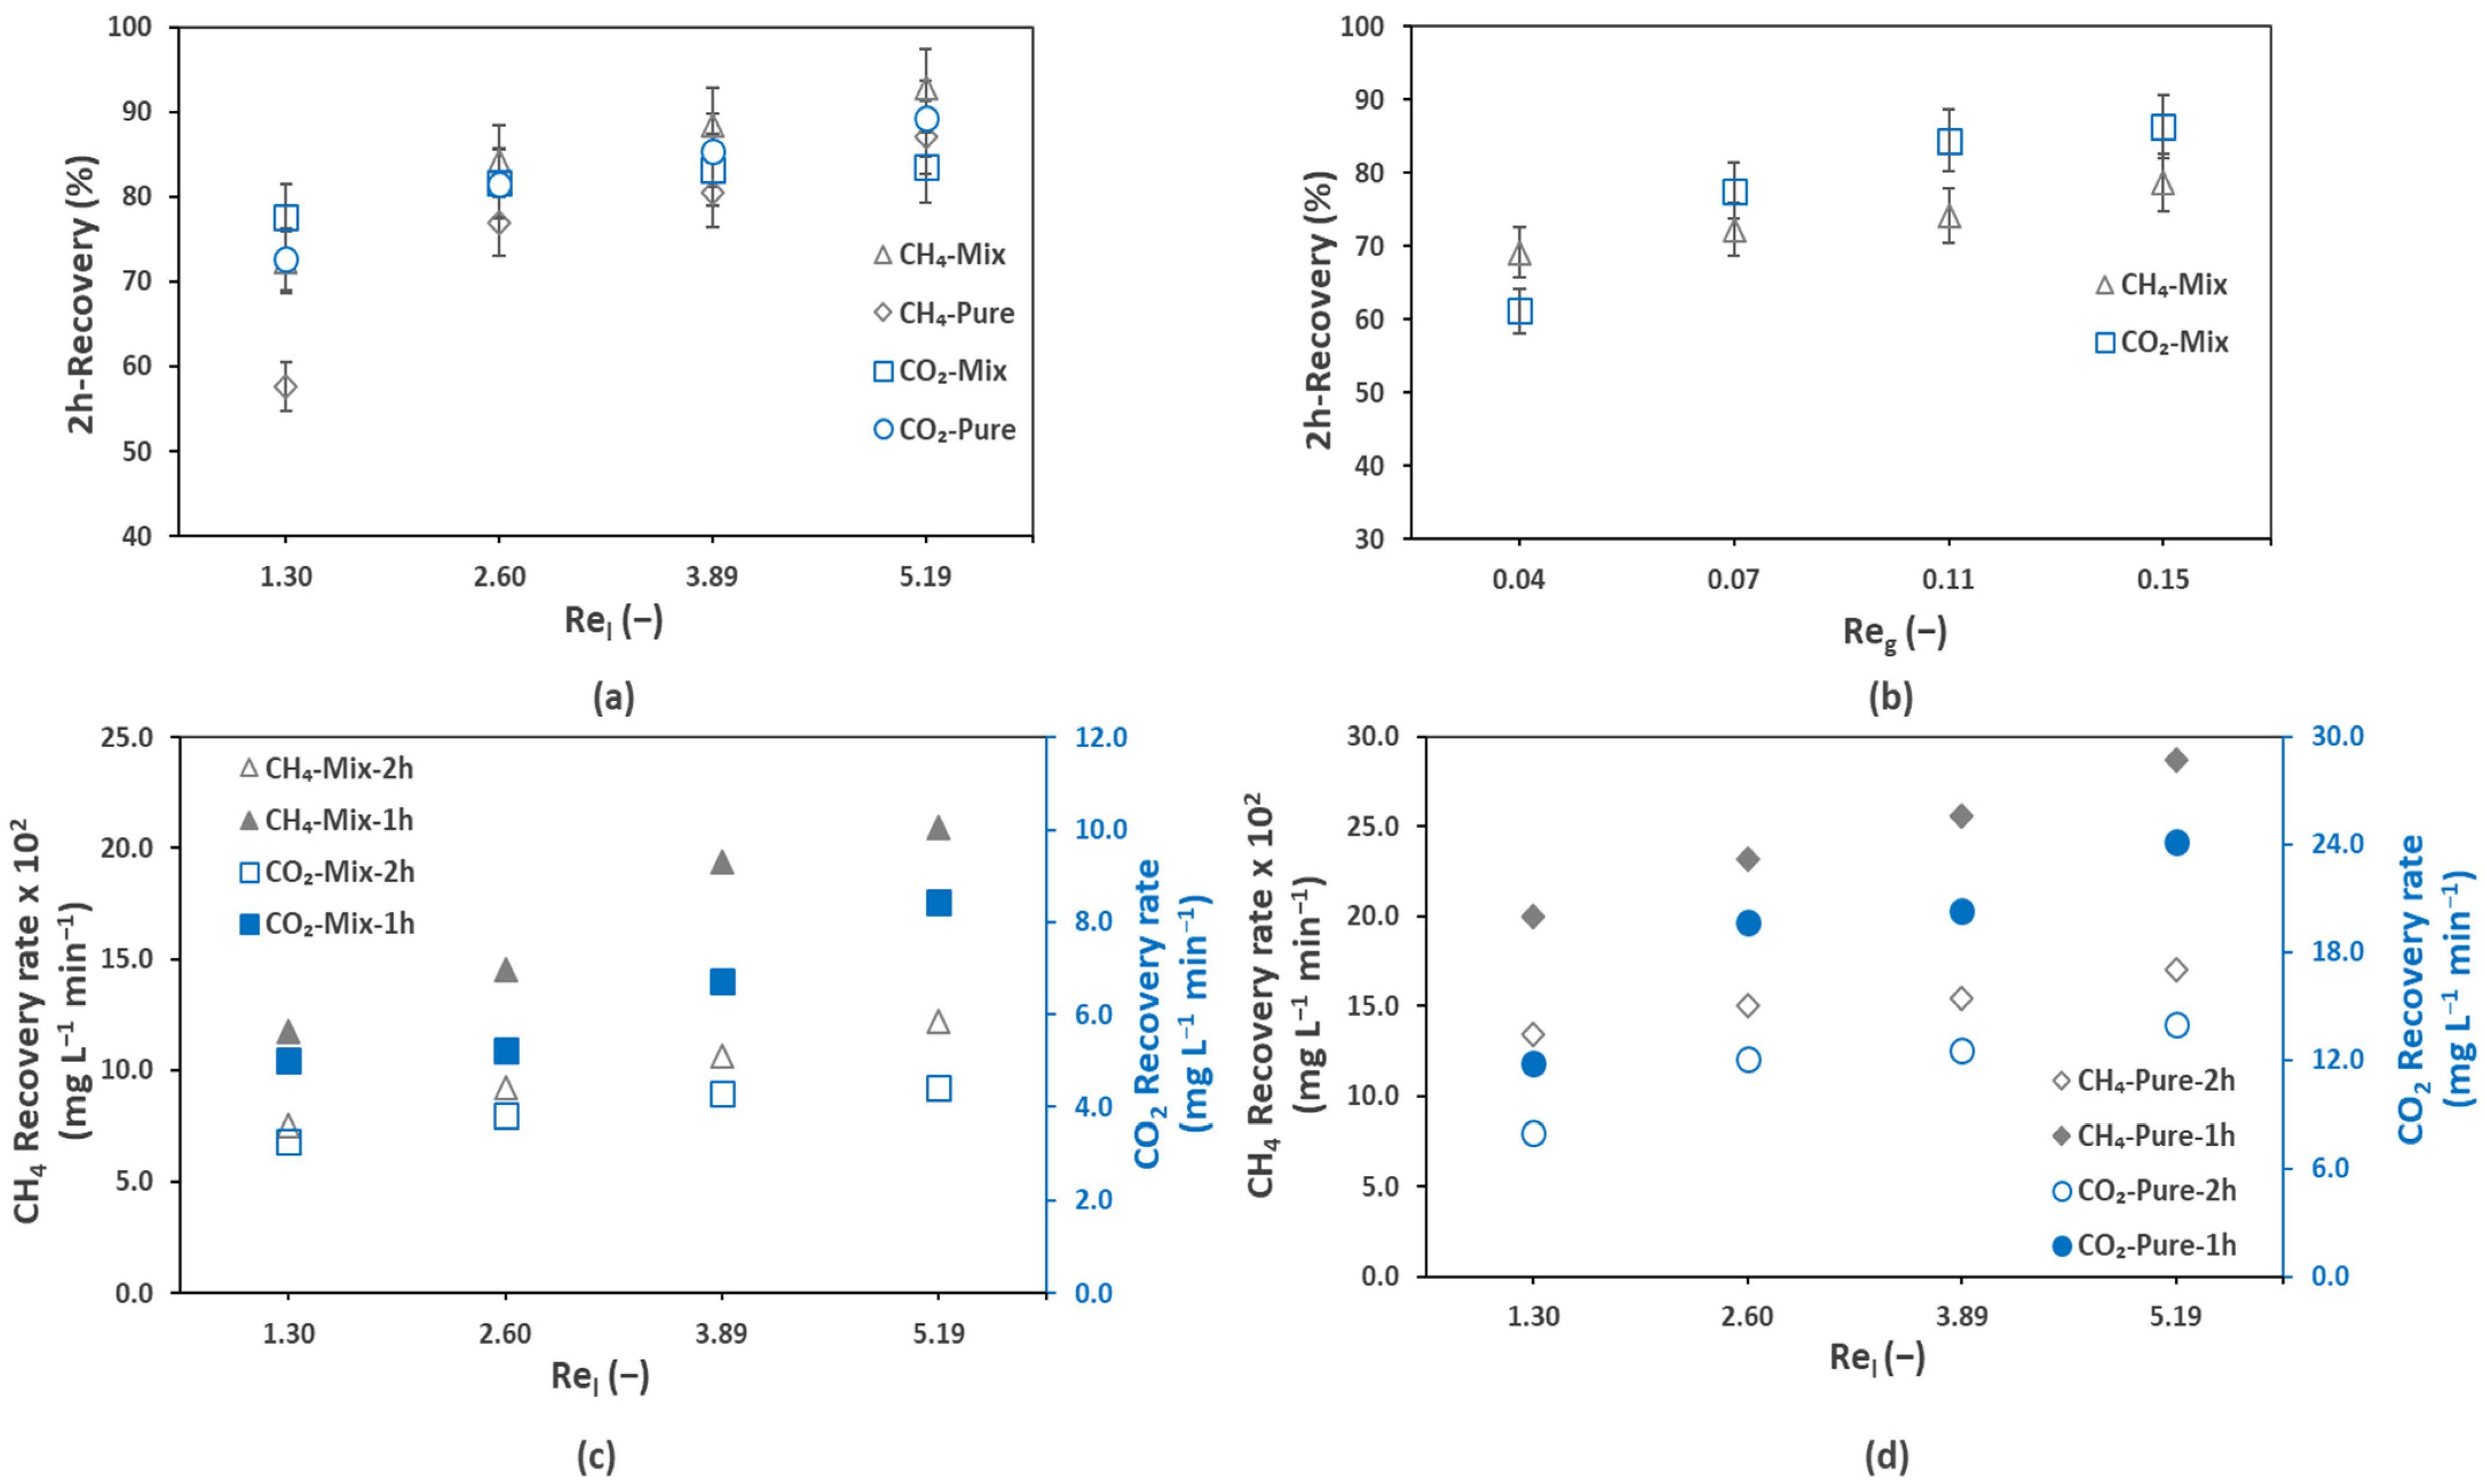
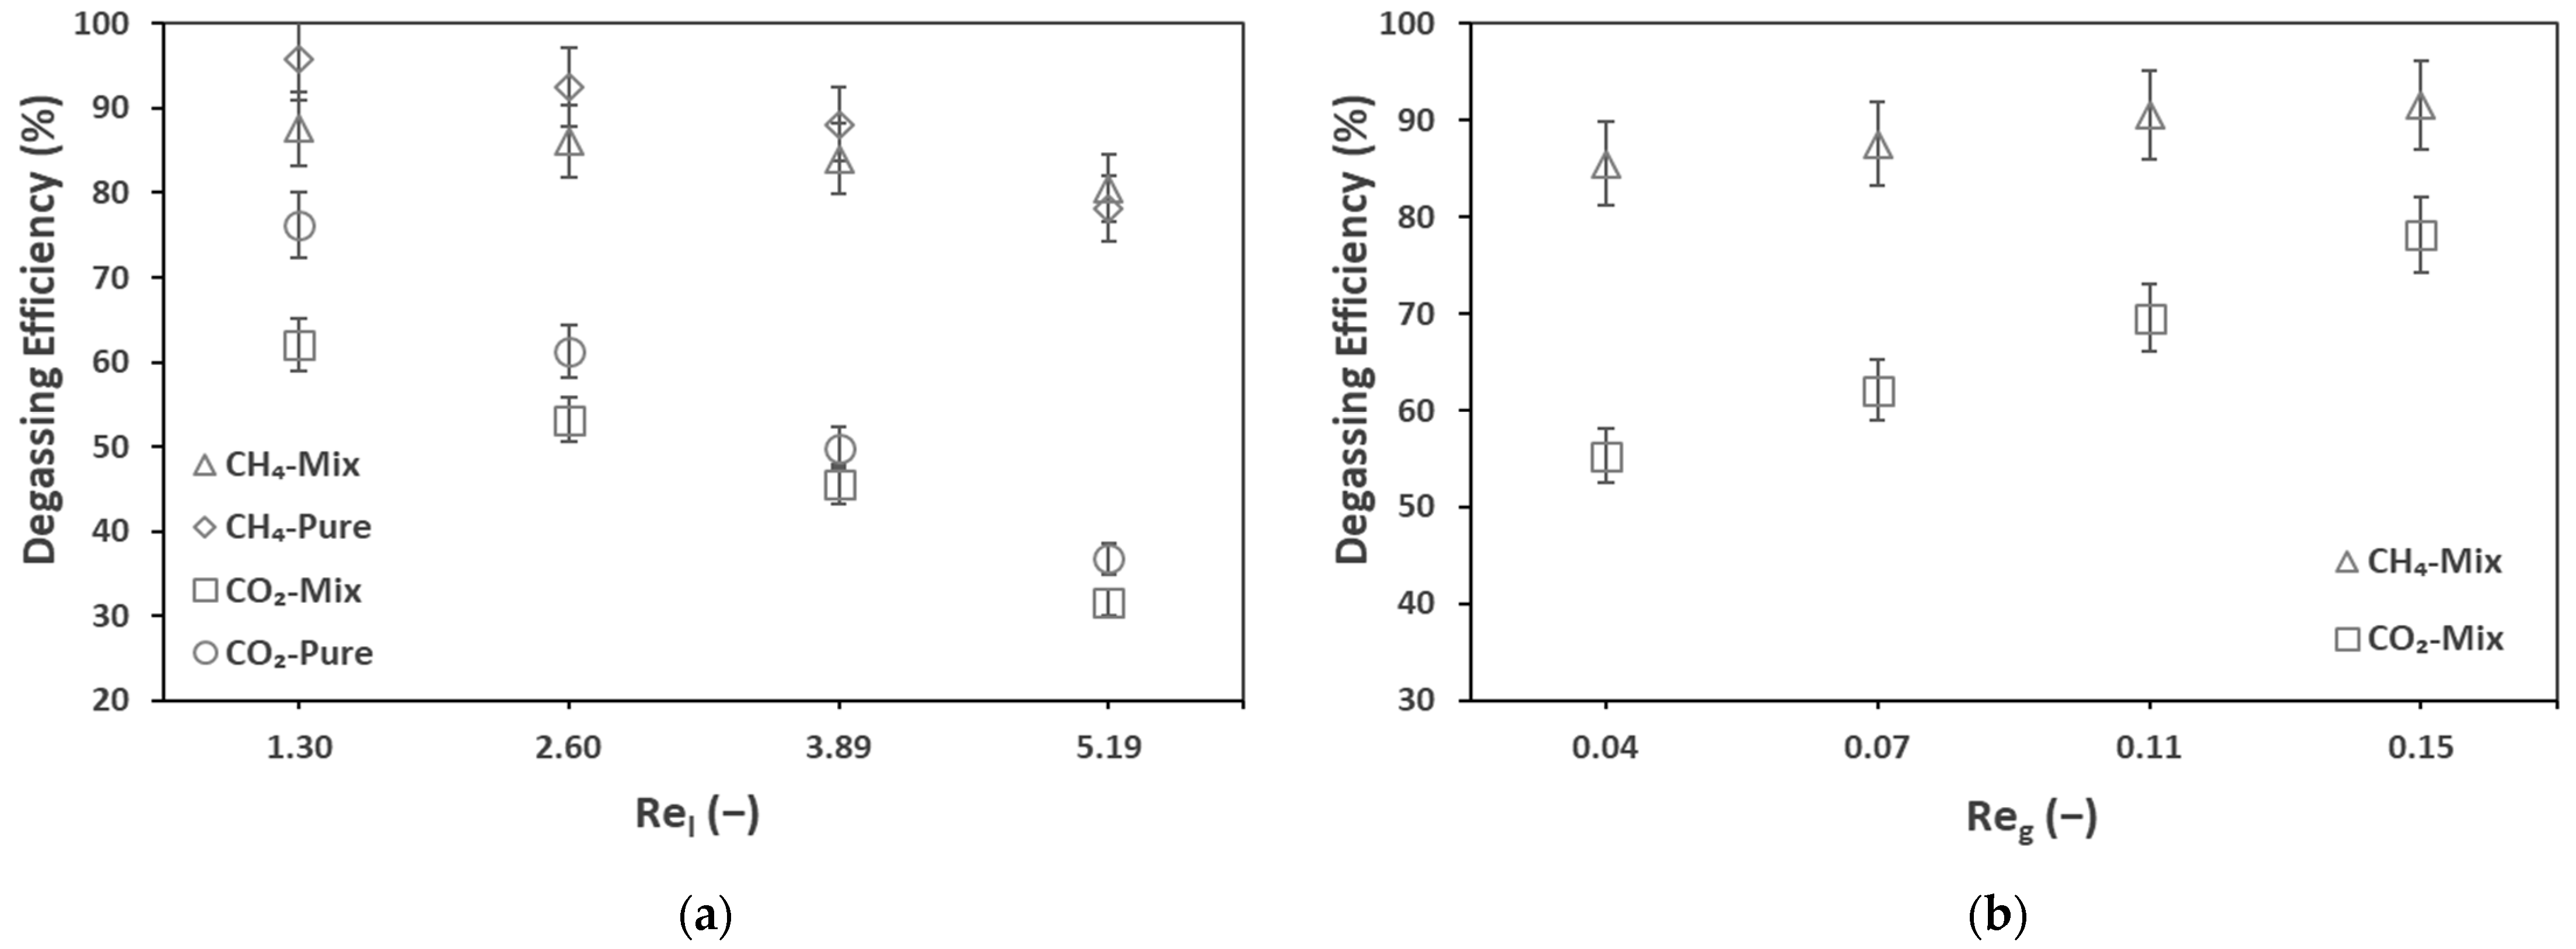
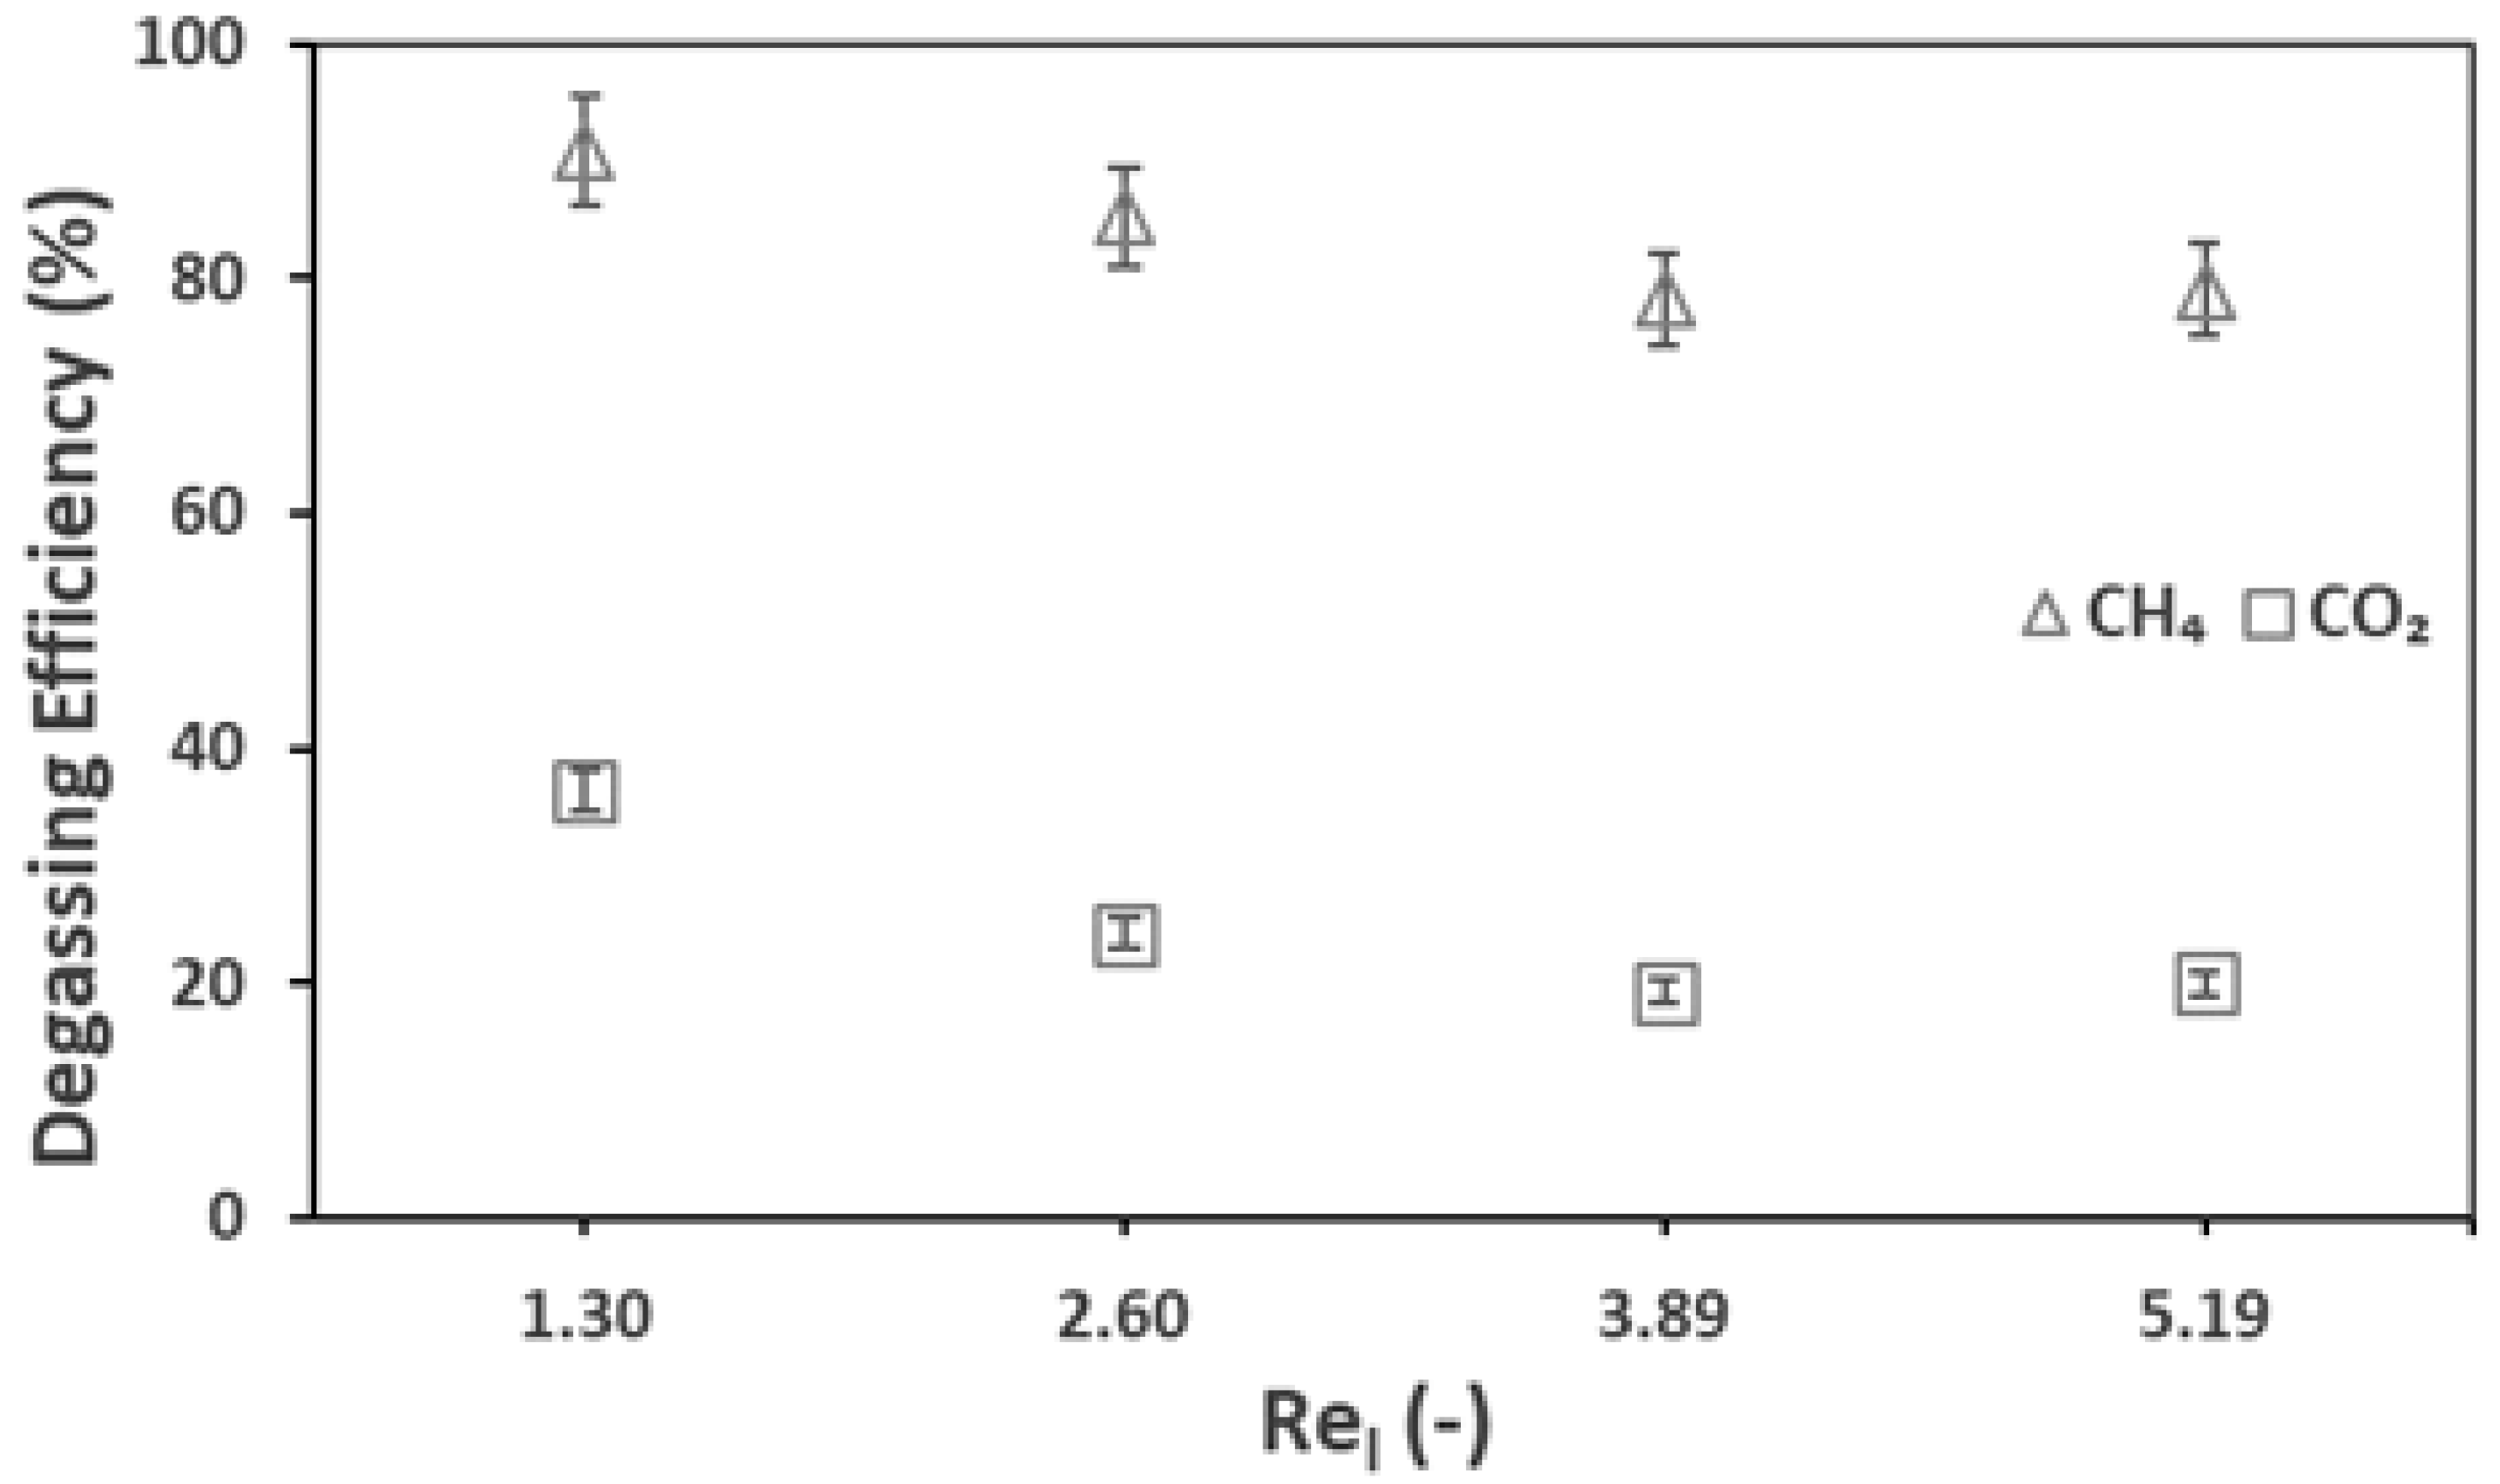
3.2. Membrane Degassing System Efficiency

In the previous section, the membrane contactor degassing system global performances are discussed. The liquid and gas flow rates (or velocities/Reynolds numbers) are the two most important operational conditions in the operation of membrane contactors. This section presents the effect of the above-mentioned parameters on the degassing efficiency (Equation (7)) of the membrane (between the inlet and outlet of the membrane contactor) for biogas recovery. Figure 4 presents the effect of the liquid flow rate (a) and gas flow rate (b) on the degassing efficiency of the membrane.
Increasing the liquid flowrate decreased the membrane degassing efficiency while the global recovery was increased (see the previous section). For example, at a liquid flow rate of 100 mL min−1 (Rel = 1.30), the inlet and outlet dissolved CH4 concentrations were 27.7 and 1.2 mg L−1, respectively, resulting in a membrane degassing efficiency of 95.8%. This efficiency dropped to 78.1% (5.7 mg L−1 dissolved CH4 at the membrane outlet) by increasing the liquid flowrate from 100 mL min−1 (Rel = 1.30) to 400 mL min−1 (Rel = 5.19). This seems to be related to the short residence time of the effluent inside the membrane module at higher liquid flowrates. Similar effects were observed by Sanchis-Perucho et al., 2020 [36], Jiménez-Robles et al., 2021 [37], and Henares et al., 2018 [43], as presented in Table 3. The porous membranes presented in this table had the same pore size of 0.04 µm. Despite causing a decrease in the degassing efficiency, an increase in the liquid flow rate increased the recovery percentage and recovery rate (Figure 3), which confirms that even if the degassing membrane efficiency decreases, the overall performance is enhanced, with an increase in the liquid flow rate. Two phenomena affected the degassing performance: the transmembrane flux (related to the concentration difference/driving force and the mass transfer coefficient) and the liquid retention time. An increase in the liquid flow rate increased the mass transfer coefficient and thus decreased the liquid-side mass transfer resistance. The above-mentioned results justify the dominance of the transmembrane flux over the retention time.
The effect of the gas flow rate was investigated by Cookney et al., 2016 [49], who reported that changing the sweep gas velocity from 0.0015 m s−1 to 0.009 m s−1 had almost no influence on the degassing efficiency. However, in this work, we observed an influence of the gas flow rate. An increase in the sweep gas flow rate increased the degassing efficiency. Particularly, for CO2, increasing the gas flowrate from 50 (Reg = 0.04) ml min−1 to 200 mL min−1 (Reg = 0.15) increased the degassing efficiency from 55.3% (249.1 mg L−1 dissolved CO2 at the membrane outlet) to 78.1% (112.6 mg L−1 dissolved CO2 at the membrane outlet). This might have occurred due to an increase in the transmembrane driving force because of a lower gas side biogas concentration due to the dilution effect at higher sweep gas flow rates.

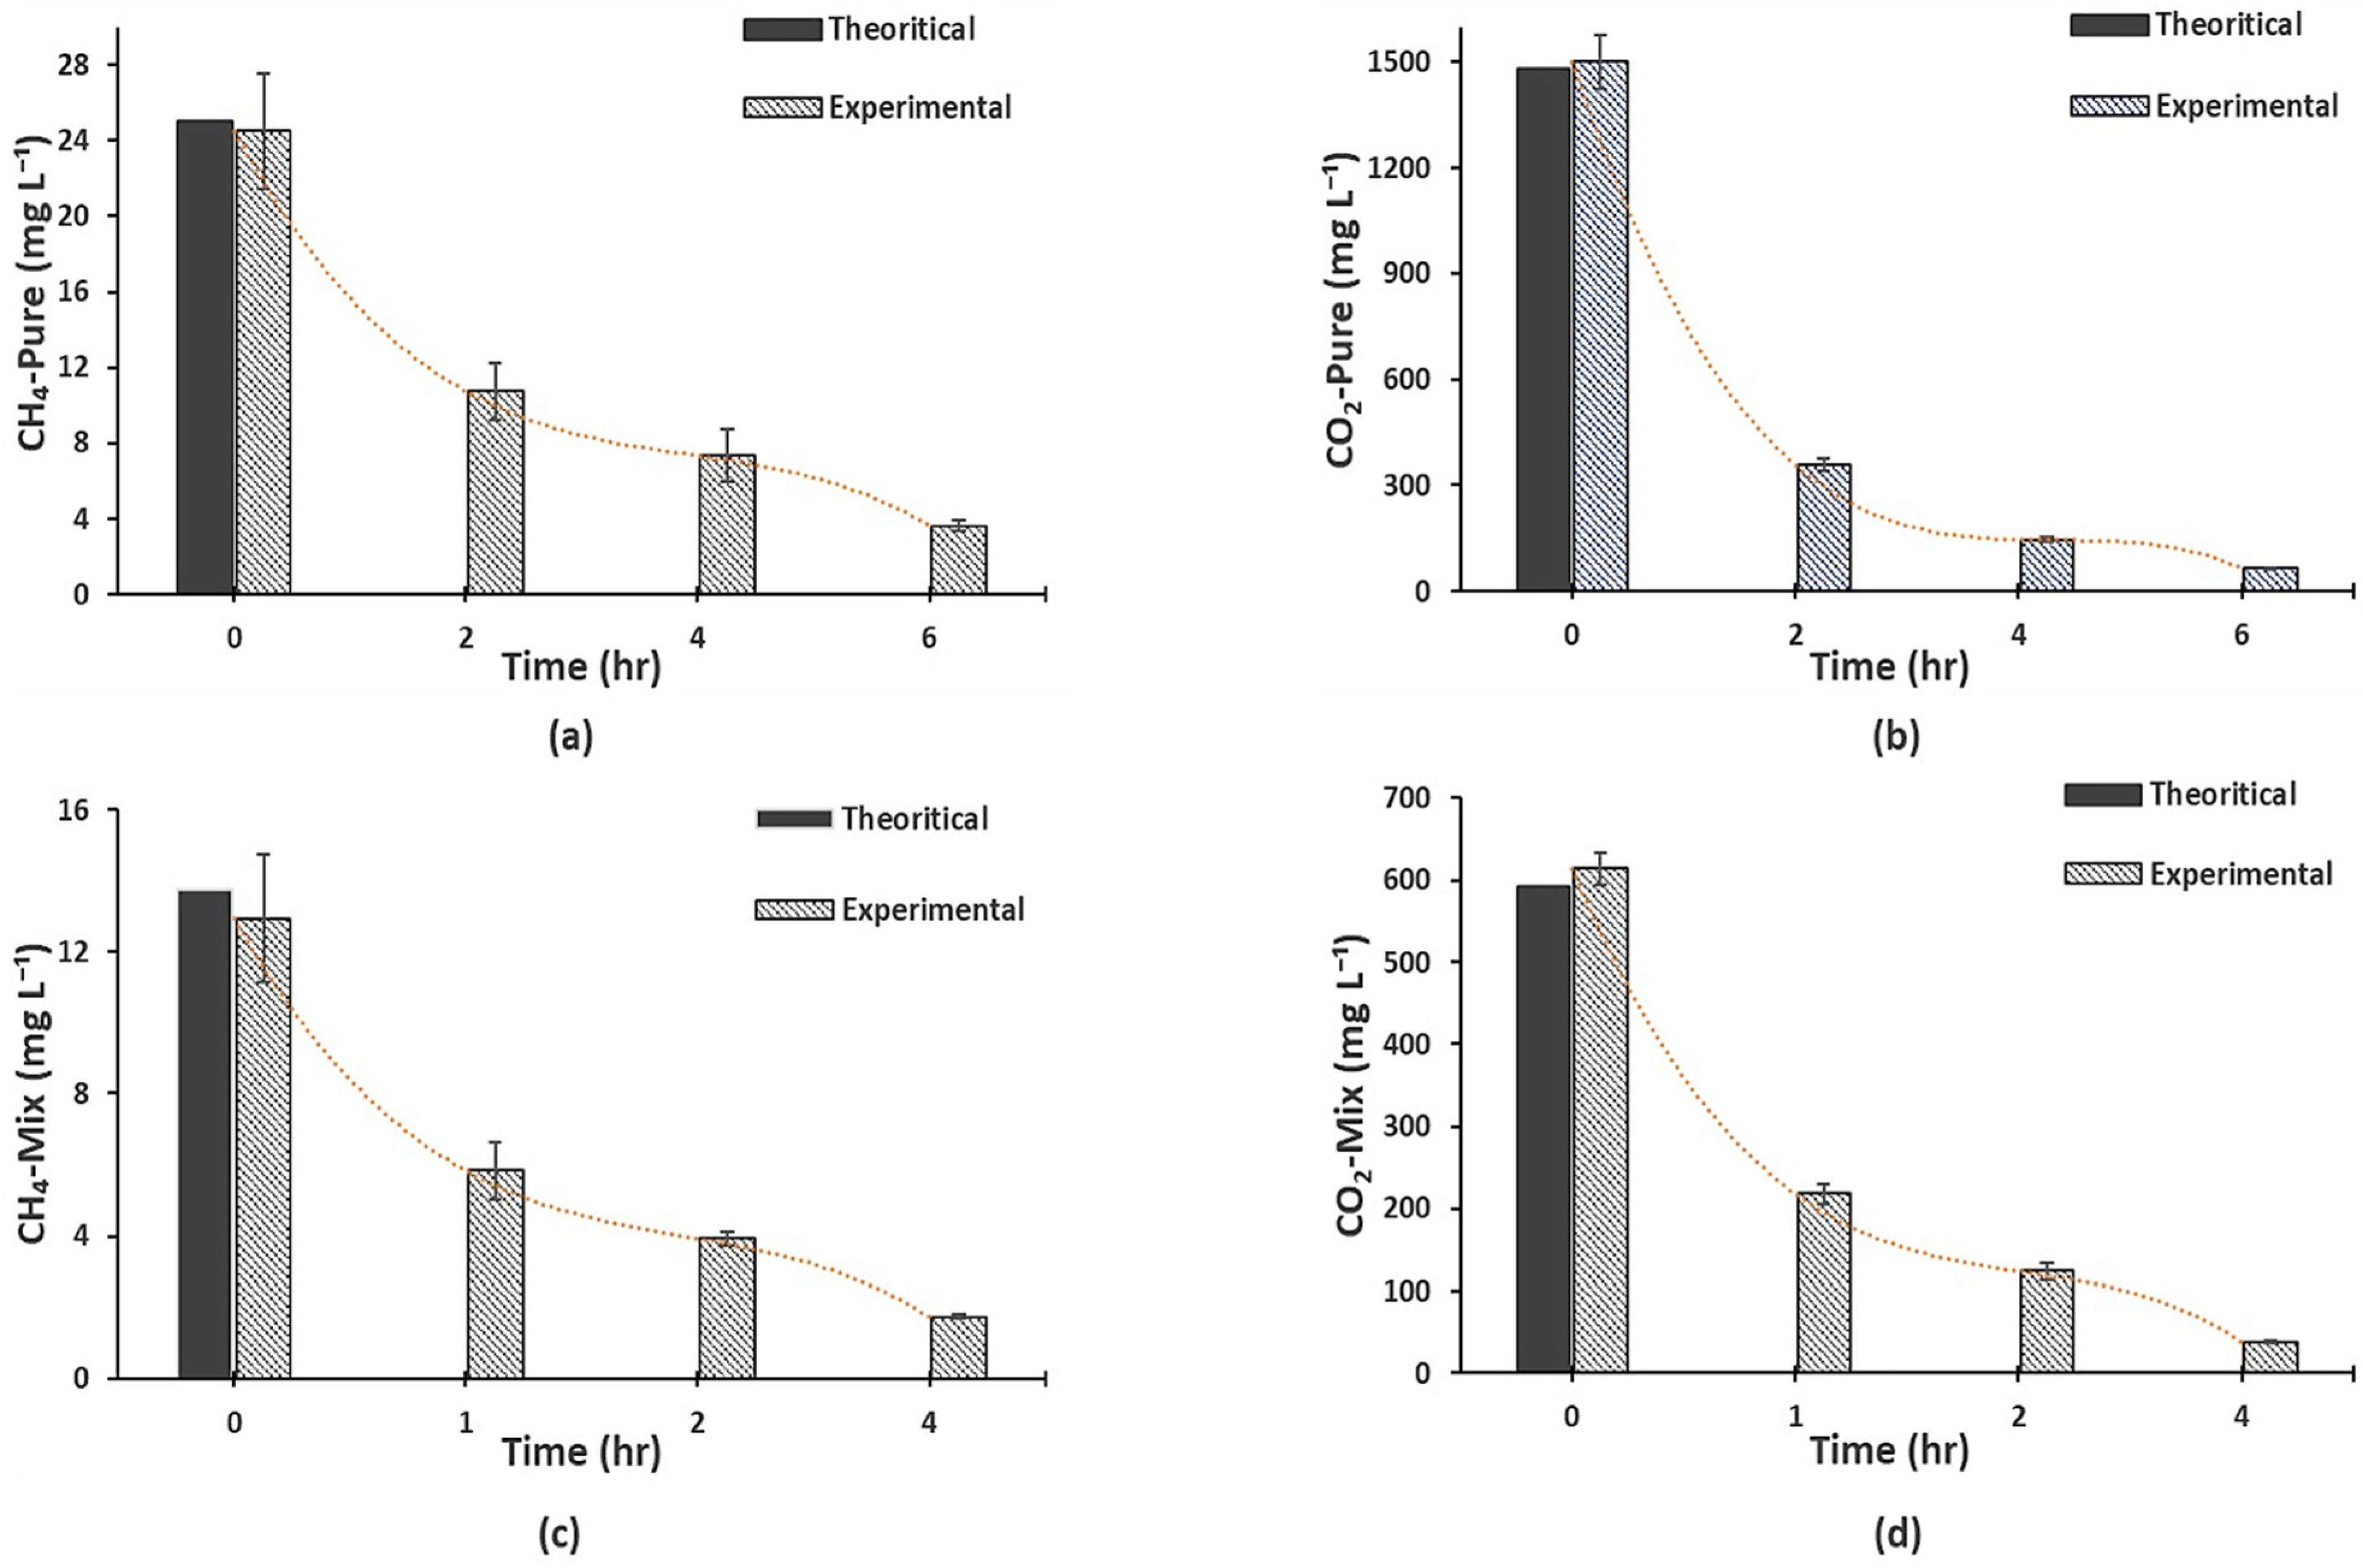
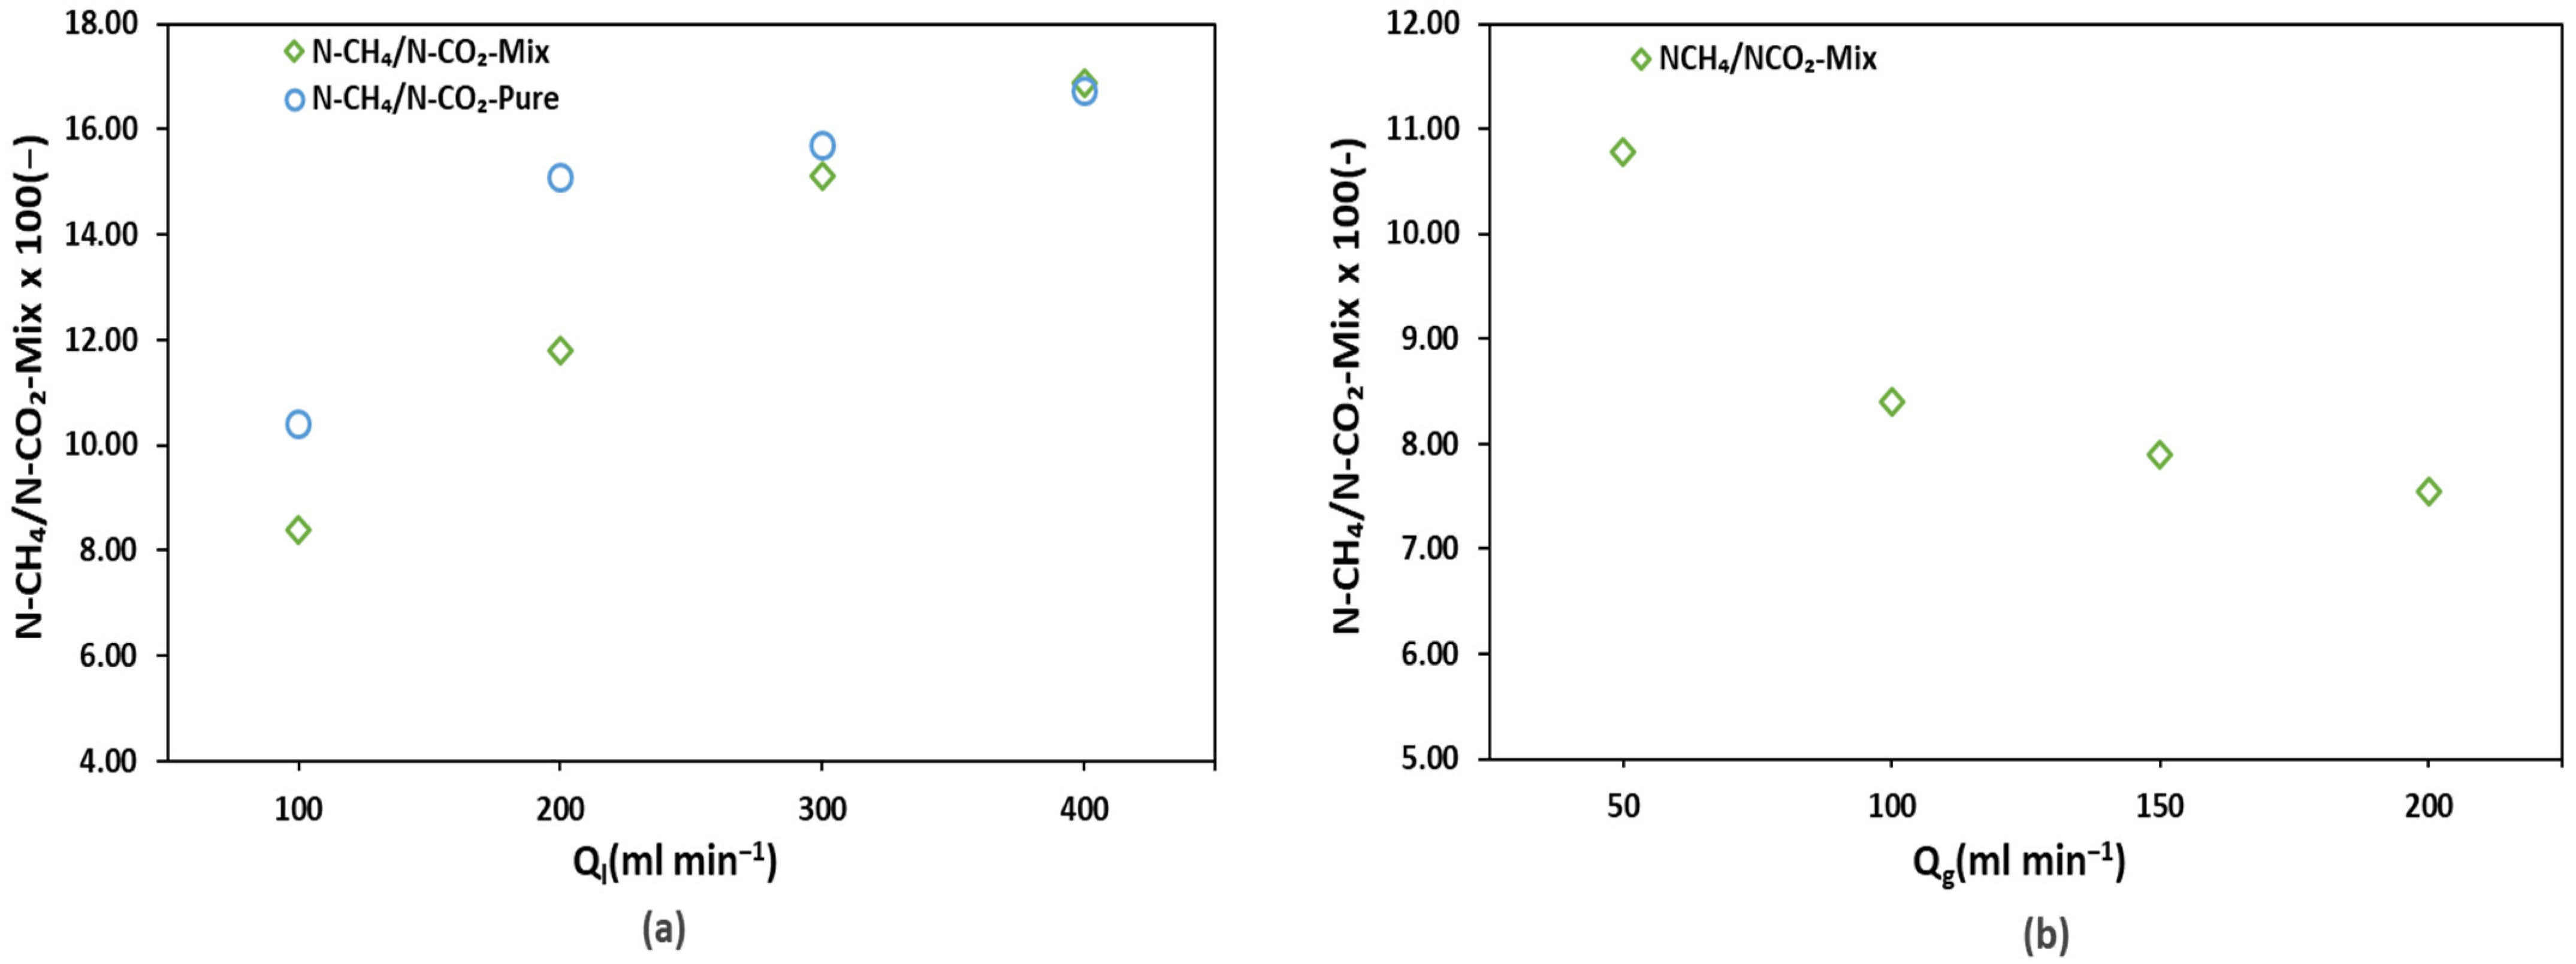
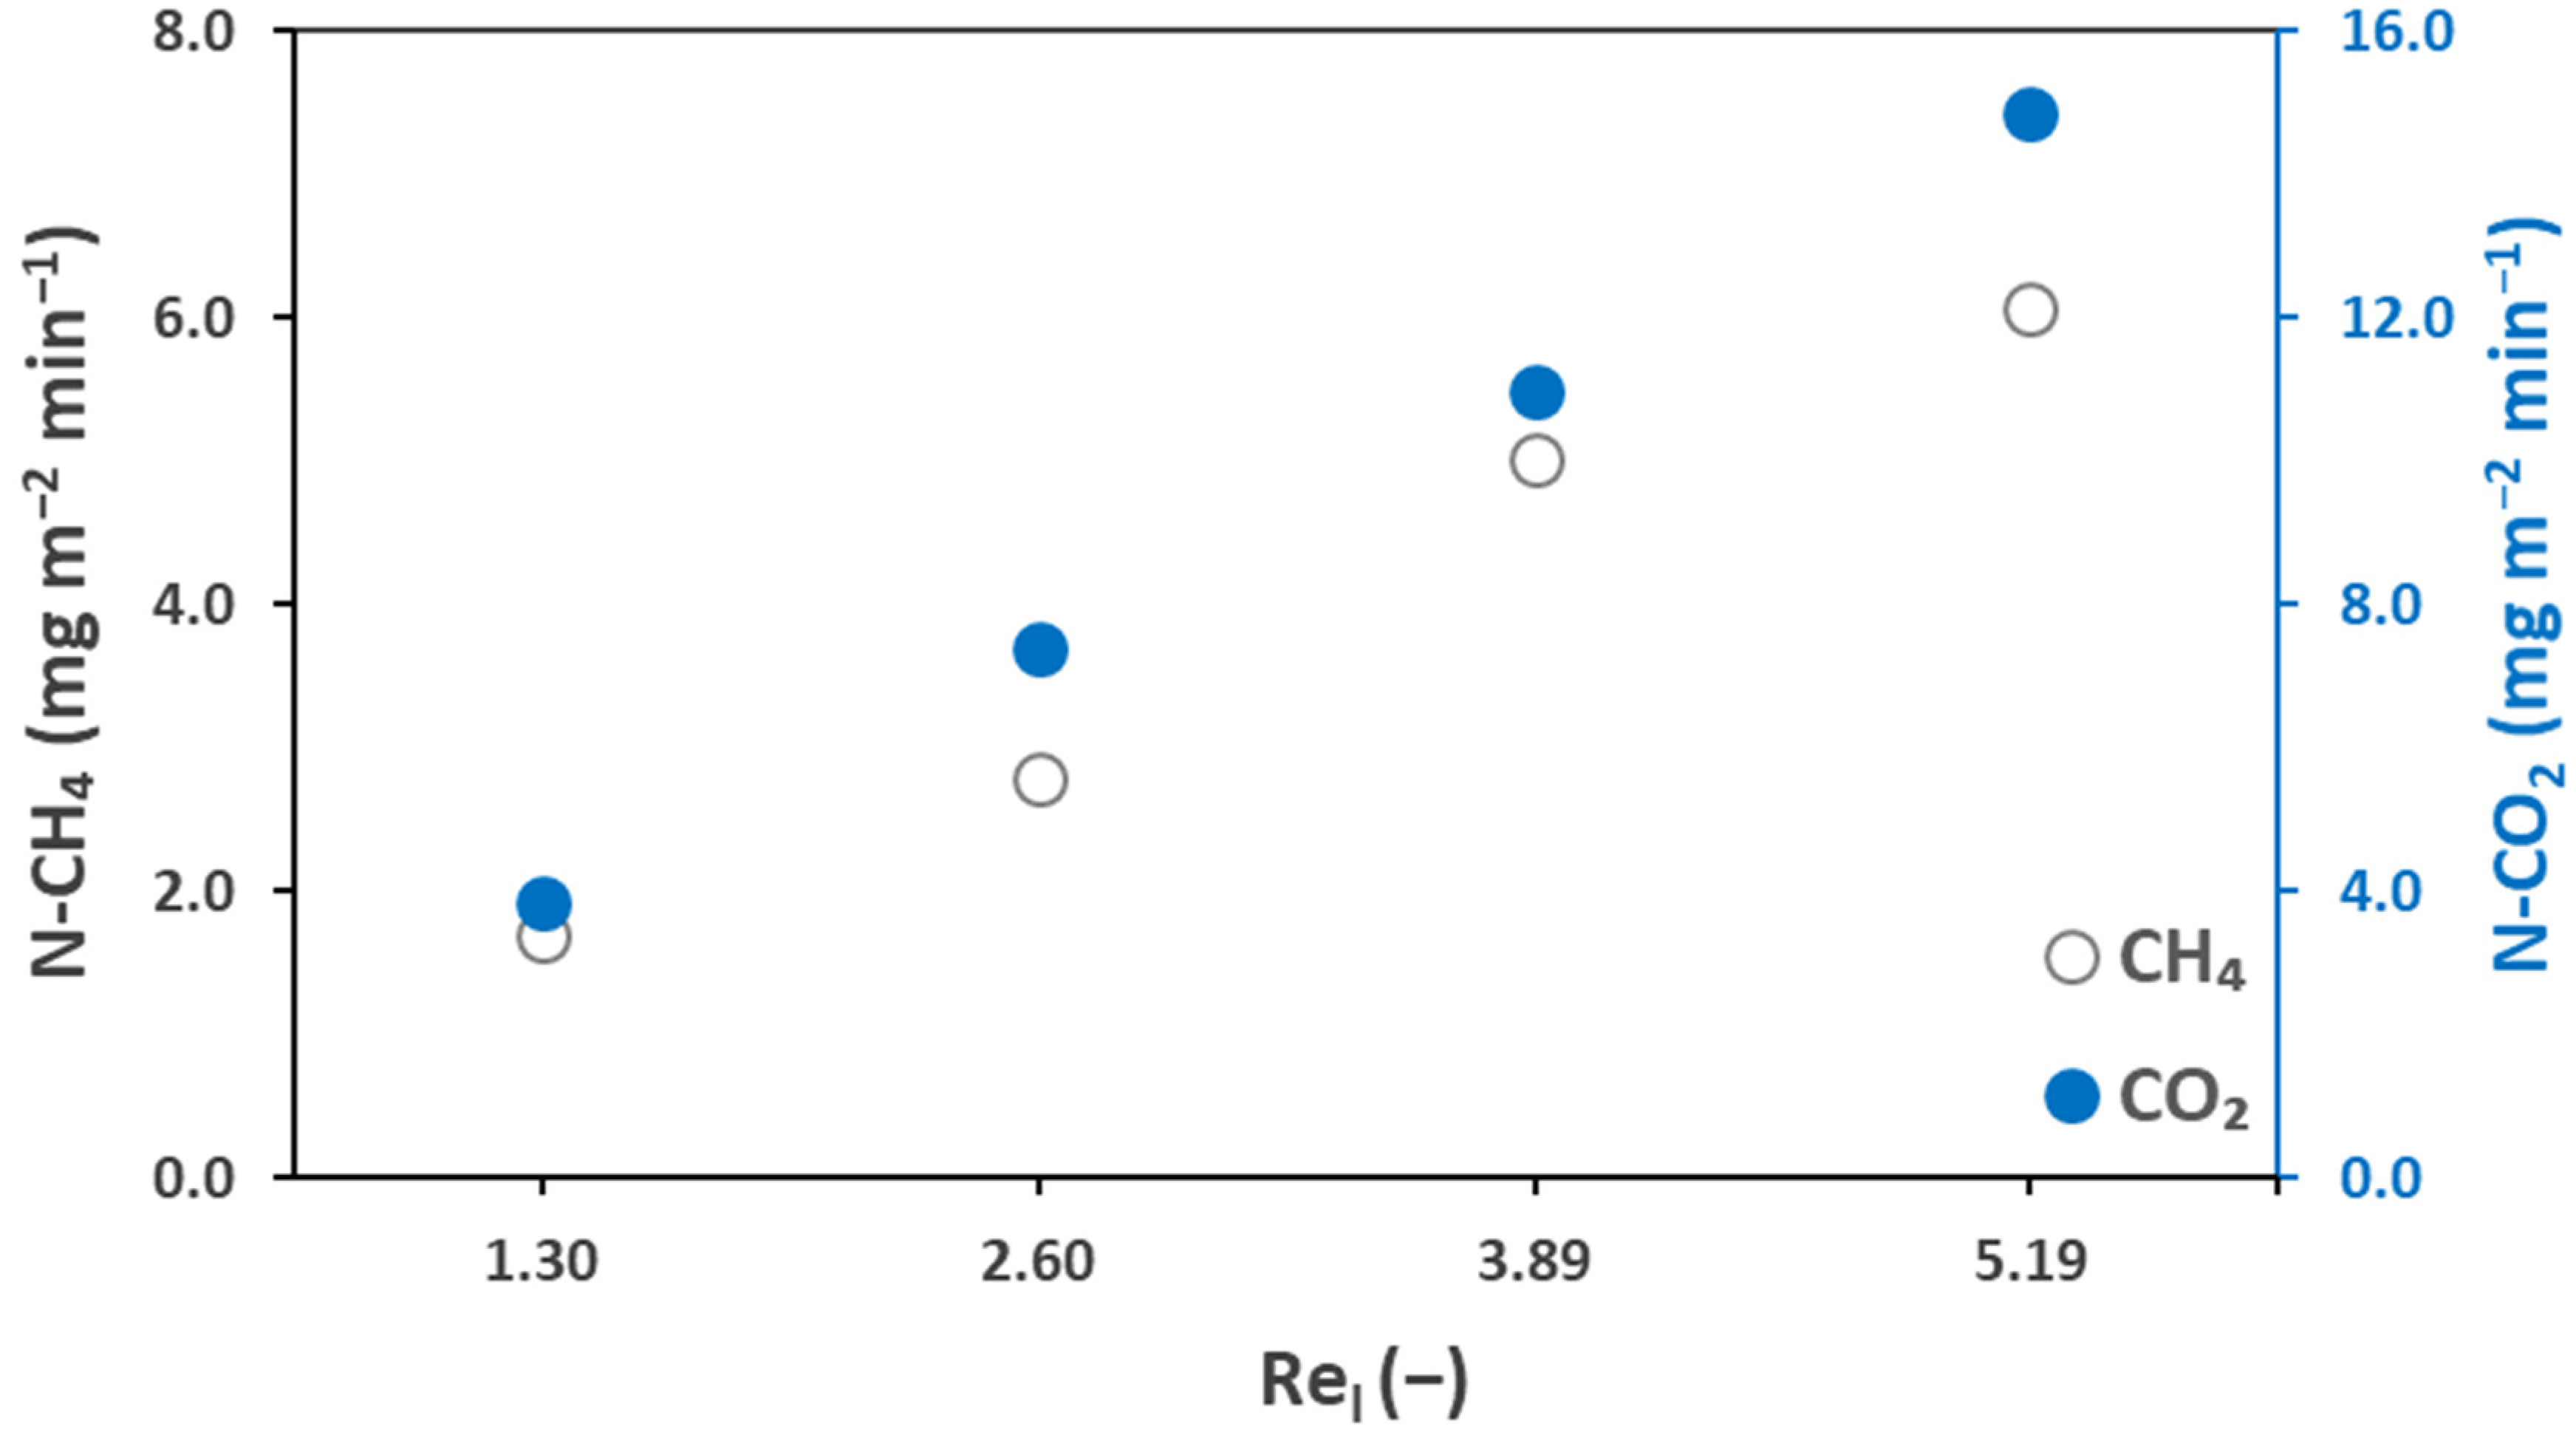
3.3. Analysis of Biogas Flux

The transmembrane permeate flux was calculated based on the gas side concentrations (Equation (9)) of the membrane contactor degassing operations measured and presented in Figure 5 and Table 4. The gas stream leaving the module exit consisted of biogas (CH4 + CO2), sweep gas (N2), and water vapor. The presence of water vapor only slightly impacted the biogas flux. The biogas flux values presented in this section represent the actual flux values, which is the wet flux (considering water flux). The percent difference between the wet flux (immediate exit of the membrane contactor) and the dry flux (at the gas analyzer inlet) ranged from 2.6–3.1% based on the percentage of relative humidity (RH). Figure 6 presents the variations of the transmembrane flux for the mix (a) and pure (b) gas effluents with the degassing operation time. Initially, the flux was high for both CH4 and CO2, which dropped to a lower value in the first 2–3 h of the membrane degassing operation. This confirms that initially, the flux was very high and the recovery was very fast, which dropped with the operation time and became slower during the later hours. Initially, the mix CH4 flux was 1.7 mg m−2 min−1 while for pure CH4, it was 3.8 mg m−2 min−1. For mix CO2, an initial flux of 55.7 mg m−2 min−1 was observed while for pure CO2, it was 99.6 mg m−2 min−1. This is again related to the decrease of the transmembrane driving force versus time.
Table 4 presents the effect of the gas and liquid flow rates on the CH4 transmembrane flux. It can be observed that at higher liquid flow rates, the flux was high, which again confirms that even if the membrane degassing efficiency decreases (Figure 4), the overall performance is enhanced with an increase in the liquid flow rate. For example, for pure CH4, the reported flux at 100 mL min−1 (Rel = 1.30) was 3.8 mg m−2 min−1, which increased to 11.1 mg m−2 min−1 at 400 mL min−1 (Rel = 5.19). Similar effects were confirmed by Cookney et al., 2016 [49] and Wongchitphimon et al., 2017 [50]. The gas flow rate was also observed to influence the biogas flux. For mix CH4, the reported flux at 50 mL min−1 (Reg = 0.04) was 1.5 mg m−2 min−1, which increased to 1.9 mg m−2 min−1 at 200 mL min−1 (Reg = 0.15).
Table 5 presents a comparison of the CH4 flux between the current study and studies from the literature. This work recorded a CH4 flux of 11.1 mg m−2 min−1 at a liquid flow rate of 400 mL min−1 (Rel = 5.19) and gas flow rate of 100 mL min−1 (Reg = 0.07). Sanchis-Perucho et al., 2020 [36] comparatively reported a very low flux of 2.4 mg m−2 min−1 while maintaining high liquid flowrate of 833 mL min−1. The low flux seems to be related to the high mass transfer resistance when using a PDMS dense membrane instead of a porous membrane. Sethunga et al., 2019 [32] reported a flux of 9.63 mg m−2 min−1, applying a very high liquid velocity compared to our work. However, this author reported a high flux value (18.3 mg m−2 min−1) using a modified PVDF membrane in similar operating conditions.
To observe the selective transport of CH4 over CO2 and to analyze whether the transport of both gases could be affected in the case of mix gas effluents (in comparison with pure gas effluents), the ratios of CH4 flux to CO2 flux were plotted (Figure 6) against various liquid (a) and gas (b) flowrates. The figures below explain whether the presence of CH4 and CO2 as soluble gases in the effluent influences their simultaneous transport in the membrane desorption setup. It is evident from Figure 6a that the CH4 to CO2 flux ratios for pure and mix gas effluents are not similar, thus selective transport is affected by the presence of other gas. the CH4 to CO2 flux ratio is higher for pure gas than for mix gas.
Mix gas transport favored the transport of CO2 over CH4 compared to pure gas transport. On the one hand, we can observe that an increase in the liquid flow rate favored CH4 flux over CO2, as increasing the liquid flow rate resulted in an increase in the CH4 to CO2 flux ratio. On the contrary, an increase in the gas flow rate decreased the CH4 to CO2 flux ratio, thus favoring CO2 flux. An increase in both the liquid and gas flow rates decreased the transmembrane resistance (on liquid and gas side). The reason for the liquid flow rate favoring CH4 transport might be because CH4 can be easily degassed from water compared to CO2. This can also be justified by the nearly two times higher experimental mass transfer coefficients of CH4 than CO2 recorded for this work. The reason for the gas flowrate favoring CO2 transport can be justified by the high driving force created at higher gas flow rates. The synthetic mixtures consisted of a large quantity of dissolved CO2. Thus, the degassed mixture had a large ratio of CO2, and a high gas flow rate was needed to create an enhanced driving force for the dissolubility of water-soluble CO2. The effect of the gas and liquid flow rates on the selectivity of the biogas components and the selective transport of CO2 and CH4 will be further discussed in terms of the mass transfer coefficients and transmembrane mass transport resistance in the following section.

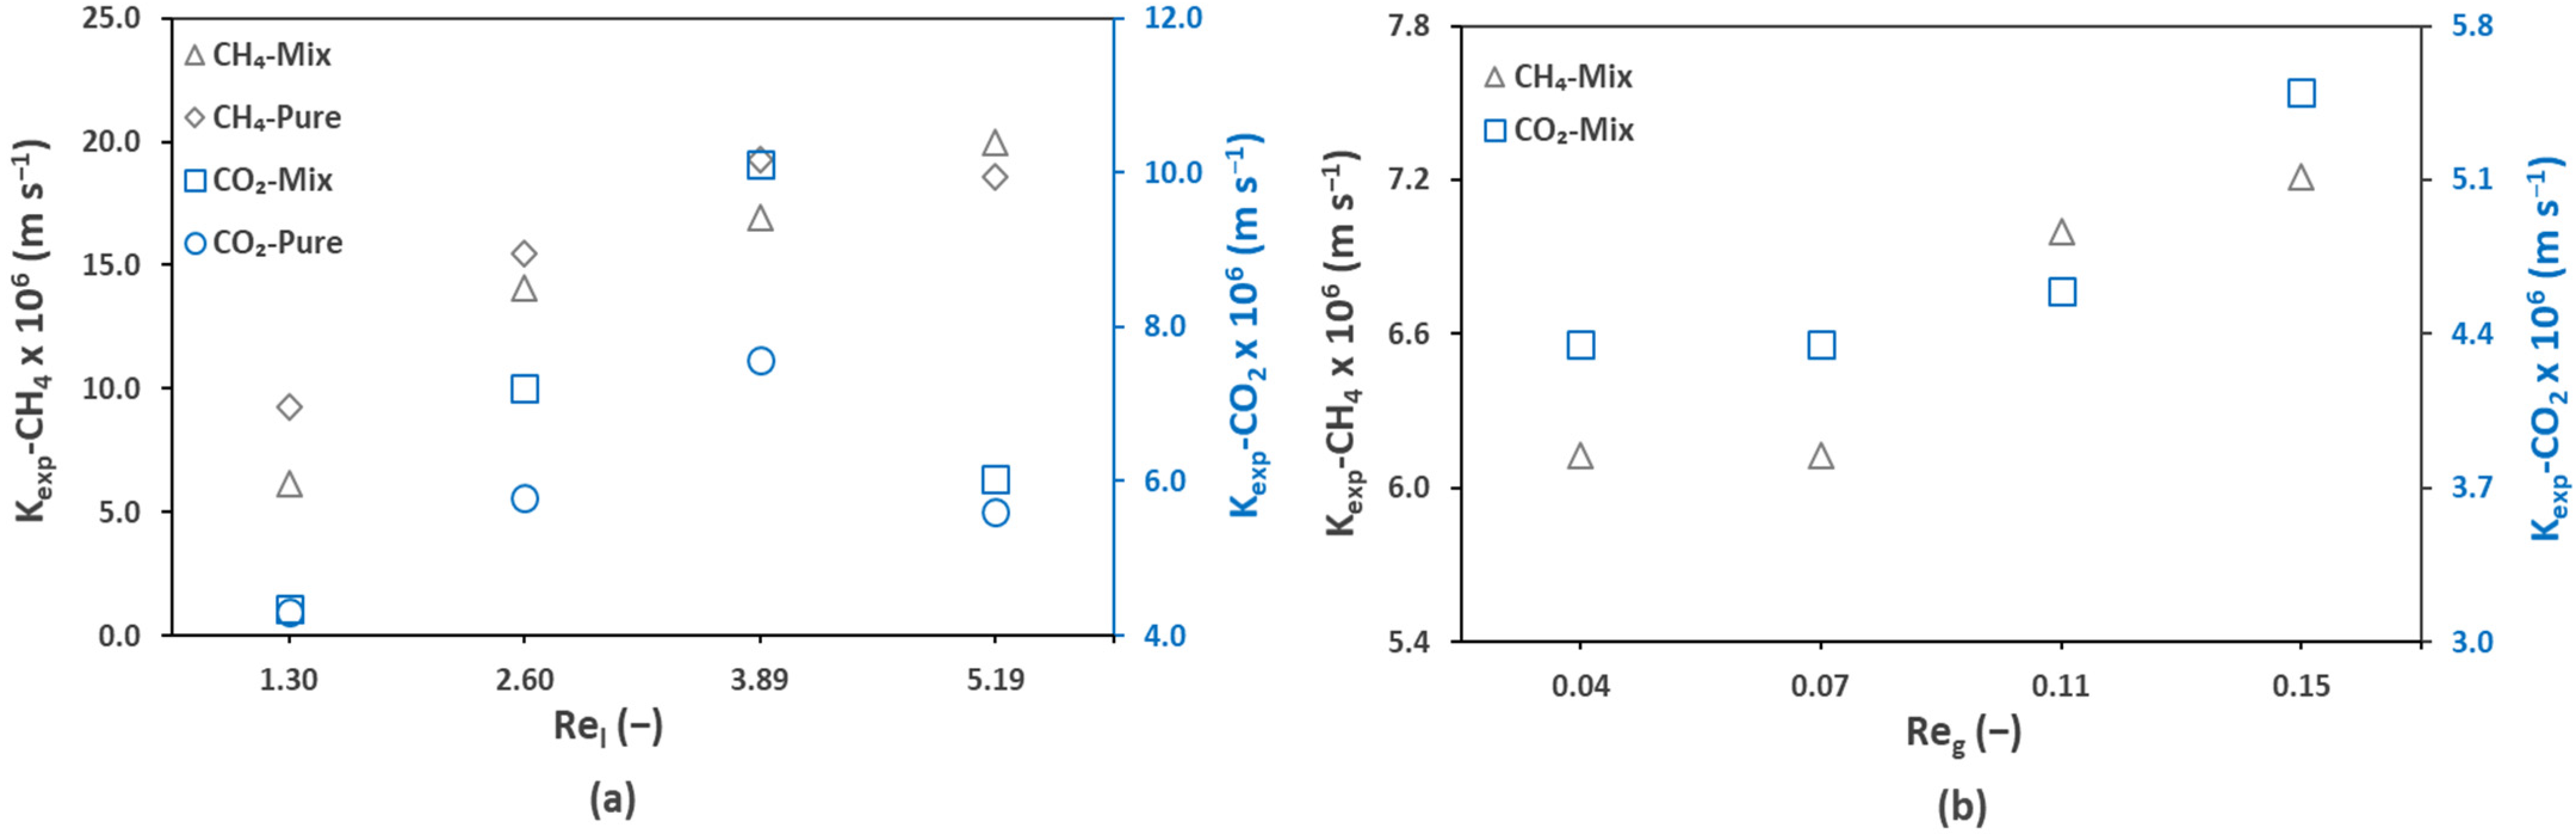
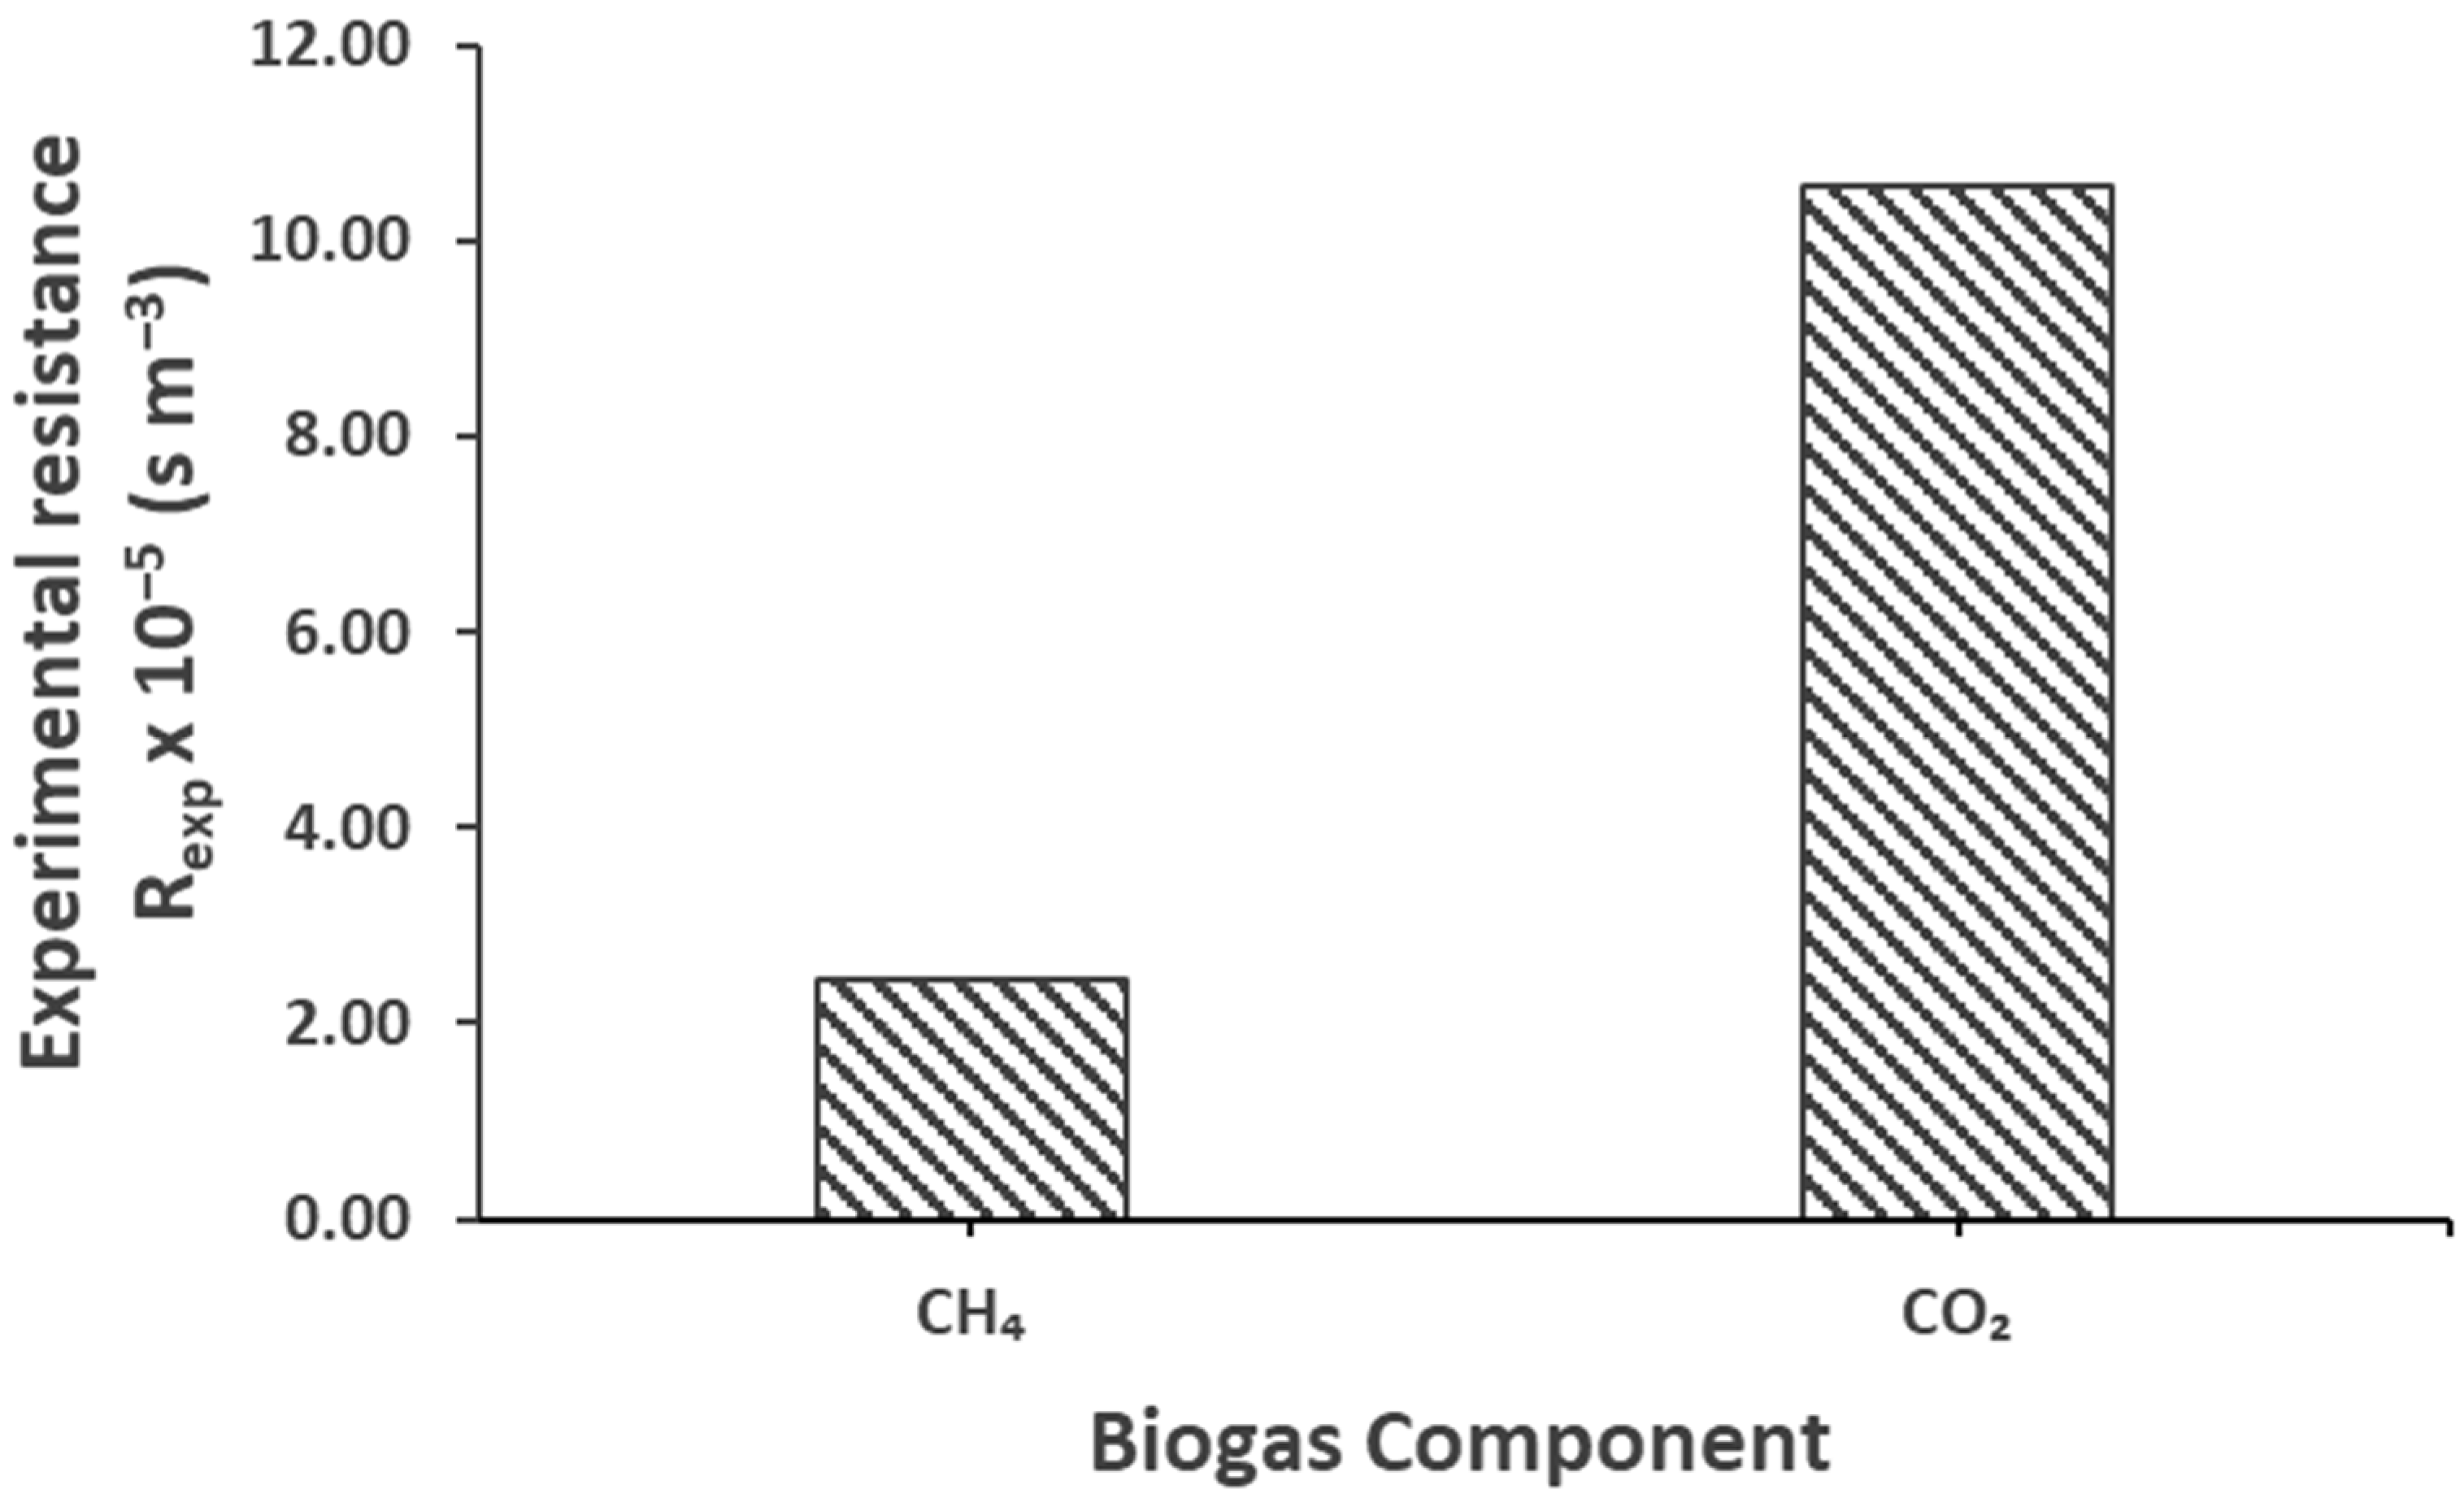
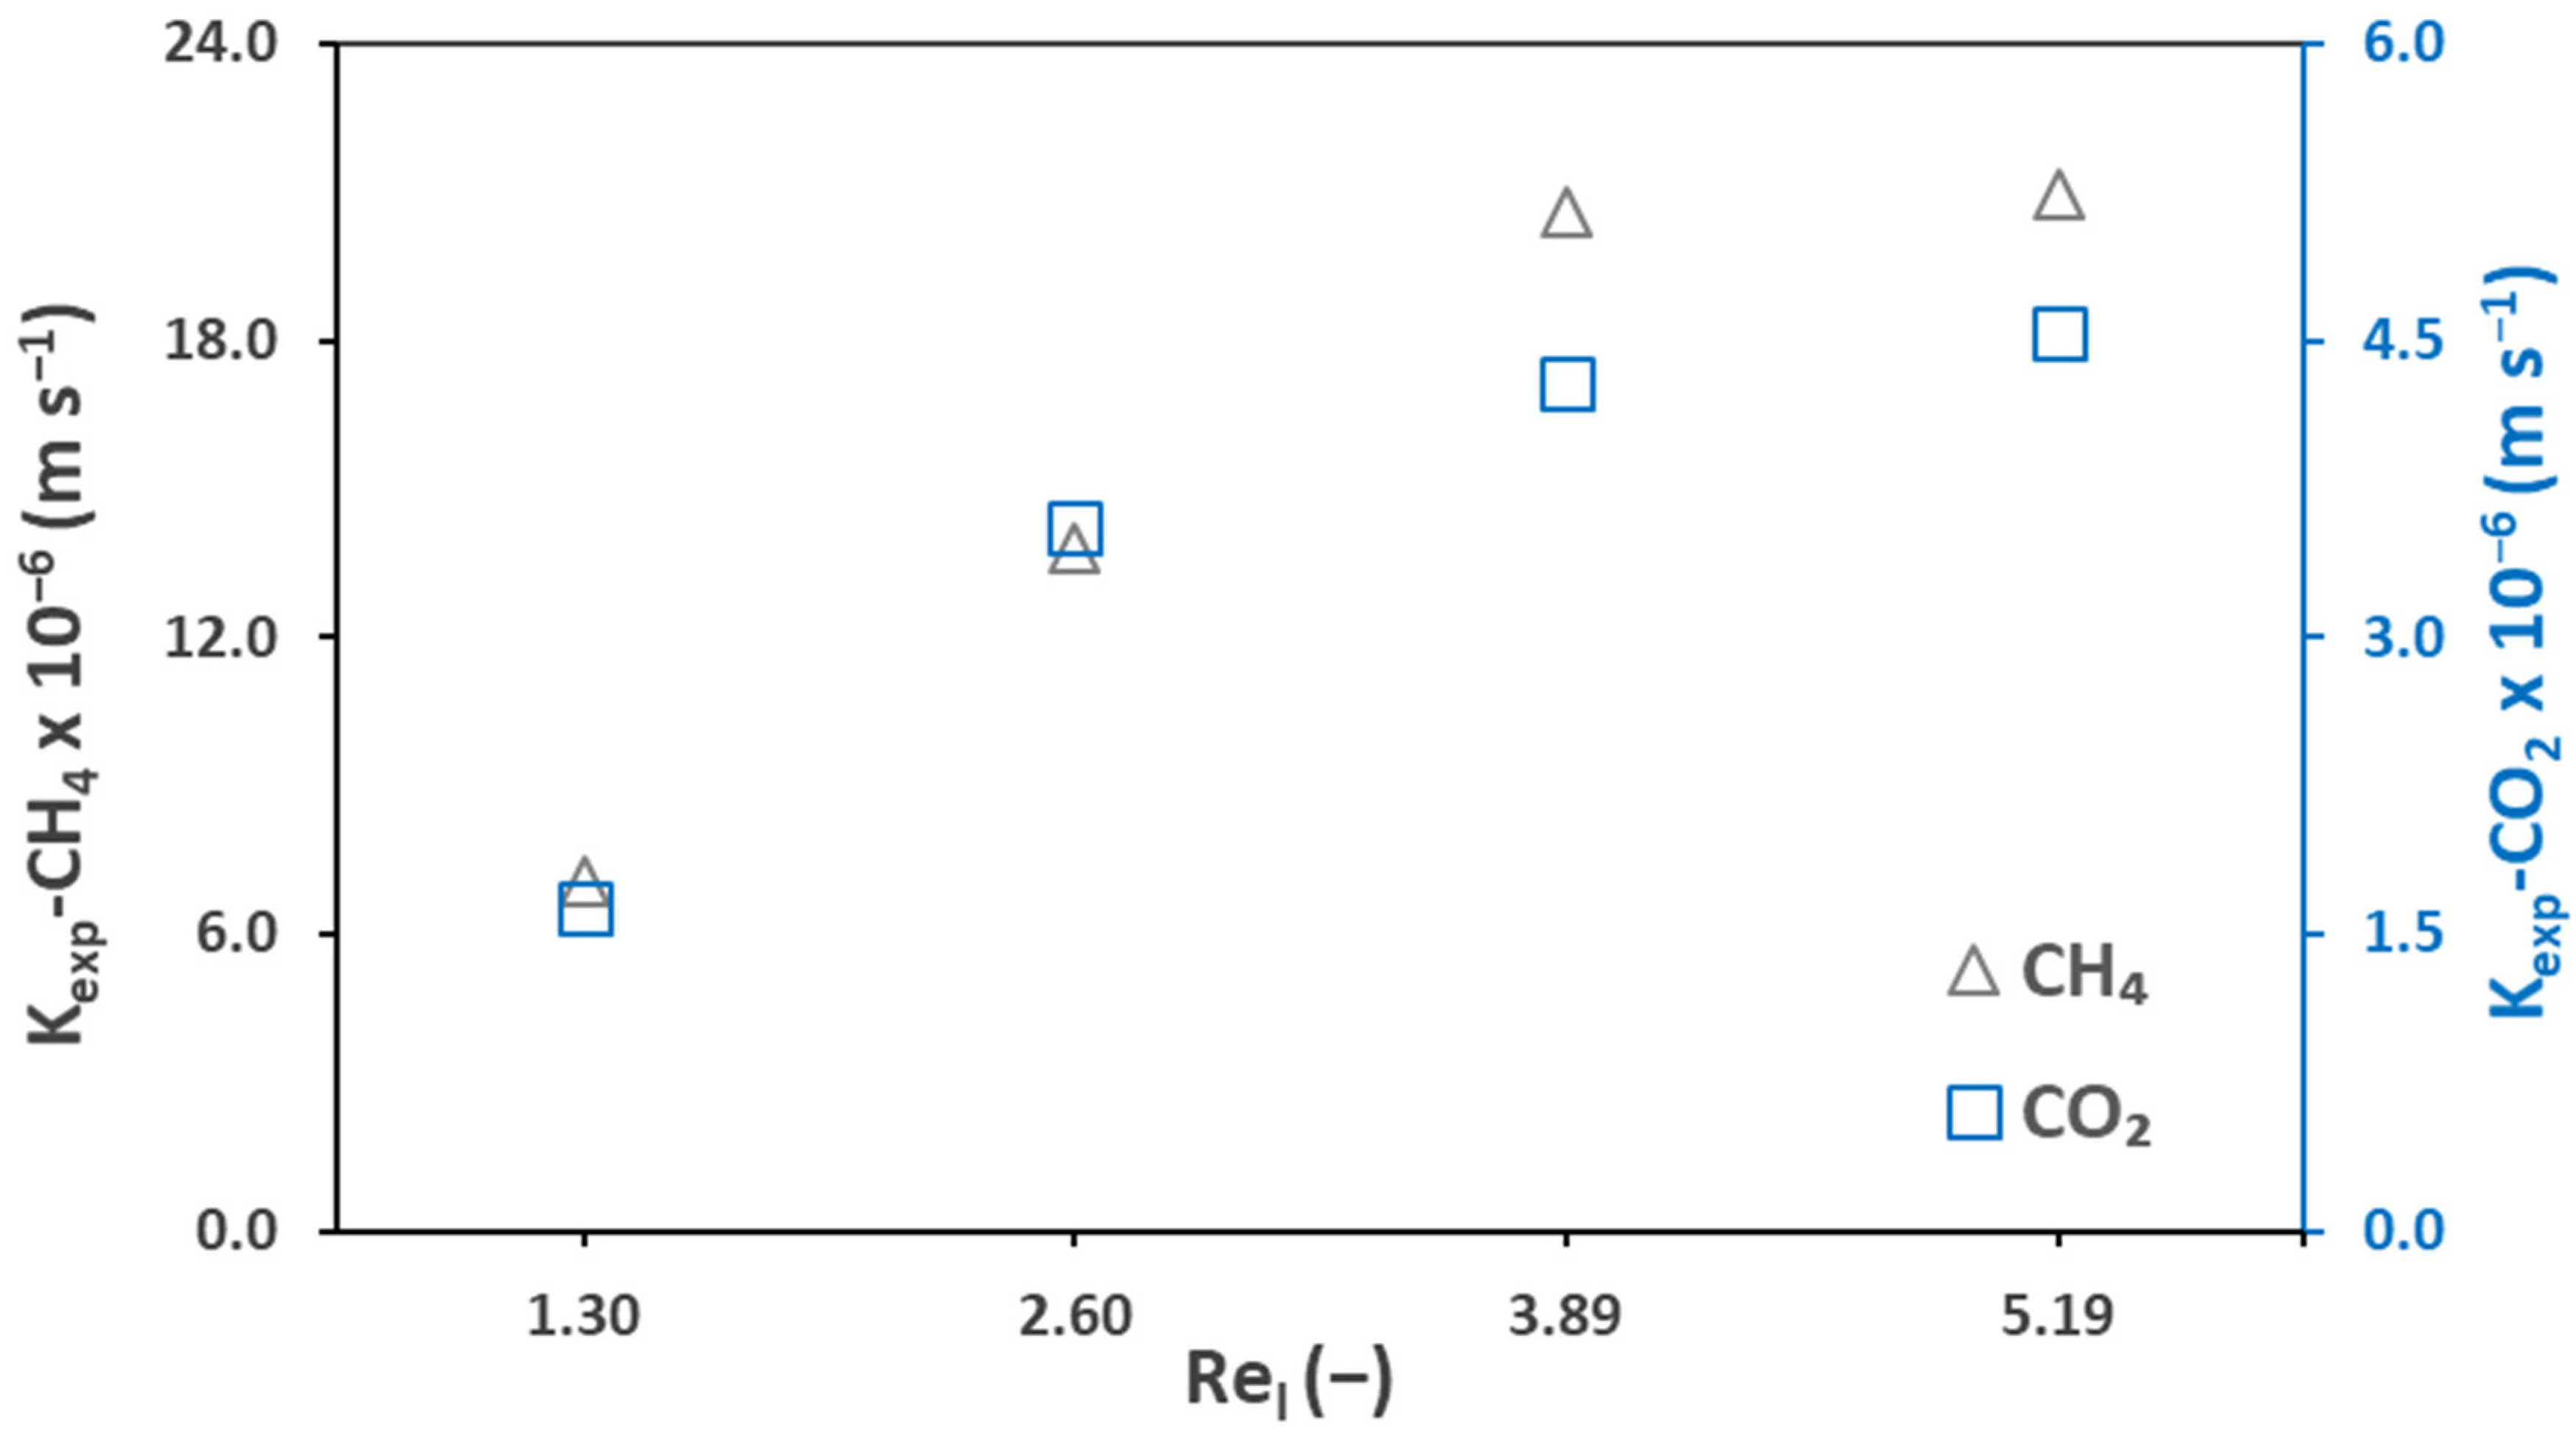
3.4. Experimental and Theoretical Mass Transfer Analysis: Pseudo-Wetting Prediction

The overall experimental mass transfer coefficients (Equations (9)–(11)) of mix and pure effluents during the membrane degassing process were calculated and are presented here in Figure 7. In general, the CH4 mass transfer coefficients were higher than that of CO2. For example, at a Reynold number of 1.30 (Ql = 100 mL min−1), a value of 9.26 × 10⁻⁶ m s−1 was recorded for pure CH4 while for pure CO2, the value was 4.30 × 10⁻⁶ m s−1. In similar conditions, for mix CH4, Kexp of 6.13 × 10⁻⁶ m s−1 was recorded while for mix CO2, it was 4.35 × 10⁻⁶ m s−1. It can be observed from the above-mentioned values of Kexp, for both pure and mix gas effluents, that Kexp of pure CH4 is nearly 1.5 times higher than that of mix CH4 while for CO2, it is nearly similar. As expected, the effect of the liquid and gas flow rates was dominant as can be seen from the figure. Both the liquid and gas flow rates favored the experimental mass transfer coefficient, except for CO2 at a liquid flow rate of 400 mL min−1 (Rel = 5.19).
Table 6 presents a comparative analysis of the experimental mass transfer coefficient of CH4 from this work and the work from various other authors in various conditions. The porous membranes presented in this table had the same pore size of 0.04 µm, except for Sethunga et al., 2019 [32] (no pore size mentioned). This work recorded a coefficient of 1.93 × 10⁻⁵ m s−1 for CH4 against a liquid flow rate of 300 mL min−1 (Vl = 0.017 m s−1, Rel = 3.89) and gas flow rate of 100 mL min−1 (Vg = 0.0020 m s−1/Reg=0.07). Jiménez-Robles et al., 2021 [37] (very low membrane area and gas velocity compared to this work), Cookney et al., 2016 [49] (lower liquid velocity compared to this work), McLeod et al., 2016 [51] (very high gas/liquid hydrodynamics), and Sethunga et al., 2019 [32] (very low membrane area compared to this work) reported lower experimental mass transfer coefficients when using sweep gas in PP membranes (such as for this work). Sanchis-Perucho et al., 2020 [36], reported a very low experimental mass transfer coefficient (0.38 × 10⁻⁵ m s−1) in comparison to our work, but they used a PDMS dense membrane (which induces a high membrane mass transfer resistance) with vacuum degassing. Henares et al., 2018 [43], recorded a value (1.94 × 10⁻⁵ m s−1) similar to our work using combined sweep gas and vacuum in a PP membrane at a relatively low liquid (0.013 m s−1) and high gas (0.0220 m s−1) velocity. Sethunga et al., 2019 [32], using sweep gas in a modified PVDF membrane, reported an experimental mass transfer coefficient of 2.50 × 10⁻⁵ m s−1, which is relatively high.
The overall theoretical mass transfer coefficient Kov was also calculated (Equation (13)) using the local gas-side mass transfer coefficient (Equation (15)), local liquid-side mass transfer coefficient (Equation (16)), and mass transfer coefficient through the membrane (Equation (17)). It was confirmed (Table 7) that the main resistance to the mass transfer lies on the liquid side of the membrane, in case of the absence of pore wetting.
The overall theoretical mass transfer coefficient was compared with the overall experimental mass transfer coefficient Kexp (Table 7), which showed significant differences. For example, the overall theoretical mass transfer coefficient of CH4 was 1.49 × 10⁻⁵ m s−1, while the experimental one was 9.26 × 10⁻⁶ m s−1. In order to explain these differences, the hypothesis of a partial wetting of the membrane pores was supposed. The overall theoretical mass transfer coefficient was thus considered to be the ideal one (with no wetting) while the overall experimental mass transfer coefficient was the effective one (with pseudo-wetting). The effective membrane diffusivity (Dm,eff) and wetted membrane mass transfer coefficient (Km,w) was then estimated by back substitution (Equations (18, 19) using the actual experimental mass transfer coefficient (Kexp) and the results are presented in Table 7.
In Table 7, when the gas to liquid ratio is 1, the CH4 effective membrane diffusivity (4.75 × 10⁻¹⁰ m2 s−1) is nearly three times lower than that of the ideal membrane diffusivity (1.33 × 10⁻⁷ m2 s−1). For CO2, the effective membrane diffusivity (2.79 × 10⁻⁹ m2 s−1) was recorded as nearly two times lower than the ideal one (2.20 × 10⁻⁷ m2 s−1). The significant difference between the ideal and effective membrane diffusivity provides a clue about the possible pseudo-wetting of the membrane pores. Similarly, the pseudo-wetted membrane mass transfer coefficient (7.15 × 10⁻⁷ m s−1) of CH4 was nearly three times lower that of the non-wetted membrane mass transfer coefficient (2.08 × 10⁻⁴ m s−1). For CO2, the pseudo-wetted membrane mass transfer coefficient (4.36 × 10⁻⁶ m s−1) was nearly two times lower that of the non-wetted membrane mass transfer coefficient (3.44 × 10⁻⁴ m s−1).
Membrane wetting can significantly increase the mass transfer resistance inside the membrane, causing a significant drop in the mass transfer coefficient [52,53,54]. The overall and experimental resistance was calculated using Equations (13) and (14), respectively, and are presented in Table 7. In light of the above-mentioned explanation of the existence of possible pseudo-wetting, Figure 8 presents the overall theoretical and experimental mass transfer resistance (s m−3) of the biogas during the degassing in the membrane contactor. It is obvious that the theoretical resistance was far lower than the experimental one. A comparison between the theoretical and experimental resistance clarifies that the actual and real resistance to the mass transfer was very high compared to the one measured theoretically, considering the no-wetting conditions. Yet again, here, we can justify the existence of pseudo-wetting. Additionally, we can observe that there is greater resistance to the mass transport of CO2 than CH4. Considering the ideal theoretical conditions, the difference between the resistance to CH4 and CO2 was small; however, a significant difference between the experimental resistance of CH4 and CO2 can be observed. This also explains the preference of CH4 over CO2 in the selective transmembrane transport. Furthermore, this effect could be observed for real AnMBR permeate in the following section.

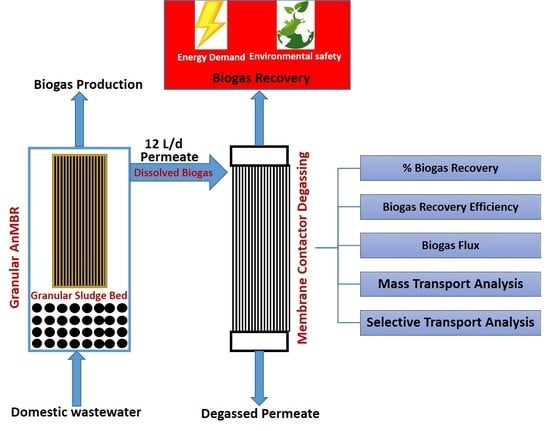
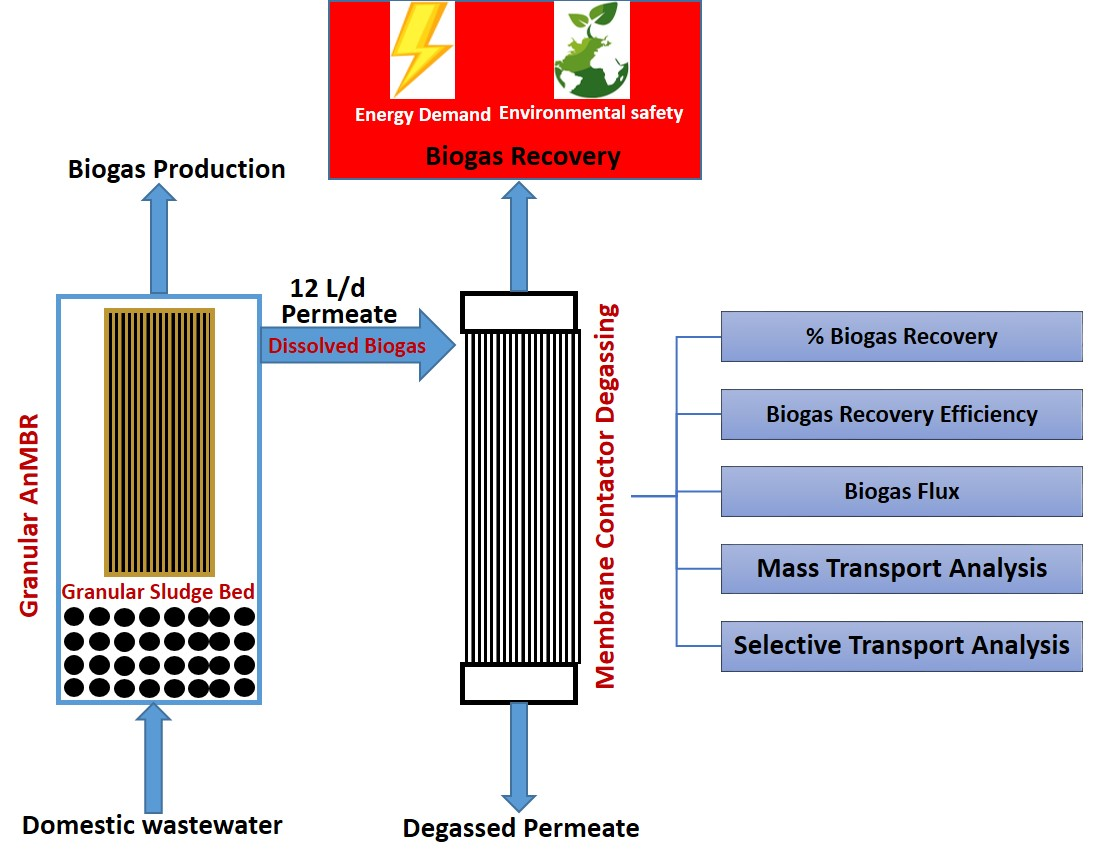
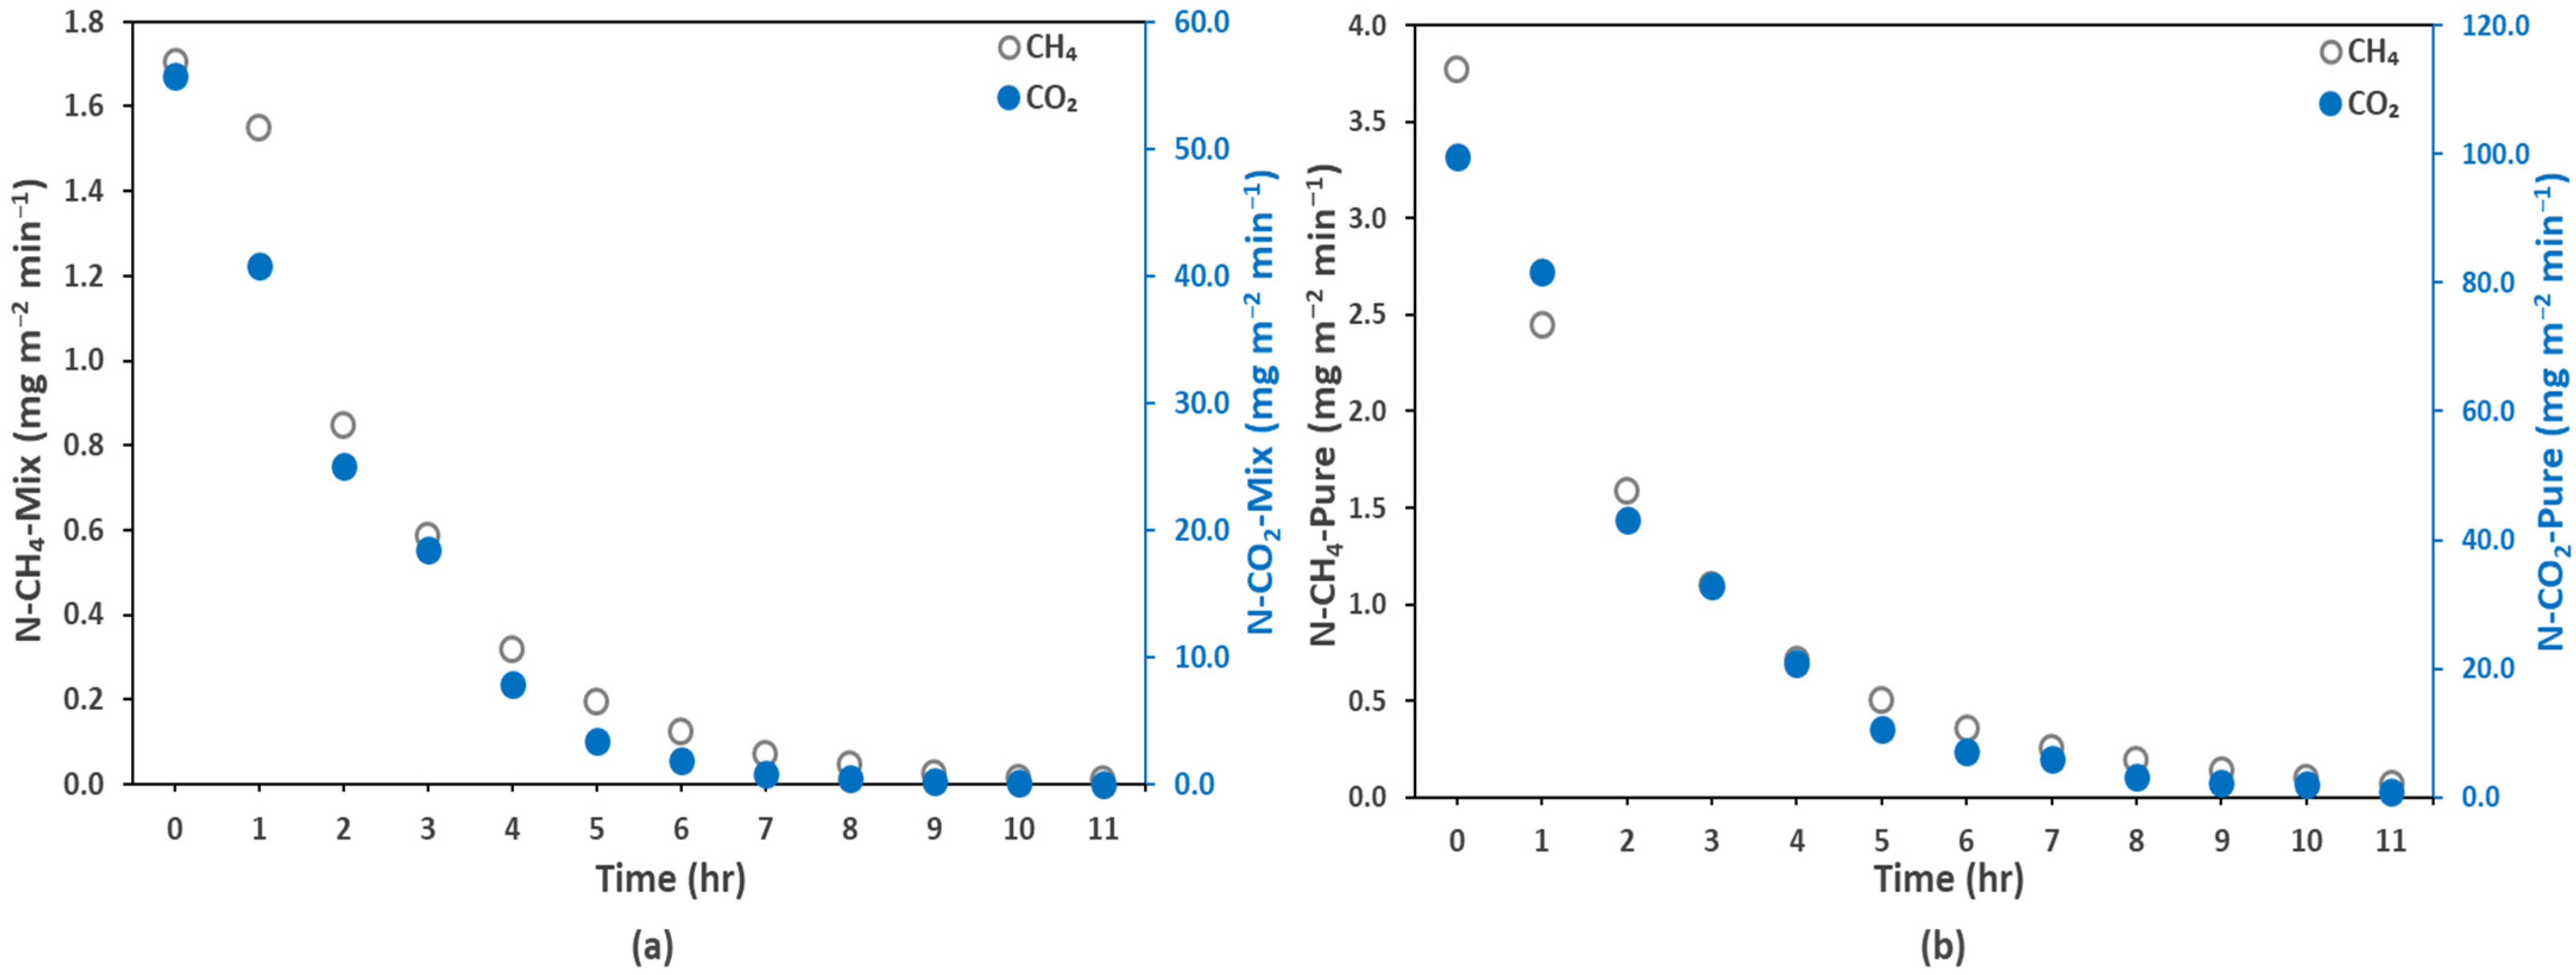
3.5. Real AnMBR Permeate Dissolved Biogas Degassing

This section presents the analysis and observations from using real AnMBR permeates in the membrane contactor degassing setup for biogas recovery. The AnMBR permeate initially consisted of 10–12 mg L−1 of dissolved CH4 and 40–60 mg L−1 of dissolved CO2 (Table 2). The amount of dissolved CH4 is in agreement with the amount reported by Sanchis-Perucho et al., 2020 [36] (12.01 mg L−1) for an AnMBR proto-type plant. As shown in Figure 2, the dissolved CH4 amount in the AnMBR permeate is very close to the amount measured theoretically for water as a solvent (13.7 mg L−1), and also to the amount used for the synthetic effluents (12.9 mg L−1) that were prepared for this work. Although various authors, such as Galib et al., 2016 [55], Smith et al., 2013 [56], Wu et al., 2017 [57], and Yeo et al., 2015 [58], reported dissolved CH4 super saturation degrees of 3 (54 mg L−1), 1.5, 1.2 (24.7 mg L−1), and 2.5 (35 mg L−1), respectively, for AnMBR permeate, it can be observed that the permeate from the AnMBR of this study seems to not be supersaturated. The absence of supersaturation could be justified by the amount of dissolved CH4 of the permeate used in this study (12 mg L−1), which is very close to the theoretical saturation value (13.7 mg L−1). The permeate at the exit of the anaerobic membrane recorded average values of 2.26 and 18.13 mg L−1 for TOC and COD, respectively. The TS and VS contents of the permeate were as low as 1.7 and 1.3 mg L−1, respectively. The particulate size in the permeate was lower than 0.04 μm (Microdyn Nadir® ultrafiltration membrane pore size).
The degassing of the real effluent was performed at 25 °C, which is the original effluent temperature of the AnMBR. Figure 9 presents the membrane degassing efficiency for the biogas (CH4 and CO2). At a liquid flow rate of 100 mL min−1, (Rel = 1.30), the dissolved methane content of the effluent at the membrane contactor outlet was as low as 0.98 mg L−1 while the degassing efficiency was very high (91%). The efficiency recorded for the synthetic mixed effluent was lower (89%) at this flow rate. A 13% efficiency drop was observed when the liquid flow rate was changed from 100 mL min−1 to 300 mL min−1 while in the case of synthetic mixed effluents, the efficiency drop was very low (5%) from the same flow rates. CO2 showed a comparatively low efficiency of 36.2% (39.3 mg L−1 of dissolved CO2 at the membrane contactor outlet) at a liquid flow rate of 100 mL min−1 while the recorded efficiency drop was 17% when the liquid flow rate was changed from 100 mL min−1 (Rel = 1.30) to 300 mL min−1 (Rel = 3.89). Referring to Section 3.2, the degassing efficiency was comparatively high for synthetic mixed effluents (62%) while the efficiency drop was nearly the same as that of the AnMBR permeate.
As mentioned earlier, the degassing process was monitored on both the gas and liquid sides. During the degassing process, the concentration of the desorbed biogas to the shell side of the membrane contactor was quantified using an X-stream gas analyzer. When the gas to liquid flow rate ratio was fixed at 1, initial CH4 and CO2 concentrations of 10.1 and 26.4 mg L−1, respectively, were recorded in the stripping gas stream.
Figure 10 presents the transmembrane flux of the biogas at different Reynold numbers. At a Reynold number of 5.19, flux values of 6.06 and 14.85 mg m−2 min−1 were recorded for CH4 and CO2, respectively. In similar conditions, the flux values recorded for the synthetic mixed effluents were 5.27 and 85.71 mg m−2 min−1 for CH4 and CO2, respectively. It is obvious from the data mentioned here that similar to the degassing efficiency, the CH4 flux was higher for the AnMBR permeate than for the synthetic mixed effluent (as discussed in Section 3.3). For CO2, the opposite effect was observed as the flux of the synthetic mixed effluent was very high compared to the flux from the AnMBR permeate. This seems to be due to the low dissolved CO2 contents of the AnMBR permeate in comparison to the synthetic effluent, which was prepared with a high CO2 content and in unfavorable conditions for CH4 degassing, which leads to a reduced driving force. The effect of the Reynold number on the transmembrane flux is very clear from the figure, as changing it from 1.29 to 5.19 increased the CH4 flux by 4.37 mg m−2 min−1. Similarly, for CO2, changing the Reynold from 1.29 to 5.19 increased the flux by 11 mg m−2 min−1, confirming the results established with the synthetic effluent.
The selective transport of CH4 over CO2 (CH4 flux/CO2 flux) in the real AnMBR permeate conditions was also analyzed. Detailed analysis of the selective transport of the synthetic effluents is presented in Section 3.3. For the real AnMBR permeate, a value of 1.20 was recorded for the selective transport of CH4 over CO2 at a gas to liquid flow rate ratio of 1. This value is very high compared to the one recorded for the mix (0.084) and pure (0.10) synthetic effluents in similar operating conditions. The higher value in real effluent conditions again corresponds to the similar amount of dissolved CH4 in both the synthetic and real effluents and the lower amount of dissolved CO2 in the real effluents.
Figure 11 represents the experimental mass transfer coefficients of the biogas against the liquid flow rate. At a liquid flow rate of 400 mL min−1 (Rel = 5.19), experimental mass transfer coefficients of 2.1 × 10⁻⁵ m s−1 and 4.5 × 10⁻⁶ m s−1 were recorded for CH4 and CO2, respectively. A similar value of the CH4 experimental mass transfer coefficient (2.0 × 10⁻⁵ m s−1) was recorded for synthetic mixed effluent (as discussed in Section 3.4) in similar conditions. The reason might be the similar dissolved CH4 concentrations of the synthetic mixture and mixed effluents. For CO2, in similar conditions, the value of the experimental mass transfer coefficient was a higher (6.03 × 10⁻⁶ m s−1) for the synthetic mixed effluents; however, a higher value of 1.9 × 10−05 m s−1 was recorded for CO2 at a liquid flow rate of 300 mL min−1. The effect of the liquid flow rate is shown in Figure 11. The liquid flow rate favors the experimental mass transfer coefficient for both CH4 and CO2. By increasing the liquid flow rate from 100 mL min−1 (Rel = 1.30) to 400 mL min−1 (Rel = 5.19), an increase of 1.4 × 10⁻⁵ m s−1 in the CH4 experimental mass transfer coefficient was recorded.
The experimental mass transfer resistance to the transport of biogas in the membrane contactor is presented here in Figure 12. The results revealed that the resistance to the mass transfer of CH4 from the real AnMBR permeate was very low compared to the resistance recorded for CO2. This high resistance to the transport of CO2 could be justified by its high solubility in the effluent (as the earlier findings of this work suggested the main resistance at the liquid side), which decreased its degassing potential compared to CH4. It should be noted that the low resistance and high transport of CH4 is favorable and desirable.

4. Conclusions

A membrane degassing system based on the porous hollow-fiber membrane contactor was developed and coupled directly with AnMBR to treat real AnMBR ultrafiltration permeate for the recovery of biogas. This study implemented a detailed approach to the analysis of the simultaneous recovery of both CH4 and CO2, first from synthetically prepared effluents and then from real AnMBR permeate. This work conducted an in-depth analysis of the biogas recovery from AnMBR permeates and presented promising and effective results compared to that reported before.
During the two hours of degassing operation, the membrane degassing setup was able to recover (out of the total dissolved amount) up to 93% CH4 and 83% CO2 at recovery rates of 0.12 and 4.41 mg L−1 min−1, respectively. The membrane contactor operated at a CH4 degassing efficiency of 95.7%, 89%, and 91% for pure gas effluent, mixed gas effluent, and real AnMBR permeate, respectively. The overall performance based on the obtained results was higher than the one reported before in other works considering nearly similar conditions. An interesting approach was implemented to observe the effect of the gas and liquid hydrodynamics on the selective transport of CH4 and CO2. This study revealed that an increase in the liquid flow rate favors CH4 transport over CO2 while an increase in the gas flow rate favors the transport of CO2. CH4 was observed to have a higher mass transfer coefficient than CO2, both theoretically and experimentally (considering the synthetic effluents and the real AnMBR permeate). This phenomenon was also validated by the higher transmembrane mass transfer resistance of CO2 than CH4 in all experimental and theoretical evaluations. The results also provided some evidence that partial pseudo-wetting of the membrane may occur.
Additional work is required to improve the membrane contactor’s performance for biogas recovery and to study the long-term effects. Further work investigating long-term operation of biogas degassing from real AnMBR permeate in porous and dense membranes with a particular focus on partial wetting and detailed fouling analysis is underway.

Author Contributions

Conceptualization, Q.S., G.L. and J.-P.M.; methodology, Q.S.; software, Q.S.; validation, Q.S.; formal analysis, Q.S.; investigation, Q.S. and C.K.; resources, C.C. and J.C.; data curation, Q.S.; writing—original draft preparation, Q.S.; writing—review and editing, G.L. and J.-P.M.; visualization, Q.S.; supervision, G.L. and J.-P.M.; project administration, G.L.; funding acquisition, G.L. All authors have read and agreed to the published version of the manuscript.

Funding

This research was funded by the French National Research Agency (ANR) as part of the “JCJC” Program BàMAn (ANR-18-CE04-0001-01).

Institutional Review Board Statement

Not applicable.

Informed Consent Statement

Not applicable.

Data Availability Statement

Not applicable.

Acknowledgments

The authors acknowledge the financial support for this work, obtained from the French National Research Agency (ANR) as part of the “JCJC” Program BàMAn (ANR-18-CE04-0001-01).

Conflicts of Interest

The authors declare no conflict of interest.

Appendix A. Parameters for Local Mass Transfer Calculations

Table A1. Parameters used for local mass transfer calculations.
ParameterSpecieEquationRef.
Gas diffusivity (m2 s−1)
(in gas phase)
CO2,CH4,N2 D g = 0.001858 T 3 / 2 ( 1 M 1 + 1 M 2 ) 1 / 2 P σ A 1 , 2 2 D
(1 ,2 = Gas components)
[59]
Mix-effective D g = 1 y 2 / D 1 , 2 + y 3 / D 1 , 3 ,   y n ´ = y n 1 y 1 ,
(1, 2, 3 … n = gas species)
Gas diffusivity (m2 s−1)
(in liquid phase)
CO2, CH4 D l = 7.4   10 8 ( T ( φ 2 M 2 ) 1 / 2 μ 2 V 1 0.6 )
(1 = Gas solute, 2 = Liquid solvent)
Gas diffusivity (m2 s−1)
(porous membrane)
CO2, CH4 1 D m , g = 1 D g + 1 D k n
D k n = 1 3 d p 8 R T π M
[45]
Density (Kg m−3)Gas mixture ρ g ,   m i x = ( y C H 4 M C H 4 + y C O 2 M C O 2 + y N 2 M N 2 )   P g 0.082   T g Ideal Gas Law
Water ρ l = 10 3   ( 0.863559 + 1.21494   10 3   T L 2.5708   10 3   T L ) [60]
Viscosity (Kg m−1 s−1) Gas mixture μ g , m i x = i = 1 3 y i μ i j = 1 3 y i ψ i j ,   ψ i j = ( M j M i ) 0.5 ,   ψ j i = 1 ψ i j [61]
Water μ l = 10 6   ρ l exp ( 3.28285 456.029 T l 154.576 ) [60]

References

  1. McCarty, P.L.; Bae, J.; Kim, J. Domestic Wastewater Treatment as a Net Energy Producer-Can This Be Achieved? Environ. Sci. Technol. 2011, 45, 7100–7106. [Google Scholar] [CrossRef] [PubMed]
  2. Maaz, M.; Yasin, M.; Aslam, M.; Kumar, G.; Atabani, A.E.; Idrees, M.; Anjum, F.; Jamil, F.; Ahmad, R.; Khan, A.L.; et al. Anaerobic Membrane Bioreactors for Wastewater Treatment: Novel Configurations, Fouling Control and Energy Considerations. Bioresour. Technol. 2019, 283, 358–372. [Google Scholar] [CrossRef]
  3. Khan, M.A.; Ngo, H.H.; Guo, W.S.; Liu, Y.W.; Zhou, J.L.; Zhang, J.; Liang, S.; Ni, B.J.; Zhang, X.B.; Wang, J. Comparing the Value of Bioproducts from Different Stages of Anaerobic Membrane Bioreactors. Bioresour. Technol. 2016, 214, 816–825. [Google Scholar] [CrossRef]
  4. Krzeminski, P.; Leverette, L.; Malamis, S.; Katsou, E. Membrane Bioreactors—A Review on Recent Developments in Energy Reduction, Fouling Control, Novel Configurations, LCA and Market Prospects. J. Membr. Sci. 2017, 527, 207–227. [Google Scholar] [CrossRef] [Green Version]
  5. Lettinga, G.; Rebac, S.; Parshina, S.; Nozhevnikova, A.; Van Lier, J.B.; Stams, A.J.M. High-Rate Anaerobic Treatment of Wastewater at Low Temperatures. Appl. Environ. Microbiol. 1999, 65, 1696–1702. [Google Scholar] [CrossRef] [Green Version]
  6. Angenent, L.T.; Banik, G.C.; Sung, S. Anaerobic Migrating Blanket Reactor Treatment of Low-Strength Wastewater at Low Temperatures. Water Environ. Res. 2001, 73, 567–574. [Google Scholar] [CrossRef]
  7. Bandara, W.M.K.R.T.W.; Satoh, H.; Sasakawa, M.; Nakahara, Y.; Takahashi, M.; Okabe, S. Removal of Residual Dissolved Methane Gas in an Upflow Anaerobic Sludge Blanket Reactor Treating Low-Strength Wastewater at Low Temperature with Degassing Membrane. Water Res. 2011, 45, 3533–3540. [Google Scholar] [CrossRef] [Green Version]
  8. Wang, W.; Yang, Q.; Zheng, S.; Wu, D. Anaerobic Membrane Bioreactor (AnMBR) for Bamboo Industry Wastewater Treatment. Bioresour. Technol. 2013, 149, 292–300. [Google Scholar] [CrossRef] [PubMed]
  9. Xia, T.; Gao, X.; Wang, C.; Xu, X.; Zhu, L. An Enhanced Anaerobic Membrane Bioreactor Treating Bamboo Industry Wastewater by Bamboo Charcoal Addition: Performance and Microbial Community Analysis. Bioresour. Technol. 2016, 220, 26–33. [Google Scholar] [CrossRef]
  10. Aslam, M.; McCarty, P.L.; Shin, C.; Bae, J.; Kim, J. Low Energy Single-Staged Anaerobic Fluidized Bed Ceramic Membrane Bioreactor (AFCMBR) for Wastewater Treatment. Bioresour. Technol. 2017, 240, 33–41. [Google Scholar] [CrossRef] [PubMed]
  11. Aslam, M.; Ahmad, R.; Yasin, M.; Khan, A.L.; Shahid, M.K.; Hossain, S.; Khan, Z.; Jamil, F.; Rafiq, S.; Bilad, M.R.; et al. Anaerobic Membrane Bioreactors for Biohydrogen Production: Recent Developments, Challenges and Perspectives. Bioresour. Technol. 2018, 269, 452–464. [Google Scholar] [CrossRef] [PubMed] [Green Version]
  12. Liao, B.Q.; Kraemer, J.T.; Bagley, D.M. Anaerobic Membrane Bioreactors: Applications and Research Directions. Crit. Rev. Environ. Sci. Technol. 2006, 36, 489–530. [Google Scholar] [CrossRef]
  13. Luo, G.; Johansson, S.; Boe, K.; Xie, L.; Zhou, Q.; Angelidaki, I. Simultaneous Hydrogen Utilization and in Situ Biogas Upgrading in an Anaerobic Reactor. Biotechnol. Bioeng. 2012, 109, 1088–1094. [Google Scholar] [CrossRef]
  14. Luo, G.; Wang, W.; Angelidaki, I. A New Degassing Membrane Coupled Upflow Anaerobic Sludge Blanket (UASB) Reactor to Achieve in-Situ Biogas Upgrading and Recovery of Dissolved CH4 from the Anaerobic Effluent. Appl. Energy 2014, 132, 536–542. [Google Scholar] [CrossRef]
  15. Daelman, M.R.J.; van Voorthuizen, E.M.; van Dongen, U.G.J.M.; Volcke, E.I.P.; van Loosdrecht, M.C.M. Methane Emission during Municipal Wastewater Treatment. Water Res. 2012, 46, 3657–3670. [Google Scholar] [CrossRef] [PubMed]
  16. Cookney, J.; Cartmell, E.; Jefferson, B.; McAdam, E.J. Recovery of Methane from Anaerobic Process Effluent Using Poly-Di-Methyl-Siloxane Membrane Contactors. Water Sci. Technol. 2012, 65, 604–610. [Google Scholar] [CrossRef] [PubMed]
  17. Crone, B.C.; Garland, J.L.; Sorial, G.A.; Vane, L.M. Significance of Dissolved Methane in Effluents of Anaerobically Treated Low Strength Wastewater and Potential for Recovery as an Energy Product: A Review. Water Res. 2016, 104, 520–531. [Google Scholar] [CrossRef] [PubMed]
  18. Blasing, T.J. Recent Greenhouse Gas Concentrations; Carbon Dioxide Information Analysis Center, Oak Ridge National Laboratory: Oak Ridge, TN, USA, 2009. [Google Scholar]
  19. Heile, S.; Chernicharo, C.A.L.; Brandt, E.M.F.; McAdam, E.J. Dissolved Gas Separation for Engineered Anaerobic Wastewater Systems. Sep. Purif. Technol. 2017, 189, 405–418. [Google Scholar] [CrossRef] [Green Version]
  20. Stanojević, M.; Lazarević, B.; Radić, D. Review of Membrane Contactors Designs and Applications of Different Modules in Industry. FME Trans. 2003, 31, 91–98. [Google Scholar]
  21. Chen, S.; Smith, A.L. Methane-Driven Microbial Fuel Cells Recover Energy and Mitigate Dissolved Methane Emissions from Anaerobic Effluents. Environ. Sci. Water Res. Technol. 2018, 4, 67–79. [Google Scholar] [CrossRef]
  22. Sethunga, G.S.M.D.P.; Rongwong, W.; Wang, R.; Bae, T.H. Optimization of Hydrophobic Modification Parameters of Microporous Polyvinylidene Fluoride Hollow-Fiber Membrane for Biogas Recovery from Anaerobic Membrane Bioreactor Effluent. J. Membr. Sci. 2018, 548, 510–518. [Google Scholar] [CrossRef]
  23. Younas, M.; Tahir, T.; Wu, C.; Farrukh, S.; Sohaib, Q.; Muhammad, A.; Rezakazemi, M.; Li, J. Post-Combustion CO2 capture with Sweep Gas in Thin Film Composite (TFC) Hollow Fiber Membrane (HFM) Contactor. J. CO2 Util. 2020, 40, 101266. [Google Scholar] [CrossRef]
  24. Henares, M.; Izquierdo, M.; Marzal, P.; Martínez-Soria, V. Demethanization of Aqueous Anaerobic Effluents Using a Polydimethylsiloxane Membrane Module: Mass Transfer, Fouling and Energy Analysis. Sep. Purif. Technol. 2017, 186, 10–19. [Google Scholar] [CrossRef] [Green Version]
  25. Rongwong, W.; Goh, K.; Sethunga, G.S.M.D.P.; Bae, T.H. Fouling Formation in Membrane Contactors for Methane Recovery from Anaerobic Effluents. J. Membr. Sci. 2019, 573, 534–543. [Google Scholar] [CrossRef]
  26. Sohaib, Q.; Muhammad, A.; Younas, M.; Rezakazemi, M.; Druon-Bocquet, S.; Sanchez-Marcano, J. Rigorous Non-Isothermal Modeling Approach for Mass and Energy Transport during CO2 Absorption into Aqueous Solution of Amino Acid Ionic Liquids in Hollow Fiber Membrane Contactors. Sep. Purif. Technol. 2021, 254, 117644. [Google Scholar] [CrossRef]
  27. Yan, S.P.; Fang, M.X.; Zhang, W.F.; Wang, S.Y.; Xu, Z.K.; Luo, Z.Y.; Cen, K.F. Experimental Study on the Separation of CO2 from Flue Gas Using Hollow Fiber Membrane Contactors without Wetting. Fuel Process. Technol. 2007, 88, 501–511. [Google Scholar] [CrossRef]
  28. Sohaib, Q.; Vadillo, J.M.; Gómez-Coma, L.; Albo, J.; Druon-Bocquet, S.; Irabien, A.; Sanchez-Marcano, J. Post-Combustion CO2 Capture by Coupling [Emim] Cation Based Ionic Liquids with a Membrane Contactor; Pseudo-Steady-State Approach. Int. J. Greenh. Gas Control 2020, 99, 103076. [Google Scholar] [CrossRef]
  29. Qazi, S.; Gómez-Coma, L.; Albo, J.; Druon-Bocquet, S.; Irabien, A.; Younas, M.; Sanchez-Marcano, J. Mathematical Modeling of CO 2 Absorption with Ionic Liquids in a Membrane Contactor, Study of Absorption Kinetics and Influence of Temperature. J. Chem. Technol. Biotechnol. 2019, 95, 1844–1857. [Google Scholar] [CrossRef]
  30. Zhang, Y.; Wang, R. Novel Method for Incorporating Hydrophobic Silica Nanoparticles on Polyetherimide Hollow Fiber Membranes for CO2 Absorption in a Gas-Liquid Membrane Contactor. J. Membr. Sci. 2014, 452, 379–389. [Google Scholar] [CrossRef]
  31. Zhang, Y.; Wang, R. Gas-Liquid Membrane Contactors for Acid Gas Removal: Recent Advances and Future Challenges. Curr. Opin. Chem. Eng. 2013, 2, 255–262. [Google Scholar] [CrossRef]
  32. Sethunga, G.S.M.D.P.; Karahan, H.E.; Wang, R.; Bae, T.H. PDMS-Coated Porous PVDF Hollow Fiber Membranes for Efficient Recovery of Dissolved Biomethane from Anaerobic Effluents. J. Membr. Sci. 2019, 584, 333–342. [Google Scholar] [CrossRef]
  33. Zhang, M.; Liao, B.; Zhou, X.; He, Y.; Hong, H.; Lin, H.; Chen, J. Effects of Hydrophilicity/Hydrophobicity of Membrane on Membrane Fouling in a Submerged Membrane Bioreactor. Bioresour. Technol. 2015, 175, 59–67. [Google Scholar] [CrossRef] [PubMed]
  34. Chun, Y.; Mulcahy, D.; Zou, L.; Kim, I.S.; Le-Clech, P. Influence of Hydrophobic and Electrostatic Membrane Surface Properties on Biofouling in a Submerged Membrane Bioreactor under Different Filtration Modes. Desalination Water Treat. 2016, 57, 26641–26647. [Google Scholar] [CrossRef]
  35. Hashemifard, S.A.; Ismail, A.F.; Matsuura, T.; Dashtarzhandi, M.R. Performance of Silicon Rubber Coated Polyetherimide Hollow Fibers for CO2 Removal via a Membrane Contactor. RSC Adv. 2015, 5, 48442–48455. [Google Scholar] [CrossRef]
  36. Sanchis-Perucho, P.; Robles, Á.; Durán, F.; Ferrer, J.; Seco, A. PDMS Membranes for Feasible Recovery of Dissolved Methane from AnMBR Effluents. J. Membr. Sci. 2020, 604, 118070. [Google Scholar] [CrossRef]
  37. Jiménez-Robles, R.; Gabaldón, C.; Martínez-Soria, V.; Izquierdo, M. Simultaneous Application of Vacuum and Sweep Gas in a Polypropylene Membrane Contactor for the Recovery of Dissolved Methane from Water. J. Membr. Sci. 2020, 617, 118560. [Google Scholar] [CrossRef]
  38. Jiménez-Robles, R.; Gabaldón, C.; Badia, J.D.; Izquierdo, M.; Martínez-Soria, V. Recovery of Dissolved Methane through a Flat Sheet Module with PDMS, PP, and PVDF Membranes. Sep. Purif. Technol. 2022, 282, 120057. [Google Scholar] [CrossRef]
  39. Layer, M.; Adler, A.; Reynaert, E.; Hernandez, A.; Pagni, M.; Morgenroth, E.; Holliger, C.; Derlon, N. Organic Substrate Diffusibility Governs Microbial Community Composition, Nutrient Removal Performance and Kinetics of Granulation of Aerobic Granular Sludge. Water Res. X 2019, 4, 100033. [Google Scholar] [CrossRef]
  40. Lahdhiri, A.; Sid, S.; Lesage, G.; Heran, M. Impact of Decreasing COD/N Ratio on Nitrogen Removal and Fouling in a Membrane Bioreactor for Urban Wastewater Treatment. Desalination Water Treat. 2017, 80, 121–132. [Google Scholar] [CrossRef]
  41. Iversen, S.B.; Bhatia, V.K.; Dam-Johansen, K.; Jonsson, G. Characterization of Microporous Membranes for Use in Membrane Contactors. J. Membr. Sci. 1997, 130, 205–217. [Google Scholar] [CrossRef]
  42. Yu, Y.; Ramsay, J.A.; Ramsay, B.A. On-Line Estimation of Dissolved Methane Concentration during Methanotrophic Fermentations. Biotechnol. Bioeng. 2006, 95, 788–793. [Google Scholar] [CrossRef]
  43. Henares, M.; Ferrero, P.; San-Valero, P.; Martínez-Soria, V.; Izquierdo, M. Performance of a Polypropylene Membrane Contactor for the Recovery of Dissolved Methane from Anaerobic Effluents: Mass Transfer Evaluation, Long-Term Operation and Cleaning Strategies. J. Membr. Sci. 2018, 563, 926–937. [Google Scholar] [CrossRef]
  44. Sander, R. Compilation of Henry’s Law Constants (Version 4.0) for Water as Solvent. Atmos. Chem. Phys. 2015, 15, 4399–4981. [Google Scholar] [CrossRef] [Green Version]
  45. Qazi, S.; Manuel Vadillo, J.; Gómez-Coma, L.; Albo, J.; Druon-Bocquet, S.; Irabien, A.; Sanchez-Marcano, J. CO2 Capture with Room Temperature Ionic Liquids; Coupled Absorption/Desorption and Single Module Absorption in Membrane Contactor. Chem. Eng. Sci. 2020, 223, 115719. [Google Scholar] [CrossRef]
  46. Zhao, S.; Feron, P.H.M.; Deng, L.; Favre, E.; Chabanon, E.; Yan, S.; Hou, J.; Chen, V.; Qi, H. Status and Progress of Membrane Contactors in Post-Combustion Carbon Capture: A State-of-the-Art Review of New Developments. J. Membr. Sci. 2016, 511, 180–206. [Google Scholar] [CrossRef]
  47. Shen, S.; Kentish, S.E.; Stevens, G.W. Shell-Side Mass-Transfer Performance in Hollow-Fiber Membrane Contactors. Solvent Extr. Ion Exch. 2010, 28, 817–844. [Google Scholar] [CrossRef]
  48. Gabelman, A.; Hwang, S.-T. Hollow Fiber Membrane Contactors. J. Membr. Sci. 1999, 159, 61–106. [Google Scholar] [CrossRef]
  49. Cookney, J.; Mcleod, A.; Mathioudakis, V.; Ncube, P.; Soares, A.; Jefferson, B.; McAdam, E.J. Dissolved Methane Recovery from Anaerobic Effluents Using Hollow Fibre Membrane Contactors. J. Membr. Sci. 2016, 502, 141–150. [Google Scholar] [CrossRef] [Green Version]
  50. Wongchitphimon, S.; Rongwong, W.; Chuah, C.Y.; Wang, R.; Bae, T.H. Polymer-Fluorinated Silica Composite Hollow Fiber Membranes for the Recovery of Biogas Dissolved in Anaerobic Effluent. J. Membr. Sci. 2017, 540, 146–154. [Google Scholar] [CrossRef]
  51. McLeod, A.; Jefferson, B.; McAdam, E.J. Toward Gas-Phase Controlled Mass Transfer in Micro-Porous Membrane Contactors for Recovery and Concentration of Dissolved Methane in the Gas Phase. J. Membr. Sci. 2016, 510, 466–471. [Google Scholar] [CrossRef] [Green Version]
  52. Mosadegh-Sedghi, S.; Rodrigue, D.; Brisson, J.; Iliuta, M.C. Wetting Phenomenon in Membrane Contactors—Causes and Prevention. J. Membr. Sci. 2014, 452, 332–353. [Google Scholar] [CrossRef]
  53. Wang, R.; Zhang, H.Y.; Feron, P.H.M.; Liang, D.T. Influence of Membrane Wetting on CO2 Capture in Microporous Hollow Fiber Membrane Contactors. Sep. Purif. Technol. 2005, 46, 33–40. [Google Scholar] [CrossRef]
  54. Qazi, S.; Gómez-Coma, L.; Albo, J.; Druon-Bocquet, S.; Irabien, A.; Sanchez-Marcano, J. CO2 Capture in a Hollow Fiber Membrane Contactor Coupled with Ionic Liquid: Influence of Membrane Wetting and Process Parameters. Sep. Purif. Technol. 2020, 233, 115986. [Google Scholar] [CrossRef]
  55. Galib, M.; Elbeshbishy, E.; Reid, R.; Hussain, A.; Lee, H.S. Energy-Positive Food Wastewater Treatment Using an Anaerobic Membrane Bioreactor (AnMBR). Environ. Manag. 2016, 182, 477–485. [Google Scholar] [CrossRef]
  56. Smith, A.L.; Skerlos, S.J.; Raskin, L. Psychrophilic Anaerobic Membrane Bioreactor Treatment of Domestic Wastewater. Water Res. 2013, 47, 1655–1665. [Google Scholar] [CrossRef] [PubMed]
  57. Wu, P.H.; Ng, K.K.; Hong, P.K.A.; Yang, P.Y.; Lin, C.F. Treatment of Low-Strength Wastewater at Mesophilic and Psychrophilic Conditions Using Immobilized Anaerobic Biomass. Chem. Eng. J. 2017, 311, 46–54. [Google Scholar] [CrossRef]
  58. Yeo, H.; An, J.; Reid, R.; Rittmann, B.E.; Lee, H.S. Contribution of Liquid/Gas Mass-Transfer Limitations to Dissolved Methane Oversaturation in Anaerobic Treatment of Dilute Wastewater. Environ. Sci. Technol. 2015, 49, 10366–10372. [Google Scholar] [CrossRef]
  59. James, R.W.; Gregory, L.R.; Foster, D.G. Fundamentals of Momentum, Heat and Mass Transfer, 6th ed.; John Wiley & Sons Inc.: New York, NY, USA, 2001; ISBN 978-0470504819. [Google Scholar]
  60. Hsu, C.H.; Li, M.H. Densities of Aqueous Blended Amines. J. Chem. Eng. Data 1997, 42, 502–507. [Google Scholar] [CrossRef]
  61. Poling, B.E.; Prausnitz, J.M.; O’Connell, J.P. Properties of Gases and Liquids, 5th ed.; McGraw-Hill: New York, NY, USA, 2001. [Google Scholar]
Figure 1. Flow diagram of the developed membrane degassing setup in-line with the anaerobic membrane bioreactor setup (solid lines: liquid stream; dashed lines: gas stream).
Membranes 12 00112 g001
Figure 2. Reduction of the dissolved biogas concentration by membrane degassing in the effluent tank against operational time for (a) pure CH4, (b) pure CO2, (c) mix CH4 (60%), (d) mix CO2 (40%); Ql = 100 mL min−1, Rel = 1.30, Qg = 100 mL min−1, Reg = 0.07, T = 25 °C, Ph (effluent head space pressure) = 1 bar.
Membranes 12 00112 g002
Figure 3. Percent 2 h recovery percentage and average (over a 1 h and 2 h time span) recovery rates of biogas after degassing for pure and mix effluents: (a) 2 h recovery percentage at different liquid side Reynold numbers (Rel) for a fixed gas side Reynolds number (Reg) of 0.07, (b) 2 h recovery percentage at different Reg for a fixed Rel of 1.30, (c) mix gas effluent recovery rates at different Rel numbers for a fixed Reg of 0.07, (d) pure gas effluent recovery rates at different Rel numbers for Reg of 0.07; T = 25 °C.
Membranes 12 00112 g003
Figure 4. Membrane degassing efficiency for pure and mix effluent, against (a) liquid Reynold, Rel = 1.30–5.19, liquid flow rate, Ql = 100–400 mL min−1 (b) gas Reynold, Reg = 0.07–0.15, gas flow rate, Qg = 50–200 mL min−1; T = 25 °C.
Membranes 12 00112 g004
Figure 5. Biogas transmembrane flux for (a) mixed gas and (b) pure gas effluents against operational time; Ql = 100 mL min−1 (Rel = 1.30), Qg = 100 mL min−1 (Reg = 0.07); T = 25 °C.
Membranes 12 00112 g005
Figure 6. Selective flux transport of CH4 over CO2 in mix gas and pure gas effluents against (a) the liquid flow rates (b) gas flow rates.
Membranes 12 00112 g006
Figure 7. Experimental mass transfer coefficient of CH4 and CO2 in mix gas and pure gas effluents against (a) liquid Reynold, Rel = 1.30–5.19, liquid flowrate, Ql = 100–400 mL min−1 (b) gas Reynold, Reg = 0.07–0.15, gas flowrate, Qg = 50–200 mL min−1; T = 25 °C.
Membranes 12 00112 g007
Figure 8. Pure CH4 and CO2 theoretical and experimental overall mass transfer resistance, Ql = 100 mL min−1, Rel = 1.30, Qg = 100 mL min−1, Reg = 0.07, T = 25 °C, P = 1 bar.
Membranes 12 00112 g008
Figure 9. Membrane degassing efficiency for real lab-scale AnMBR permeates at liquid Reynold, Rel = 1.30–5.19, liquid flow rate, Ql= 100–400 mL min−1 and gas Reynold, Reg = 0.07, gas flow rate, Qg = 100 mL min−1, T = 25 °C.
Membranes 12 00112 g009
Figure 10. Biogas transmembrane flux for AnMBR permeates at liquid Reynold, Rel = 1.30–5.19, liquid flow rate, Ql = 100–400 mL min−1 and gas Reynold, Reg = 0.07, gas flow rate, Qg = 100 mL min−1, T = 25 °C.
Membranes 12 00112 g010
Figure 11. Experimental mass transfer coefficient of biogas for AnMBR permeates at liquid Reynold, Rel = 1.30–5.19, liquid flow rate, Ql = 100–400 mL min−1 and gas Reynold, Reg = 0.07, gas flow rate, Qg = 100 mL min−1, T = 25 °C.
Membranes 12 00112 g011
Figure 12. Experimental overall mass transfer resistance of biogas for real effluents at liquid Reynold, Rel = 1.30, liquid flow rate, Ql = 100 mL min−1 and gas Reynold, Reg = 0.07, gas flow rate, Qg = 100 mL min−1, T = 25 °C.
Membranes 12 00112 g012
Table 1. Characteristics of the real AnMBR permeate used in this study.
ParameterValue
Temperature, T (°C)25
pH (-)7.0 ± 0.3
Total organic carbon, TOC (mg L−1)2.2 ± 0.5
Chemical oxygen demand, COD (mg L−1)18 ± 4
Total solids, TS (mg L−1)1.7 ± 0.2
Volatile solids, VS (mg L−1)1.3 ± 0.2
Dissolved methane, dCH4 (mg L−1)11 ± 1
Dissolved carbon dioxide, dCO2 (mg L−1)50 ± 10
Table 2. Membrane module specifications and operating conditions.
Parameter Value
Membrane Contactor
Membrane materialPolypropylene
Fiber inner diameter, di (m)2.20 × 10⁻⁴
Fiber outer diameter, do (m)3.00 × 10⁻⁴
Membrane thickness, δ (m)0.4 × 10⁻⁴
Effective length of the fiber, L (m)0.1132
Number of fibers, N 7400
Membrane pore diameter, dp (m)4.00 × 10⁻⁸
Effective inner membrane area, Ai (m2)0.58
Effective outer membrane area, Ao (m2)0.79
Lumen side volume, Vl (mL)53
Shell side volume, Vg (mL)78
Porosity, ε40
Packing factor, ϕ0.36
Tortuosity, τ a6.4
Operating conditions
Operating configurationCountercurrent
Operating temperature T (°C)25
Liquid flowrate, Ql (mL min−1)100–400
Liquid velocity, Vl (m s−1)5.93 × 10⁻³–2.37 × 10⁻²
Liquid Reynold number, Rel (-)1.29–5.19
Gas flowrate, Qg (mL min−1)50–200
Gas velocity, Vg (m s−1)1.11 × 10⁻³–4.43 × 10 −3
Gas Reynold number, Reg (-)3.70 × 10⁻²–1.48 × 10⁻¹
a τ = ( 2 ε ) 2 ε [41].
Table 3. Comparison of the membrane degassing efficiency of CH4 from various authors and from the present study at different liquid flowrates.
ReferenceEffluentMembraneOperating ModeVl
(m s−1)
Ql
(mL min−1)
Vg
(m s−1)
Qg
(mL min−1)
Degassing
Efficiency (%)
This WorkSaturated waterPPSweep gas0.0061000.002010095.7
This WorkSaturated waterPPSweep gas0.0244000.002010078.1
This WorkSaturated waterPPSweep gas0.0061000.00420078.1
[36]AnMBR prototype-plantPDMSVacuum-833--45.0
[36]AnMBR prototype-plantPDMSVacuum-3333--18.0
[37]Saturated waterPPSweep gas + vacuum0.016830.00048.384
[37]Saturated waterPPSweep gas + vacuum0.0894660.00048.342
[43]EGSBPPSweep gas + vacuum0.013680.022043382
[43]EGSBPPSweep gas + vacuum0.0864530.022043345
Table 4. CH4 flux at different gas and liquid flow rates.
Ql (mL min−1)/Vl (m s−1)/Rel100/0.006/1.30400/0.024/5.19
Qg (mL min−1)/Vg (m s−1)/RegMix CH4 Flux (mg m−2 min−1)
50/0.001/0.041.47-
100/0.002/0.071.715.27
200/0.004/0.151.93-
Pure CH4 Flux (mg m−2 min−1)
100/0.002/0.073.7711.07
Table 5. Comparison of CH4 transmembrane flux from various authors.
Ref.EffluentMembraneOperating ModeVl
(m s−1)
Ql
(mL min−1)
Vg
(m s−1)
Qg
(mL min−1)
N
(mg m−2 min−1)
This WorkSaturated waterPPSweep gas0.0244000.002010011.07
[36]AnMBR prototype-plantPDMSVacuum-833--2.41
[32]Saturated waterPPSweep gas0.1--209.63
[32]Saturated waterModified PVDFSweep gas0.1--2018.28
Table 6. Comparison of the CH4 experimental mass transfer coefficient (Kexp), from various authors.
Ref.EffluentMembraneOperating ModeVl
(m s−1)
Ql
(mL min−1)
Vg
(m s−1)
Qg
(mL min−1)
Kexp × 10 5
(m s−1)
This WorkSaturated waterPPSweep gas0.0173000.00201001.93
[37]Saturated waterPPSweep gas + vacuum0.016830.00048.31.65
[36]AnMBR prototype-plantPDMSVacuum-833-433-0.38
[43]EGSBPPSweep gas + vacuum0.013680.0220 1.94
[49]Saturated waterPPSweep gas0.0122030.045-1.56
[51]Saturated waterPPSweep gas0.11820000.01810001.2
[32]Saturated waterPPSweep gas0.1--201.5
[32]Saturated waterModified PVDFSweep gas0.1--202.5
Table 7. Prediction of the mass transport characteristics of biogas for wetted and pseudo-wetted membrane at P=1.01 bar, T= 25 °C.
PropertyQg/QlDm,g
(m2 s−1)
Dm,eff
(m2 s−1)
Kg
(m s−1)
Kl
(m s−1)
Km,nw
(m s−1)
Km,w
(m s−1)
Kov
(m s−1)
Kexp
(m s−1)
CH411.33 × 10−74.75 × 10−101.10 × 10−41.50 × 10−52.08 × 10−47.15 × 10−71.49 × 10−59.26 × 10−6
CO212.20 × 10−72.79 × 10−98.40 × 10−51.54 × 10−53.44 × 10−44.36 × 10−61.35 × 10−54.31 × 10⁻⁶
Publisher’s Note: MDPI stays neutral with regard to jurisdictional claims in published maps and institutional affiliations.

