
Atomistic-Scale Energetic Heterogeneity on a Membrane Surface


Abstract
1. Introduction
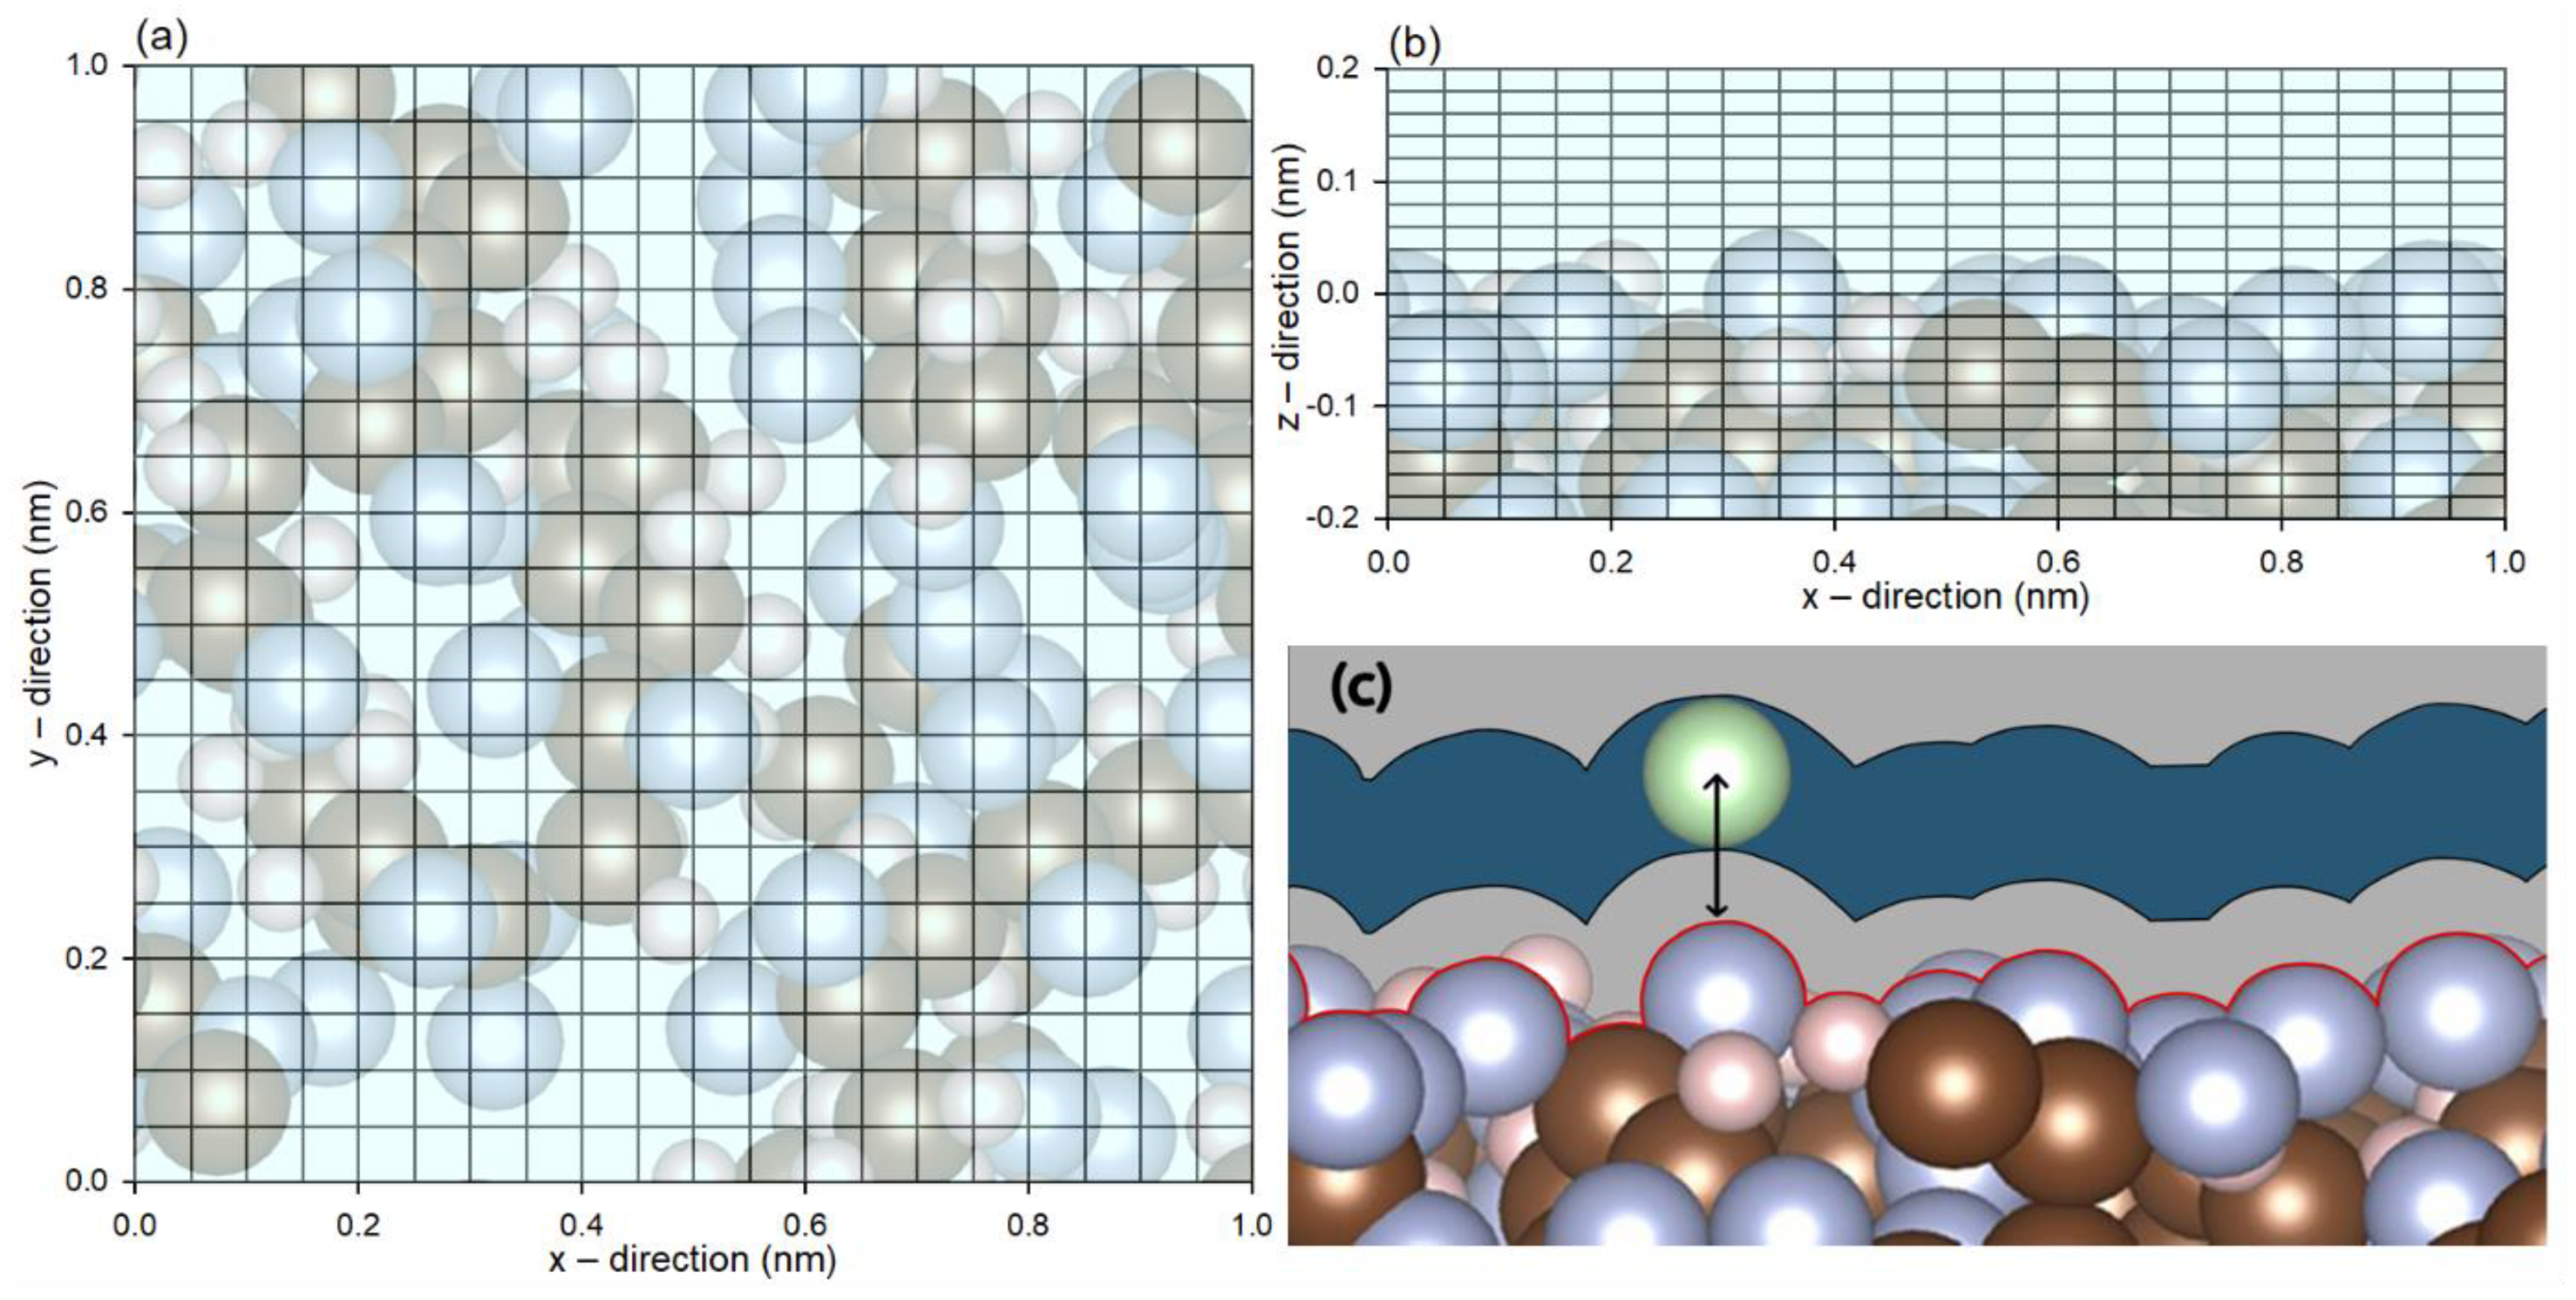
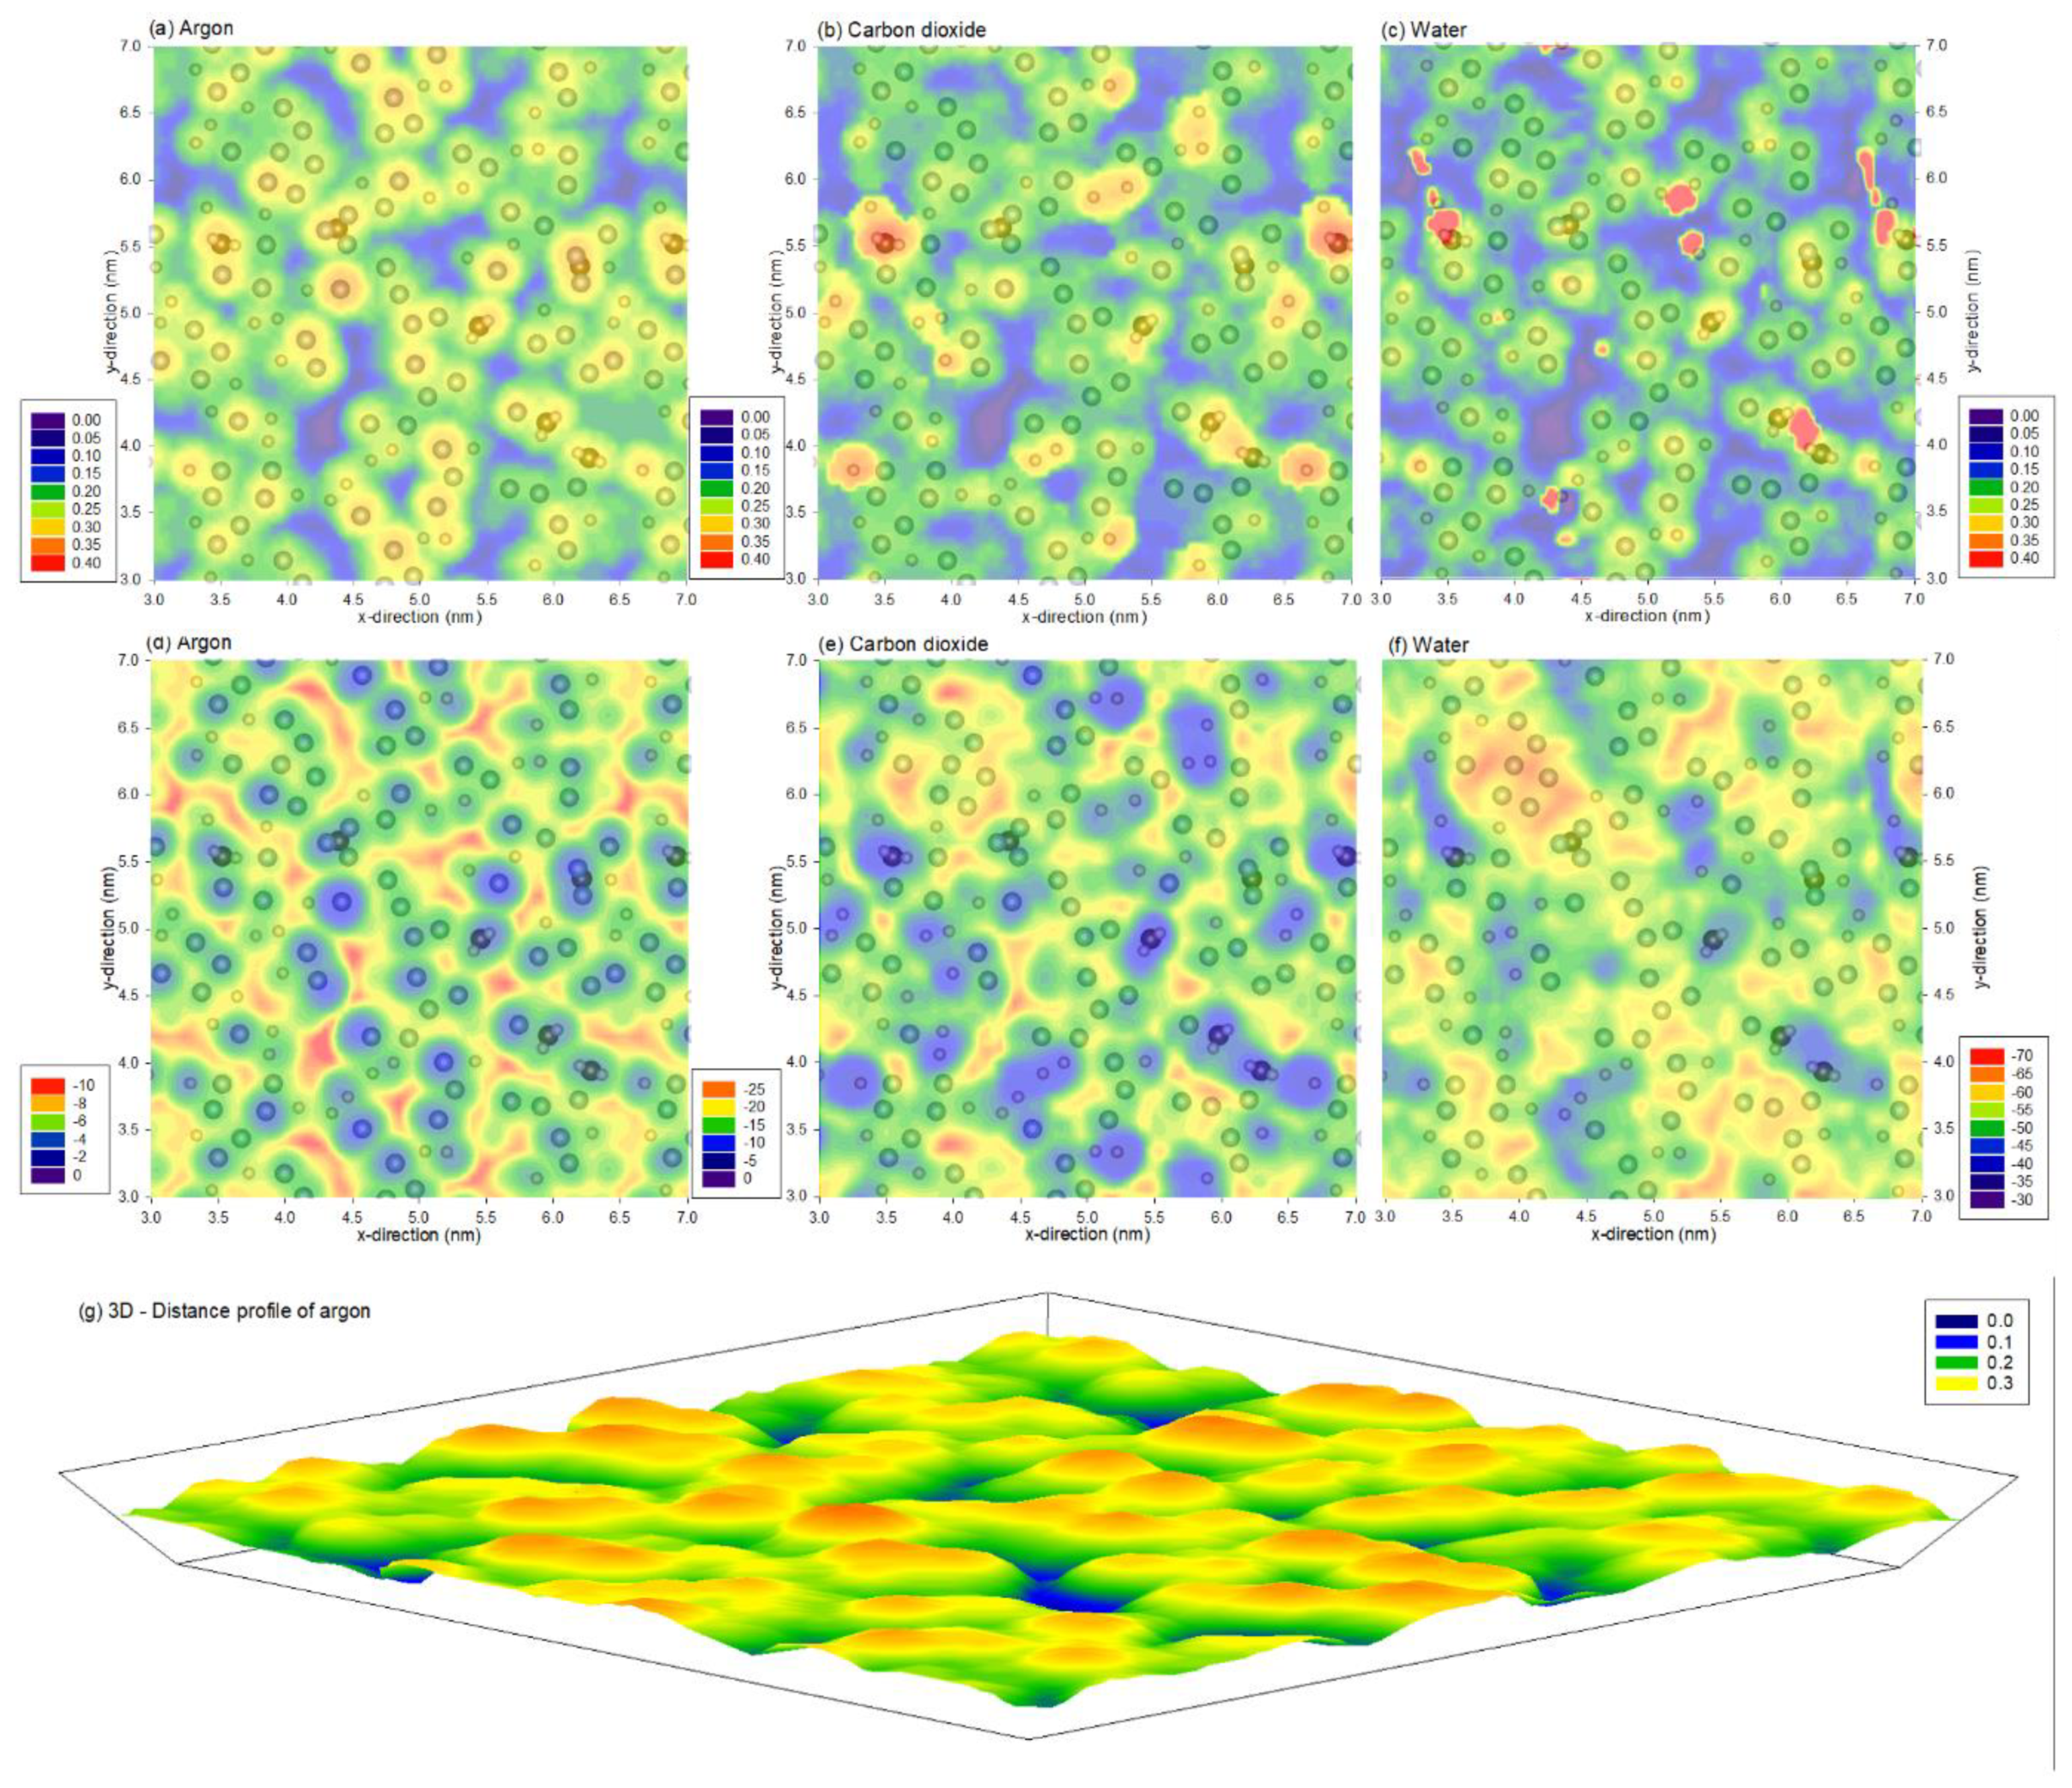
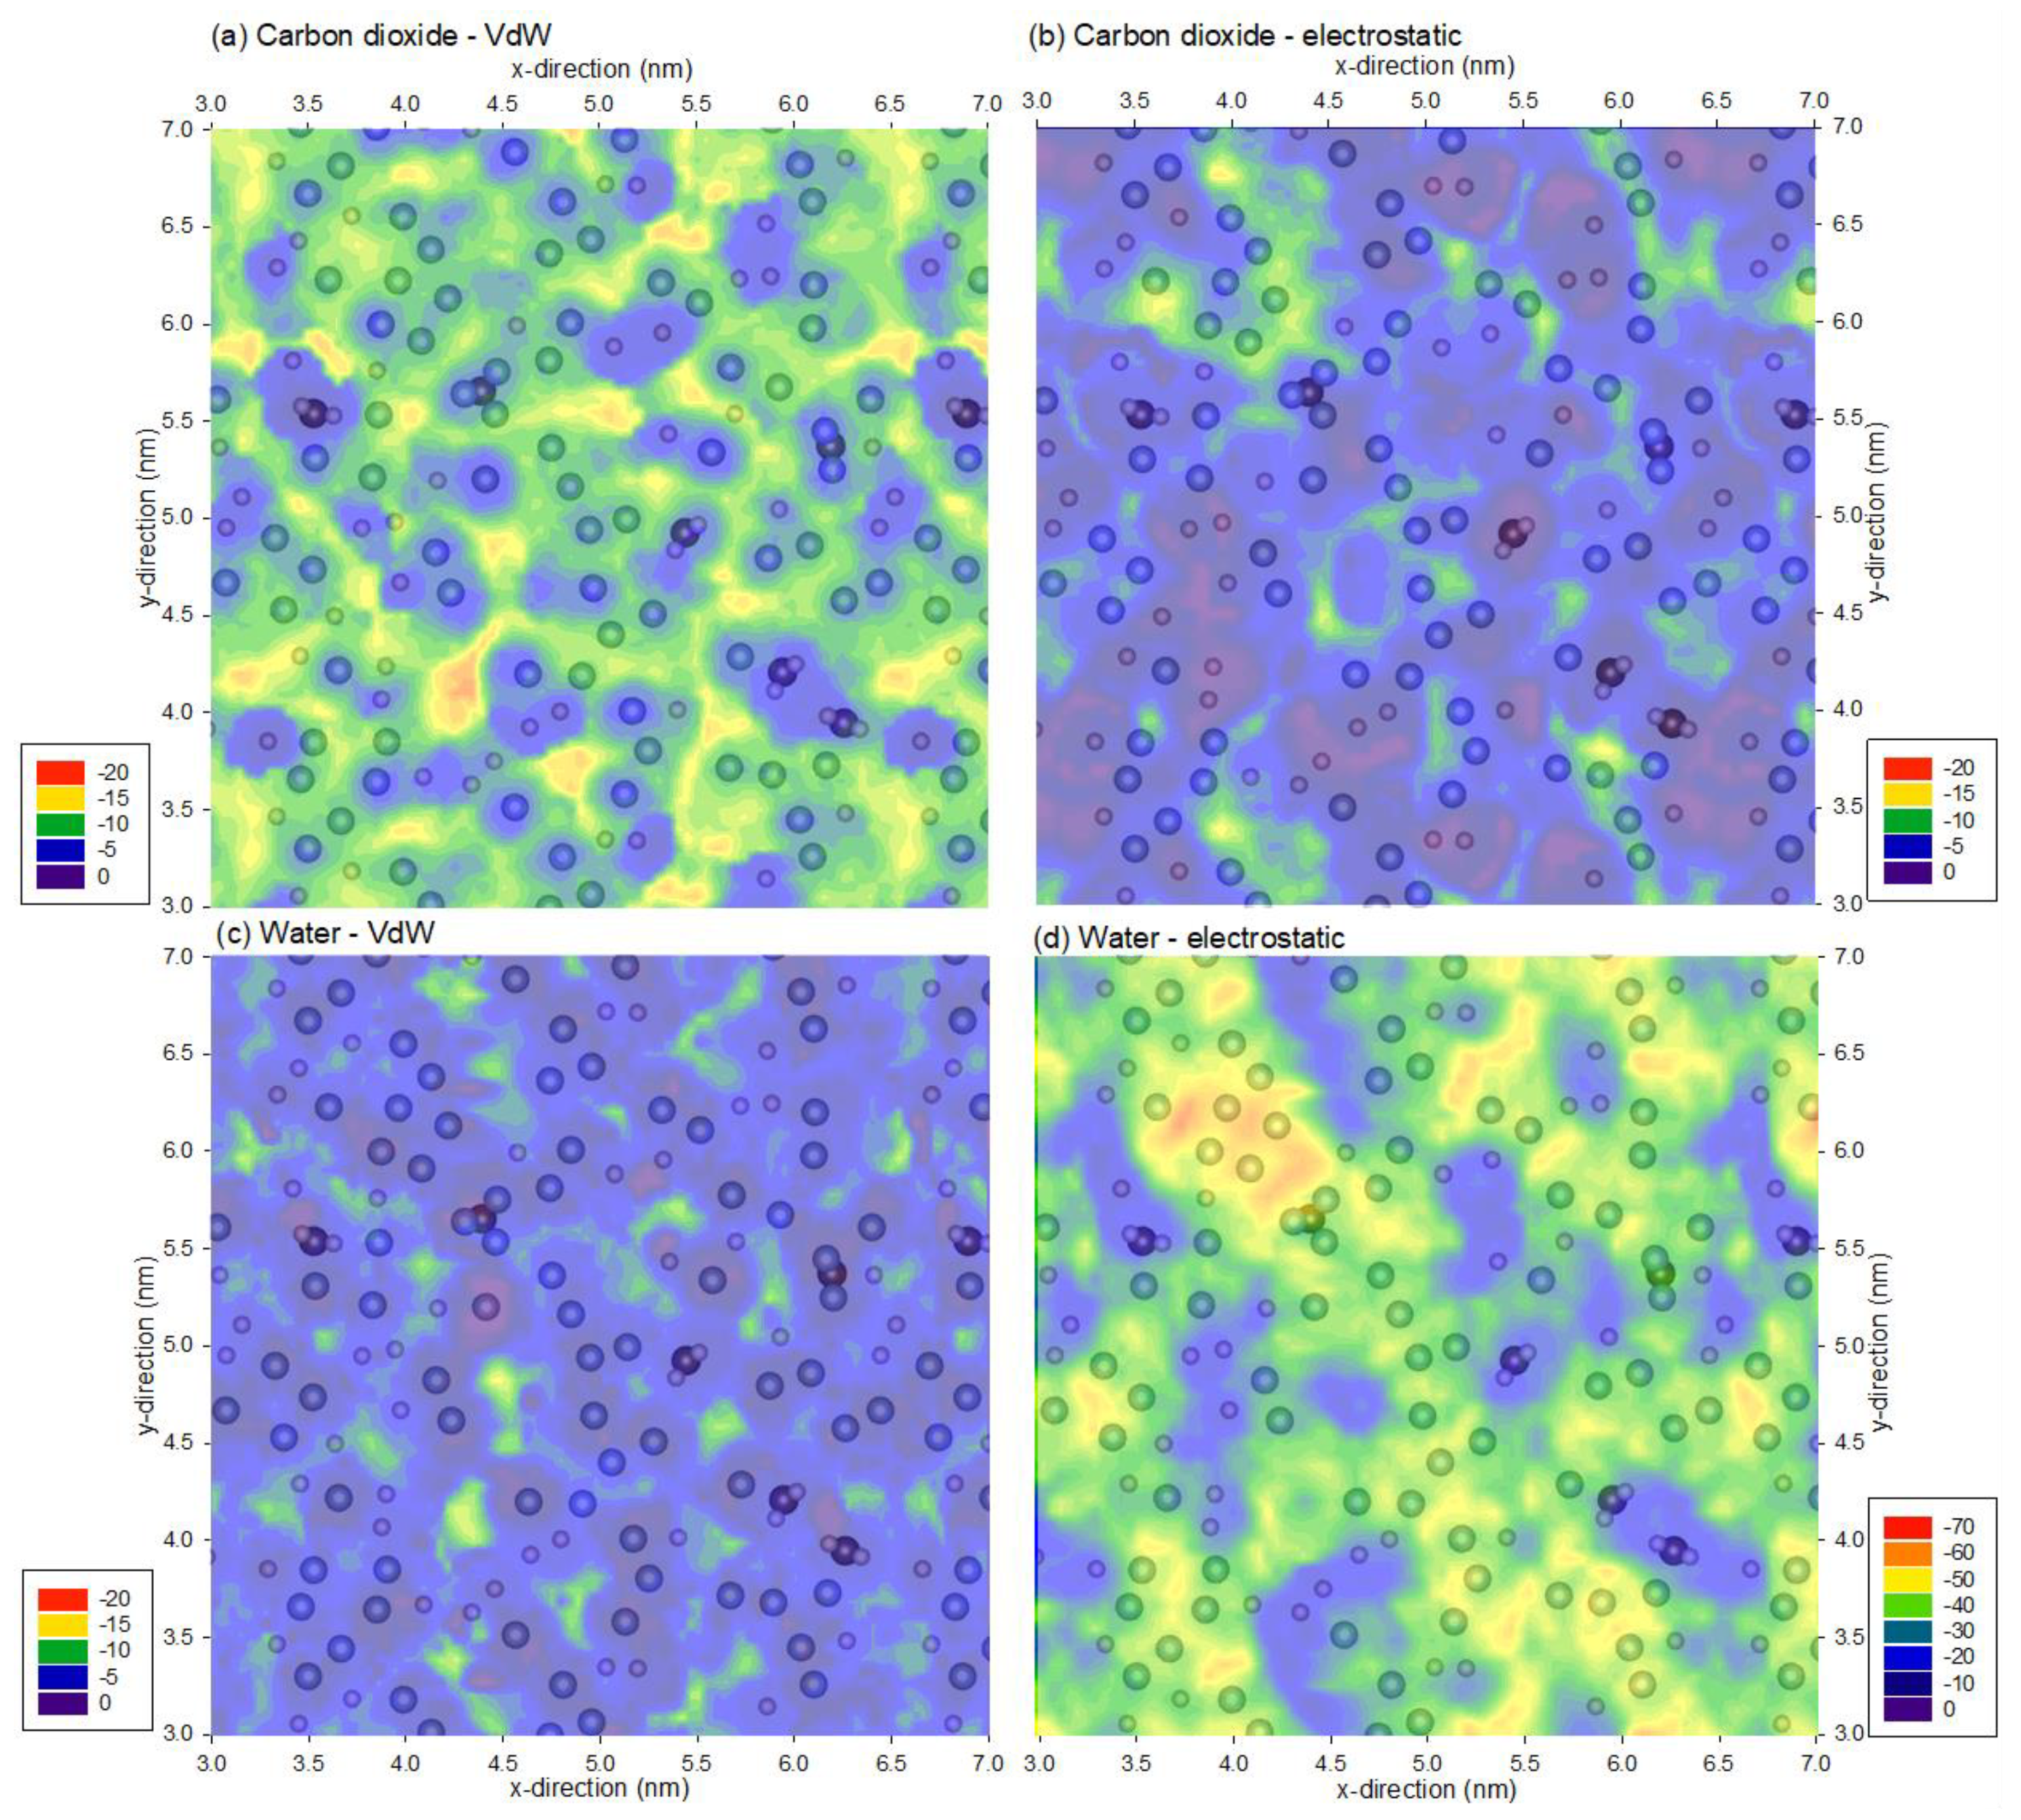
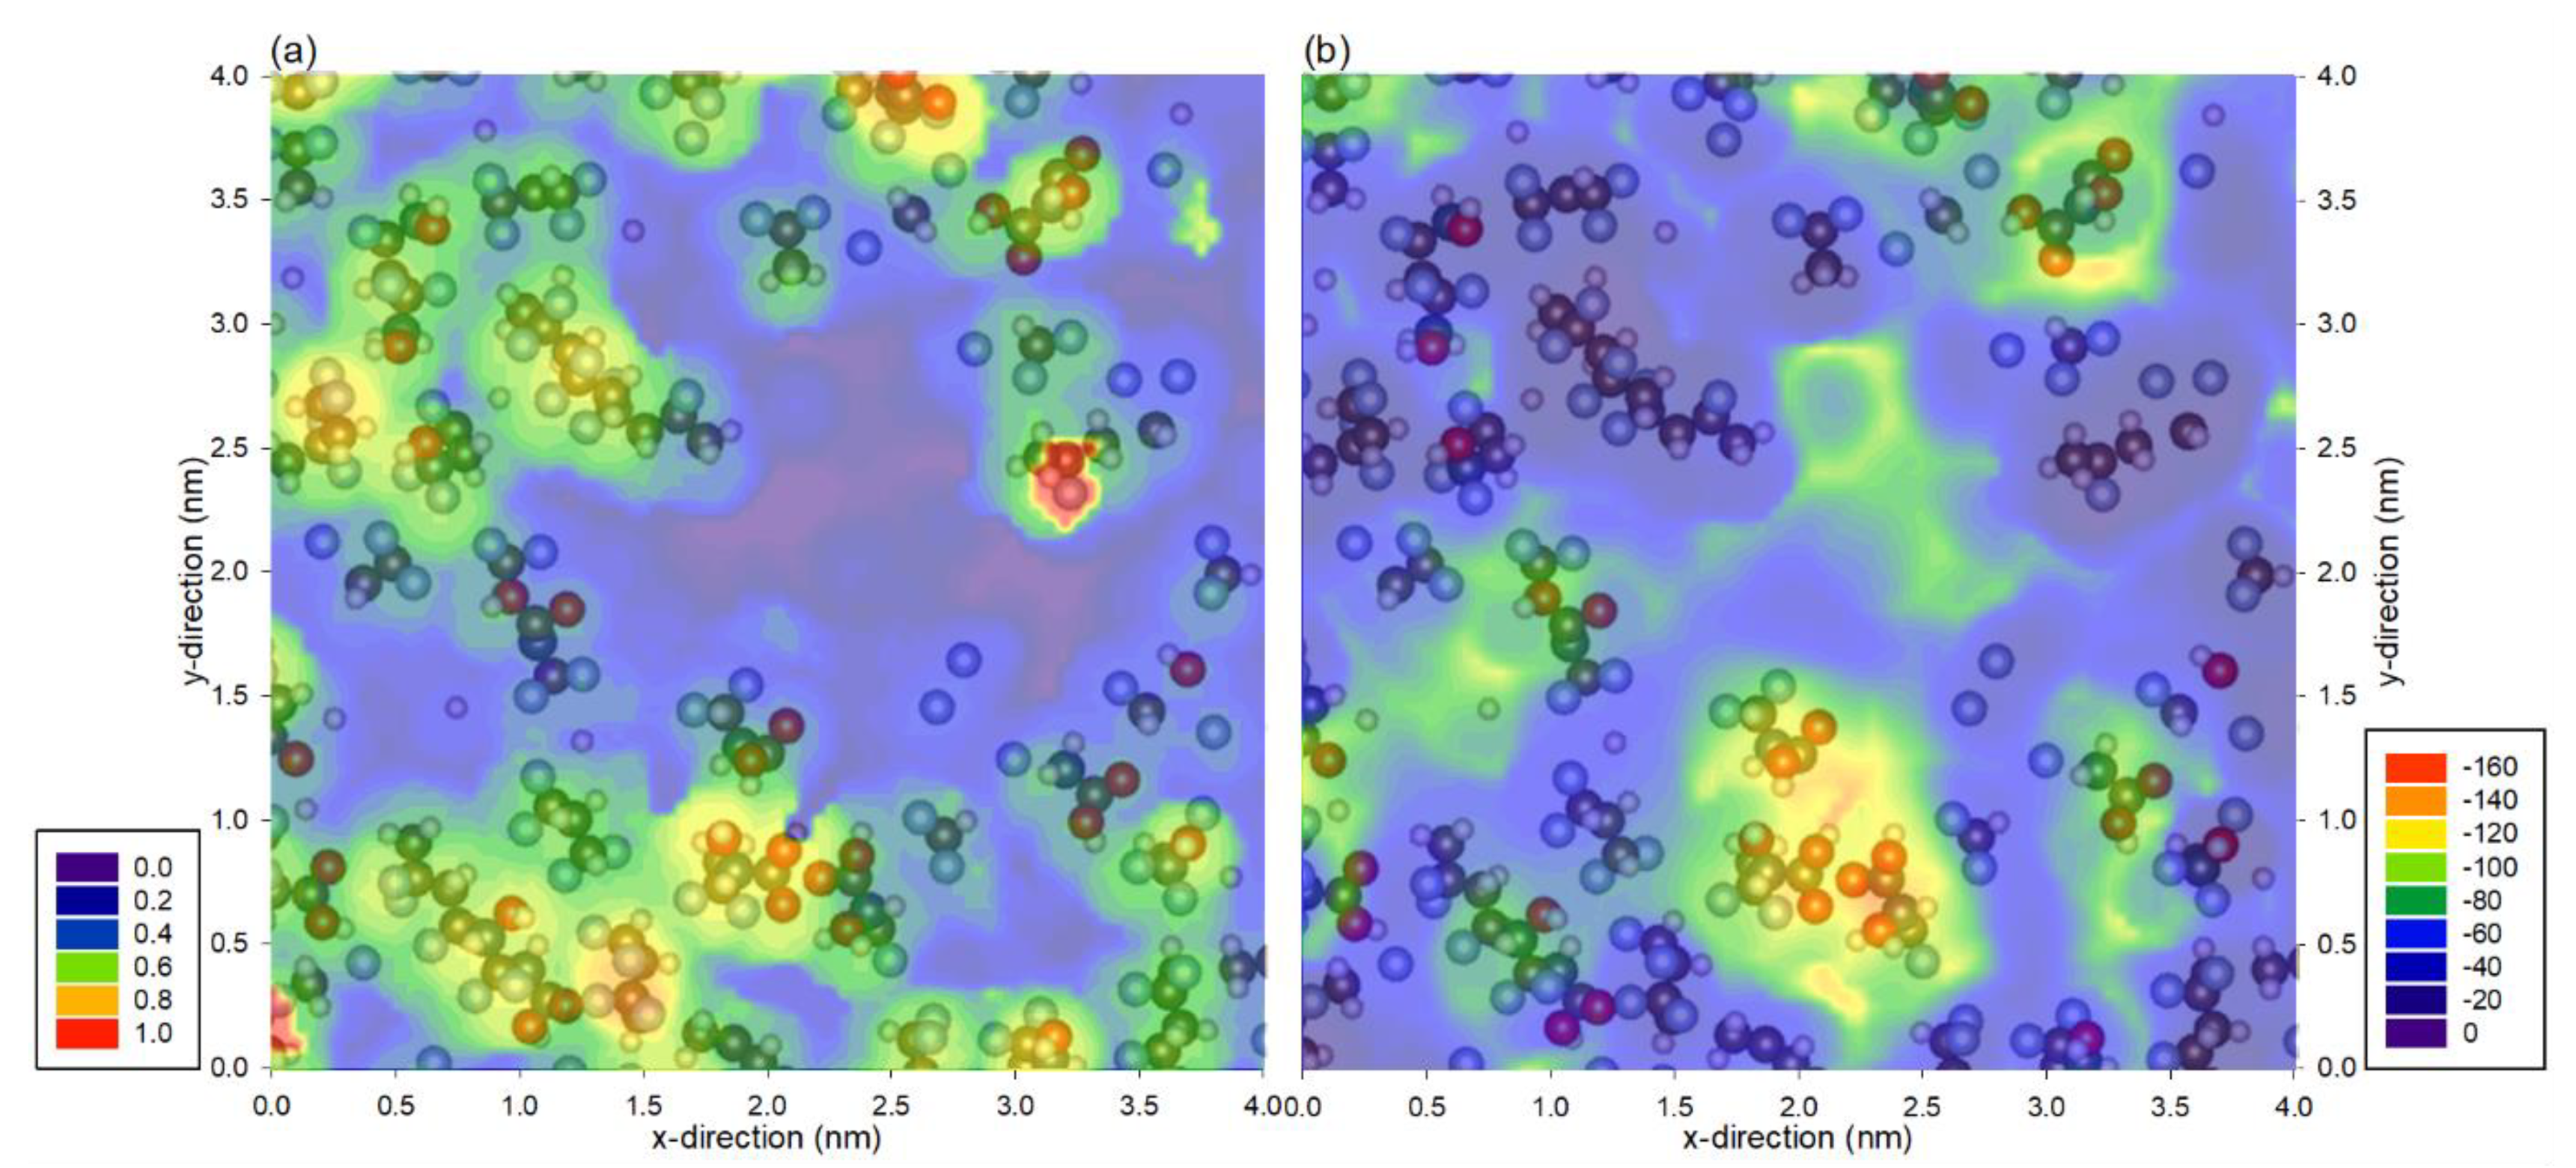
2. Method
3. Results and Discussion
4. Conclusions
Author Contributions
Funding
Institutional Review Board Statement
Informed Consent Statement
Data Availability Statement
Conflicts of Interest
References
- Chew, J.W.; Kilduff, J.; Belfort, G. The behavior of suspensions and macromolecular solutions in crossflow microfiltration: An update. J. Membr. Sci. 2020, 601, 117865. [Google Scholar] [CrossRef]
- Brant, J.A.; Childress, A.E. Assessing short-range membrane–colloid interactions using surface energetics. J. Membr. Sci. 2002, 203, 257–273. [Google Scholar] [CrossRef]
- Elimelech, M.; Xiaohua, Z.; Childress, A.E.; Seungkwan, H. Role of membrane surface morphology in colloidal fouling of cellulose acetate and composite aromatic polyamide reverse osmosis membranes. J. Membr. Sci. 1997, 127, 101–109. [Google Scholar] [CrossRef]
- Hoek, E.M.V.; Agarwal, G.K. Extended DLVO interactions between spherical particles and rough surfaces. J. Colloid Interface Sci. 2006, 298, 50–58. [Google Scholar] [CrossRef] [PubMed]
- Howell, D.; Behrends, B. A review of surface roughness in antifouling coatings illustrating the importance of cutoff length. Biofouling 2006, 22, 401–410. [Google Scholar] [CrossRef]
- Elimelech, M.; Gregory, J.; Jia, X.; Williams, R.A. Particle Deposition and Aggregation: Measurement, Modeling, and Simulation; Butterworth-Heinemann: Woburn, MA, USA, 1995. [Google Scholar]
- Asmatulu, R.; Khan, W.S. (Eds.) Chapter 13—Characterization of Electrospun Nanofibers; Elsevier: Amsterdam, The Netherlands, 2019; pp. 257–281. [Google Scholar]
- Verwey, E.J.W. Theory of the stability of lyophobic colloids. J. Phys. Colloid Chem. 1947, 51, 631–636. [Google Scholar] [CrossRef]
- van Oss, C.J. Interfacial Forces in Aqueous Media; CRC Press: Boca Raton, FL, USA, 2006. [Google Scholar]
- Zamani, F.; Ullah, A.; Akhondi, E.; Tanudjaja, H.J.; Cornelissen, E.R.; Honciuc, A.; Fane, A.G.; Chew, J.W. Impact of the surface energy of particulate foulants on membrane fouling. J. Membr. Sci. 2016, 510, 101–111. [Google Scholar] [CrossRef]
- Han, Q.; Li, W.; Trinh, T.A.; Fane, A.G.; Chew, J.W. Effect of the surface charge of monodisperse particulate foulants on cake formation. J. Membr. Sci. 2018, 548, 108–116. [Google Scholar] [CrossRef]
- Yin, Z.; Yeow, R.J.E.; Ma, Y.; Chew, J.W. Link between interfacial interaction and membrane fouling during organic solvent ultrafiltration of colloidal foulants. J. Membr. Sci. 2020, 611, 118369. [Google Scholar] [CrossRef]
- Bhattacharjee, S.; Elimelech, M. Surface Element Integration: A Novel Technique for Evaluation of DLVO Interaction between a Particle and a Flat Plate. J. Colloid Interface Sci. 1997, 193, 273–285. [Google Scholar] [CrossRef]
- Prasetyo, L.; Tan, S.; Zeng, Y.; Do, D.D.; Nicholson, D. An improved model for N2 adsorption on graphitic adsorbents and graphitized thermal carbon black—The importance of the anisotropy of graphene. J. Chem. Phys. 2017, 146, 184702. [Google Scholar] [CrossRef]
- Kaminski, G.A.; Friesner, R.A.; Tirado-Rives, J.; Jorgensen, W.L. Evaluation and Reparametrization of the OPLS-AA Force Field for Proteins via Comparison with Accurate Quantum Chemical Calculations on Peptides. J. Phys. Chem. B 2001, 105, 6474–6487. [Google Scholar] [CrossRef]
- Fang, H.; Demir, H.; Kamakoti, P.; Sholl, D.S. Recent developments in first-principles force fields for molecules in nanoporous materials. J. Mater. Chem. A 2014, 2, 274–291. [Google Scholar] [CrossRef]
- Piana, S.; Robustelli, P.; Tan, D.; Chen, S.; Shaw, D.E. Development of a Force Field for the Simulation of Single-Chain Proteins and Protein–Protein Complexes. J. Chem. Theory Comput. 2020, 16, 2494–2507. [Google Scholar] [CrossRef] [PubMed]
- Velioğlu, S.; Han, L.; Chew, J.W. Understanding membrane pore-wetting in the membrane distillation of oil emulsions via molecular dynamics simulations. J. Membr. Sci. 2018, 551, 76–84. [Google Scholar] [CrossRef]
- Lachet, V.; Teuler, J.M.; Rousseau, B. Classical Force Field for Hydrofluorocarbon Molecular Simulations. Application to the Study of Gas Solubility in Poly(vinylidene fluoride). J. Phys. Chem. A 2015, 119, 140–151. [Google Scholar] [CrossRef] [PubMed]
- Ma, Y.; Velioğlu, S.; Trinh, T.A.; Wang, R.; Chew, J.W. Investigation of Surfactant–Membrane Interaction Using Molecular Dynamics Simulation with Umbrella Sampling. ACS EST Eng. 2021, 1, 1470–1480. [Google Scholar] [CrossRef]
- Frenkel, D.; Smit, B. Understanding Molecular Simulation: From Algorithms to Applications, 2nd ed.; Academic Press: San Diego, CA, USA, 2002. [Google Scholar]
- Nguyen, V.T.; Horikawa, T.; Do, D.D.; Nicholson, D. On the relative strength of adsorption of gases on carbon surfaces with functional groups: Fluid–fluid, fluid–graphite and fluid–functional group interactions. Carbon 2013, 61, 551–557. [Google Scholar] [CrossRef]
- Vrabec, J.; Stoll, J.; Hasse, H. A Set of Molecular Models for Symmetric Quadrupolar Fluids. J. Phys. Chem. B 2001, 105, 12126–12133. [Google Scholar] [CrossRef]
- Potoff, J.J.; Siepmann, J.I. Vapor-liquid equilibria of mixtures containing alkanes, carbon dioxide and nitrogen. AIChE 2001, 47, 1676–1683. [Google Scholar] [CrossRef]
- Berendsen, H.J.C.; Grigera, J.R.; Straatsma, T.P. The Missing Term in Effective Pair Potentials. J. Phys. Chem. B 1987, 91, 6269–6271. [Google Scholar] [CrossRef]
- Huang, Y.L.; Merker, T.; Heilig, M.; Hasse, H.; Vrabec, J. Molecular Modeling and Simulation of Vapor–Liquid Equilibria of Ethylene Oxide, Ethylene Glycol, and Water as Well as their Binary Mixtures. Ind. Eng. Chem. Res. 2012, 51, 7428–7440. [Google Scholar] [CrossRef]
- Allen, M.P.; Tildesley, D.J. Computer Simulation of Liquids; Oxford University Press: Oxford, UK, 1989. [Google Scholar]
- Bowen, W.R.; Doneva, T.A.; Stoton, J.A.G. The use of atomic force microscopy to quantify membrane surface electrical properties. Colloids Surf. A Physicochem. Eng. Asp. 2002, 201, 73–83. [Google Scholar] [CrossRef]


| Fluid | Parameter | Symbols | Unit | Value |
|---|---|---|---|---|
| Argon [23] | Ar | σ | nm | 0.33952 |
| ε/k | K | 116.79 | ||
| Carbon dioxide [24] | C | σ | nm | 0.28 |
| ε/k | K | 27 | ||
| q | e | 0.7 | ||
| O* | σ | nm | 0.305 | |
| ε/k | K | 79 | ||
| q | e | −0.35 | ||
| Atomic distance | C=O | nm | 0.116 | |
| Water, TIP4P [26] | O | σ | nm | 0.311831 |
| ε/k | K | 208.08 | ||
| q | e | −0.8391 | ||
| H | q | e | 0.41955 | |
| Atomic distance | O-H | nm | 0.11549 | |
| Angle | H-O-H | o | 104.52 |
Publisher’s Note: MDPI stays neutral with regard to jurisdictional claims in published maps and institutional affiliations. |
© 2022 by the authors. Licensee MDPI, Basel, Switzerland. This article is an open access article distributed under the terms and conditions of the Creative Commons Attribution (CC BY) license (https://creativecommons.org/licenses/by/4.0/).
Share and Cite
Tan, S.; Ong, C.; Chew, J. Atomistic-Scale Energetic Heterogeneity on a Membrane Surface. Membranes 2022, 12, 977. https://doi.org/10.3390/membranes12100977
Tan S, Ong C, Chew J. Atomistic-Scale Energetic Heterogeneity on a Membrane Surface. Membranes. 2022; 12(10):977. https://doi.org/10.3390/membranes12100977
Chicago/Turabian StyleTan, Shiliang (Johnathan), Chisiang Ong, and Jiawei Chew. 2022. "Atomistic-Scale Energetic Heterogeneity on a Membrane Surface" Membranes 12, no. 10: 977. https://doi.org/10.3390/membranes12100977
APA StyleTan, S., Ong, C., & Chew, J. (2022). Atomistic-Scale Energetic Heterogeneity on a Membrane Surface. Membranes, 12(10), 977. https://doi.org/10.3390/membranes12100977