
Mapping Bubble Formation and Coalescence in a Tubular Cross-Flow Membrane Foaming System


Abstract
:
1. Introduction
2. Materials and Methods
2.1. Materials
2.2. Set-up
2.3. Membrane Foaming
2.4. Image Analysis
3. Results and Discussions
3.1. General Bubble Behavior in CFMF
3.2. Bubble Formation at the Membrane Surface
3.3. Bubble Coalescence
3.4. Bubble Formation Dynamics—Timescales
4. Conclusions
Supplementary Materials
 ,
,  ) and 100 cm (
  ,
,  ) downstream of the module. The CV for measured at the two positions vary in the range of 26~35%, Figure S3. Bubble size versus the shear force (). These data are shown in the manuscript in Figure 4A (for 200 mbar) and C. The fitting was performed by non-linear least square regression, Figure S4-1. Schematic overview of potential variation in transmembrane pressure along the length of the membrane inside the module. The schematic is not drawn to scale, Figure S4-2. Histogram plots for bubbles with (grey line) and (red line). The corresponding experimental conditions for A-C are marked in the figures, Figure S5. Number of coalescence events. In the order of A-C, the effects of the continuous phase flow rate (for a series of transmembrane pressures), protein concentration and the continuous phase viscosity are presented, Figure S6. Bubble diameters as a function of transmembrane pressure. The continuous phase flow rate is fixed at . For comparison, the initial bubbles with are only shown for 1 wt % whey protein (O), and the is evaluated for both 1 wt % (
  ) and 2.5 wt % (
  ) whey protein solutions, S7. Calculation of and .
 Author Contributions
Funding
Institutional Review Board Statement
Informed Consent Statement
Data Availability Statement
Conflicts of Interest
References
- Yang, X.; Berry, T.K.; Foegeding, E.A. Foams Prepared from Whey Protein Isolate and Egg White Protein: 1. Physical, Microstructural, and Interfacial Properties. J. Food Sci. 2009, 74, E259–E268. [Google Scholar] [CrossRef]
- Narchi, I.; Vial, C.; Djelveh, G. Effect of protein–polysaccharide mixtures on the continuous manufacturing of foamed food products. Food Hydrocoll. 2009, 23, 188–201. [Google Scholar] [CrossRef]
- Nazir, A.; Maan, A.A.; Sahin, S.; Boom, R.M.; Schroen, K. Foam preparation at high-throughput using a novel packed bed system. Food Bioprod. Process. 2015, 94, 561–564. [Google Scholar] [CrossRef]
- Deng, B.; De Ruiter, J.; Schroën, K. Application of Microfluidics in the Production and Analysis of Food Foams. Foods 2019, 8, 476. [Google Scholar] [CrossRef] [Green Version]
- Bals, A.; Kulozik, U. The influence of the pore size, the foaming temperature and the viscosity of the continuous phase on the properties of foams produced by membrane foaming. J. Membr. Sci. 2003, 220, 5–11. [Google Scholar] [CrossRef]
- Bals, A.; Kulozik, U. Effect of pre-heating on the foaming properties of whey protein isolate using a membrane foaming apparatus. Int. Dairy J. 2003, 13, 903–908. [Google Scholar] [CrossRef]
- Müller-Fischer, N.; Bleuler, H.; Windhab, E.J. Dynamically enhanced membrane foaming. Chem. Eng. Sci. 2007, 62, 4409–4419. [Google Scholar] [CrossRef] [Green Version]
- Carballido, L.; Dabrowski, M.L.; Dehli, F.; Koch, L.; Stubenrauch, C. Monodisperse liquid foams via membrane foaming. J. Colloid Interface Sci. 2020, 568, 46–53. [Google Scholar] [CrossRef] [PubMed]
- Gijsbertsen-Abrahamse, A.; Van Der Padt, A.; Boom, R. Status of cross-flow membrane emulsification and outlook for industrial application. J. Membr. Sci. 2004, 230, 149–159. [Google Scholar] [CrossRef]
- Hancocks, R.; Spyropoulos, F.; Norton, I. Comparisons between membranes for use in cross flow membrane emulsification. J. Food Eng. 2013, 116, 382–389. [Google Scholar] [CrossRef]
- Zanatta, V.; Rezzadori, K.; Penha, F.M.; Zin, G.; Lemos-Senna, E.; Petrus, J.C.C.; Di Luccio, M. Stability of oil-in-water emulsions produced by membrane emulsification with microporous ceramic membranes. J. Food Eng. 2017, 195, 73–84. [Google Scholar] [CrossRef]
- Vladisavljevic, G.; Kobayashi, I.; Nakajima, M. Production of uniform droplets using membrane, microchannel and microfluidic emulsification devices. Microfluid. Nanofluidics 2012, 13, 151–178. [Google Scholar] [CrossRef] [Green Version]
- Piacentini, E.; Imbrogno, A.; Drioli, E.; Giorno, L. Membranes with tailored wettability properties for the generation of uniform emulsion droplets with high efficiency. J. Membr. Sci. 2014, 459, 96–103. [Google Scholar] [CrossRef]
- Schröder, V.; Schubert, H. Production of emulsions using microporous, ceramic membranes. Colloids Surf. A Physicochem. Eng. Asp. 1999, 152, 103–109. [Google Scholar] [CrossRef]
- Abrahamse, A.; van Lierop, R.; van der Sman, R.; van der Padt, A.; Boom, R. Analysis of droplet formation and interactions during cross-flow membrane emulsification. J. Membr. Sci. 2002, 204, 125–137. [Google Scholar] [CrossRef]
- van der Graaf, S.; Steegmans, M.; van der Sman, R.; Schroen, K.; Boom, R. Droplet formation in a T-shaped microchannel junction: A model system for membrane emulsification. Colloids Surf. A Physicochem. Eng. Asp. 2005, 266, 106–116. [Google Scholar] [CrossRef]
- Peng, S.; Williams, R. Controlled production of emulsions using a crossflow membrane. Part I: Droplet formation from a single pore. Chem. Eng. Res. Des. 1998, 76, 894–901. [Google Scholar] [CrossRef]
- De Luca, G.; Di Maio, F.P.; Di Renzo, A.; Drioli, E. Droplet detachment in cross-flow membrane emulsification: Comparison among torque- and force-based models. Chem. Eng. Process. Process. Intensif. 2008, 47, 1150–1158. [Google Scholar] [CrossRef]
- Mirsandi, H.; Smit, W.; Kong, G.; Baltussen, M.; Peters, E.; Kuipers, J. Bubble formation from an orifice in liquid cross-flow. Chem. Eng. J. 2020, 386, 120902. [Google Scholar] [CrossRef]
- Geerken, M.J.; Lammertink, R.G.; Wessling, M. Interfacial aspects of water drop formation at micro-engineered orifices. J. Colloid Interface Sci. 2007, 312, 460–469. [Google Scholar] [CrossRef]
- van der Graaf, S.; Schroën, C.; van der Sman, R.; Boom, R. Influence of dynamic interfacial tension on droplet formation during membrane emulsification. J. Colloid Interface Sci. 2004, 277, 456–463. [Google Scholar] [CrossRef]
- Tcholakova, S.; Denkov, N.D.; Lips, A. Comparison of solid particles, globular proteins and surfactants as emulsifier. Phys. Chem. Chem. Phys. 2008, 10, 1608–1627. [Google Scholar] [CrossRef]
- Vladisavljevic, G.; Schubert, H. Preparation of Emulsions with a Narrow Particle Size Distribution Using Microporous α-Alumina Membranes. J. Dispers. Sci. Technol. 2003, 24, 811–819. [Google Scholar] [CrossRef] [Green Version]
- van der Graaf, S.; Nisisako, T.; Schroën, C.G.P.H.; van der Sman, R.G.M.; Boom, M.R. Lattice Boltzmann Simulations of Droplet Formation in a T-Shaped Microchannel. Langmuir 2006, 22, 4144–4152. [Google Scholar] [CrossRef] [PubMed]
- Kobayashi, I.; Yasuno, M.; Iwamoto, S.; Shono, A.; Satoh, K.; Nakajima, M. Microscopic observation of emulsion droplet formation from a polycarbonate membrane. Colloids Surf. A Physicochem. Eng. Asp. 2002, 207, 185–196. [Google Scholar] [CrossRef]
- Christov, N.C.; Ganchev, D.N.; Vassileva, N.D.; Denkov, N.D.; Danov, K.D.; Kralchevsky, P.A. Capillary mechanisms in mem-brane emulsification: Oil-in-water emulsions stabilized by Tween 20 and milk proteins. Colloids Surf. A Physicochem. Eng. Asp. 2002, 209, 83–104. [Google Scholar] [CrossRef]
- Jafari, S.M.; Assadpoor, E.; He, Y.; Bhandari, B. Re-coalescence of emulsion droplets during high-energy emulsification. Food Hydrocoll. 2008, 22, 1191–1202. [Google Scholar] [CrossRef]
- Damodaran, S. Protein Stabilization of Emulsions and Foams. J. Food Sci. 2005, 70, 54–66. [Google Scholar] [CrossRef]
- Muijlwijk, K. Microfluidic Methods to Study Emulsion Formation; Wageningen University & Research: Wageningen, The Netherlands, 2017. [Google Scholar]
- Deng, B.; Schroën, K.; de Ruiter, J. Effects of dynamic adsorption on bubble formation and coalescence in partitioned-EDGE devices. J. Colloid Interface Sci. 2021, 602, 316–324. [Google Scholar] [CrossRef]
- Chen, Y.; Narayan, S.; Dutcher, C.S. Phase-Dependent Surfactant Transport on the Microscale: Interfacial Tension and Droplet Coalescence. Langmuir 2020, 36, 14904–14923. [Google Scholar] [CrossRef]

 ), 200 (
  ), 300 (
  ) and 400 (
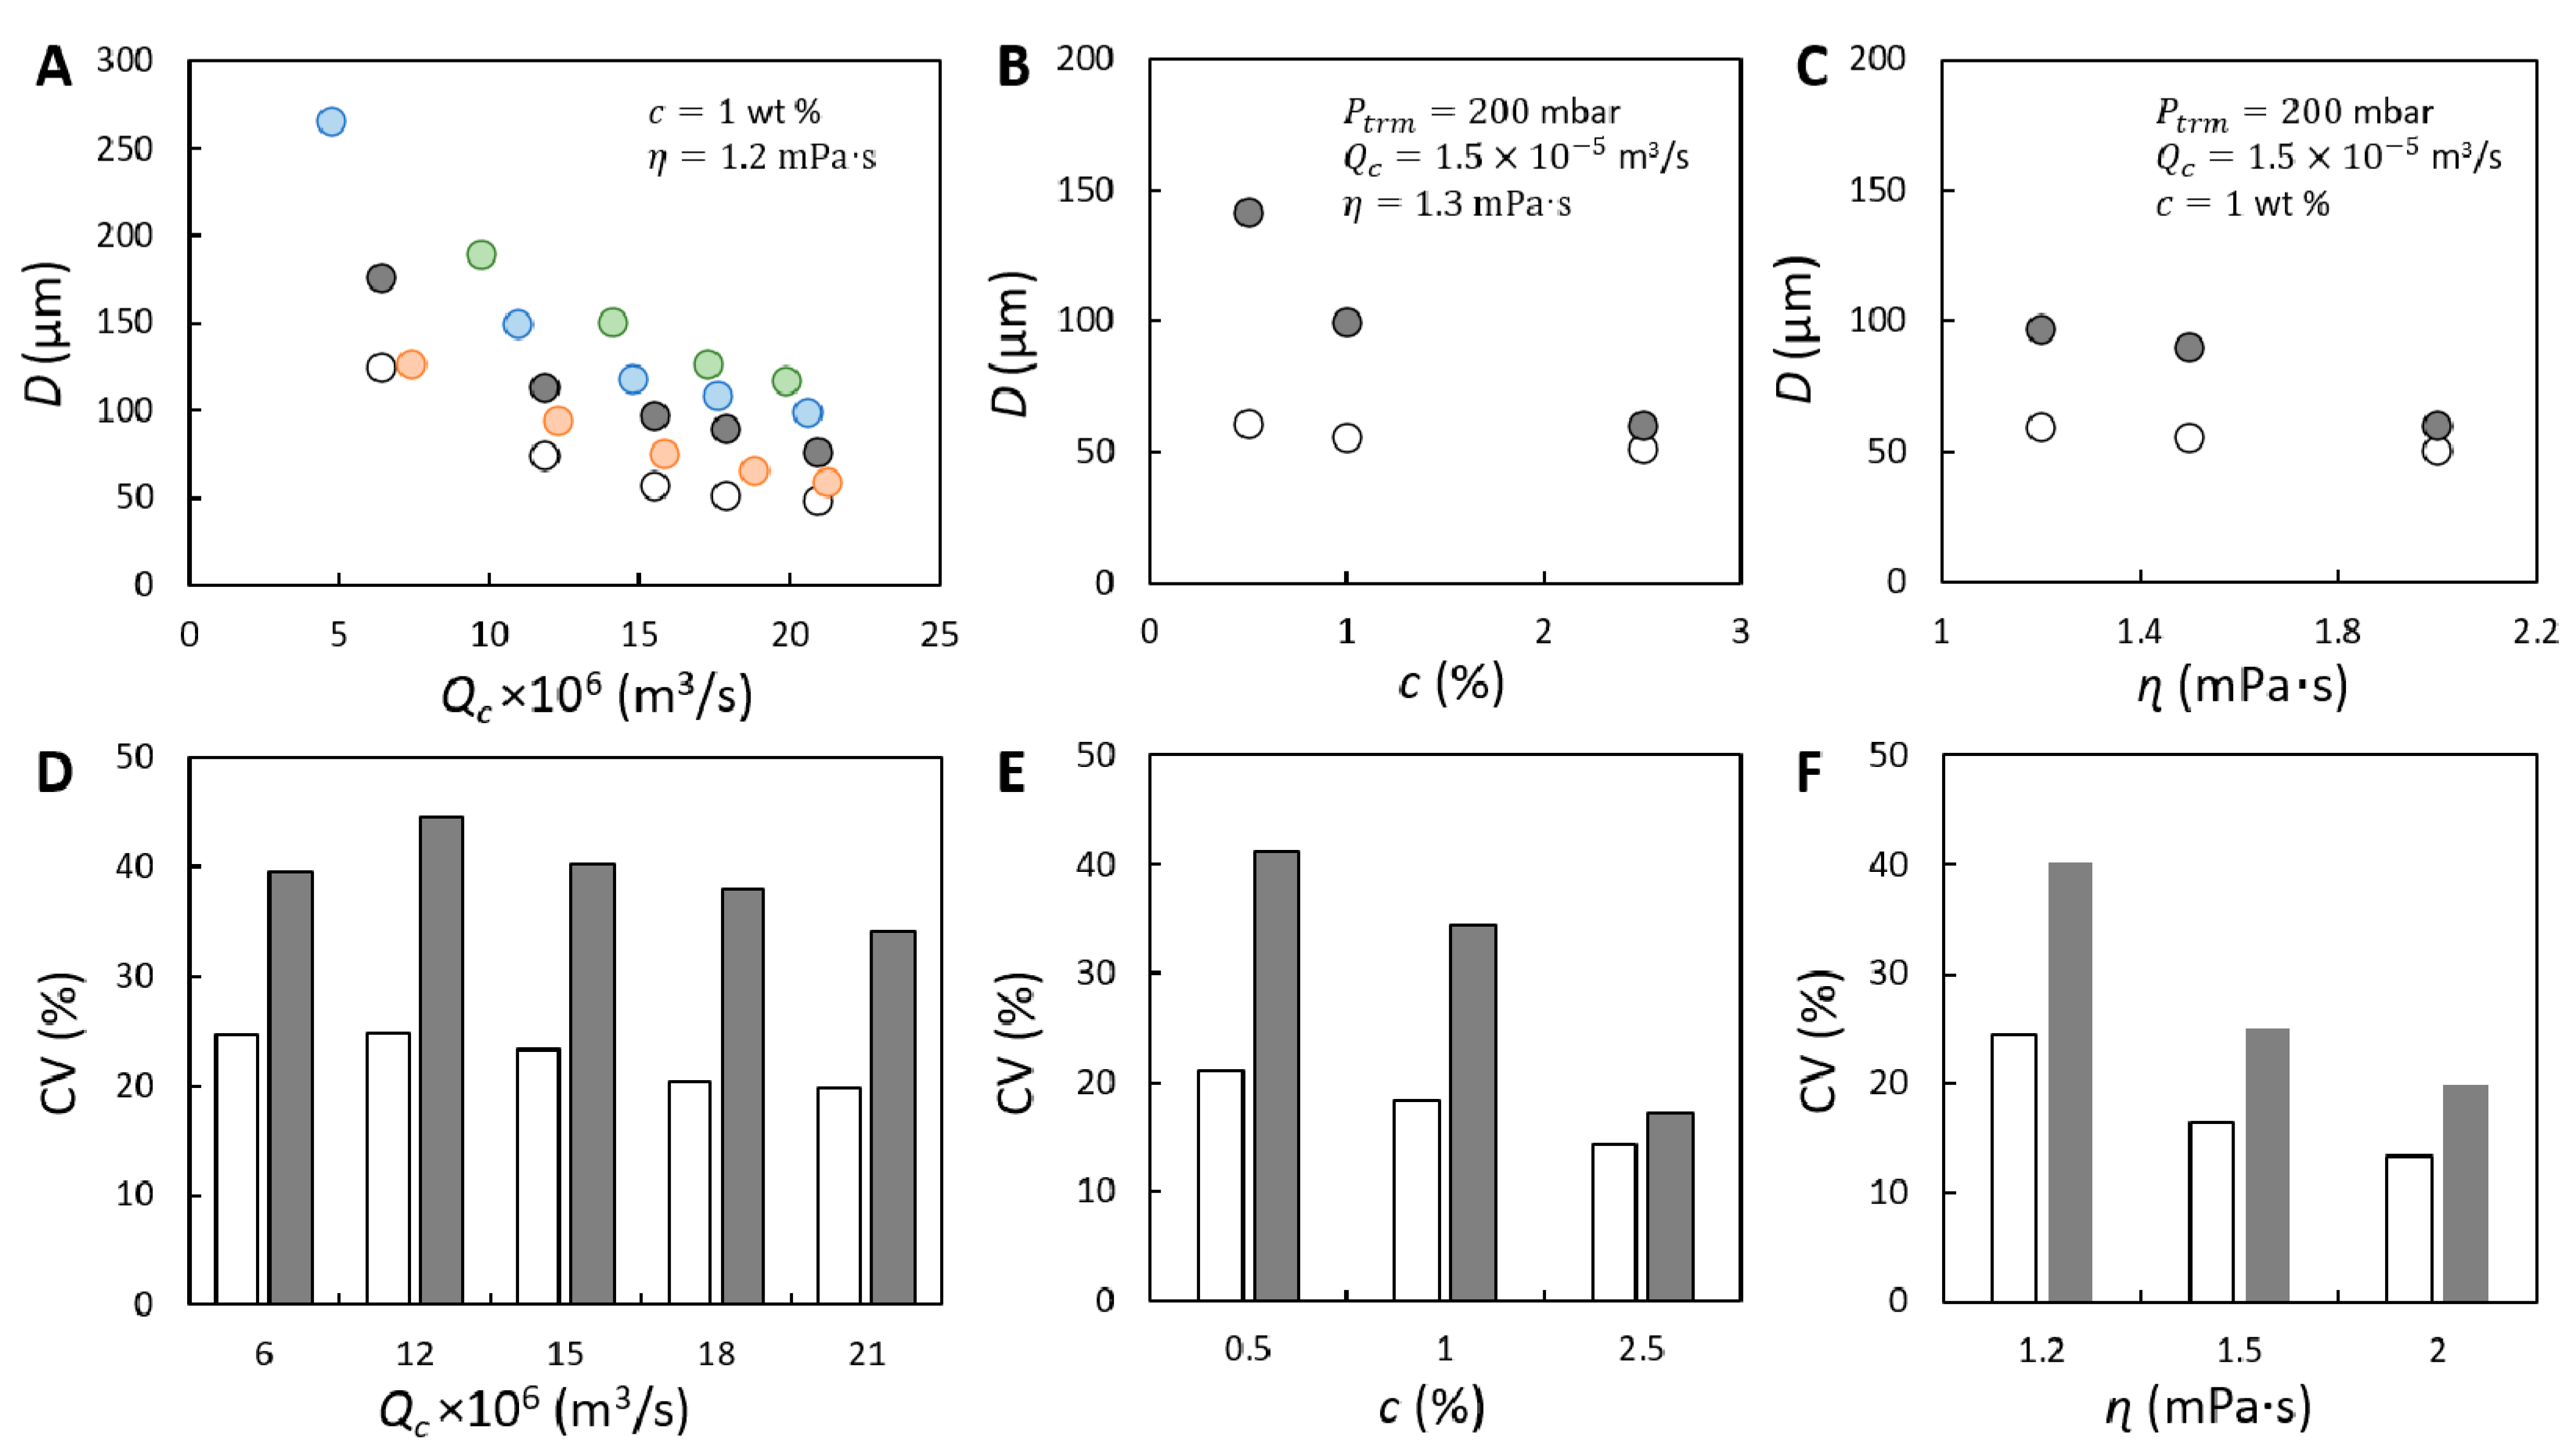
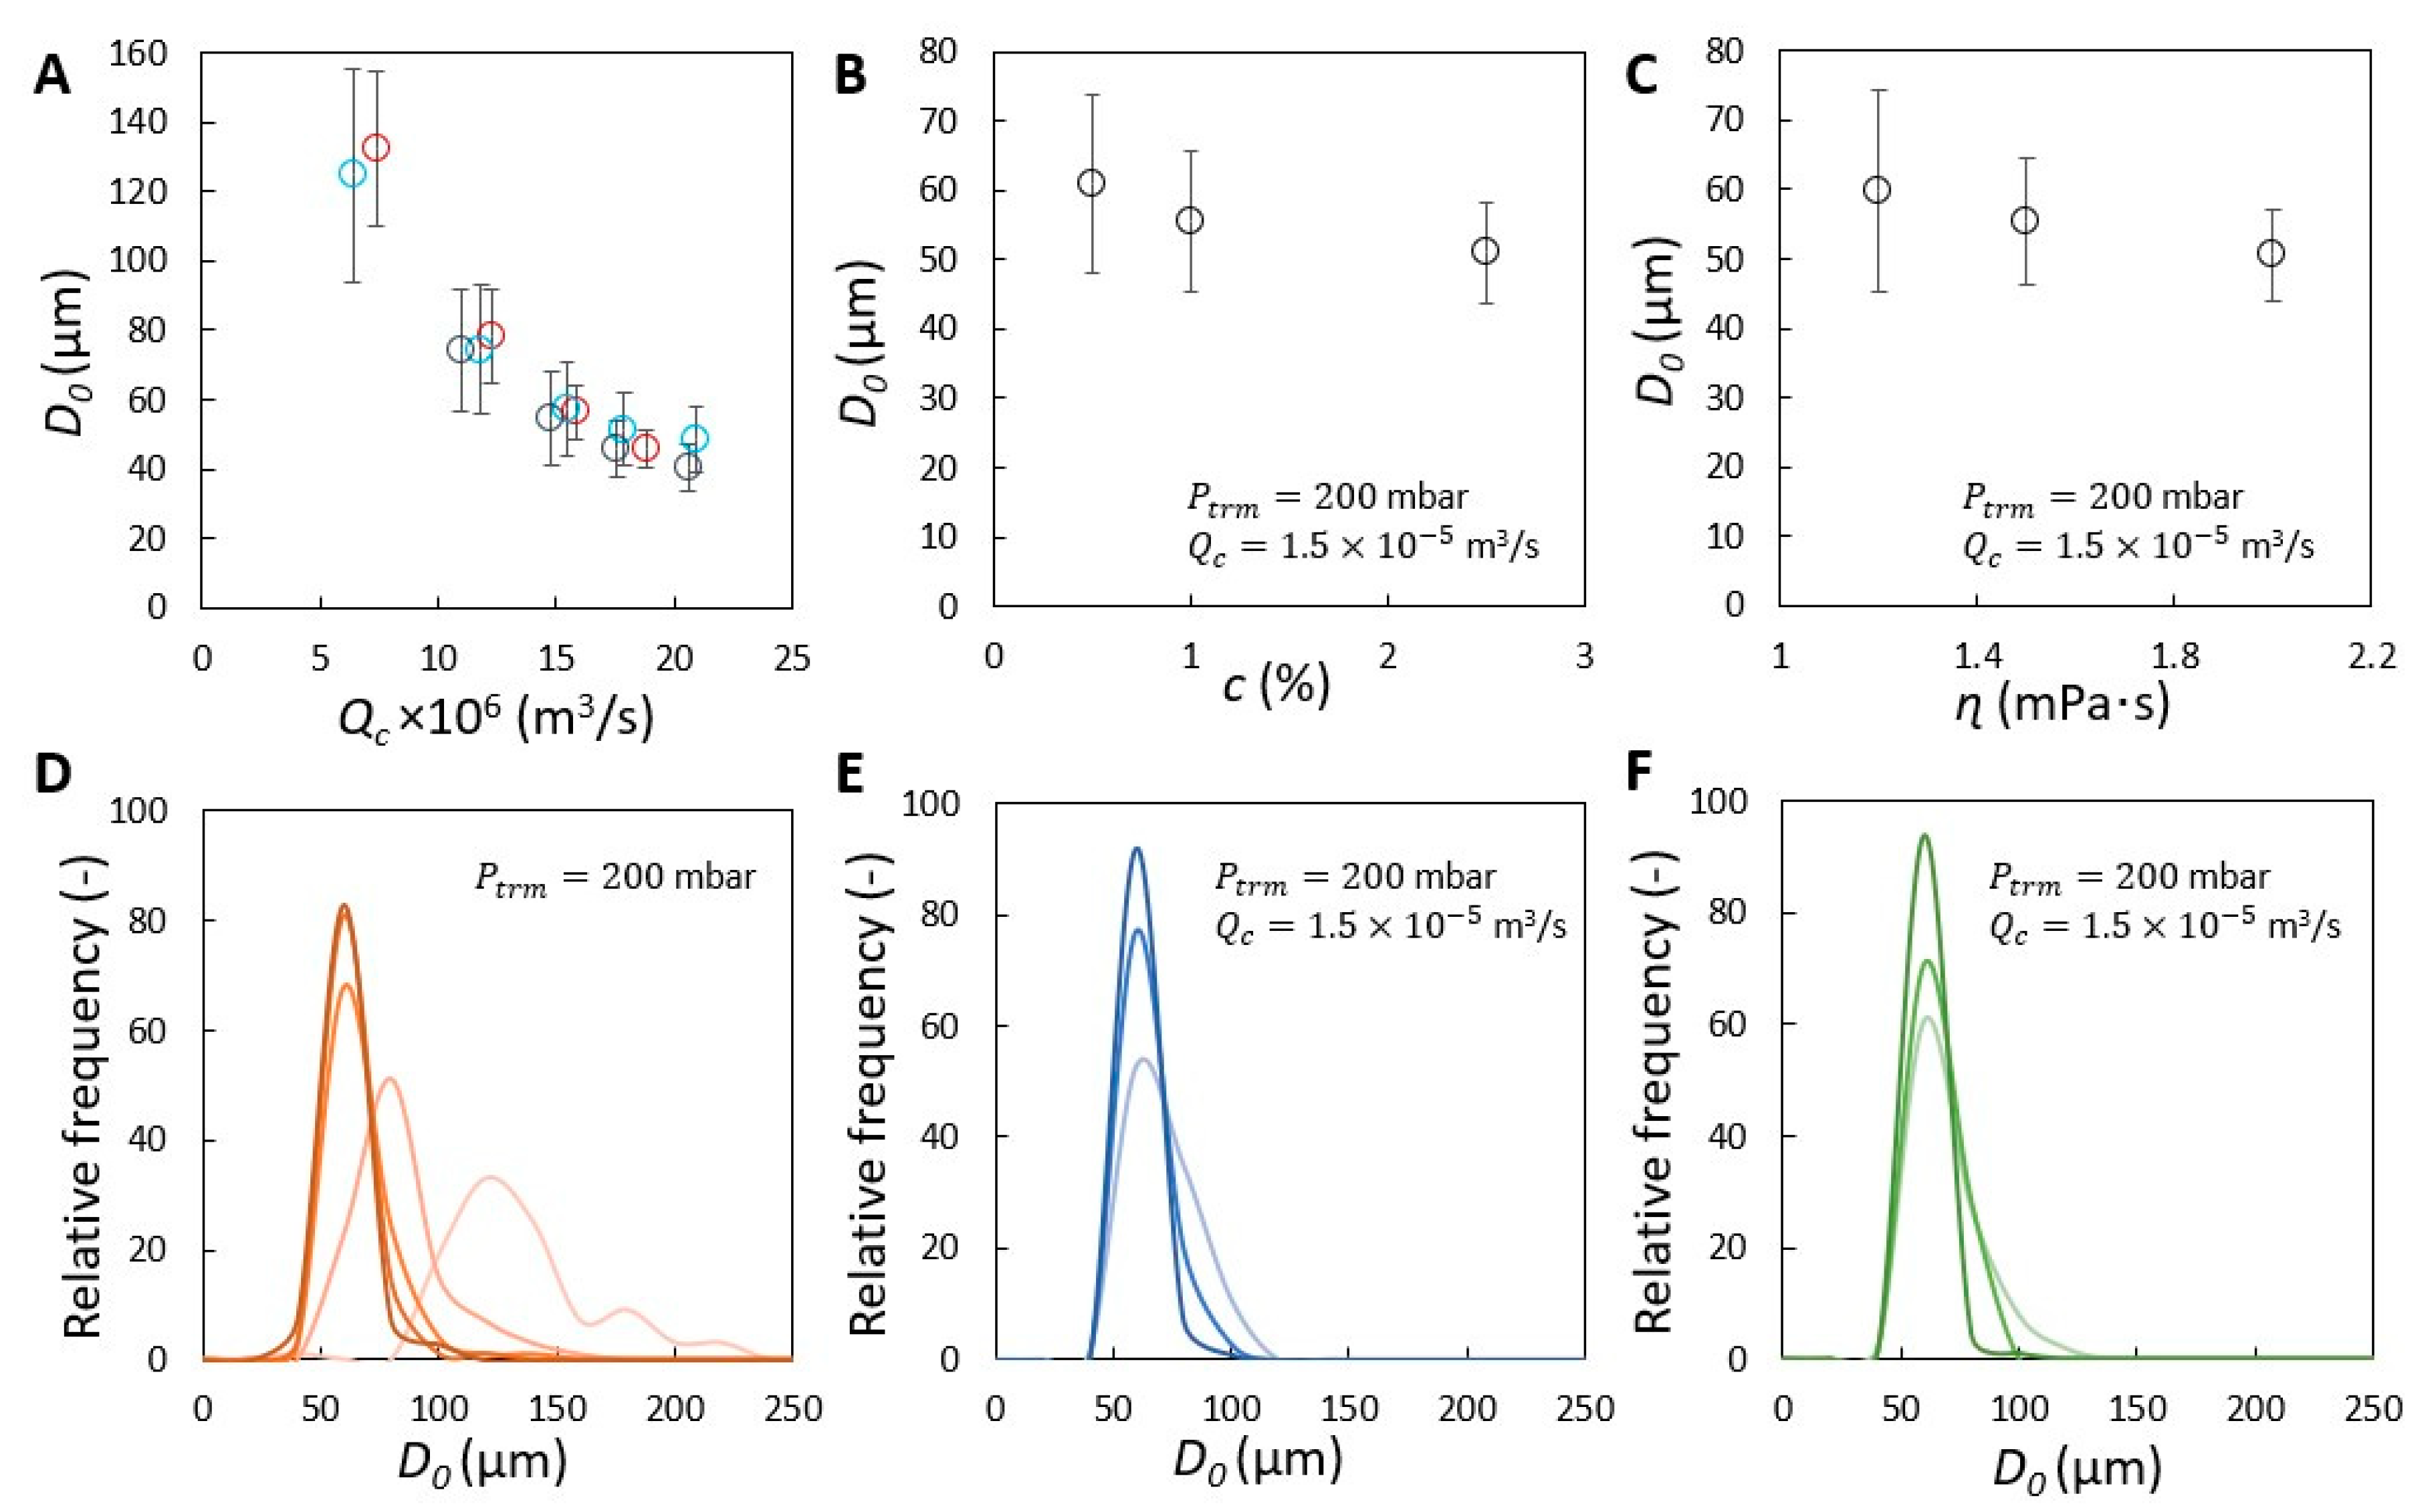
  ) mbar. In (A–C), the size of initial bubbles ( ) measured at 200 mbar is plotted for comparison and is presented with unfilled circle (
  ). Coefficient of variation (CV) corresponding to and measured at 200 mbar shown in (A–C) is presented in (D–F). The unfilled and filled bars represent the CV of initially formed and coalesced bubbles, respectively.
), 200 ( ), 300 ( ) and 400 ( ) mbar. In (A–C), the size of initial bubbles ( ) measured at 200 mbar is plotted for comparison and is presented with unfilled circle ( ). Coefficient of variation (CV) corresponding to and measured at 200 mbar shown in (A–C) is presented in (D–F). The unfilled and filled bars represent the CV of initially formed and coalesced bubbles, respectively.
). Coefficient of variation (CV) corresponding to and measured at 200 mbar shown in (A–C) is presented in (D–F). The unfilled and filled bars represent the CV of initially formed and coalesced bubbles, respectively.
), 200 ( ), 300 ( ) and 400 ( ) mbar. In (A–C), the size of initial bubbles ( ) measured at 200 mbar is plotted for comparison and is presented with unfilled circle ( ). Coefficient of variation (CV) corresponding to and measured at 200 mbar shown in (A–C) is presented in (D–F). The unfilled and filled bars represent the CV of initially formed and coalesced bubbles, respectively.
 ) as a function of the continuous phase flow rate. (B) Average volume of initial bubbles as a function of the bubble growing time for the effects of (O), (O), (O) and (O). The bubble volumes correspond to that presented in Figure 4A–C. The two timescales are derived based on 30 bubble formation events, focusing on bubble formation from three positions in the field of view of the membrane in the video recorded at a frame rate of 20,000 frames per second.
) as a function of the continuous phase flow rate. (B) Average volume of initial bubbles as a function of the bubble growing time for the effects of (O), (O), (O) and (O). The bubble volumes correspond to that presented in Figure 4A–C. The two timescales are derived based on 30 bubble formation events, focusing on bubble formation from three positions in the field of view of the membrane in the video recorded at a frame rate of 20,000 frames per second.
) as a function of the continuous phase flow rate. (B) Average volume of initial bubbles as a function of the bubble growing time for the effects of (O), (O), (O) and (O). The bubble volumes correspond to that presented in Figure 4A–C. The two timescales are derived based on 30 bubble formation events, focusing on bubble formation from three positions in the field of view of the membrane in the video recorded at a frame rate of 20,000 frames per second.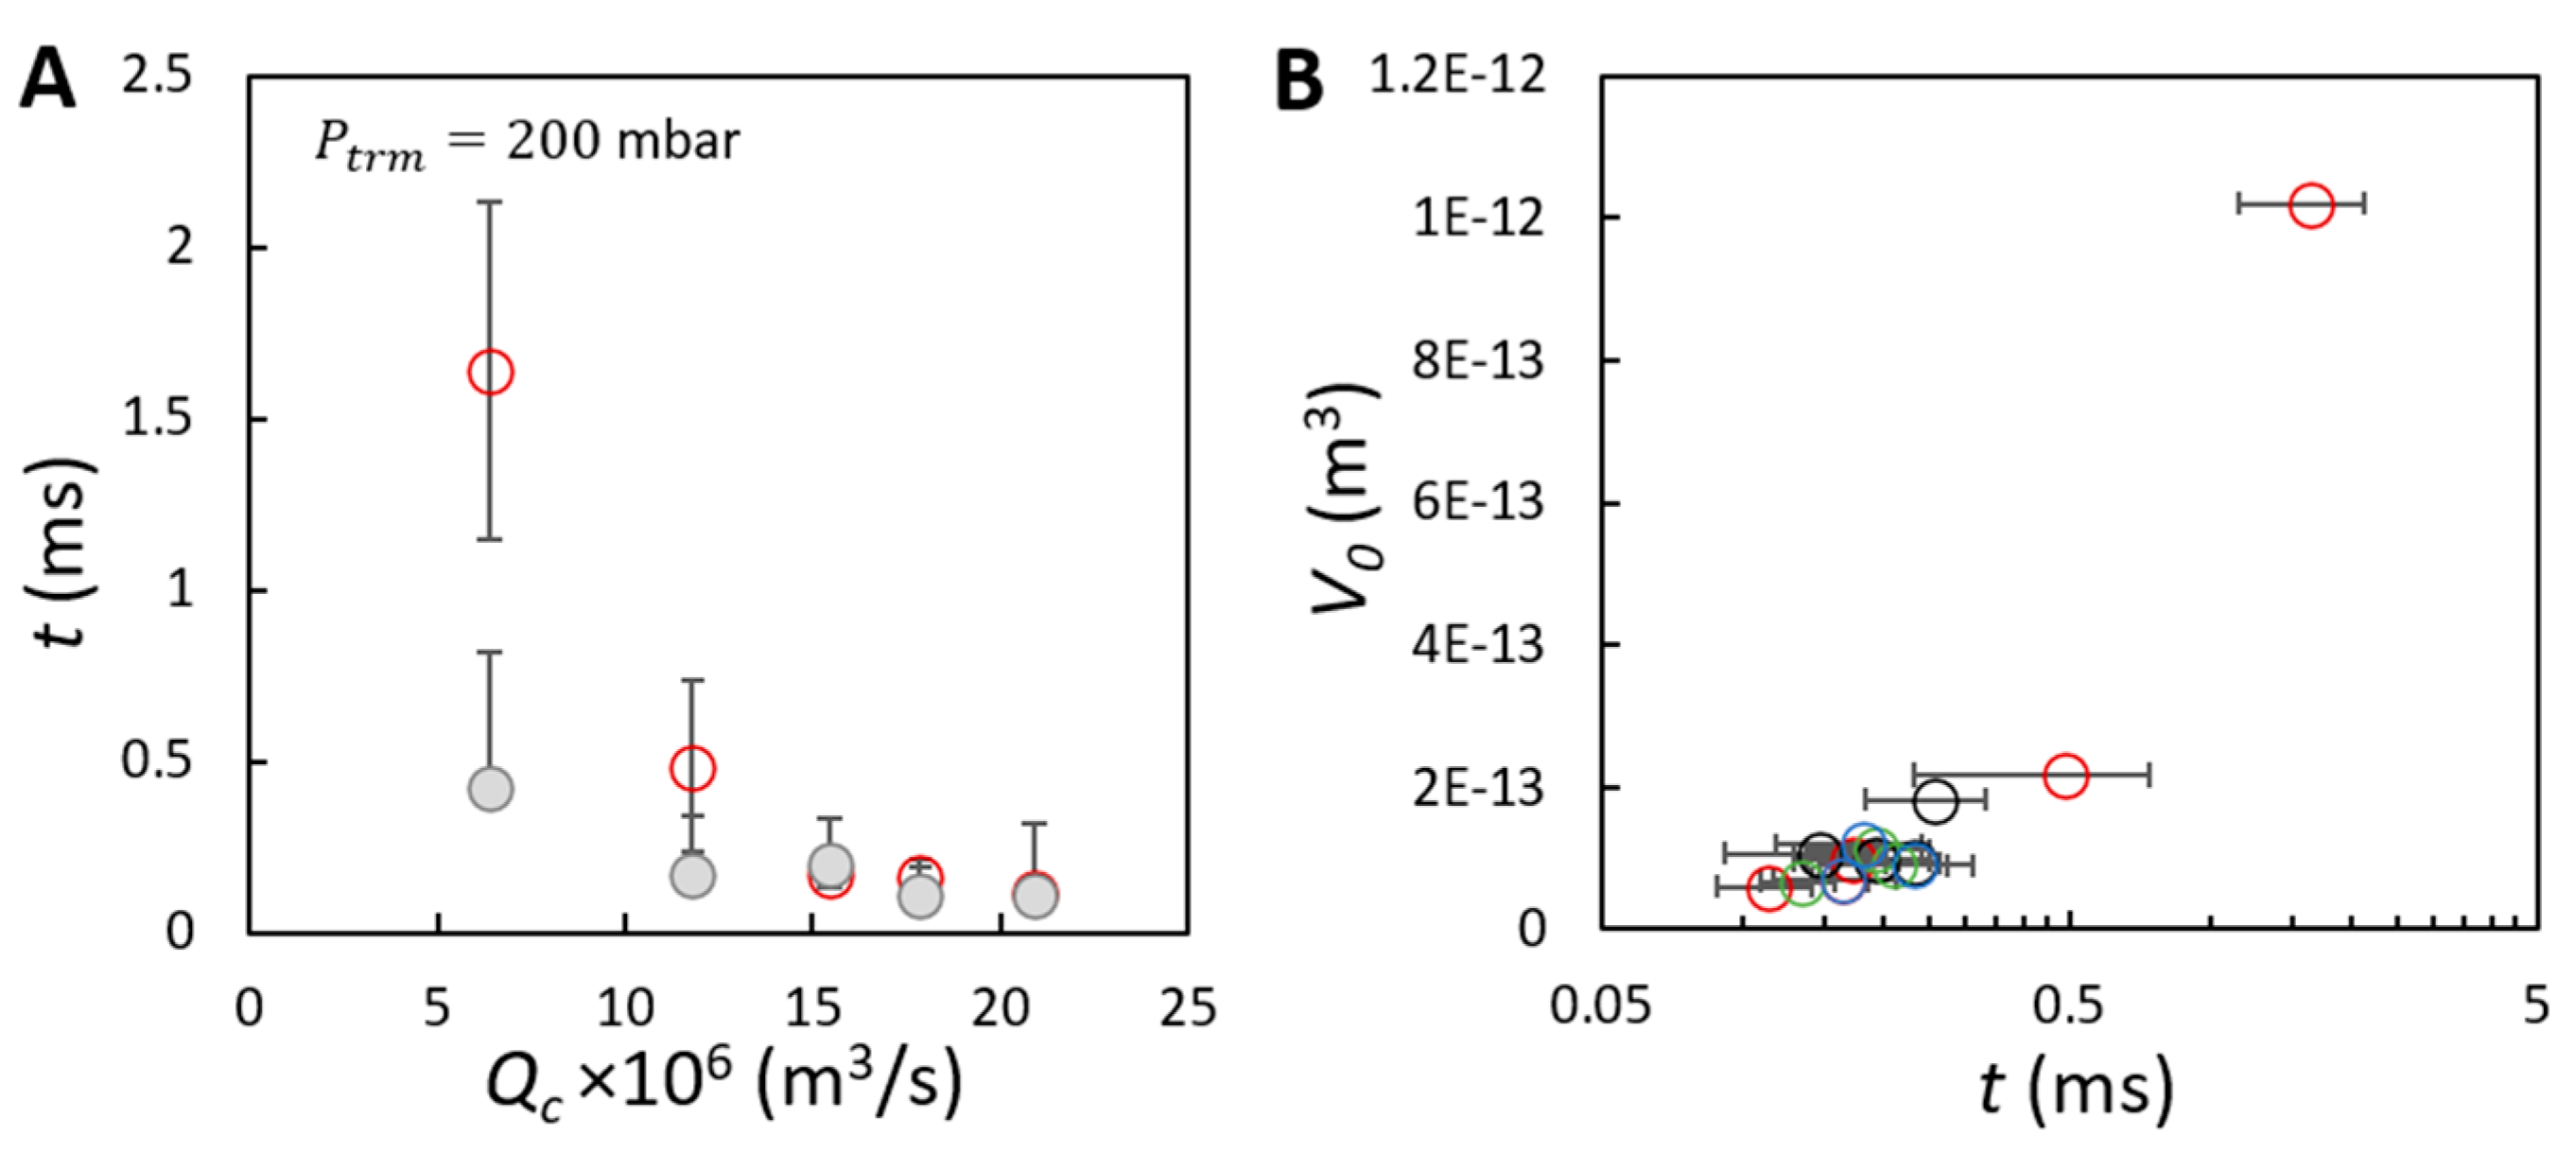
Publisher’s Note: MDPI stays neutral with regard to jurisdictional claims in published maps and institutional affiliations. |
© 2021 by the authors. Licensee MDPI, Basel, Switzerland. This article is an open access article distributed under the terms and conditions of the Creative Commons Attribution (CC BY) license (https://creativecommons.org/licenses/by/4.0/).
Share and Cite
Deng, B.; Neef, T.; Schroën, K.; de Ruiter, J. Mapping Bubble Formation and Coalescence in a Tubular Cross-Flow Membrane Foaming System. Membranes 2021, 11, 710. https://doi.org/10.3390/membranes11090710
Deng B, Neef T, Schroën K, de Ruiter J. Mapping Bubble Formation and Coalescence in a Tubular Cross-Flow Membrane Foaming System. Membranes. 2021; 11(9):710. https://doi.org/10.3390/membranes11090710
Chicago/Turabian StyleDeng, Boxin, Tessa Neef, Karin Schroën, and Jolet de Ruiter. 2021. "Mapping Bubble Formation and Coalescence in a Tubular Cross-Flow Membrane Foaming System" Membranes 11, no. 9: 710. https://doi.org/10.3390/membranes11090710
APA StyleDeng, B., Neef, T., Schroën, K., & de Ruiter, J. (2021). Mapping Bubble Formation and Coalescence in a Tubular Cross-Flow Membrane Foaming System. Membranes, 11(9), 710. https://doi.org/10.3390/membranes11090710