Article

Model of Hydraulic Resistance When Forecasting Reverse Osmosis in Water Treatment

by
Janina Piekutin
1,* and
Urszula Kotowska
2
1
Department of Technology in Environmental Engineering, Faculty of Civil Engineering and Environmental Sciences, Bialystok University of Technology, 45A Wiejska Street, 15-351 Bialystok, Poland
2
Department of Analytical and Inorganic Chemistry, Faculty of Chemistry, University of Bialystok, Ciołkowskiego 1K Street, 15-245 Bialystok, Poland
*
Author to whom correspondence should be addressed.
Membranes 2021, 11(5), 314; https://doi.org/10.3390/membranes11050314
Submission received: 9 April 2021 / Revised: 18 April 2021 / Accepted: 19 April 2021 / Published: 25 April 2021

Abstract

:
The article presents research on the treatment of infiltration water with increased ammonium ion and nitrate(V) content through reverse osmosis. Then, research was conducted on the phenomena related to the decrease in the permeability of the membrane used for the research. The search for an appropriate interpretation of the phenomena was carried out using mathematical modeling. Based on the assumptions of the hydraulic model of the filtration resistance, calculations were made to forecast the efficiency of the osmotic membrane used in the discussed process. For this purpose, the following indicators were determined experimentally for the membrane: change in the volumetric flow of treated wastewater during low-pressure filtration, total hydraulic resistance, and component resistances, i.e., the resistance of the “new” membrane and resistances resulting from the reversible and irreversible fouling phenomena. It has been observed that irreversible resistance arises in the short and early stages of the process. The efficiency is determined by reversible resistance, which is confirmed by the literature.

1. Introduction

The contamination of infiltration water with nitrogen compounds is more and more frequent, which means that classic systems for its treatment are more and more developed. Properly functioning infiltration should remove nitrogen compounds or significantly reduce their concentrations [1,2,3]. The cleaning processes taking place in the soil do not, however, guarantee satisfactory water quality. It is characterized by low turbidity and reduced content of organic substances. The degree of mineralization is much lower compared to groundwater. Due to the possibility of treating infiltration water with increased content of nitrogen compounds using reverse osmosis (RO), there is a need for technological research to learn about all the technical aspects of using the reverse osmosis method for purifying infiltration water [1,2,4,5]. An inherent element of membrane processes is reducing their efficiency related to the accumulation of organic or inorganic substances on the membrane surface, called fouling. This phenomenon occurs mainly in the case of porous membranes, i.e., microfiltration and ultrafiltration membranes, but may also occur in nanofiltration, reverse osmosis, or electrodialysis processes [1,5]. Fouling may be irreversible or reversible [1,2]. Characteristic for reversible fouling is the partial recovery of the membrane permeability due to its cleaning (mainly periodic hydraulic backwash). Particles that are not removed by mechanical or chemical cleaning of the membrane are responsible for the irreversible fouling, leading to the deterioration of the membrane performance. These are mainly particles adsorbed in the pores of the membrane [2,3]. Fouling can be described in terms of total resistance, which includes both the resistance of the membrane and the substances accumulated on the surface of the membrane and in its pores. Fouling also increases the transmembrane pressure during the process under steady flux conditions and a decrease in the permeate flux under constant transmembrane pressure conditions [4,5,6]. The pursuit of maximum efficiency is associated with finding the cause of lowering the permeate flux in the membrane filtration process. The nature of mass transport towards the membrane and back diffusion along the membrane surface (underflow conditions) determines the degree of mass accumulation near the membrane. It makes it possible to determine the resistance to the permeate flux where a precipitate or gel layer has formed on the membrane surface.
It makes it possible to determine the resistance to the permeate flux where a precipitate or gel layer has formed on the membrane surface. Mass transport processes can also resolve the critical conditions for the fouling of solutes on the membrane [1,6,7]. They contribute to lowering the efficiency of the process, thus harming its economy. To ensure the correct operation of the reverse osmosis installation, the rate and degree of blocking of the membranes with the feed should be determined. Membrane mass transport is complicated to model mathematically due to the complexity of the membrane transport mechanism and numerous interactions between all components of the so-called cross effect [6,7,8].
The search for an appropriate interpretation of the phenomena was carried out using mathematical modeling, which will allow researchers to determine the working conditions and learn about the advantages and limitations of using a given method [8,9]. Many mathematical models describe decreasing the volumetric permeate flux during the process of pressure membrane filtration conducted under steady and transient operating conditions. The obtained test results made it possible to verify the model of hydraulic filtration resistances based on the measurements of the change in the size of the RO permeate flux over time, the graphically determined value of the time constant characterizing the reduction of the process efficiency (to a value below economic profitability) and on the experimentally determined value of the resistances: the total membrane, the “not working” membrane, as well as resistances related to fouling phenomena.

Forecasting the Efficiency of Membranes in Reverse Osmosis in the Process of Purification of Infiltration Water with Increased Concentration of Nitrogen Compounds, Based on the Model of the Hydraulic Filtration Resistance

The modeling of the membrane performance was based on the analysis of the resistance of the flowing liquid membrane and the phenomena caused by the interaction: membrane—substances found in natural waters. The change in resistance in individual test cycles is associated with blocking membranes (fouling). The model of series resistances is based on the equation describing the dependence of the permeate flux on the transmembrane pressure, considering hydraulic resistance of the membrane to the liquid flowing through the membrane, resistance related to reversible fouling, and resistance related to irreversible fouling [7,10,11,12,13,14].
J v   =   Δ P η ( R m + R f o + R f n )
where:
Jv—temporary volumetric flux of permeate [m3 m−2·s−1];
Rm—membrane resistance value of the ”new” membrane [m−1];
Rfo—resistance to reversible fouling [m−1];
Rfn—resistance to irreversible fouling [m−1];
ΔP—transmembrane pressure [Pa];
η—dynamic viscosity of liquid [Pa·s].
The individual components of the resistance were determined:
From the relationship JvH2O = f(t) for a new membrane with deionized water, the value of the resistance of the new membrane (Rm) was determined. Since under these conditions of the process Rtotal = Rm, after transforming the Equation (1), we obtain the relationship:
R m = Δ P η · J H 2 O
where: JH2O—experimental temporary flux of deionized water [m3 m−2 s−1],
η—dynamic viscosity of liquid [Pa·s].
From a similar relationship, it is possible to calculate the total resistance for natural waters:
t o t a l = Δ P / η · J H 2 O
where: Rtotal—total hydraulic resistance of working membrane [m−1] (Rtotal = Rm + Rfo + Rfn)
η—dynamic viscosity of water at 20 °C
The resistance generated by the irreversible fouling effect results from permanent blockage of the membrane, making it difficult to restore its original performance [6,13]. To determine its value, the volumetric flow of the deionized water was determined for a polyamide membrane after reverse osmosis for infiltration water:
R f n ( Δ P / η · J H 2 O ) ) R m
where: Rfn—resistance related to irreversible fouling [m−1],
JvH2O—experimental temporary flux of deionized water after pressure filtration plant RO, [m3 m−2·s−1]
By subtracting the corresponding resistance values obtained in the three series of measurements, the reversible resistance Rfo, and the irreversible resistance, Rfn were calculated.
To determine the value of the experimental reversible fouling resistance of polyamide membranes, the following formula (Equation (5)) should be used:
Rfo exper = RtotalRmRfn
where: Rfo exper—experimental resistance of reversible fouling.
It was assumed that the changes in the reversible resistance over time could be described by the equation analogous to the Equation (6) defining the changes in the permeate flux over time:
d d t ( J 0 J ) + 1 t 0 · ( J 0 J   ) = 0
d d t ( R R f o ) + 1 t R O · ( R R f o   ) = 0
Integrating this equation we get:
R f o = R [ 1 e x p ( t t R O ) ]
where: Rfo—initial resistance of reversible fouling (Rfo = 0 at t = 0), [m−1];
R resistance of a reversible fouling over an infinitely long period of time [m−1];
tRO—time constant [min].
Equation (9) was used to determine the time constant tRO. The value of tRO is determined graphically from the equation:
t R O = | 1 a |
where: a—the slope of the line described by the equation y = a t, which characterizes the filtration process for the tested membrane.
After taking the logarithm, the equation of a straight line that passes through the origin of the system of coordinates was obtained. A coefficient tR0, which allowed the calculation of the theoretical reversible fouling resistance, was determined from the straight line inclination.
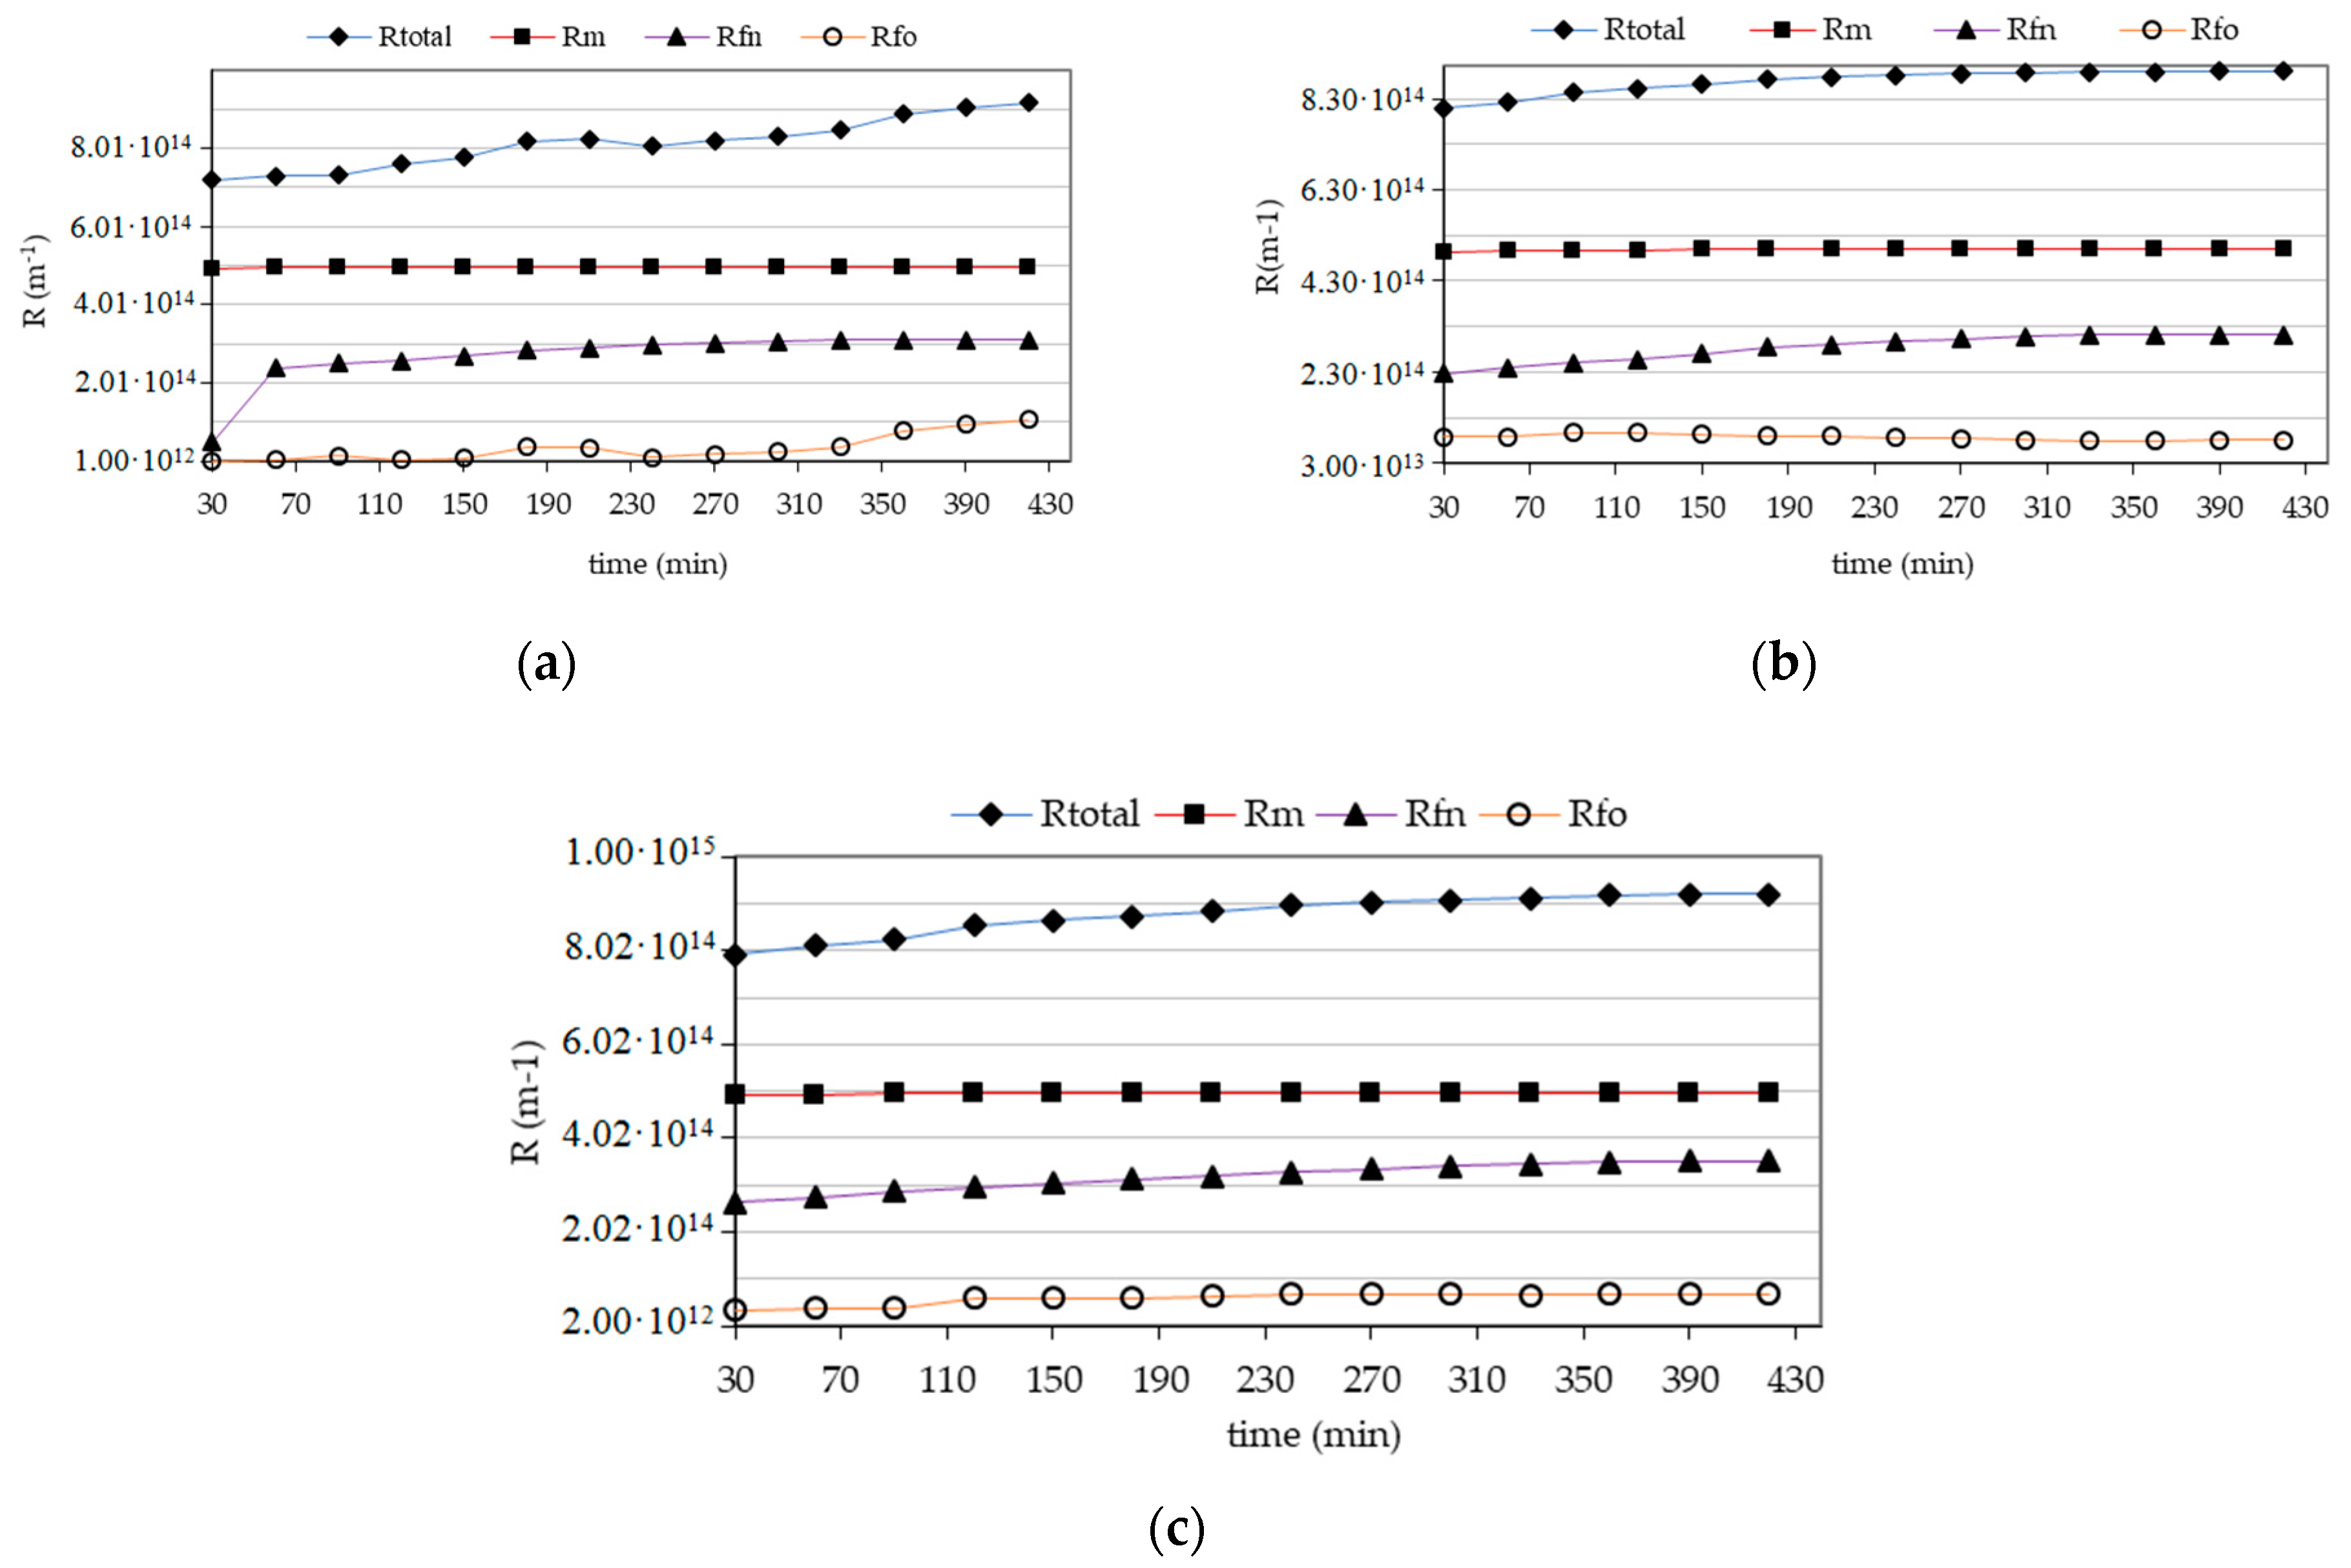
The use of the modeling of the membrane capacity based on the analysis of the hydraulic resistance of the water flowing through the membrane made it possible to determine the values of the individual components of the membrane resistance [13,14]. It was found that the irreversible resistance arising at the very beginning of the process for a membrane operating on the water is lower relating to water with ammonium ion and nitrates(V). It was at the level of 2.300–3.104 × 10¹⁴ m−1 in the infiltration water alone, from 2.272 × 10¹⁴ to 3.109 × 10¹⁴ m−1 with nitrates(V) and 2.645–3.524 × 10¹⁴ m−1 with ammonium ion.

2. Materials and Methods

2.1. Subject of Study

The research was carried out using infiltration water taken from infiltration wells. It was carried out in several stages, differing in terms of the adopted technological parameters and the types of infiltration and model water samples (infiltration and enriched with ammonium and nitrates(V)). The treatment efficiency of the tested water was assessed based on the retention coefficient. The following values of pollution indicators were investigated: color, turbidity, conductivity, reaction, calcium, magnesium, total iron, manganese, chlorides, ammonium, nitrates (III and V), and chemical oxygen demand (CODMn). The determinations were made using the test method on a HACH DR 4000 spectrophotometer (Hach Lange GmbH, Düsseldorf, Germany).

2.2. Technological Research

In the conducted research, the RO process was carried out in a continuous system with partial recirculation of the concentrate at a small reverse osmosis (RO) station. The tests were carried out on a composite membrane made of aromatic polyamide by Dow Filmtec (Edina, MN, USA) with a spiral module and an area of 2.5 m2 in a cross-flow filtration system. The osmotic membrane in the initial filtration was conditioned by filtering the distilled water in the range of transmembrane pressures of 1.1–1.2 MPa to obtain stable operating parameters. The transmembrane pressure was chosen based on the characteristics of the membrane manufacturer. Then, the infiltration water and the infiltration water with added nitrates(V) and ammonium ions were filtered. After 6 h of filtration of the test water through the membrane, the final testing of the membrane with deionized water was carried out for this part of the tests in the same way as in the initial filtration. The above work cycle was considered as one series. To ensure the RO membrane module’s correct operation, the SDI15 clogging index was determined for the infiltration water [11]. During the entire research period, the index was determined three times and ranged from 1.29 to 1.7.

3. Results and Discussion

During the purification of the infiltration water and model water (infiltration water + nitrogen compounds) performed with the use of RO (Table 1 and Table 2), it was noticed that the retention rates of the chemical compounds oscillated with a slight spread from the mean ± 10%. The turbidity and bacteria were eliminated.
The remaining parameters examined were removed in the range from 71% to 100%, except for nitrates(III), for which the retention coefficient was at the level of from 49% to 51% (Table 2).
During the purification of the infiltration water (Figure 1), a decrease in the volume flow of water (Jv) was observed in the first half an hour, which then reached the “pseudoconstant” value. A significant reduction in the deionized water stream was observed after testing on natural water. The performed disinfection and rinsing improved the properties of the membranes, although the obtained results were lower than in the test with deionized water performed for the new membrane. The Jv value for infiltration water was lower than for deionized water before and after the process (Figure 1).
To verify the proposed model for the experimental results, the resistance value due to reversible fouling was calculated using Equation (7) (Table 3, Figure 2). The volumetric permeate flux described by Equation (1) was calculated by substituting the values of membrane resistance and irreversible fouling resistance determined from the experiment—the value of the reversible resistance was calculated from the model Equation (7).
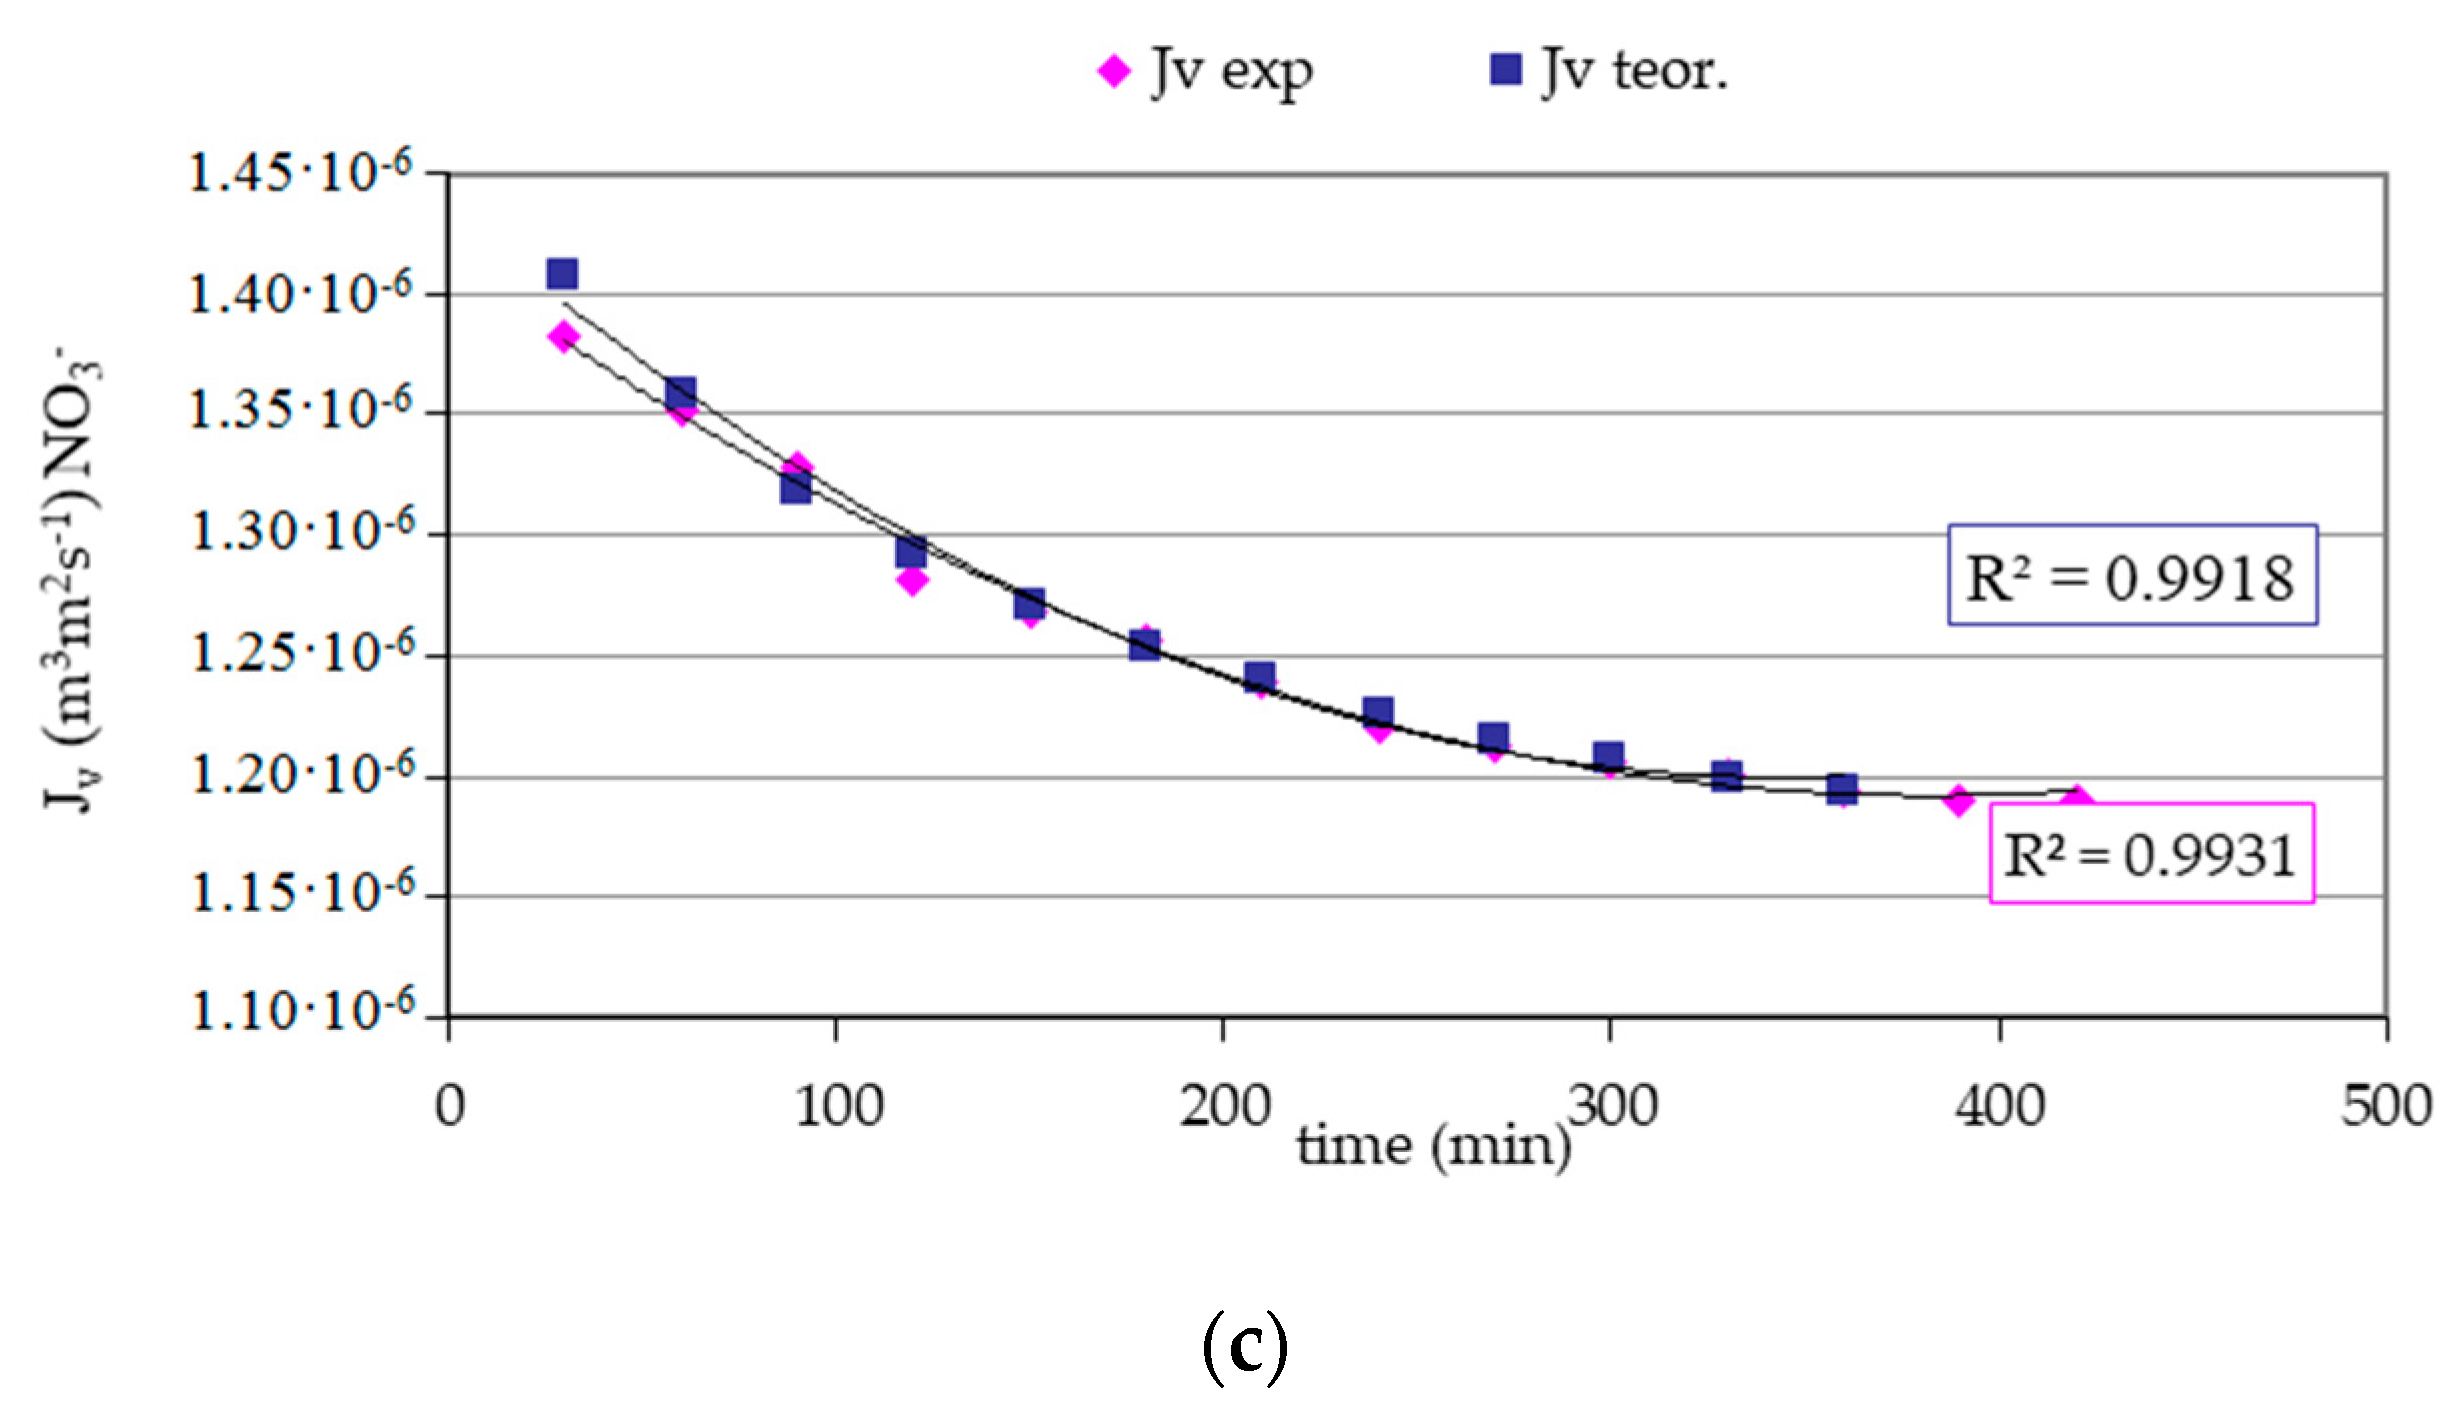
The obtained dependencies from the model calculations and the experimental measurement points are presented in Figure 1 and Figure 3.
Irreversible resistance in all examined cases systematically increased. However, there were no significant fluctuations or differences between the values of the tested samples. It was also found that in all empirical cases, the total resistance was in the range 7.199–9.17 × 10¹⁴ m−1 (Figure 3). Based on the obtained experimental values of the components of total resistances, the proposed model was verified by calculating the theoretical reversible resistance from the model equation (No. 7), and the coefficient of the equation tRo determined graphically, and then the theoretical permeate flux was calculated on their basis.
The resistance model of reversible contamination is correct, but requires more experimentation [13,15,16,17,18]. It is necessary to obtain the membrane characteristics with deionized water, both for the new membrane and after the “work” process, to determine the individual components of the resistance occurring in Equation (1) [9,19,20,21,22,23,24].
The most considerable difference between the empirical and theoretical reversible resistance in time tRo (Table 3) for Rfo experim. 1.829 × 10¹³ m−1, and Rfo theor. 6.974 × 10¹³ m−1 was recorded with the infiltration water alone. Much smaller fluctuations occurred in the NH4+ enriched infiltration water, where the experimental Rfo was at the level of 8.722 × 10¹³ m−1 and Rfo theor. 5.140 × 10¹³ m−1. In the case of NO3, the differences were minimal.
The obtained components of total resistance allowed us to determine the dependence of changes in the value of resistance on the concentration of individual nitrogen forms in the infiltration water. Function:
y = a · ( 1 e x p ( b ·   x ) ) + c
describes the relationship Rck, Rm, Rm + Rfn, Rfn, Rfo, Rfo theor. on the concentration of NO3, as well as Rck, Rm, Rm + Rfn, Rfn, Rfo theor. on the amount of NH4+, while for Rfo on the concentration of NH4+ the function took the form of a polynomial formula:
y = a + b∙x +c∙x2 + d∙x3 + e∙x4
There was no significant effect of changes in the concentration of nitrogen species in the infiltration water on the growth of individual resistance values (Rfo, Rfo theor., Rm).
The obtained values of the empirical and theoretical permeate flux in Figure 4 (calculated with the reversible resistance model) were characterized by slight differences among themselves. In general, the theoretical volumetric flux of permeate achieved results higher than or equal to the experimental one. In both cases, no significant stabilization of the flux was found after some time. For infiltration water, the observed dependence of the volumetric permeate flux on time reached Jv = 1.498 × 10⁻⁶ m3 m−2 s−1 at the beginning of the process, at the end 1.197 × 10⁻⁶ m3 m−2 s−1, and theoretical Jt = 1.525 ÷ 1.225 × 10⁻⁶ m3 m−2 s−1. During membrane filtration of the water enriched with ammonium ion, the initial value of the theoretical volumetric flux of the permeate was Jt = 1.457 × 10⁻⁶ m3 m−2 s−1, experimental Jv = 1.357 × 10⁻⁶ m3 m−2 s−1, and the final value was identical in both cases and equal to 1.233 × 10⁻⁶ m3 m−2 s −1. The relationships between the volumetric flow of the experimental and theoretical filtrate and time for water enriched with nitrates(V) were almost identical and ranged 1.407 ÷ 1.194 × 10⁻⁶ m3 m−2 s−1. The measure of compliance of the model fit with the experimental values is the calculated values of correlation, which in all tested cases were high and ranged from r = 0.8730 ÷ 0.9978. Additionally, the calculated percentage of deviation between the volumetric theoretical permeate flux and the experimental one was small and fluctuated from –0.45 ÷ 7.75%.
The verified model of the permeate flux value change based on Darcy’s law [10,14,15,16,17], described as temporal changes in mass transport resistances in the membrane process, was used to identify and estimate the resistances generated in the reverse osmosis process. During the RO process and its components, the total membrane resistance resulting from reversible and irreversible fouling and concentration polarization was determined. It has been shown that irreversible resistance arises in the short and initial period of the process. The efficiency is determined by reversible resistance, confirmed by the literature [18,19,20,21,22,23,24,25,26,27,28,29,30,31]. The values of individual resistances are much higher, relating to the values in other membrane processes. It is related to the more significant pressure difference occurring on both sides of the membrane, which is characteristic of this process [6,9,13,26,27,32]. Based on the research, it was found that the value of irreversible resistance increases over time and is much greater than the reversible resistance. Still, it did not exceed the membrane resistance. It should be assumed that there were substances in the water that tended to form a permanent deposit on the membrane, even though the SDI15 index was within the range for reverse osmosis [10,11]. The course of the determined resistances was stable, and the diaphragm’s resistance remained unchanged throughout the research period. The analysis of the obtained resistances relating to water quality confirms the influence of nitrogen forms on their value. The dependence of changes in reversible resistance with time was determined, obtaining a constant presented as tRO.

4. Conclusions

  • The obtained high values of the correlation coefficients in the case of comparing the instantaneous values of the experimental permeate fluxes with the theoretical instantaneous fluxes allow for the conclusion that that the model of hydraulic filtration resistance used in the calculations allows the forecasting of the membrane efficiency in the discussed process.
  • The resistance model for reversible contamination is correct. In order to determine this resistance, it is essential to obtain the membrane characteristics with deionized water, both for the new membrane and after the “working” process.
  • The value of irreversible fouling resistance is higher than the reversible resistance, indicating additional unrecognized contaminants in the water.
  • The analysis of the experimental data obtained in the process of purification of water with an increased concentration of nitrogen compounds with the use of the series resistances model enables the determination of the primary mass transport resistances, the resistance of the active layer of the membrane, as well as reversible and irreversible fouling, and also the identification and evaluation of the range of phenomena reducing the membrane’s efficiency.

Author Contributions

J.P. performed the experiment; conceived and designed the experiments, analyzed the data, and then wrote the paper. U.K. review & editing; funding acquisition. All authors have read and agreed to the published version of the manuscript.

Funding

This research was partially funded by Polish National Science Center, grant number 2019/33/B/NZ8/00012.

Institutional Review Board Statement

Not applicable.

Informed Consent Statement

Not applicable.

Data Availability Statement

Data sharing is not applicable to this article.

Acknowledgments

The research was carried out as part of the research work no. WZ/WB-IIŚ/2/2021 at the Białystok University of Technology and financed by a grant from the Minister of Science and Higher Education.

Conflicts of Interest

The authors declare no conflict of interest.

References

  1. Piekutin, J. Membrane processes associated with classical to surface water treatment. Pol. J. Environ. Stud. 2009, 2, 51–55. [Google Scholar]
  2. Dziubek, A.M.; Maćkiewicz, J. Direct filtration applied to infiltrated water treatment. Environ. Prot. Eng. 2002, 28, 39–45. [Google Scholar]
  3. Luo, M.; Wang, Z. Complex fouling and cleaning-in-place of a reverse osmosis desalination system. Desalination 2001, 141, 15–22. [Google Scholar] [CrossRef]
  4. Awadalla, F.T.; Striez, C.; Lamb, K. Removal of ammonium and nitrate ions from mine effluents by membrane technology. Sep. Sci. Technol. 1994, 29, 483–495. [Google Scholar] [CrossRef]
  5. Ghyoot, W.; Vandaele, S. Nitrogen removal from sludge reject water with a membrane-assisted bioreactor. Water Res. 1999, 33, 23–32. [Google Scholar] [CrossRef]
  6. Koyuncu, I.; Topacik, D. Application of the membrane technology to control ammonia in surface water. Water Sci. Technol. 2001, 1, 117–124. [Google Scholar] [CrossRef]
  7. Mielczarek, K.; Bohdziewicz, J. Performance prediction of ultrafiltration Treatment of post-process coke wastewater based on the assumptions of hydraulic filtration resistance model. Arch. Environ. Prot. 2011, 37, 107–118. [Google Scholar]
  8. Szaniawska, D.; Kuca, M. Fouling of ceramic membranes in the ultrafiltration process of protein and sodium chloride solutions. Inż. Ap. Chem. 2010, 49, 109–110. [Google Scholar]
  9. Bodzek, M.; Konieczny, K. Membrane Techniques in the Removal of Inorganic Anionic Micropollutants from Water Environment–State of the Art. Arch. Environ. Prot. 2011, 37, 15–29. [Google Scholar]
  10. Piekutin, J. Estimate of possibilities removal of selected nitrogen forms from infiltration water and optimization of reversed osmosis system. ECE 2008, 15, 9–16. [Google Scholar]
  11. ASTM. Standard Test Method for Silt Density Index (SDI) of Water, in Designation: D 4189—95 (Reapproved 2002); ASTM International: West Conshohocken, PA, USA, 2002. [Google Scholar]
  12. Lee, S.; Lueptow, R.M. Rotating reverse osmosis: A dynamic model for flux and rejection. J. Membr. Sci. 2001, 192, 129–143. [Google Scholar] [CrossRef]
  13. Costa, M.L.; Dickons, J.M. Modelling of modules and systems in reverse osmosis. Part I: Theoretical system design model development. Desalination 1991, 80, 251–274. [Google Scholar] [CrossRef]
  14. Konieczny, K.; Rafa, J. Modeling of the membrane filtration process of natural waters. Pol. J. Environ. Stud. 2000, 9, 57–64. [Google Scholar]
  15. Kargol, A. Mechanistic model of transport processes in porous membranes generated by osmotic and hydrostatic pressures. J. Membr. Sci. 2001, 19, 61–69. [Google Scholar] [CrossRef]
  16. Chen, K.L.; Song, L.; Ong, S.L.; Ng, W.J. The development of membrane fouling in full-scale RO processes. J. Membr. Sci. 2004, 232, 63–72. [Google Scholar] [CrossRef]
  17. Košutić, K.; Kunst, B. RO and NF membrane fouling and cleaning and pore size distribution variations. Desalination 2002, 150, 113–120. [Google Scholar] [CrossRef]
  18. Konieczny, K. Ultrafiltration and microfiltration in water treatment for municipal purposes. Sci. J. Sil. Univ. Technol. 2002, 42, 29–39. (In Polish) [Google Scholar]
  19. Amiri, M.C.; Samiei, M. Enhancing permeate flux in a RO plant by controlling membrane fouling. Desalination 2007, 207, 361–369. [Google Scholar] [CrossRef]
  20. Ruiz-García, A.; Melián-Martel, N.; Nuez, I. Short Review on Predicting Fouling in RO. Membranes 2017, 7, 62. [Google Scholar] [CrossRef] [Green Version]
  21. Jepsen, K.L.; Bram, M.V.; Pedersen, S.; Yang, Z. Membrane Fouling for Produced Water Treatment: A Review Study From a Process Control Perspective. Water 2018, 10, 847. [Google Scholar] [CrossRef] [Green Version]
  22. Carter, J.W.; Hoyland, G.; Hasting, A.P.M. Concentration polarisation in reverse osmosis flow systems under laminar conditions. Effect of surface roughness and fouling. Chem. Eng. Sci. 1974, 29, 1651–1658. [Google Scholar] [CrossRef]
  23. Hirose, M.; Ito, H.; Kamiyama, Y. Effect of skin layer surface structures on the flux behaviour of RO membranes. J. Membr. Sci. 1996, 121, 209–215. [Google Scholar] [CrossRef]
  24. Mohammadi, T.; Kazemimoghadam, M.; Saadabadi, M. Modeling of membrane fouling and flux decline in reverse osmosis during separation of oil in water emulsions. Desalination 2003, 157, 369–375. [Google Scholar] [CrossRef]
  25. Kostogloua, M.; Karabelasb, A.J. A mathematical study of the evolution of fouling and operating parameters throughout membrane sheets comprising spiral wound modules. Chem. Eng. J. 2012, 187, 222–231. [Google Scholar] [CrossRef]
  26. Li, H.; Xia, H.; Mei, Y.X. Modeling organic fouling of reverse osmosis membrane: From adsorption to fouling layer formation. Desalination 2016, 386, 25–31. [Google Scholar] [CrossRef]
  27. Pascual, X.; Gub, H.; Bartman, A.R.; Zhu, A.; Rahardianto, A.; Giralt, J.; Rallo, R.; Christofides, P.D.; Cohen, Y. Data-driven models of steady state and transient operations of spiral-wound RO plant. Desalination 2013, 316, 154–161. [Google Scholar] [CrossRef]
  28. Weinrich, L.; Haas, C.N.; LeChevallier, M.W. Recent advances in measuring and modeling reverse osmosis membrane fouling in seawater desalination: A review. J. Water Reuse Desalination 2013, 3, 85–101. [Google Scholar] [CrossRef] [Green Version]
  29. Hadadian, Z.; Zahmatkesh, S.; Ansari, M.; Haghighi, A.; Moghimipour, E. Mathematical and experimental modeling of reverse osmosis (RO) process. Sep. Technol. Thermodyn. 2021, 38, 366–379. [Google Scholar]
  30. Xianhui, L.; Danyan, Y.; Genghong, A.; Dawei, J.; Jianxin, L. Fouling and Cleaning of Reverse Osmosis Membranes duing Municipal Tap Water Treatment on a Pilot-Scale Plant. J. Water Sustain. 2011, 1, 139–151. [Google Scholar]
  31. Zhang, Z.; Li, S.; Mi, B.; Wang, J.; Jianning, D. Surface slip on rotating graphene membrane enables the temporal selectivity that breaks the permeability-selectivity trade-off. Sci. Adv. 2020, 6, eaba9471. [Google Scholar] [CrossRef]
  32. Mi, B. Scaling up nanoporous graphene membranes. Science 2019, 364, 1033–1034. [Google Scholar] [CrossRef] [PubMed]
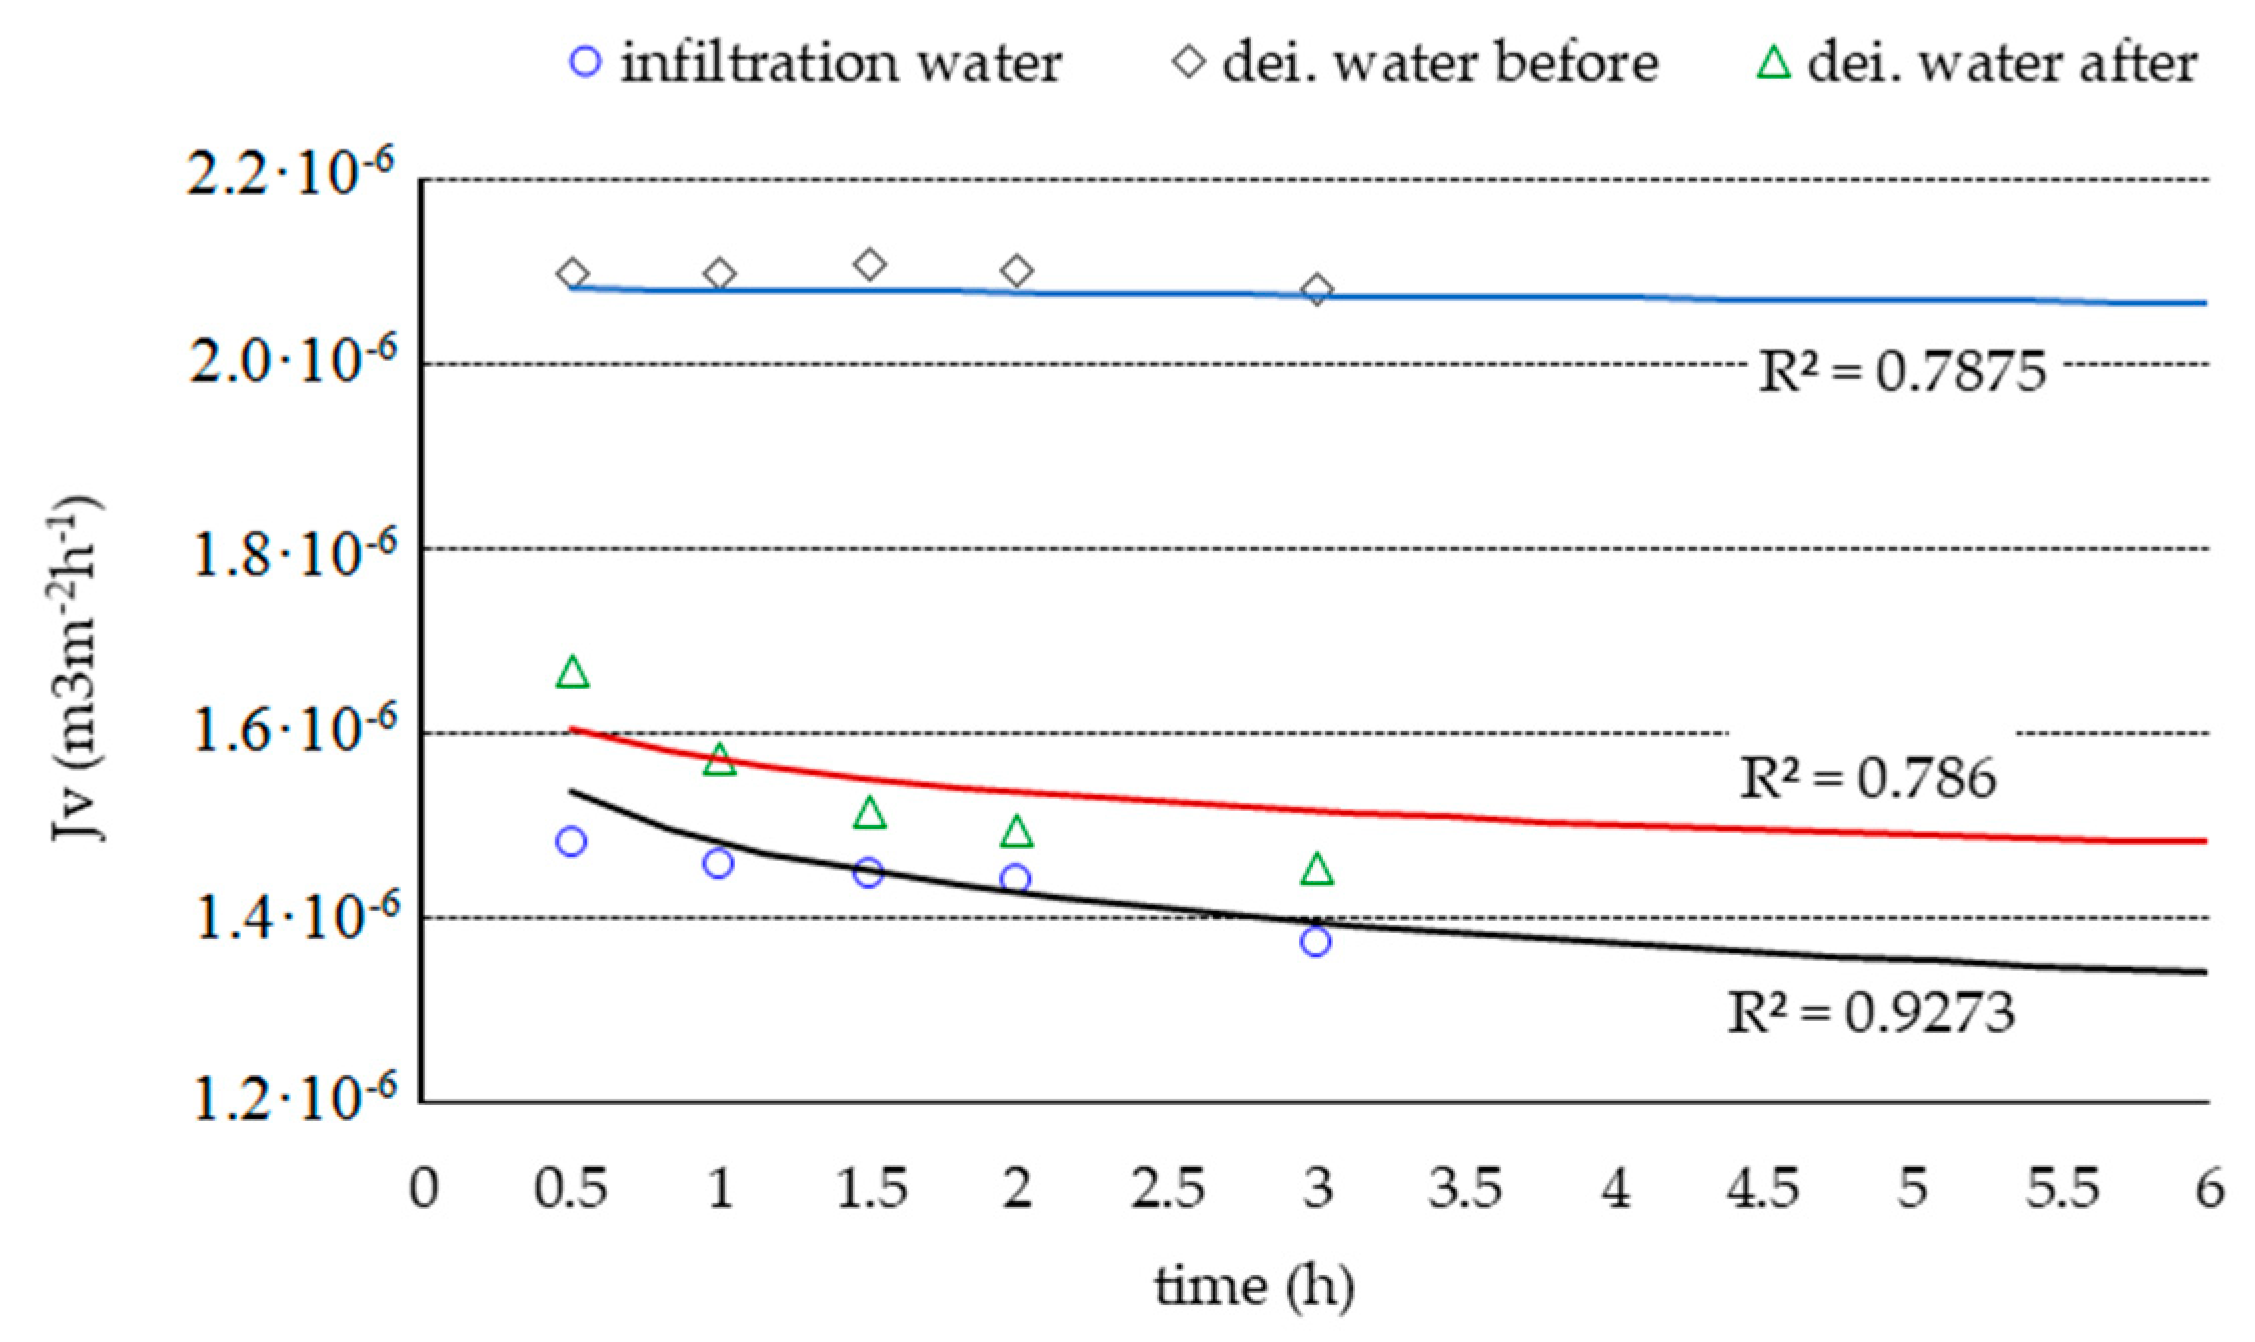
Figure 1. Dependence of the volumetric stream of deionized water and infiltration water on time, where: dei. water—deionized water.
Membranes 11 00314 g001
Figure 2. The method of determining the constant tR0 of the reverse osmosis process: (a) NH4+ enriched infiltration water, (b) NO3 enriched infiltration water.
Membranes 11 00314 g002
Figure 3. Dependence of changes in resistance Rtotal, Rm, Rfo, Rfn as a function of time for the membrane during filtration of infiltration water and with increased content of NH4+ and NO3, (a) infiltration water, (b) infiltration water with NH4+, (c) infiltration water with NO3.
Membranes 11 00314 g003
Figure 4. The dependence of the experimental and theoretical volumetric flux (calculated with the reversible resistance model) on time for: (a) infiltration water, (b) infiltration water with NH4+, (c) infiltration water with NO3, where: Jv expeJv experimental, Jv theorJv theoretical.
Membranes 11 00314 g004aMembranes 11 00314 g004b
Table 1. Effectiveness of removing selected contaminants from infiltration water in the RO process.
Test ParameterUnitRaw WaterInfiltrateRetention Factor R (%)
ValuesValuesValues
MeanMedianMeanMedianMeanMedian
Colormg Pt/L42.4644.001.231.0097.3197.42
Turbiditymg SiO2/L5.642.000.00.0100.0100.0
ConductivityµS/cm433.0424.007.547.0098.4098.40
ReactionpH7.187.206.086.00--
Calciummg Ca2+/L84.9382.300.890.0099.21100.0
Manganesemg Mn/L0.190.190.050.0477.7178.90
Ferrumtot.mg Fe/L0.710.610.030.0395.7095.71
Chloridesmg Cl/L19.3014.000.850.7094.9093.83
Nitrate(V)mg NO3/L3.3553.800.0450.02099.11100.00
Nitrate(III)mg NO2/L0.0250.0250.0130.01349.6050.81
Ammonia ionmg NH4+/L0.5870.450.0220.02095.1096.00
CODMnmg O2/L10.029.200.430.3389.3990.15
Table 2. The results of the removal of individual indicators at an increased dose of NH4+ ammonia ion and NO3.
Test ParameterValueRetention Factor [%]
Color [mg Pt/L]39.074.3
Turbidity [SiO2/L]39.0100
Conductance [µS/cm]54388.45
pH7.30-
Calcium [mg Ca2+/L]82.692.4
Manganese [mg Mn/L]0.1875.0
Ferrum [mg Fe/L]0.6784.8
Chlorides [mg Cl/L]16.276,0
Nitrate(V) [mg NO3/L]14871.3
Nitrate(III) [mg NO2/L]0.0288.0
Ammonia ion [mg NH4+/L]12.683.6
CODMn [mg O2/L]10.770.7
Table 3. Rfo resistance values determined from the experiment and theoretical for tRO.
Water TypeResistance Rfo Determined from the Experiment (m−1)Resistance Rfo Calculated from the Formula
(m−1)
tRO Calculated from the Formula
(min)
Infiltration water1.829 × 10136.974 × 1013156.0
Infiltration water amended with NH4+8.722 × 10135.140 × 101365.0
Infiltration water amended with NO34.085 × 10134.671 × 101383.0
Publisher’s Note: MDPI stays neutral with regard to jurisdictional claims in published maps and institutional affiliations.