1. Introduction
Zeolites are microporous materials which are commercially used as adsorbents in size and shape selective separation of molecular species and as catalysts in the petrochemical industry [
1]. Due to their well-ordered pore structure, guest molecules adsorbed in zeolites exhibit behavior that differs considerably from the behavior of these molecules in their bulk systems [
2]. This deviation of the behavior of guest molecules from the bulk is significantly enhanced for pores with smaller dimensions. This happens, for example, in zeolites like ZSM-5, which has a network of interconnected channel-like pores of diameter 0.55 nm (0.56 × 0.53 nm
2 in the
a–
b plane running along
c axis) [
3]. The strict geometrical restriction imposed by smaller pores of this dimension results in strong confinement of the guest molecules and leads to anomalous diffusion. This anomalous diffusion, which is mostly sub-diffusive, can in some severe cases even lead to single-file diffusion [
4]. In addition to the geometrical restriction imposed by the nano-porous substrate, interactions between the guest molecule and the substrate can also put severe limitations on the diffusion of guest molecules. In particular, strong electrostatic interactions between the guest and the substrate can immobilize the guest molecules [
5,
6]. The presence of electrostatic interactions is responsible for the difference in the behavior of small hydrocarbons that are apolar and CO
2 which has a quadrupole moment. This difference makes CO
2 preferentially adsorb on a silica surface by displacing apolar hydrocarbons [
7,
8,
9,
10]. This strong preferential adsorption of CO
2 due to its quadrupole moment also facilitates the separation of CO
2 from a mixture of hydrocarbons [
11,
12].
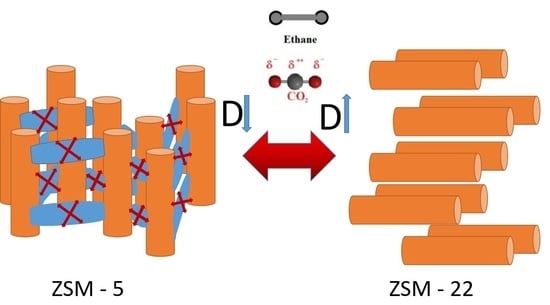
The dynamics of guest molecules through nano-pores of a zeolite membrane is an important aspect of membrane technology. While the geometry and dimensions of the confining pores have a strong effect on the behavior of the guest molecules, the character of the inter-connectivity can also play an important role [
13]. Although the effects of pore size and shape on the behavior of guest molecules have been extensively studied, the effects of pore connectivity remain relatively less explored. For this purpose, zeolites ZSM-5 and ZSM-22 provide a very good opportunity because both have a network of similar channel-like pores of ~0.55 nm diameter oriented parallel to the crystallographic axis
b in ZSM-5 and
c in ZSM-22, but with interconnecting pores in the
a–c plane in a sinusoidal arrangement in the former versus isolated channels in ZSM-22. A comparison of the behavior of guest molecules in ZSM-5 and ZSM-22 can therefore reveal important insights on the role of pore connectivity in the behavior of guest molecules confined in sub-nanometer pores. Although the effects of pore connectivity involve a variety of other factors including the degrees of connectivity, pore volume, and surface areas, the simple comparison mentioned above can be a first step toward understanding the complex interplay between these factors.
To understand the role of electrostatic interactions and pore connectivity on the structure and dynamics of guest molecules confined in sub-nanometer pores of zeolitic materials, we report here MD simulation studies on ethane or CO
2 confined in ZSM-22 pores. In this work, we study the different ways that the inter-connectivity of pores in a zeolite membrane may affect the structure and dynamics of typical guest molecules, thereby revealing important insights on this aspect of membrane technology. Comparative studies of the behavior of ethane and CO
2 to understand the role of the quadrupole moment of CO
2 have also been reported earlier [
14,
15]. The results obtained here for ZSM-22 are compared with those reported for ZSM-5 earlier [
14] to understand the role of pore connectivity. Further, in some simulations reported here, the pores of ZSM-22 are connected artificially by inserting empty space connecting the pores. These simulations show that the quadrupole moment of CO
2 and the pore connectivity of the substrate play an important role in determining the behavior of the confined species. We describe all the simulations carried out and reported here in
Section 2, after which the salient results from them are listed in
Section 3. In
Section 4, we discuss the implications of the results and how they reveal the role of pore connectivity. Finally, we list the salient conclusions that can be made from the simulations in
Section 5.
2. Materials and Simulation Details
The crystallographic unit cell of ZSM-22 has 24 Si and 48 O atoms. ZSM-22 has the Theta-1 structure type and contains one-dimensional ten membered-ring pores (running along the Cartesian Z-direction) with channel diameters 4.5 × 5.5 Å
2. ZSM-22 has an orthorhombic crystal structure with lattice constant
a = 13.86,
b = 17.41, and
c = 5.04 Å [
16,
17]. In this work, a unit cell of ZSM-22 was replicated 3 × 2 × 6 times using the visualization software VESTA [
18] to get the starting simulation cell. Ethane or CO
2 molecules were loaded into the pores of ZSM-22 in this cell using grand canonical Monte Carlo (GCMC) simulations. MD simulations were performed for three different loadings of ethane and CO
2 molecules viz. 24, 52, and 72 molecules with a minimum of two, four, and six molecules in each pore. Periodic boundary conditions were applied in all directions during the simulations. Further, an additional simulation was performed at 52 molecular loading of CO
2 by excluding the Coulombic interactions. Thus, a total of seven simulations were done, three for ethane and four for CO
2. In addition, to investigate the effects of pore connectivity, an empty space of 2.5 Å was inserted on the top and bottom of the ZSM-22 cell in the Z-direction, thereby exposing the pores to each other. With periodic boundary conditions applied, this renders the pores of ZSM-22 connected to each other via a 2-dimensional inter-crystalline space of thickness 5 Å. Simulations with a loading of 72 ethane or CO
2 molecules were then carried out in this modified ZSM-22 simulation cell with inter-crystalline space inserted. The highest loading of 72 molecules was considered for this simulation to increase the probability of the guest molecules migrating across the channels. Simulation snapshots showing the unmodified and modified cells are shown in
Figure 1.
The interactions between the adsorbate molecules and those between the zeolites and the adsorbates were modeled in terms of the Lennard–Jones (LJ) potential in addition to the Coulombic interactions between entities with partial electrostatic charges. In general, the intermolecular force field took the following form:
where
εij is the depth of the potential well,
σij is the distance at which the intermolecular potential between the atoms
i and
j becomes zero, the van der Waals radius, and
rij is the distance between atoms
i, and
j,
qi, and
qj are the charges of the
i and
j atoms. TraPPE-UA [
19] force field was used to model the interaction between the guest molecules and united atom formalism was used to model ethane molecules with two CH
3 pseudo-atoms connected to each other. Both CO
2 as well as ethane were considered as rigid molecules with fixed bond lengths,
l(C-O
C) = 0.116 nm (O
c is used to denote the oxygen atom belonging to a CO
2 molecule) and
l(CH
3-CH
3) = 0.154 nm. ZSM-22 was modeled using the CLAYFF force field [
20]. All ZSM-22 atoms were kept fixed during all simulations. Values of the Lennard–Jones parameters corresponding to CO
2 and ethane molecules have been summarized in
Table 1 and
Table 2, respectively. The partial charges on the atoms of ZSM-22 and CO
2 were taken as
qSi = +2.1
e,
qO = −1.05
e,
qc = +0.7
e,
qOc = −0.35
e. The force-field parameters used in this work have been used earlier for simulating the adsorption, structure, and dynamics of ethane and CO
2 in silicalite—an all silica analogue of ZSM-5 [
14,
15]. The adsorption isotherms of both ethane and CO
2 in silicalite obtained from a GCMC simulation [
15] using these parameters agreed well with the experimental isotherms obtained by Sun et al. [
21] (see Figure 7 in ref. [
15]).
Simulations were performed using the DL-POLY classic molecular dynamics simulation package [
22]. All simulations were carried out in the NVT ensemble at a temperature of 300 K. The Nose–Hoover thermostat was used to regulate the temperature with a relaxation time of 1 ps. Simulations were run for a total of 2 ns and a calculation time step of 1 fs was used for the simulations. Following the TraPPE-UA convention, a cut-off distance of 14 Å was used. In order to ensure equilibrium of the system, an equilibration time of 0.5 ns was used before the production process. Equilibration of the system was confirmed by inspecting the evolution of total energy and temperature of the system which exhibited stable values within acceptable fluctuation limits after 0.5 ns. During the production process of 1.5 ns, instantaneous positions and velocities of all the atoms/pseudo-atoms were recorded after every 20 fs.
4. Discussion
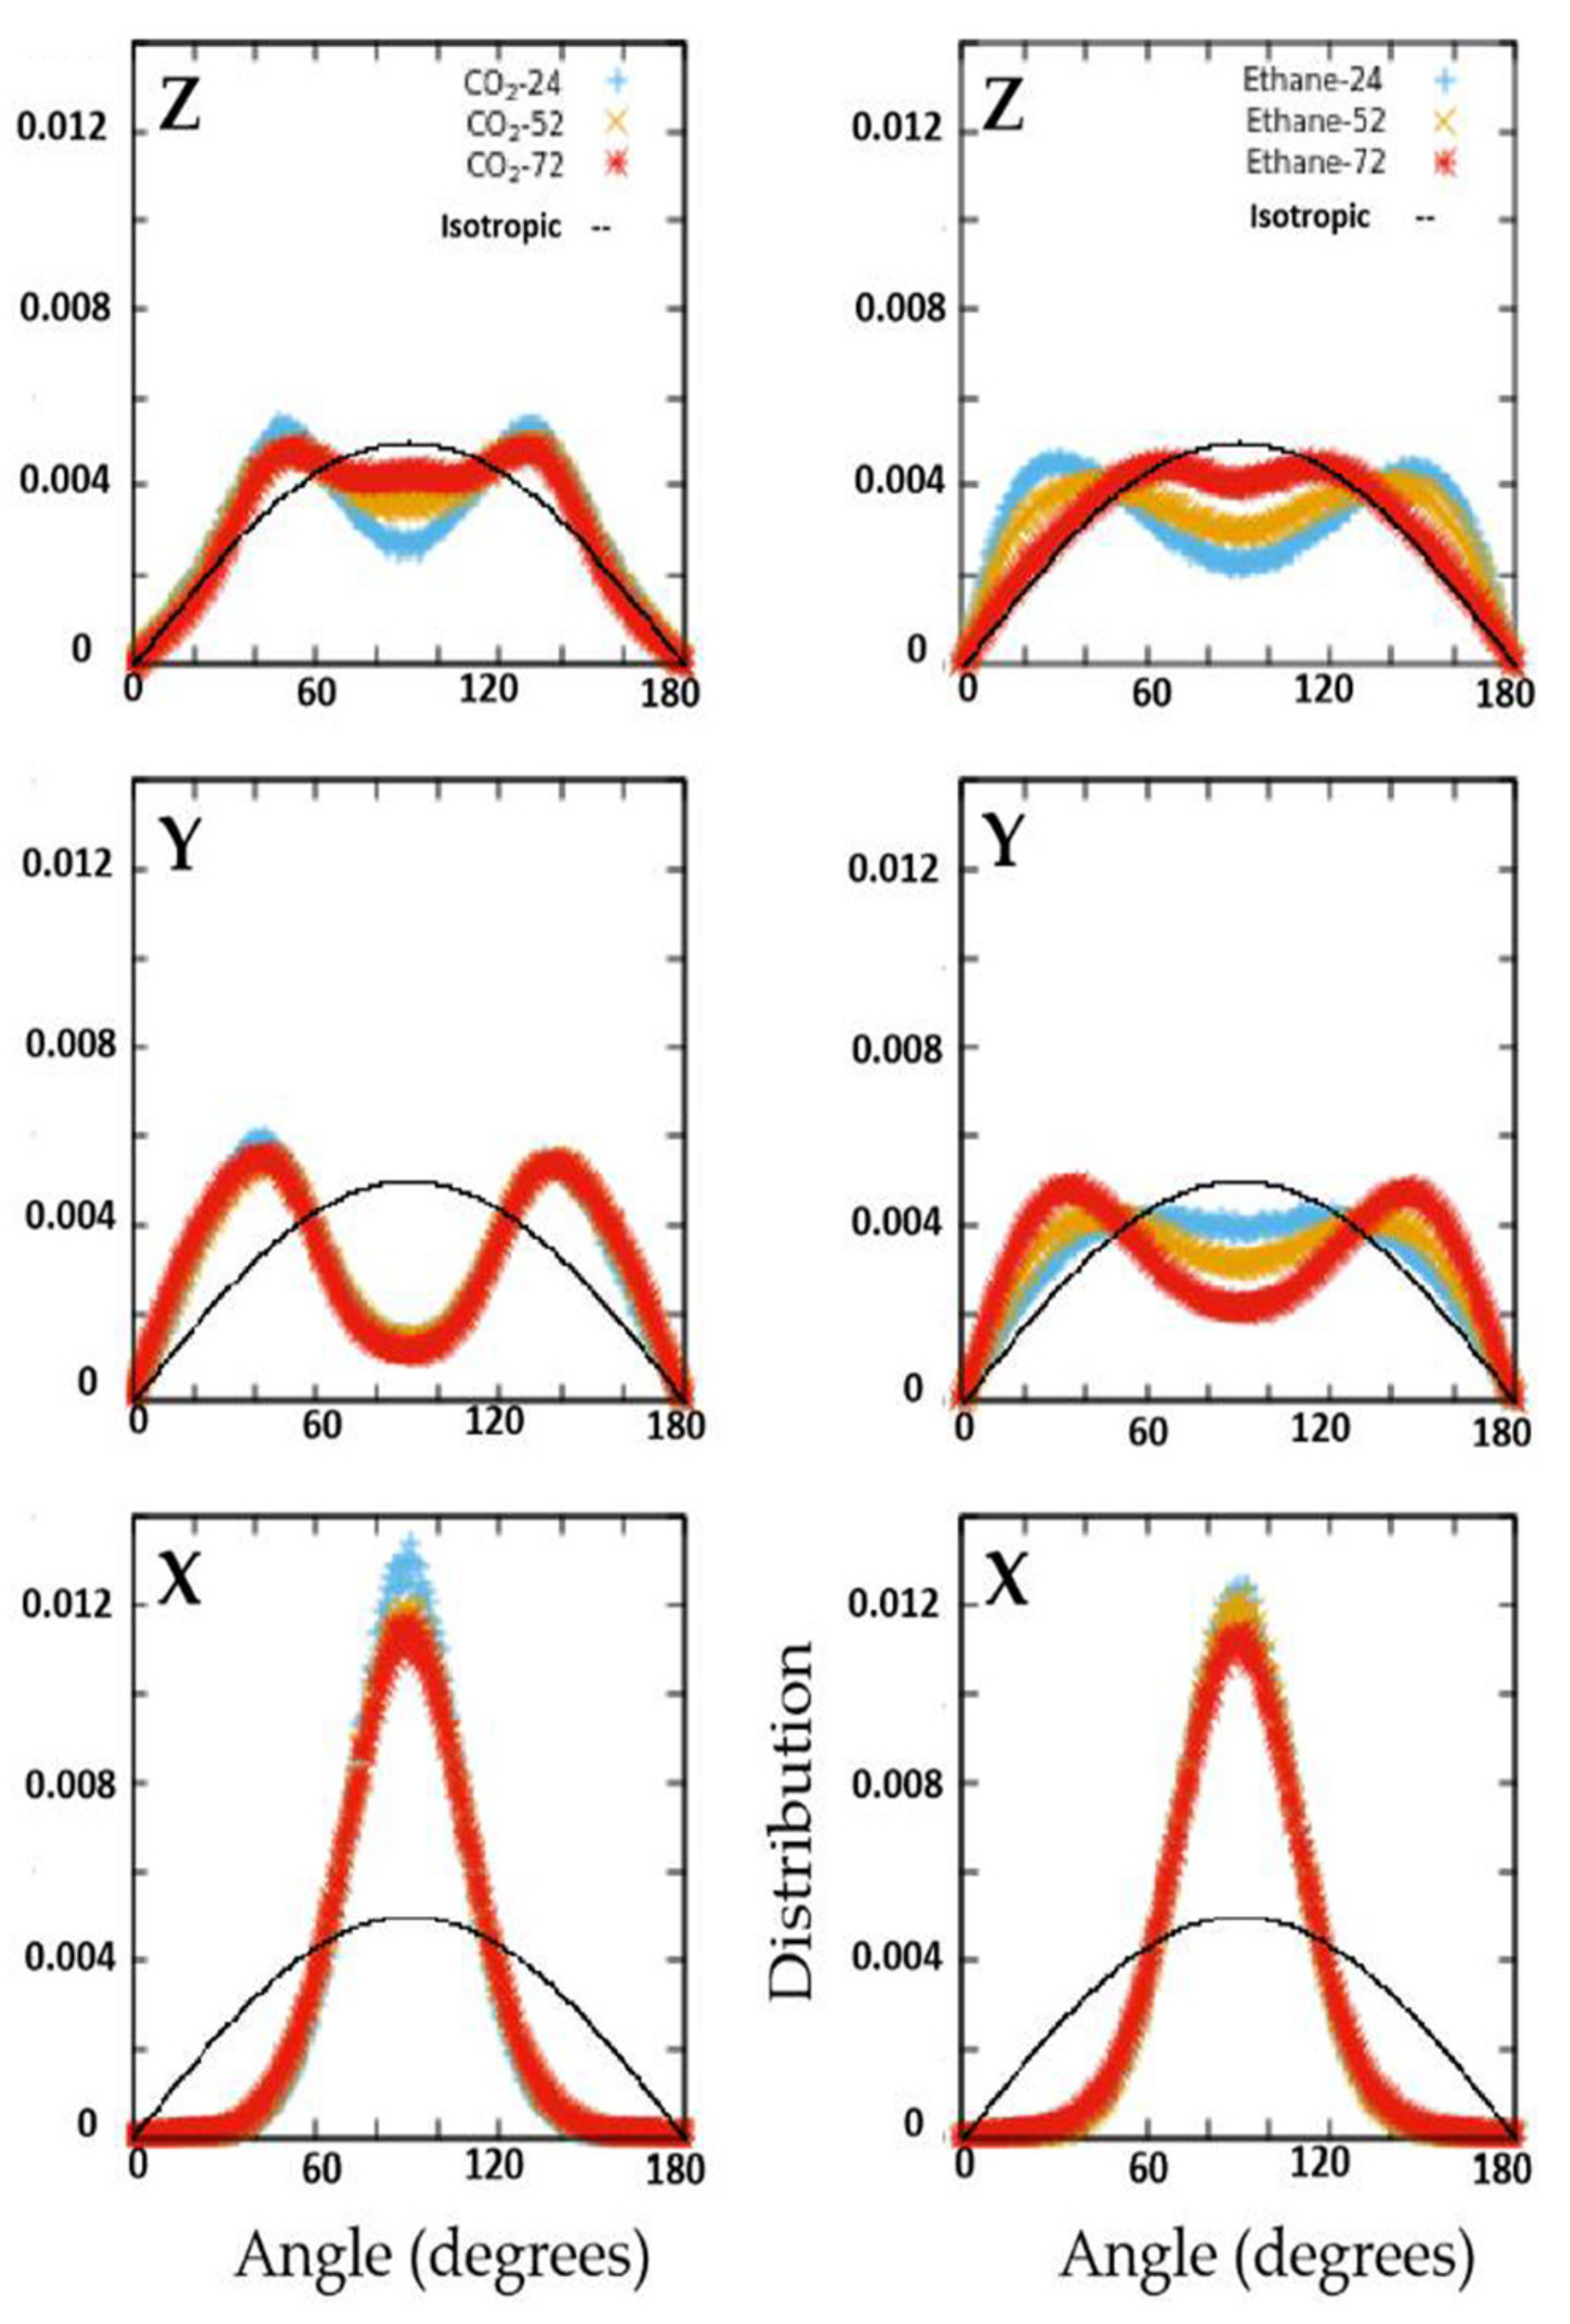
The structural and dynamical behavior of both fluids mimic the structure of the pores. As seen in
Figure 2, the fluid molecules tend to occupy the pores in positions that are elongated along the Y axis, in consistency with the pores that are slightly elongated along the
Y axis (see
Figure 1). This slight elongation along the
Y axis also gives rise to preference to orient perpendicular to the
X-axis (see
Figure 3). While CO
2 molecules prefer to lie making an angle of roughly 45 degrees with respect to both Y- and Z-directions, the ethane molecules show a preference to make smaller (or larger) angles with Z (or Y-directions) at lower loadings, progressively shifting towards larger (or smaller) angles with Z (or Y-directions). Thus, while ethane exhibits a range of orientations with respect to the pore axis (and hence pore wall) depending on the loading, CO
2 molecules show a preference to lie making an angle of 45 degrees with the pore surface irrespective of the loading. A preference for this orientation with respect to the substrate has been observed for CO
2 in several other systems [
15,
23].
The results presented here show that the electrostatic interactions play an important role in the behavior of CO
2 under confinement. This has been reported earlier in several other studies [
15,
24]. The quadrupole moment of CO
2 is responsible for selective adsorption of CO
2 on silica surfaces, leading to reduced mobility. This restriction on the motion of CO
2 due to the electrostatic interactions is relatively weaker as compared to the restriction imposed on slightly larger polar molecules like acetonitrile and acetaldehyde [
6] that are rendered practically immobile in the channels of ZSM-5 of similar dimensions as in ZSM-22 investigated here.
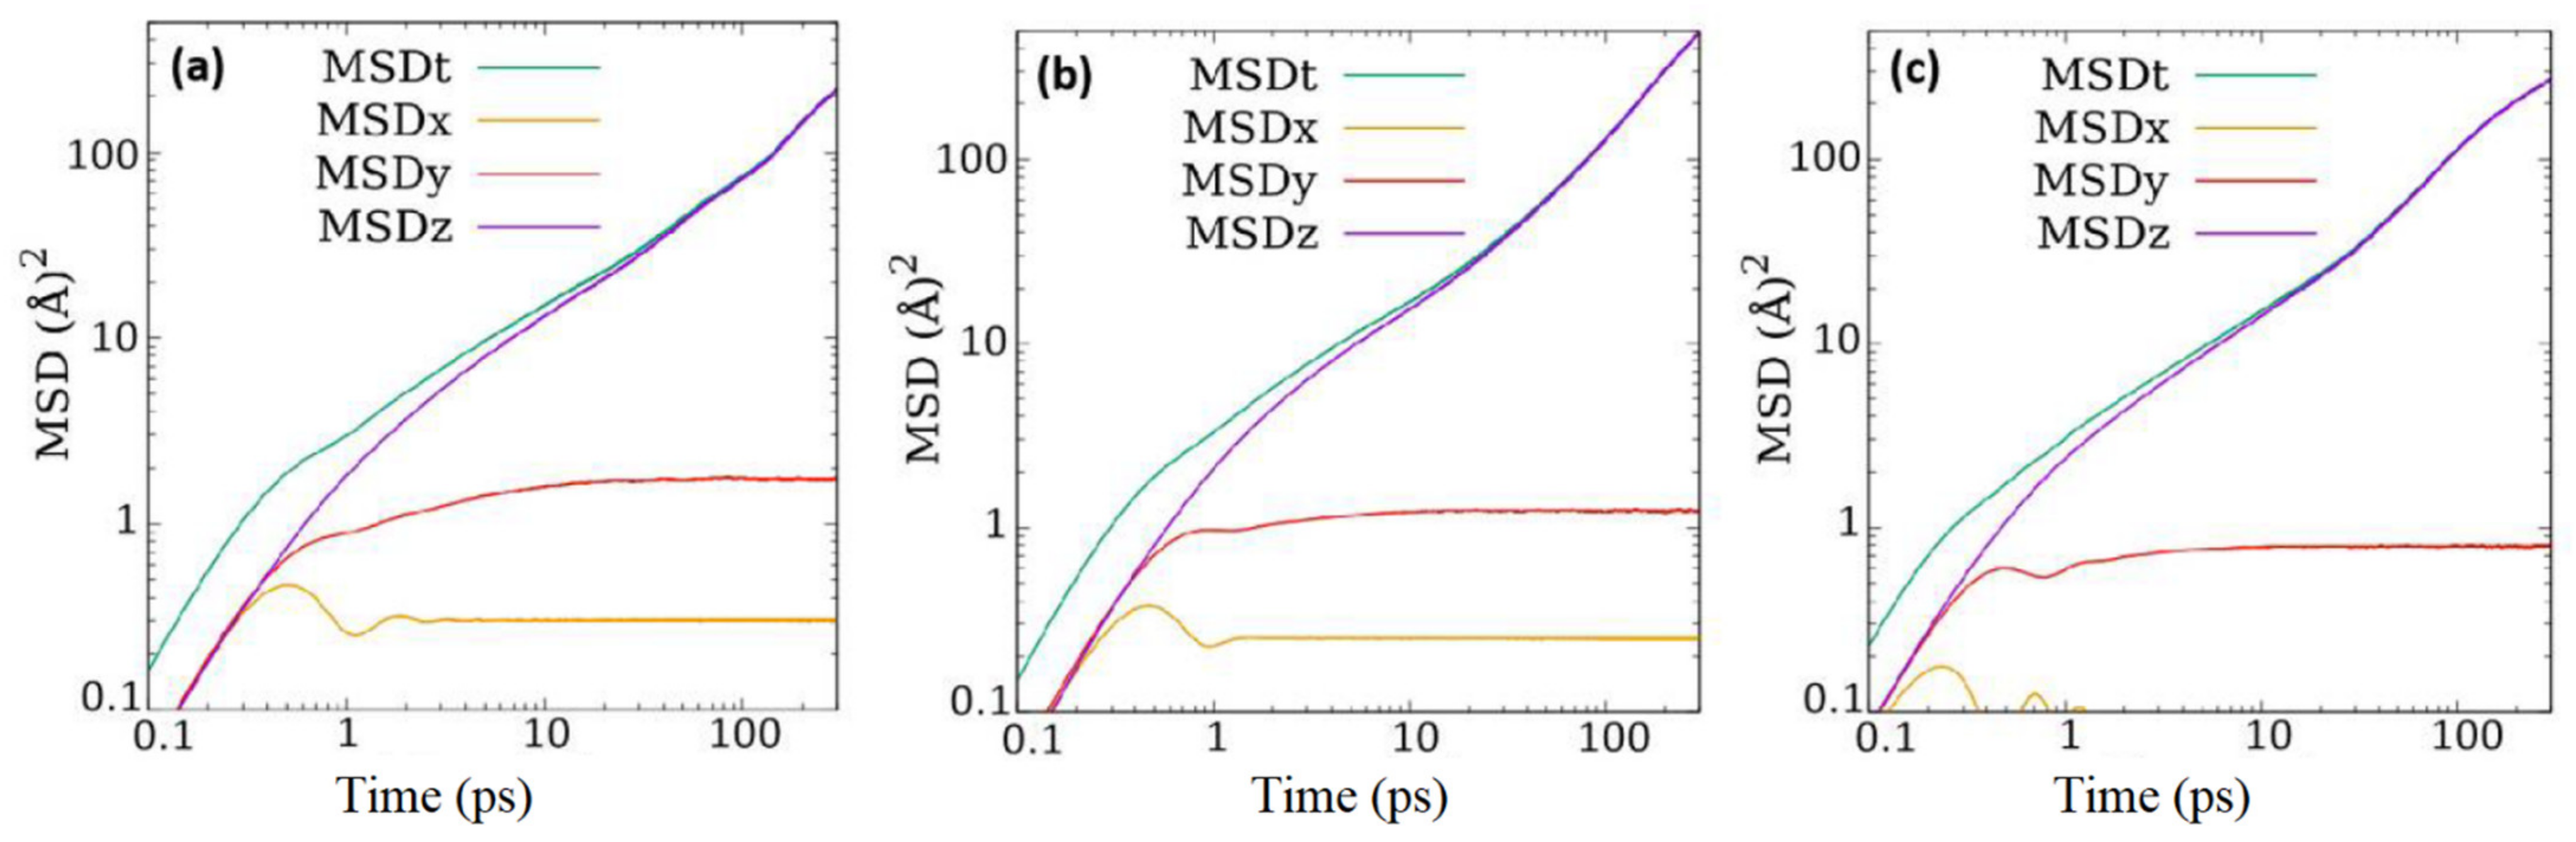
A quick comparison of the overall self-diffusion coefficients reported in
Table 3 here with those for the two fluids reported in ZSM-5 [
14] suggests that although the diffusivity of ethane in ZSM-22 is same as that in ZSM-5, that of CO
2 is slightly reduced in ZSM-22 compared to that in ZSM-5. However, there are some important caveats to consider. As stated in the introduction, the pore network of ZSM-22 is similar in dimensions to that in ZSM-5 but without inter-connections between different channels. The straight channel-like pores in ZSM-22 are aligned along the crystallographic axis
c and are analogous to the straight channels in ZSM-5 that run parallel to
b axis. One direct consequence of the difference in the pore structure in ZSM-22 and ZSM-5 is that while in the former, the mean squared displacement at longer time is entirely along the direction of straight channels, that in the latter is distributed along all directions even though the component along the direction of straight channels is dominant. This is because of the existence of sinusoidal channels that run perpendicular to the straight channels in ZSM-5, giving rise to motion along the plane perpendicular to the straight channels. These sinusoidal channels also provide a connection between the straight channels. The effect of the presence of this connection between the pores in ZSM-5 or their absence in ZSM-22 can be understood by comparing the one-dimensional diffusivity of fluid molecules along the pore direction, i.e., in the Y-direction in ZSM-5 and in Z-direction in ZSM-22. For CO
2 loaded in ZSM-5 at partial gas pressures between 0.1 to 100 bar, this diffusivity was in the range of 66 to 12 × 10
−10 m
2/s, while for ethane in ZSM-5, it was in the range 71 to 5.5 × 10
−10 m
2/s for these partial pressures [
14]. The different loadings as reported here also correspond roughly to the same range of partial pressures. As the MSD along the pore axis in ZSM-22 is identical to the overall MSD at long times, the overall self-diffusion coefficients listed in
Table 3 can be used as a measure of the diffusion coefficient along the pore axis. However, it should be noted that the self-diffusion coefficients along the pore axis calculated for ZSM-5 as mentioned above were obtained by considering one-dimensional motion while those reported in
Table 3 for ZSM-22 are obtained considering 3-D motion. Thus, a fair comparison between the two sets of diffusion coefficients (those for ZSM-5 and ZSM-22) requires multiplying the values listed in
Table 3 by a factor of 3 (The self-diffusion coefficient is obtained via Einstein relation as D
s = MSD/(2n
dt), where n
d is the number of dimensions; n
d = 3 for the overall D
s as listed in
Table 3; n
d = 1 for one-dimensional diffusion. Thus, to convert the 3-D D
s values listed in
Table 3 to a 1-D self-diffusion coefficient, the former needs to be multiplied by 3). With this normalization, we obtain the one-dimensional self-diffusion coefficients of CO
2 and ethane in the direction of the pore axis of ZSM-22 in the range of 97 to 15.6 × 10
−10 and 162 to 16.6 × 10
−10 m
2/s, respectively. These self-diffusion coefficients along the pore axis in ZSM-22 are thus higher than those in ZSM-5, suggesting that pore connectivity hinders the diffusivity. This could be because of the collisions with the cross-running molecules in the sinusoidal channels that slow down the motion of molecules in the straight channels of ZSM-5, while in absence of pore connectivity, the molecules in the channel-like pores of ZSM-22 encounter no such collisions and hence mov without any hindrance. It has been found that CO
2 molecules show a preference for partitioning in the intersections of the straight and sinusoidal channels in ZSM-5, whereas ethane molecules are more likely to be found in the sinusoidal channels at high loadings [
14]. However, in another study [
25] it was found that the residence auto-correlation function of ethane in the intersections of ZSM-5 decayed slower than those for ethane in straight and sinusoidal channels by a factor of more than 2. This means that even though the energetics favor the partitioning of ethane in sinusoidal channels, once they reach the intersections, they are likely to spend a significant amount of time there, probably undergoing a rattling motion. This rattling motion of the guest molecules in the intersection provides a hindrance to the motion of other guest molecules through the straight channels.
While the translational motion of both ethane and CO
2 is facilitated by the absence of pore connectivity, the effect of pore connectivity on the rotational motion is different on the two fluids. For ethane, the time scales of rotational motion as listed in
Table 4 (between 1.85 and 1.89 ps) are smaller than those for ethane in ZSM-5 (between ~2 and 12 ps) [
14], suggesting a faster rotation for ethane in ZSM-22. In contrast to this, the rotational time scales for CO
2 in ZSM-22 (between 13 and 42 ps) are larger than those in ZSM-5 (between 7 and 22 ps) [
14], suggesting a slower rotation of CO
2 in ZSM-22. Rotational motion of both guest molecules in ZSM-22 is enhanced at higher loadings. A similar enhancement of rotational motion at higher loading was also observed for ethane and CO
2 in ZSM-5 [
14,
25] and was explained in terms of a decreased orientational order at higher loadings.
In the absence of inter-connections between the pores of ZSM-22, we added artificial inter-connections by exposing the pores to common inter-crystalline space. The artificial addition of such inter-crystalline space has been earlier used to emulate the powder samples in simulations [
15,
26,
27,
28]. In the present case, this inter-crystalline space effectively provided a connection between the straight channel-like pores of ZSM-22. Comparing the values of overall self-diffusion coefficients in ZSM-22 with and without pores connected via inter-crystalline space listed in
Table 3, it can be seen that the effects of this artificially imposed pore connectivity is different on the two fluids. While ethane diffusion is facilitated by pore connectivity, that of CO
2 is suppressed significantly. However, we note that as the inter-crystalline space added for connecting the pores provides a three-dimensional slab-like space in which the molecules are free to move in X- and Y-directions in addition to the Z-direction, a fair comparison with the case of isolated pores in ZSM-22 where motion occurs only along the Z-direction would require limiting the comparison to diffusivity along the Z-direction. Self-diffusion coefficients of ethane and CO
2 along the Z-direction obtained for ZSM-22 modified with inter-crystalline space are, respectively, 19.92 × 10
−10 and 2.01 × 10
−10 m
2/s. Compared to the values of 16.65 × 10
−10 and 15.54 × 10
−10 m
2/s for the self-diffusion coefficient along Z-direction of ethane and CO
2 in ZSM-22 with isolated pores, (obtained by normalizing the values listed in
Table 3 for one-dimensional motion), we see that the effect of pore connectivity via inter-crystalline space is indeed different for the two fluids—enhancement of diffusivity for ethane and its suppression for CO
2 in ZSM-22. Unlike the difference in the effects of pore connectivity via inter-crystalline space on translational motion of ethane and CO
2, the rotational motion of both ethane and CO
2 were found to be suppressed by inter-crystalline space (
Table 4).
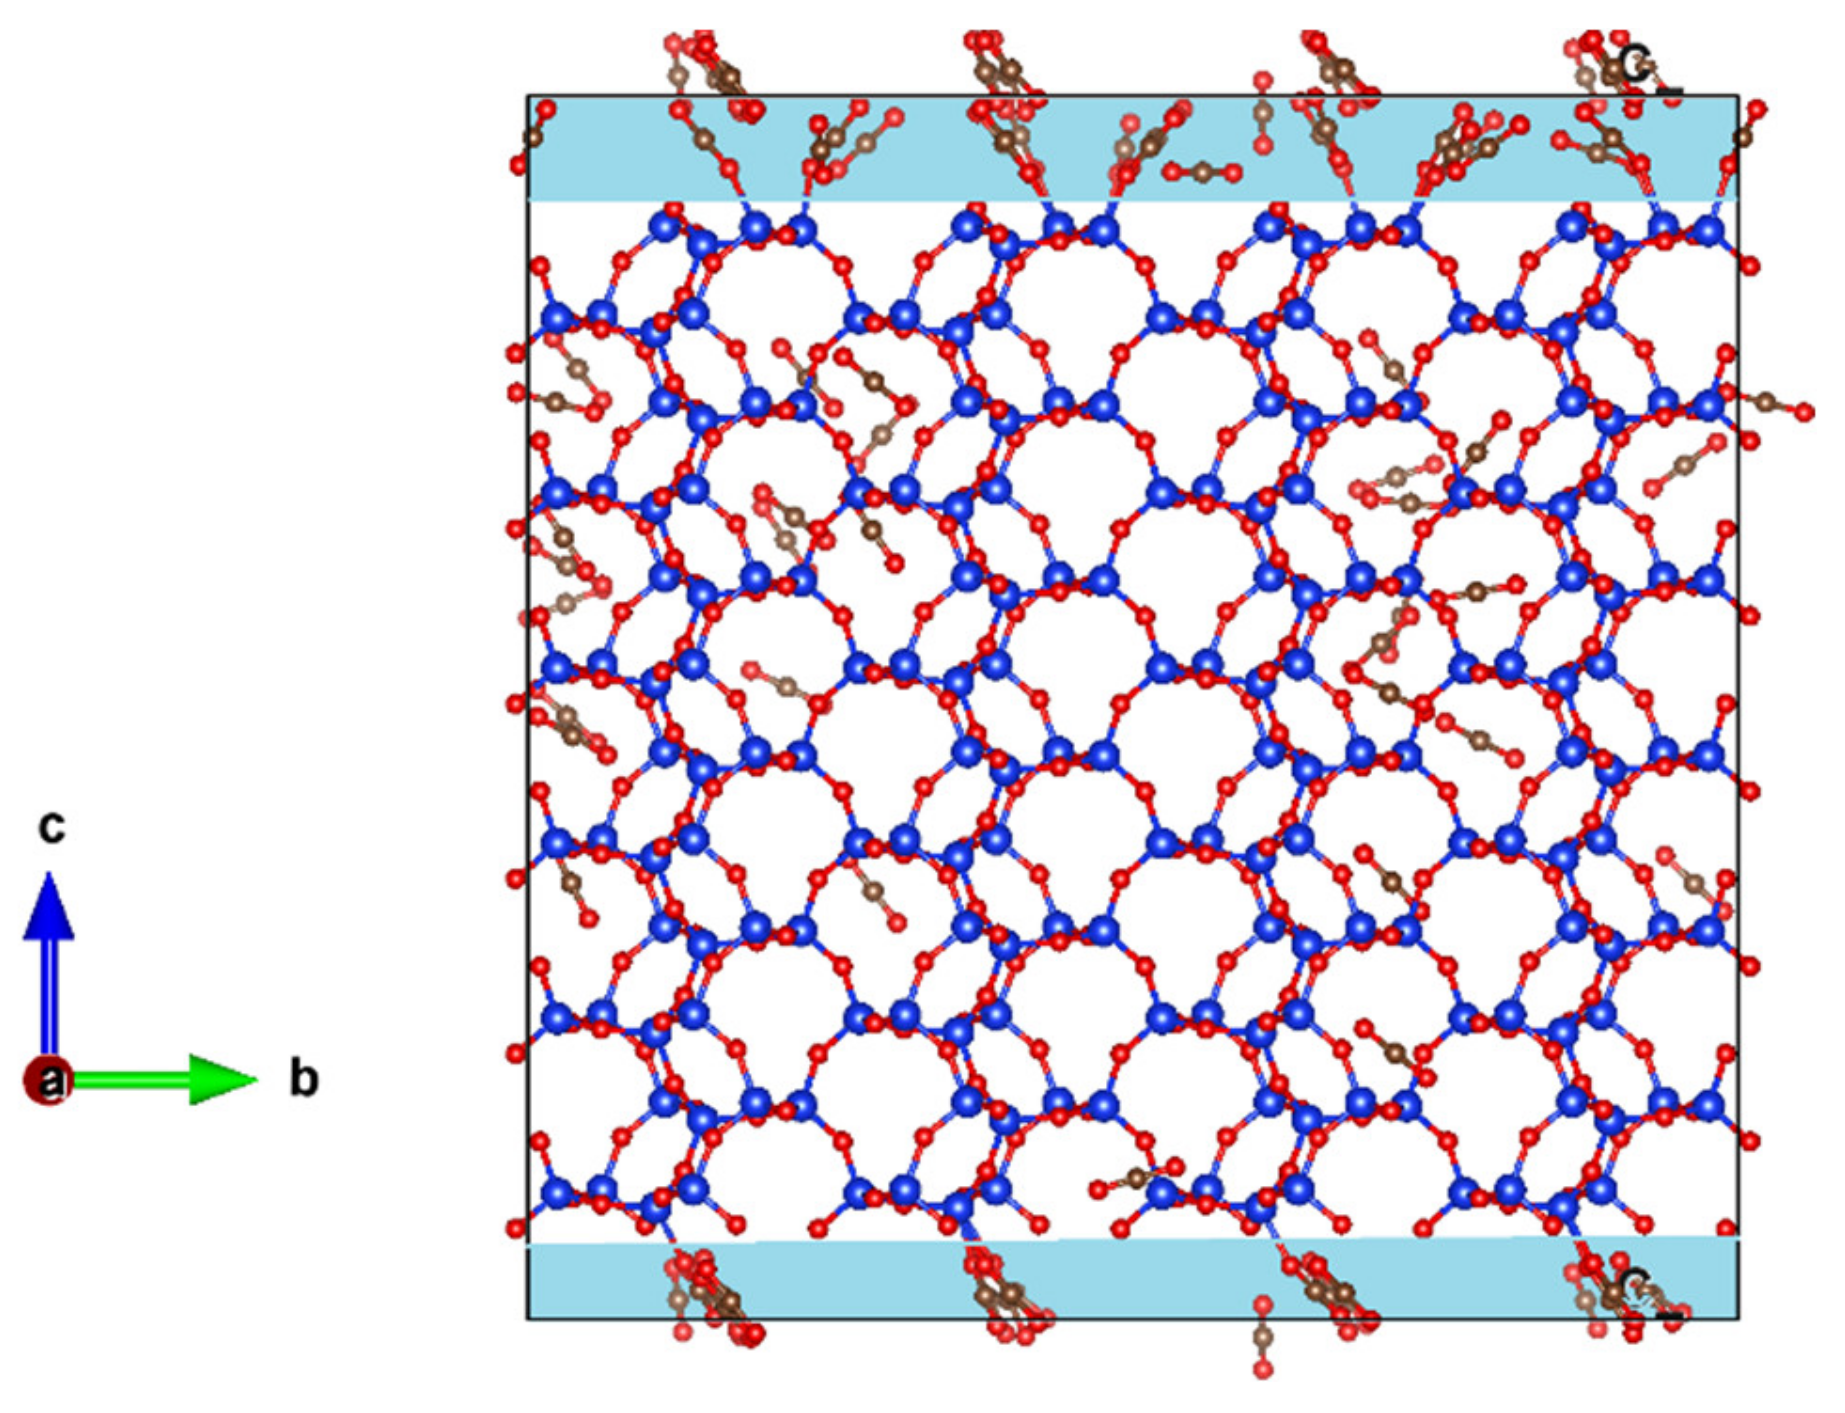
In
Figure 8 we show a snapshot of CO
2 adsorbed in ZSM-22 with inter-crystalline space inserted at the bottom and top of the simulation cell along the Z-direction. The corresponding snapshot for ethane in this system is shown in
Figure 1d. A clear distinction can be seen between the behavior of ethane and CO
2 in this system by comparing
Figure 8 and
Figure 1d. While ethane molecules prefer to be adsorbed in the ZSM-22 pores, more CO
2 molecules can be seen adsorbed on the surface of the crystallite in the inter-crystalline space, suggesting a preference for the surface adsorption compared with adsorption in the crystalline pores. This is consistent with the difference observed between ethane and CO
2 adsorption in the inter-crystalline space of ZSM-5 [
15]. The curvature of the silica surface plays an important role in the preferential adsorption of CO
2 on the surface vis-a-vis the pores. While the silica surface in the vicinity of the inter-crystalline space is flat, that in the pores has a strong curvature such that a CO
2 molecule is wrapped around by it. As a result, the silica atoms on the opposite sides compete for and nullify their interaction with CO
2, thereby freeing the CO
2 molecule to move along the pore axis. This nullification of strong surface interactions by opposite pore surfaces has been found to enhance the diffusivity of guest molecules in zeolite pores and is termed as the “levitation effect” [
29]. Strong adsorption of CO
2 on the crystallite surface has important consequences for the dynamical behavior. Connecting the pores of ZSM-22 by inserting inter-crystalline space leads to a suppression of both translational as well as rotational dynamics of CO
2, while with weaker substrate–fluid interactions in the case of ethane, the inserted space provides greater freedom to ethane to move between the pores, thus enhancing its mobility. Further, the intersection between the channels and the interconnecting slab-like space is open and the guest molecules show no preference to localize at these intersections, in contrast to the case of ZSM-5. This reduces the probability of collisions considerably and thereby in absence of collisions, the guest molecules in the straight channels of ZSM-22 are free to move in absence of any hindrance. This suggests that the effects of interconnecting the pores depend upon the way the pores are connected.


