
Anti-Foulant Ultrafiltration Polymer Composite Membranes Incorporated with Composite Activated Carbon/Chitosan and Activated Carbon/Thiolated Chitosan with Enhanced Hydrophilicity

 ,
,  ,
,  and
and
Abstract
:
1. Introduction
2. Materials and Methods
2.1. Chemical Reagents
2.2. Methodology
2.3. Characterization Techniques
3. Results
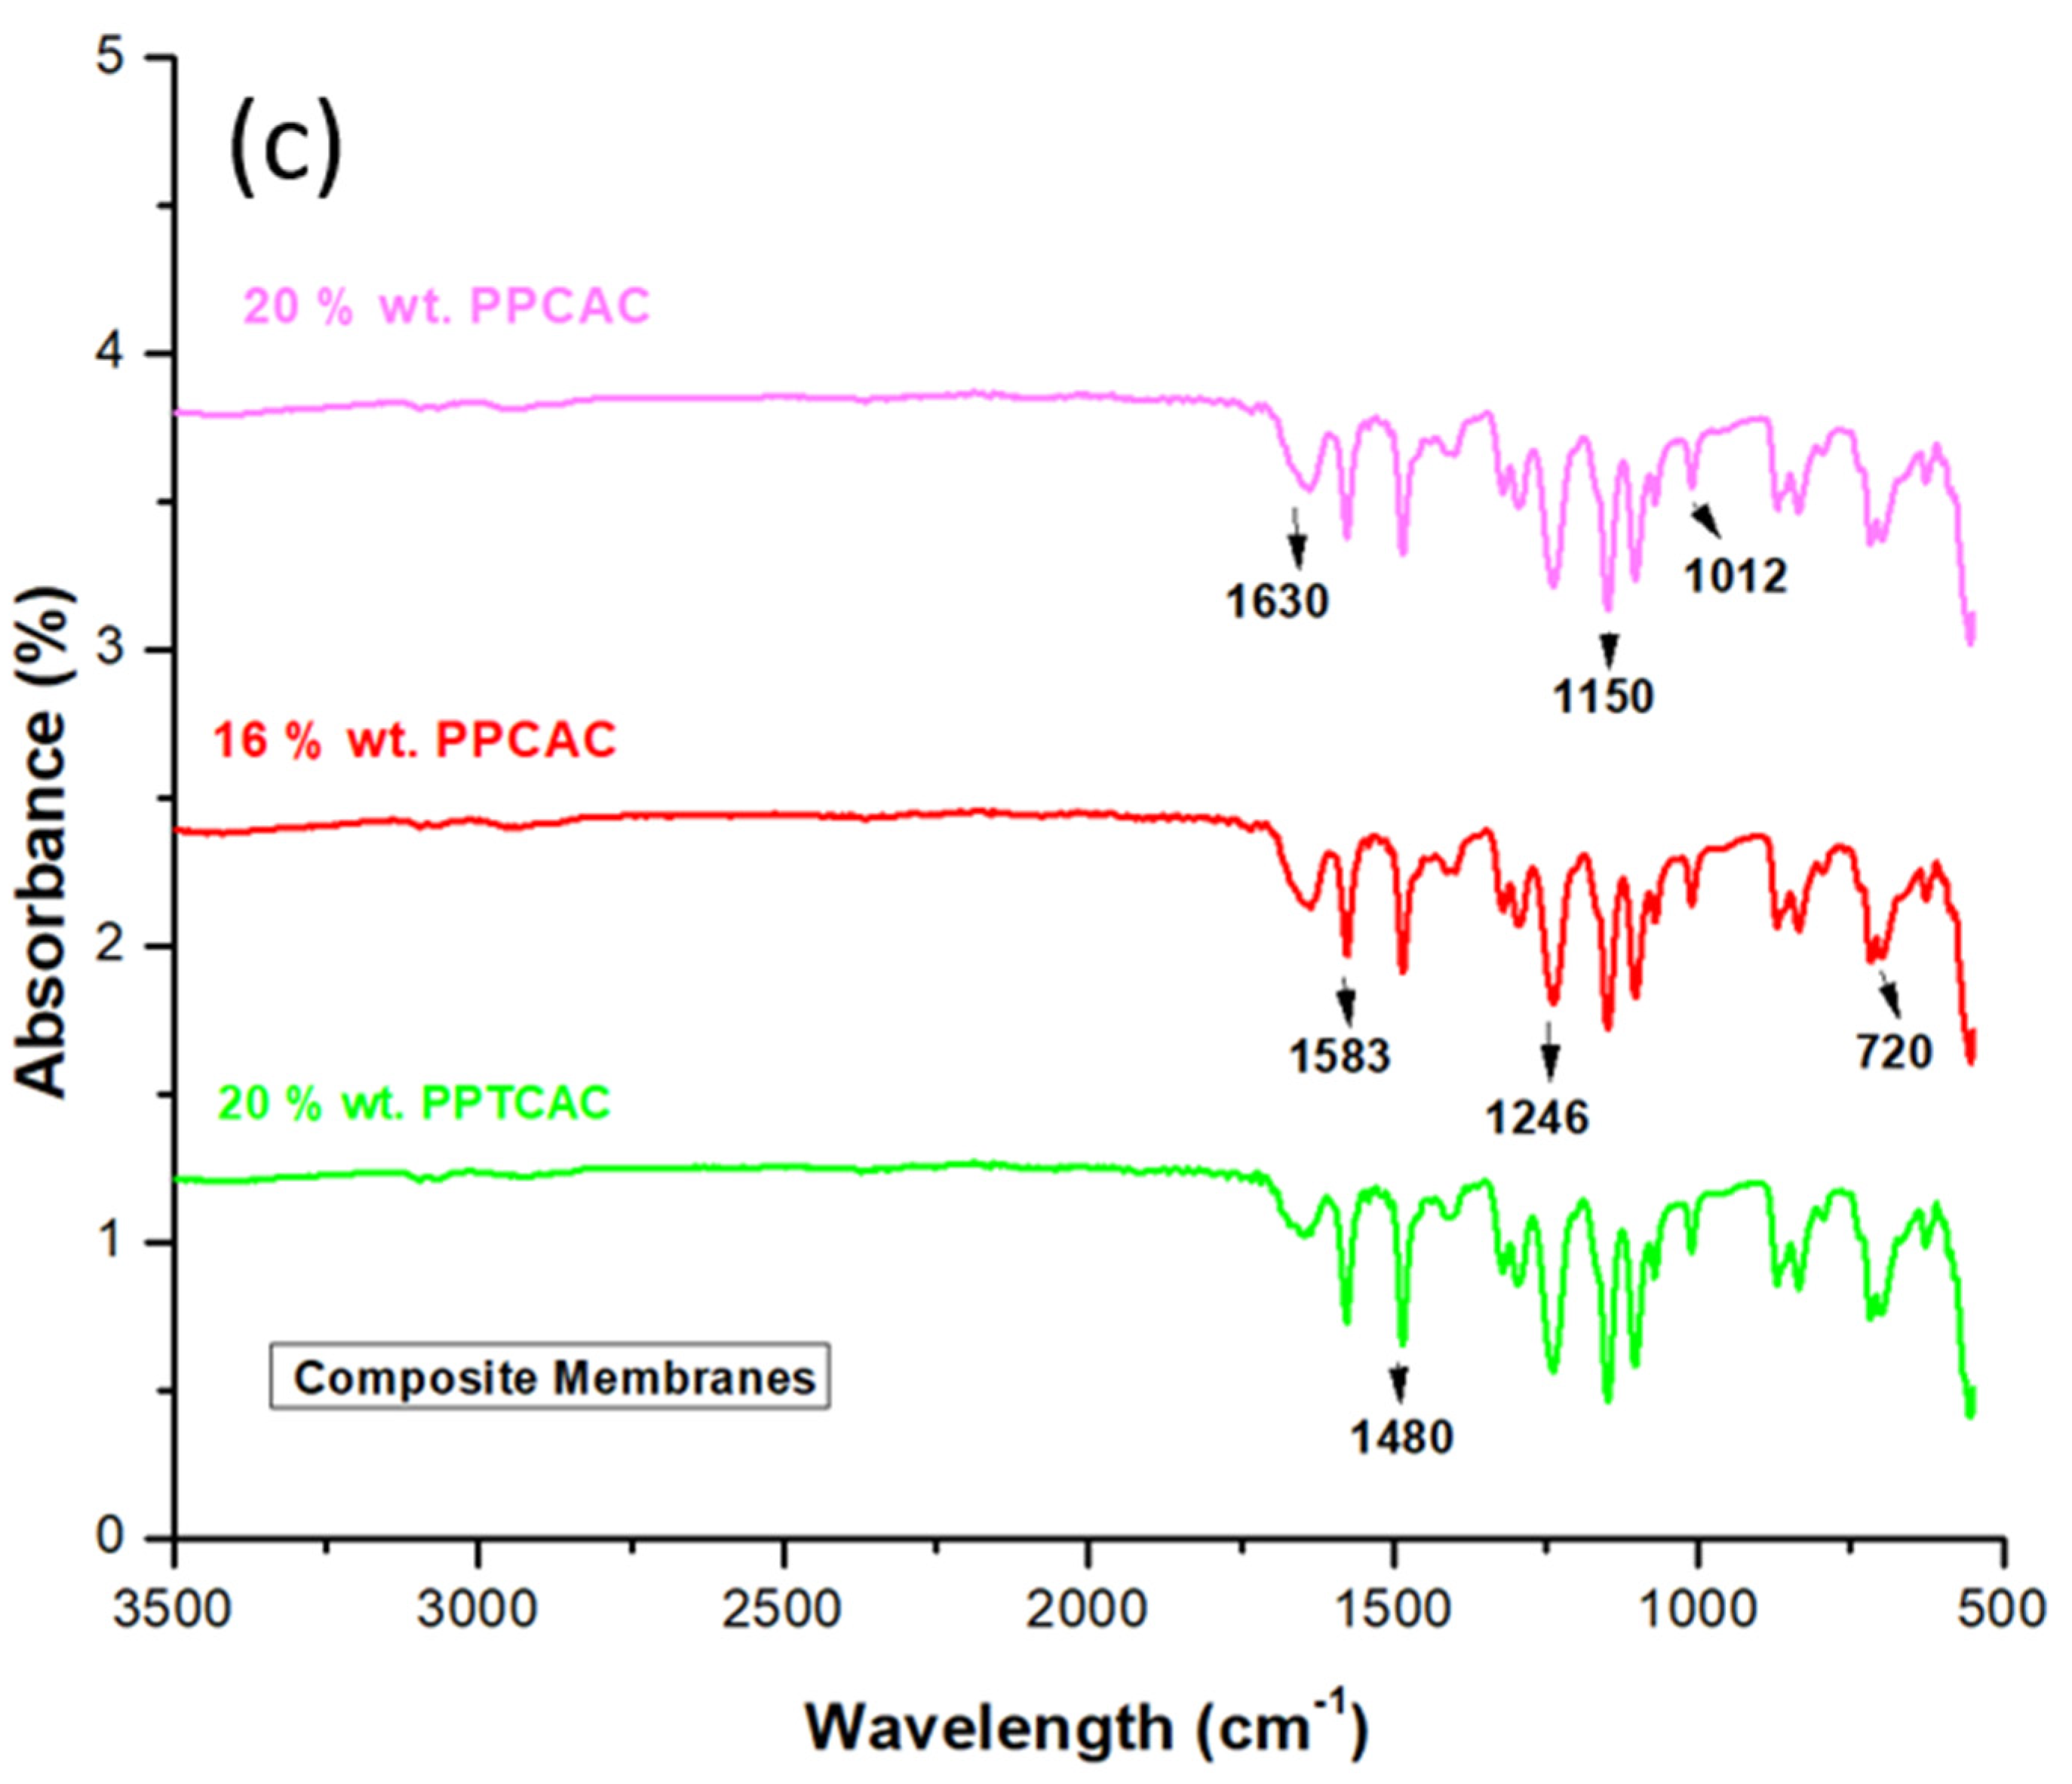
3.1. ATR-FTIR
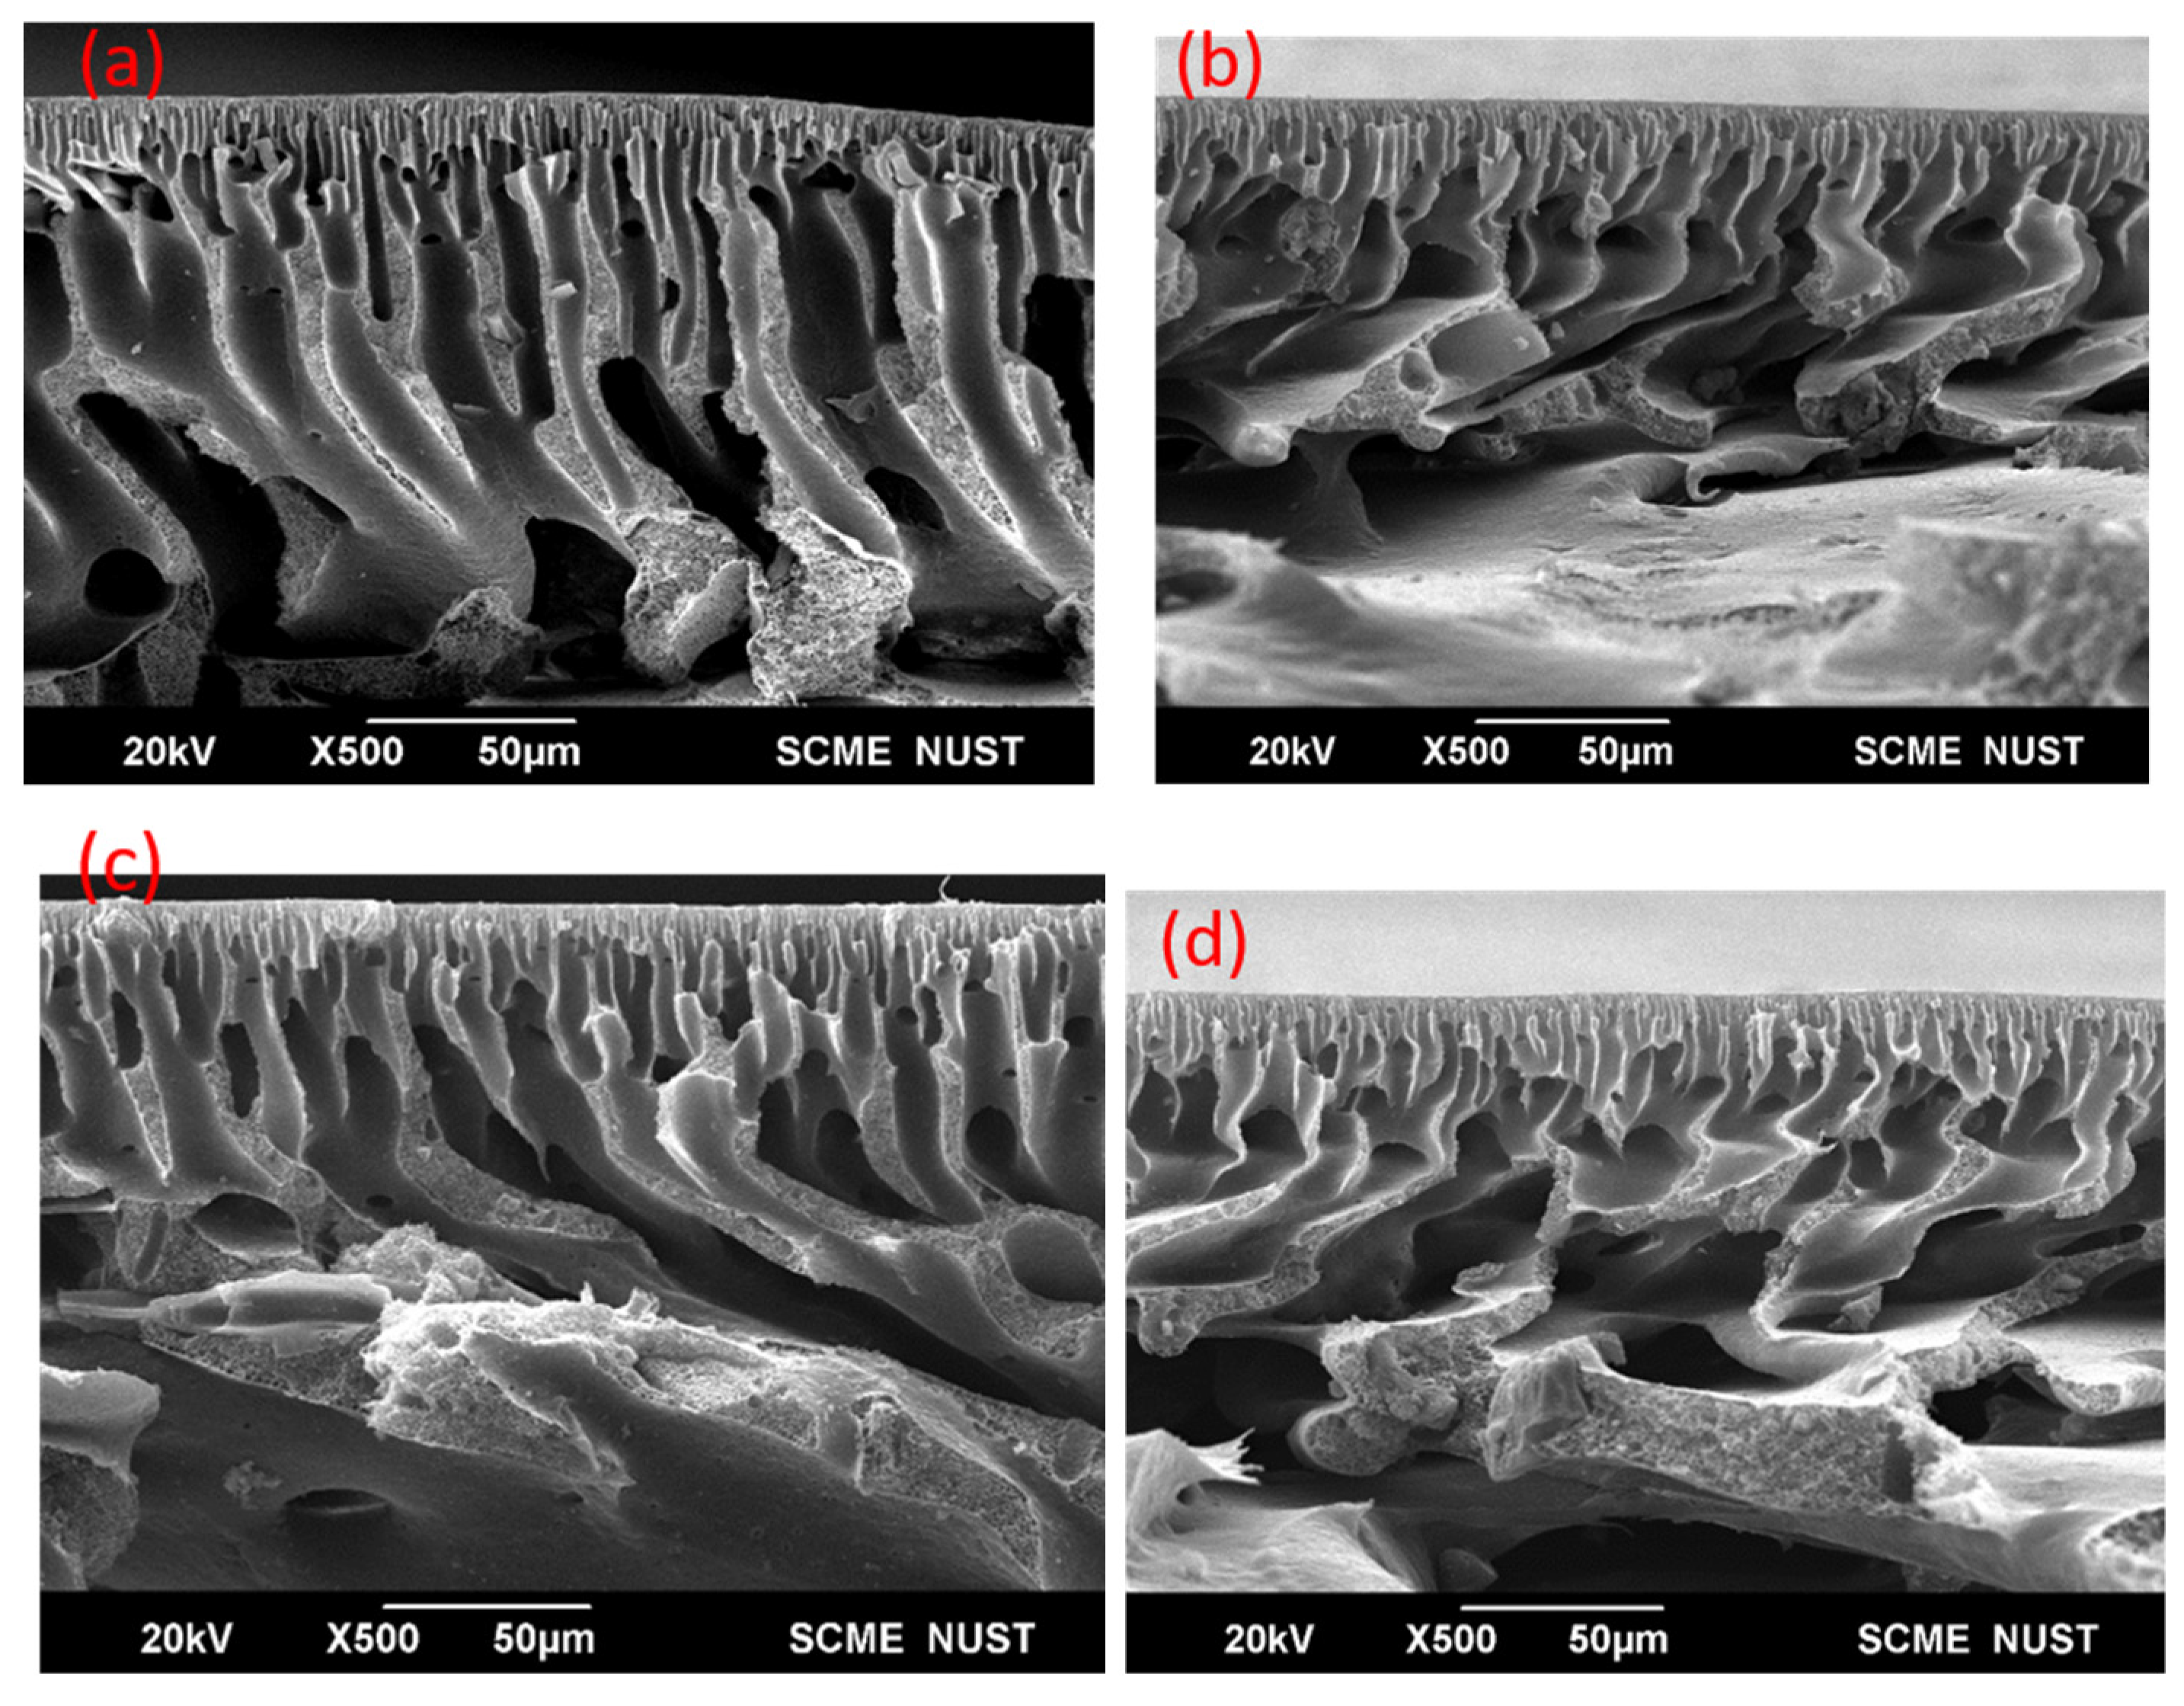
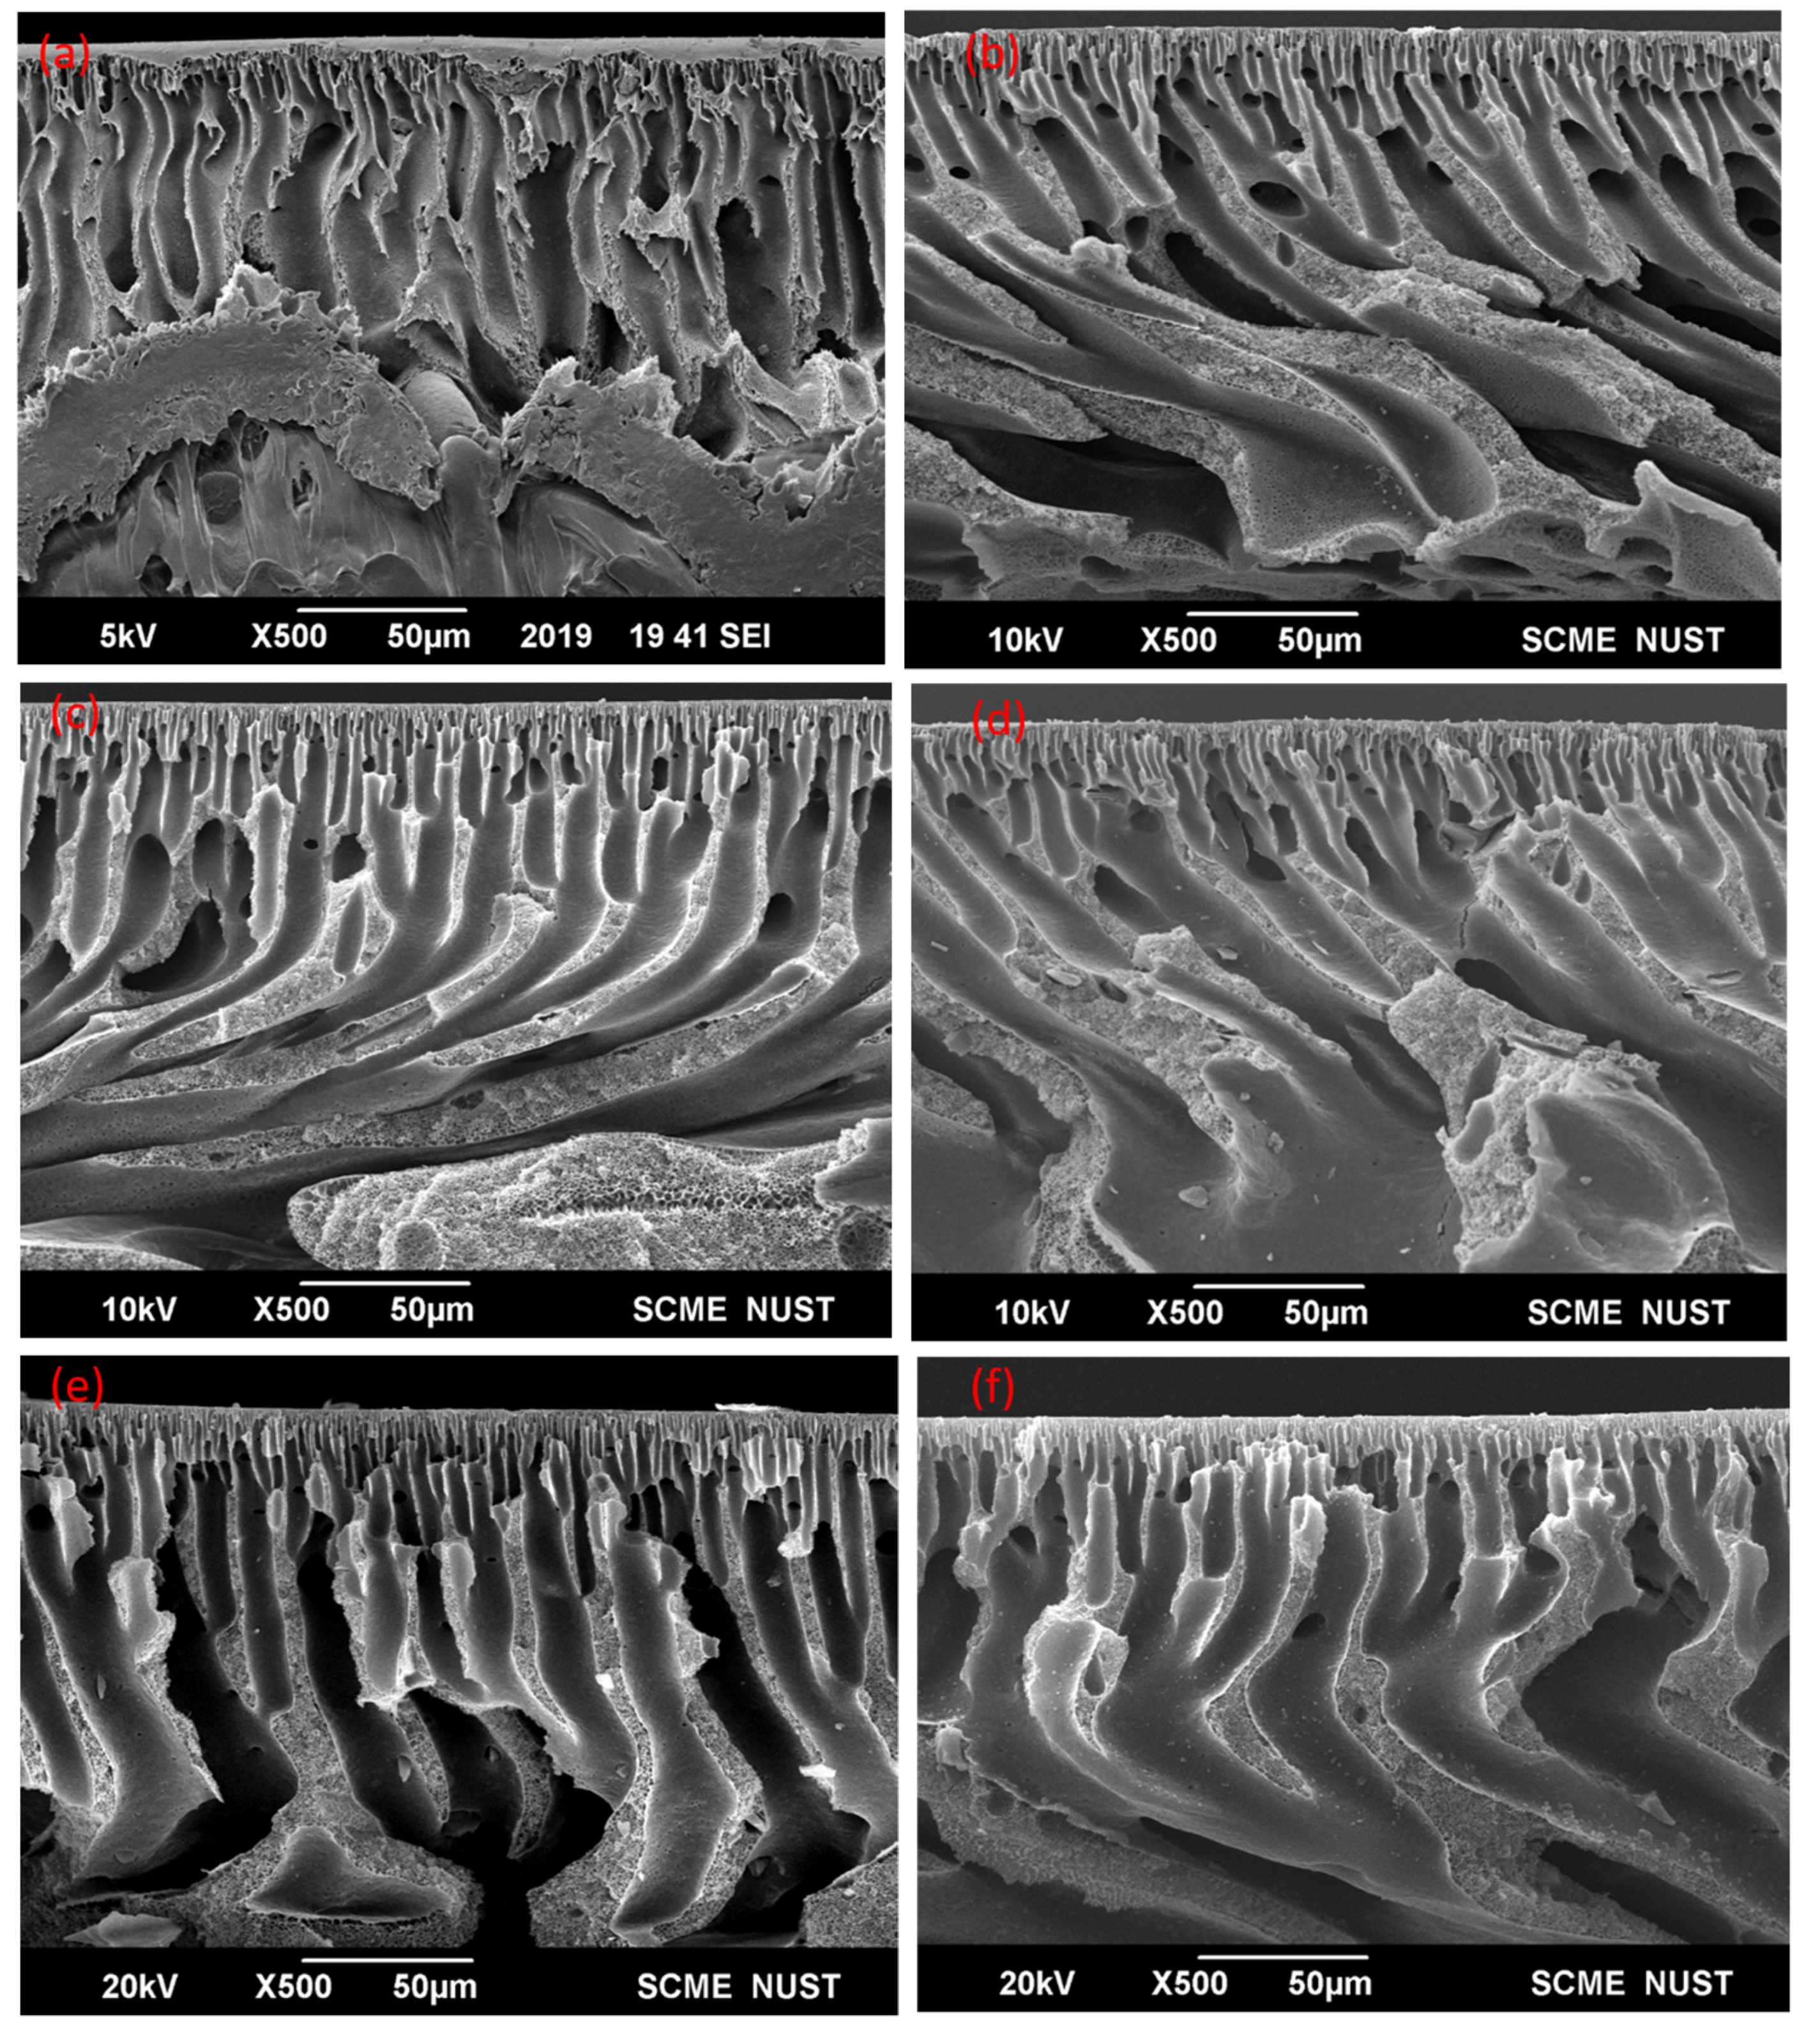
3.2. Morphological Analysis
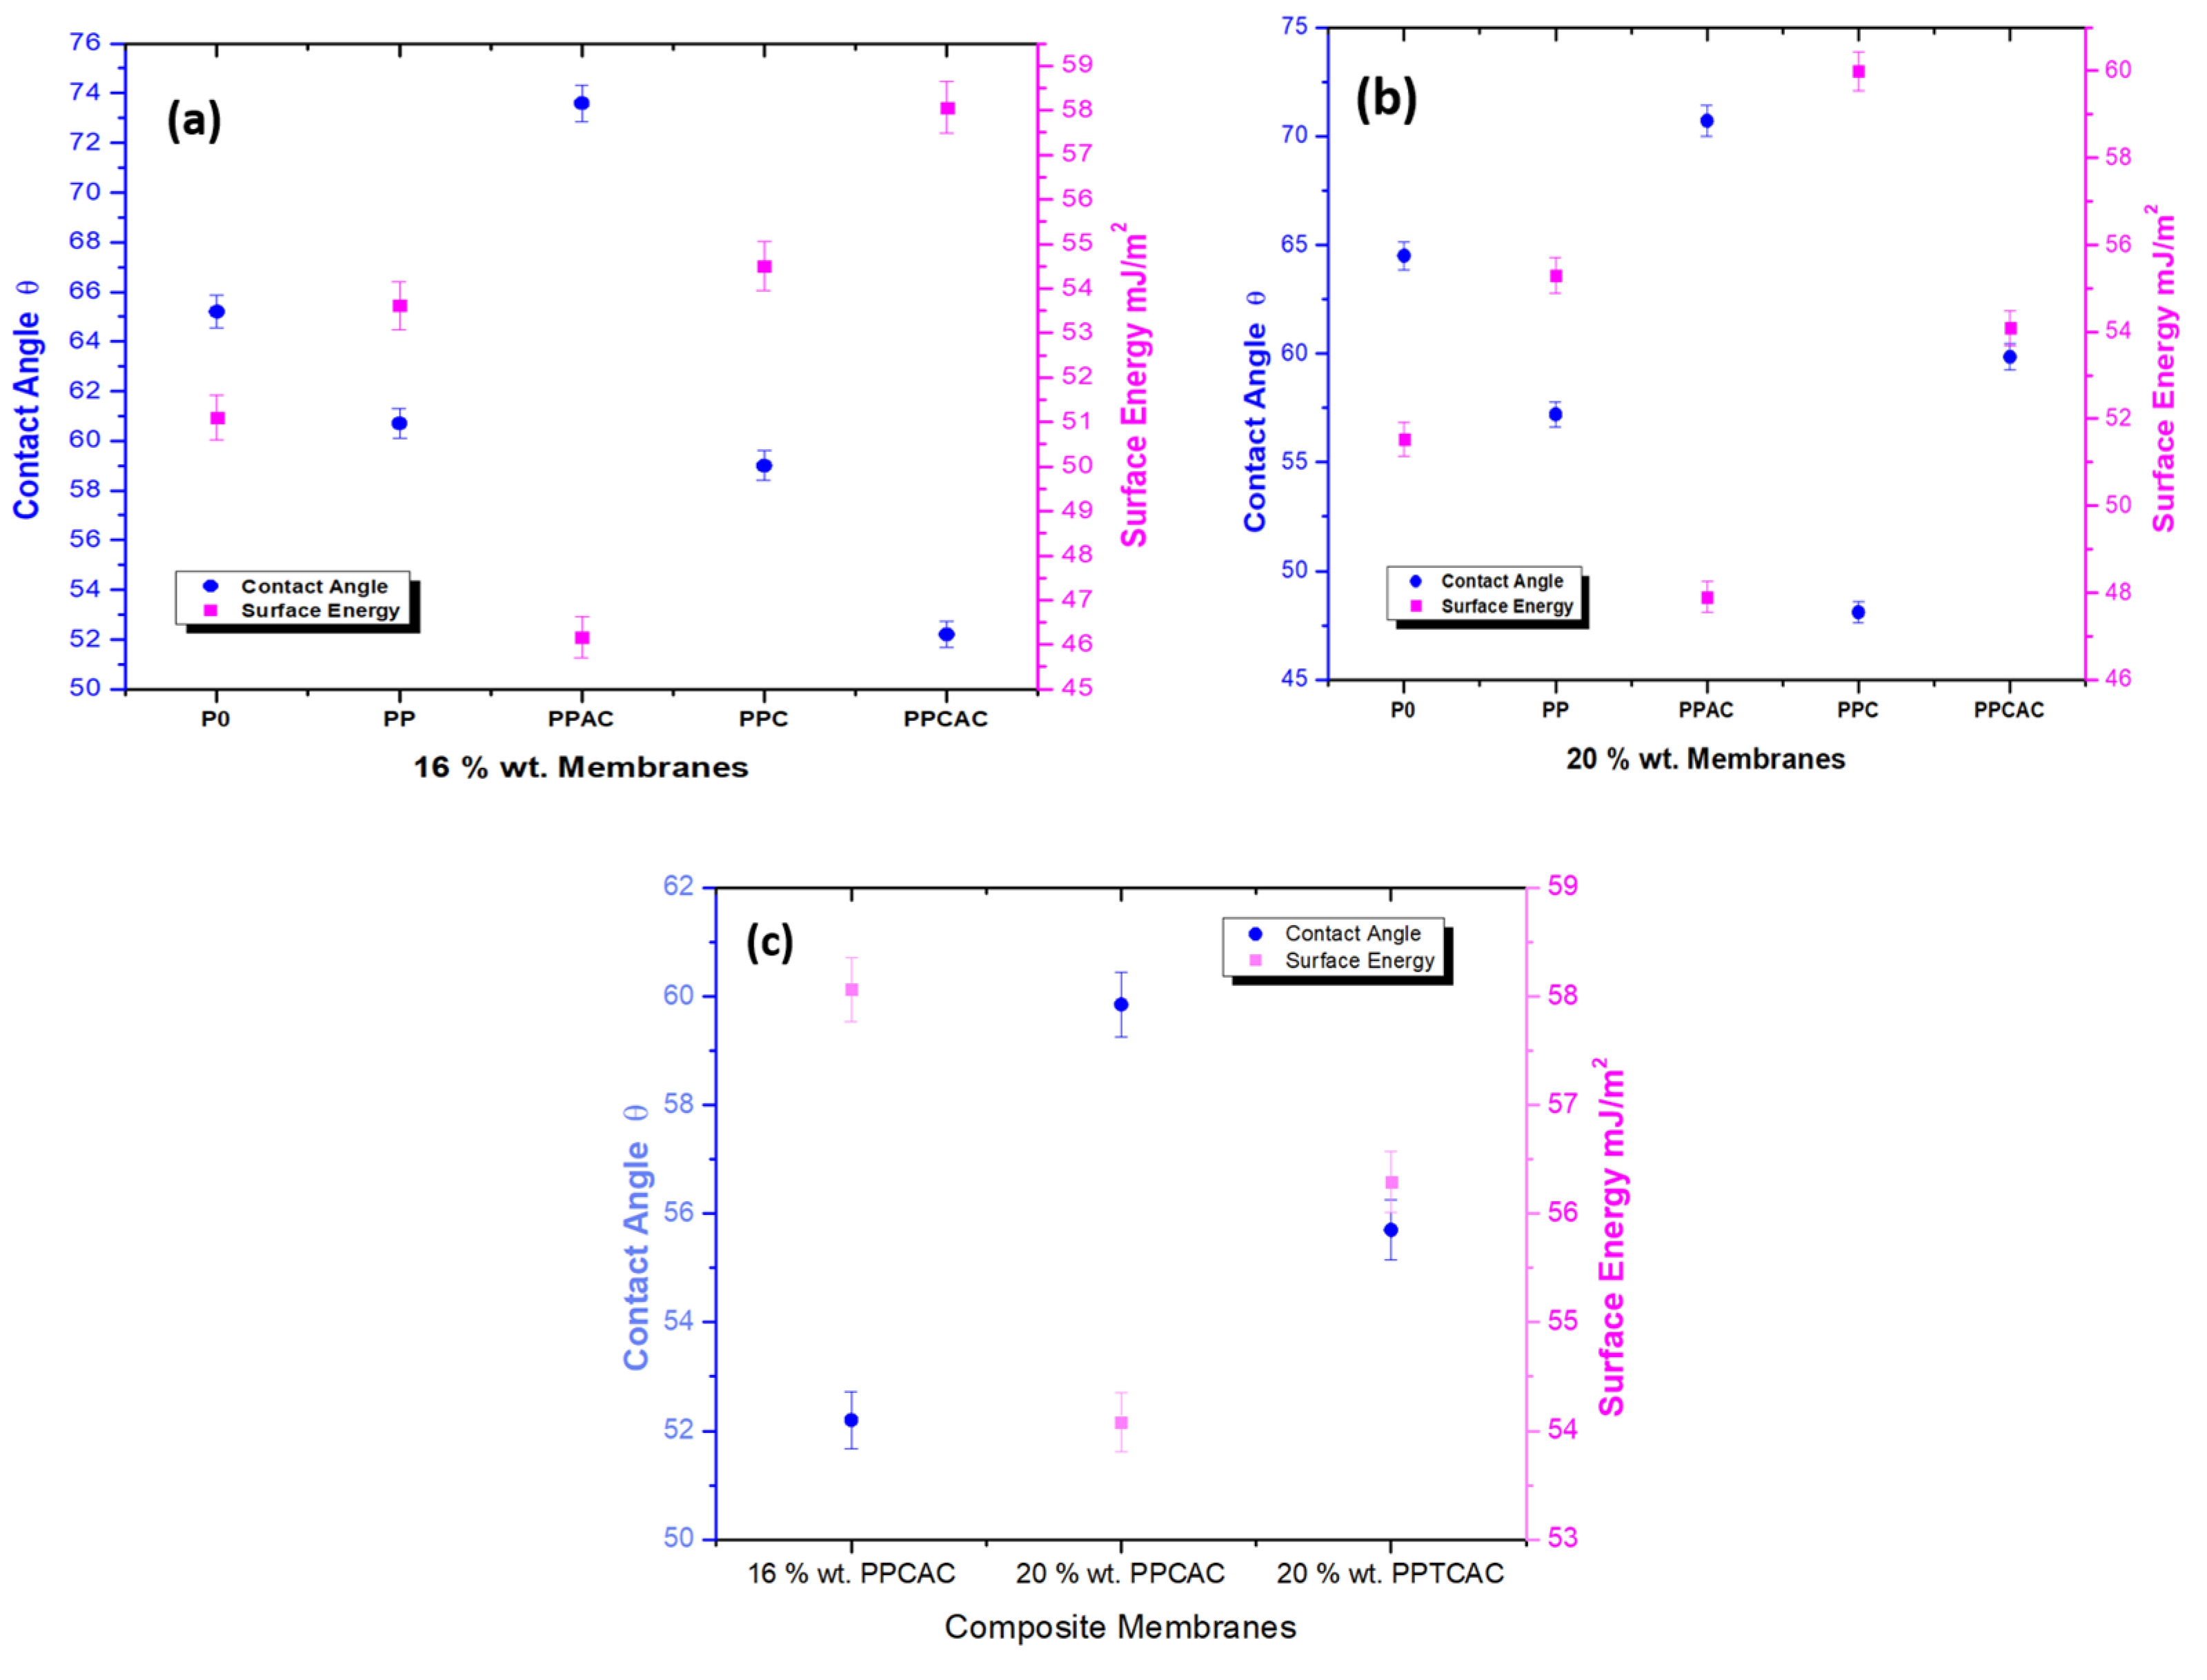
3.3. Surface Hydrophilicity
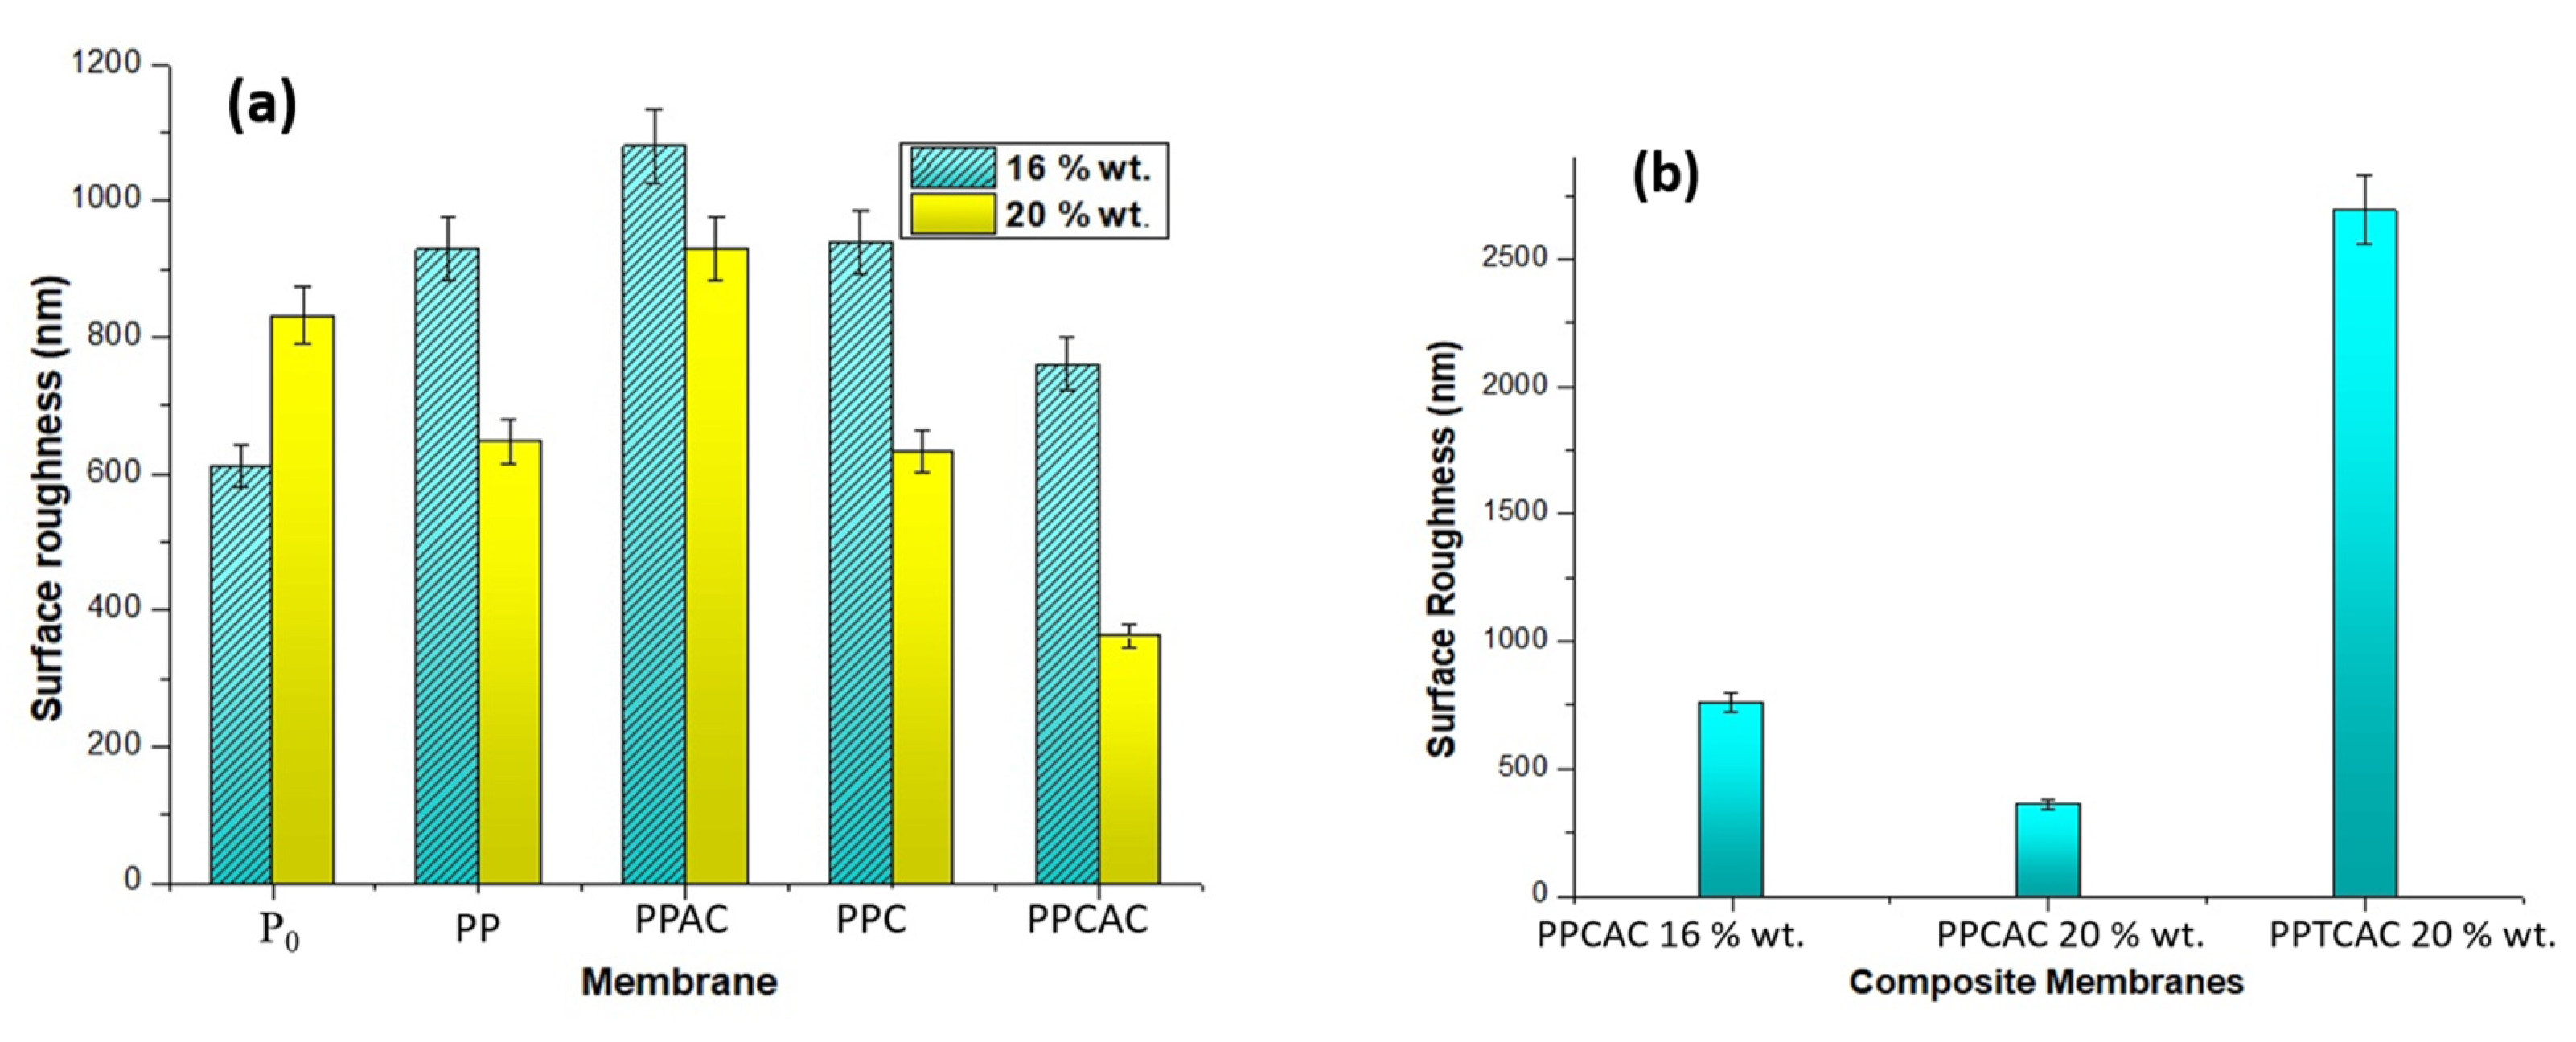
3.4. Surface Roughness
3.5. Water Uptake
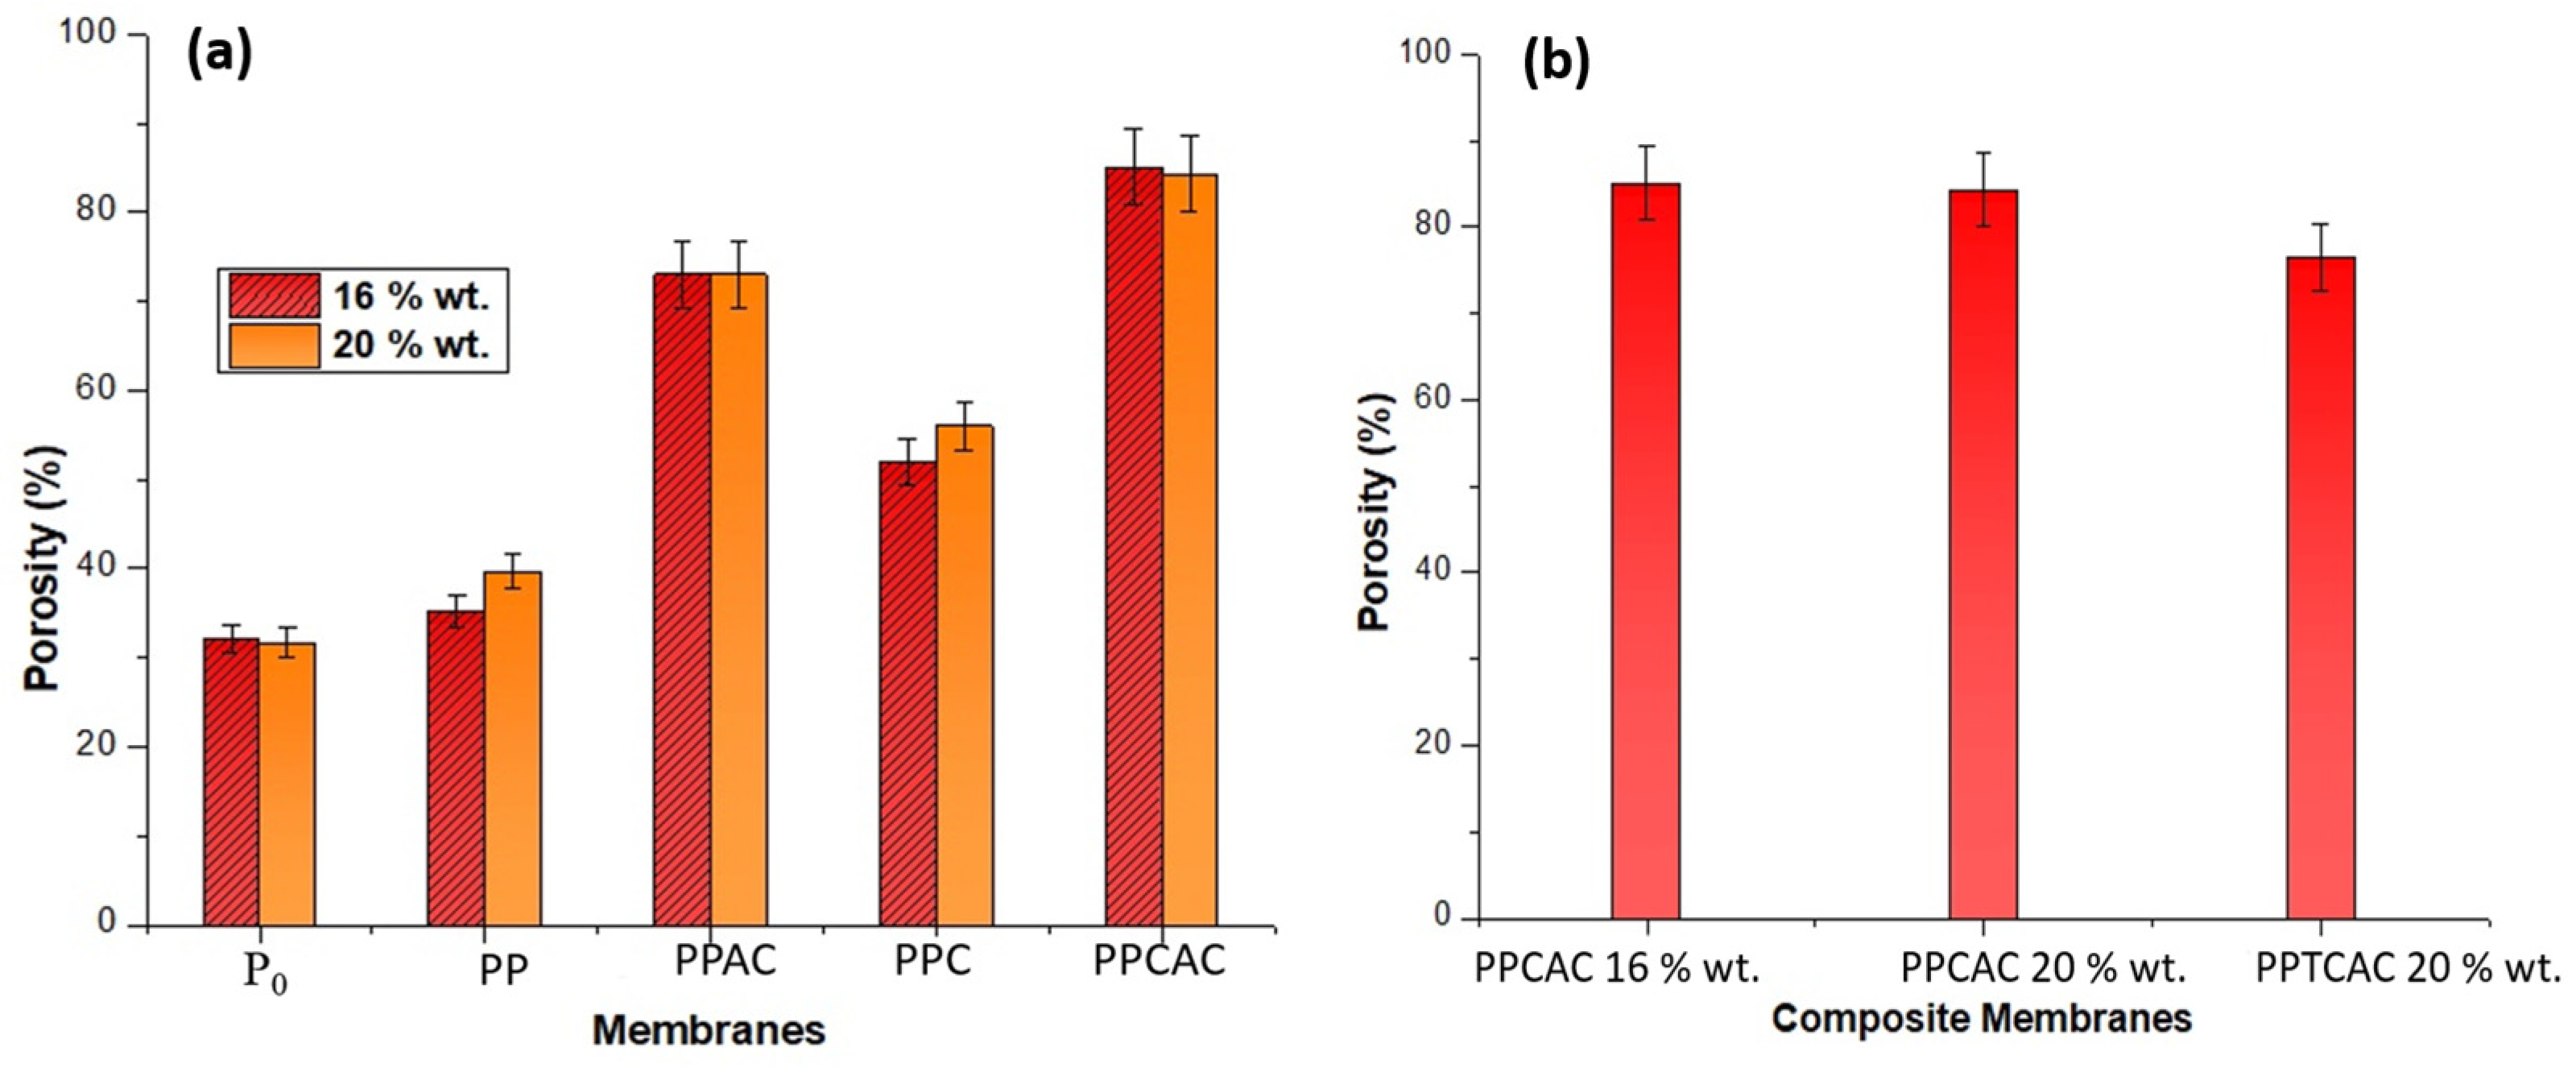
3.6. Porosity
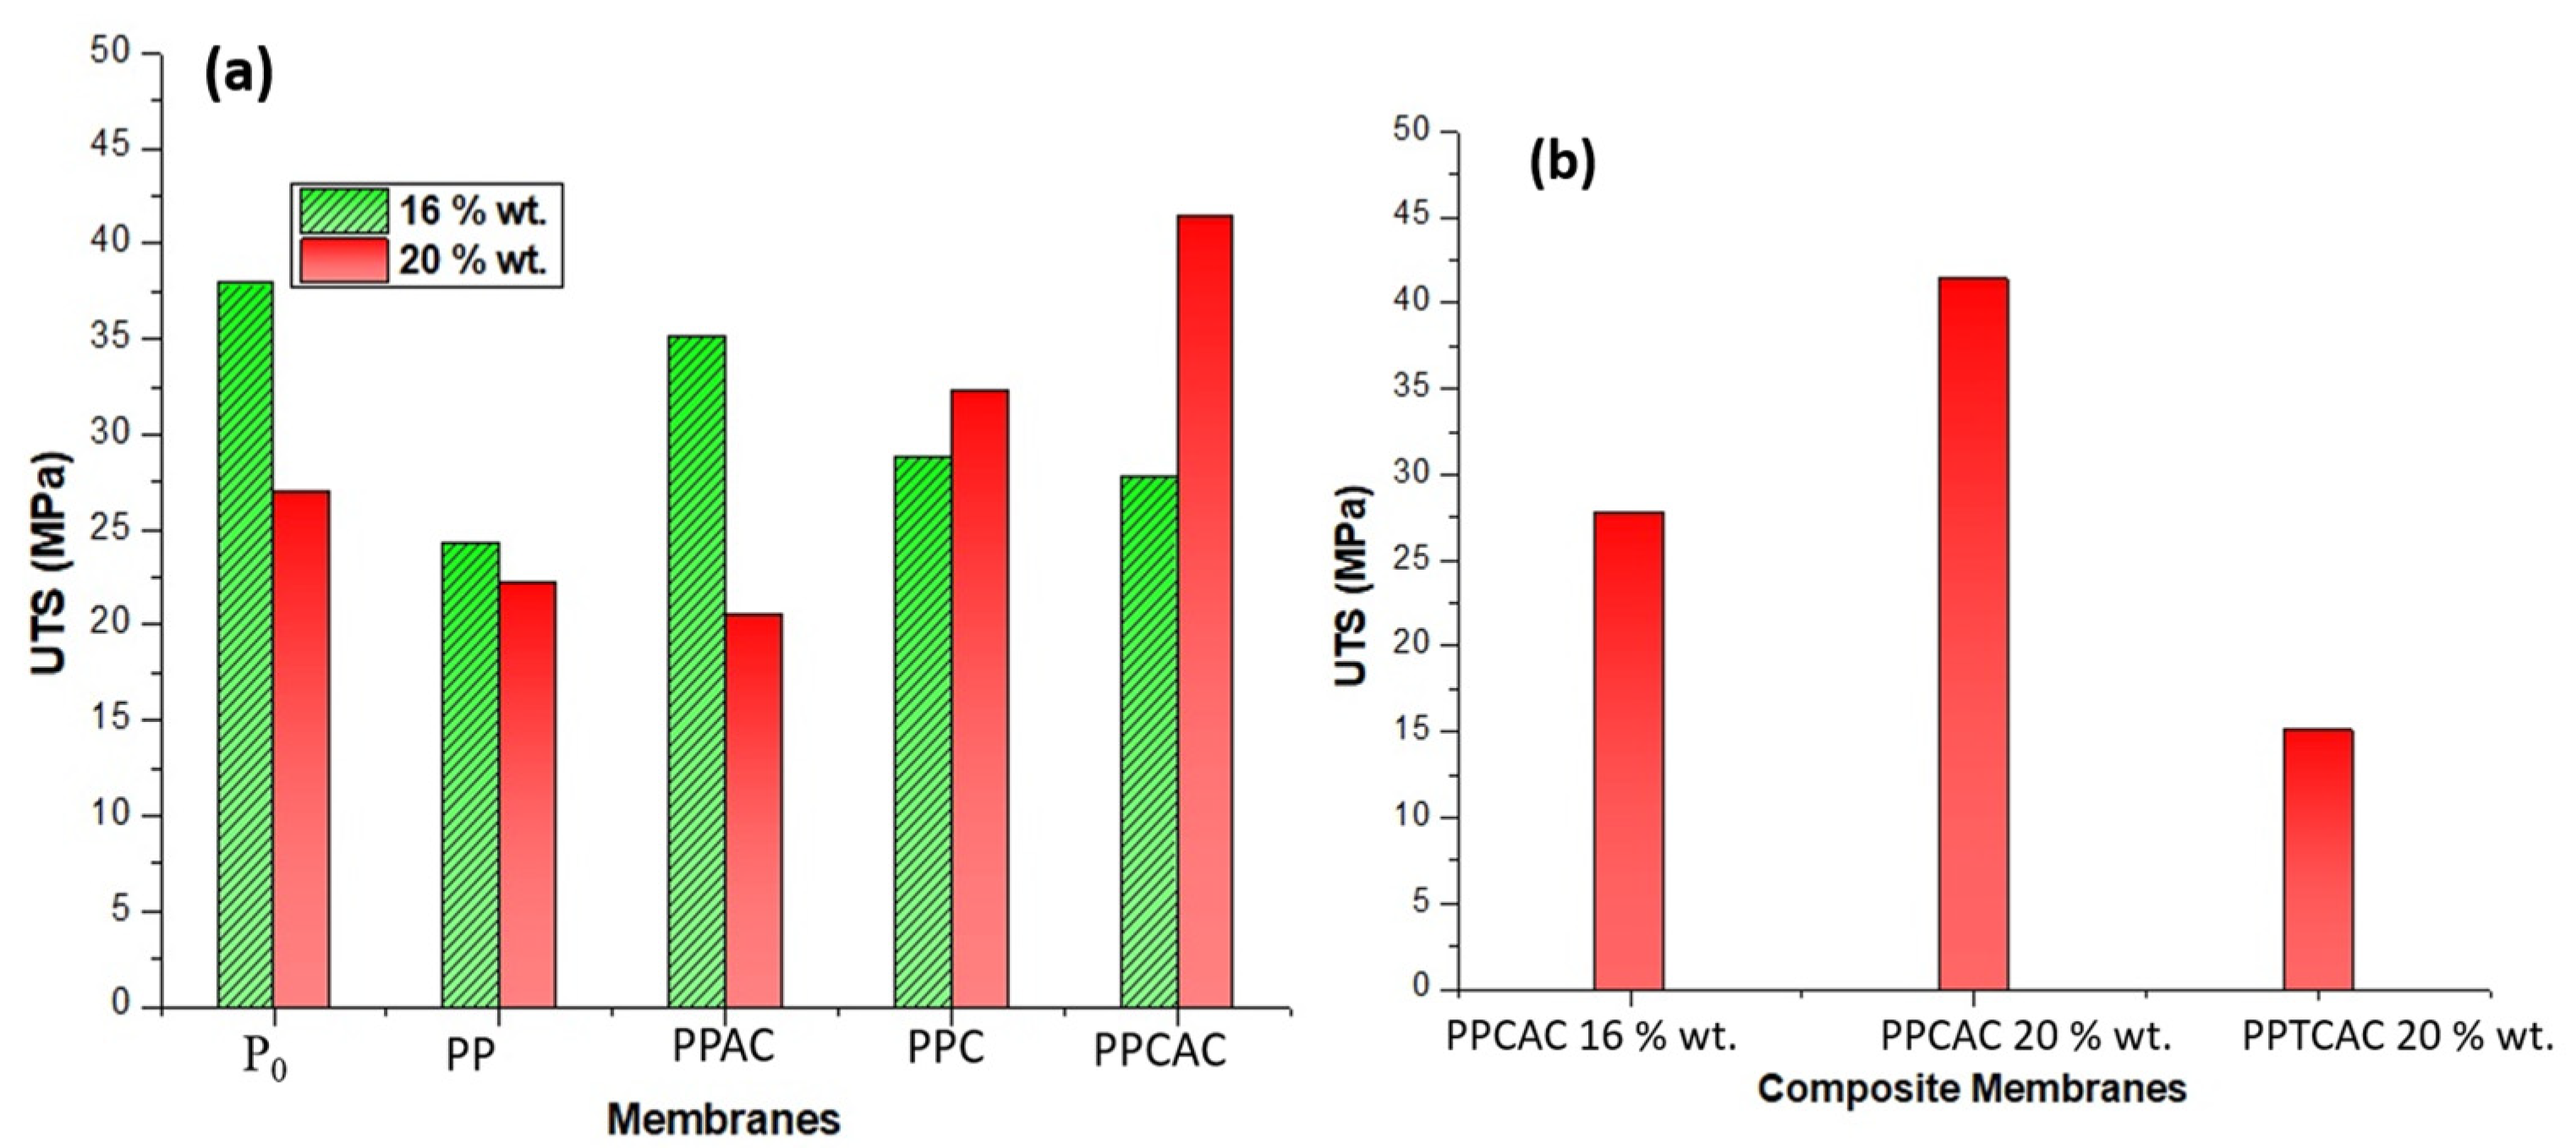
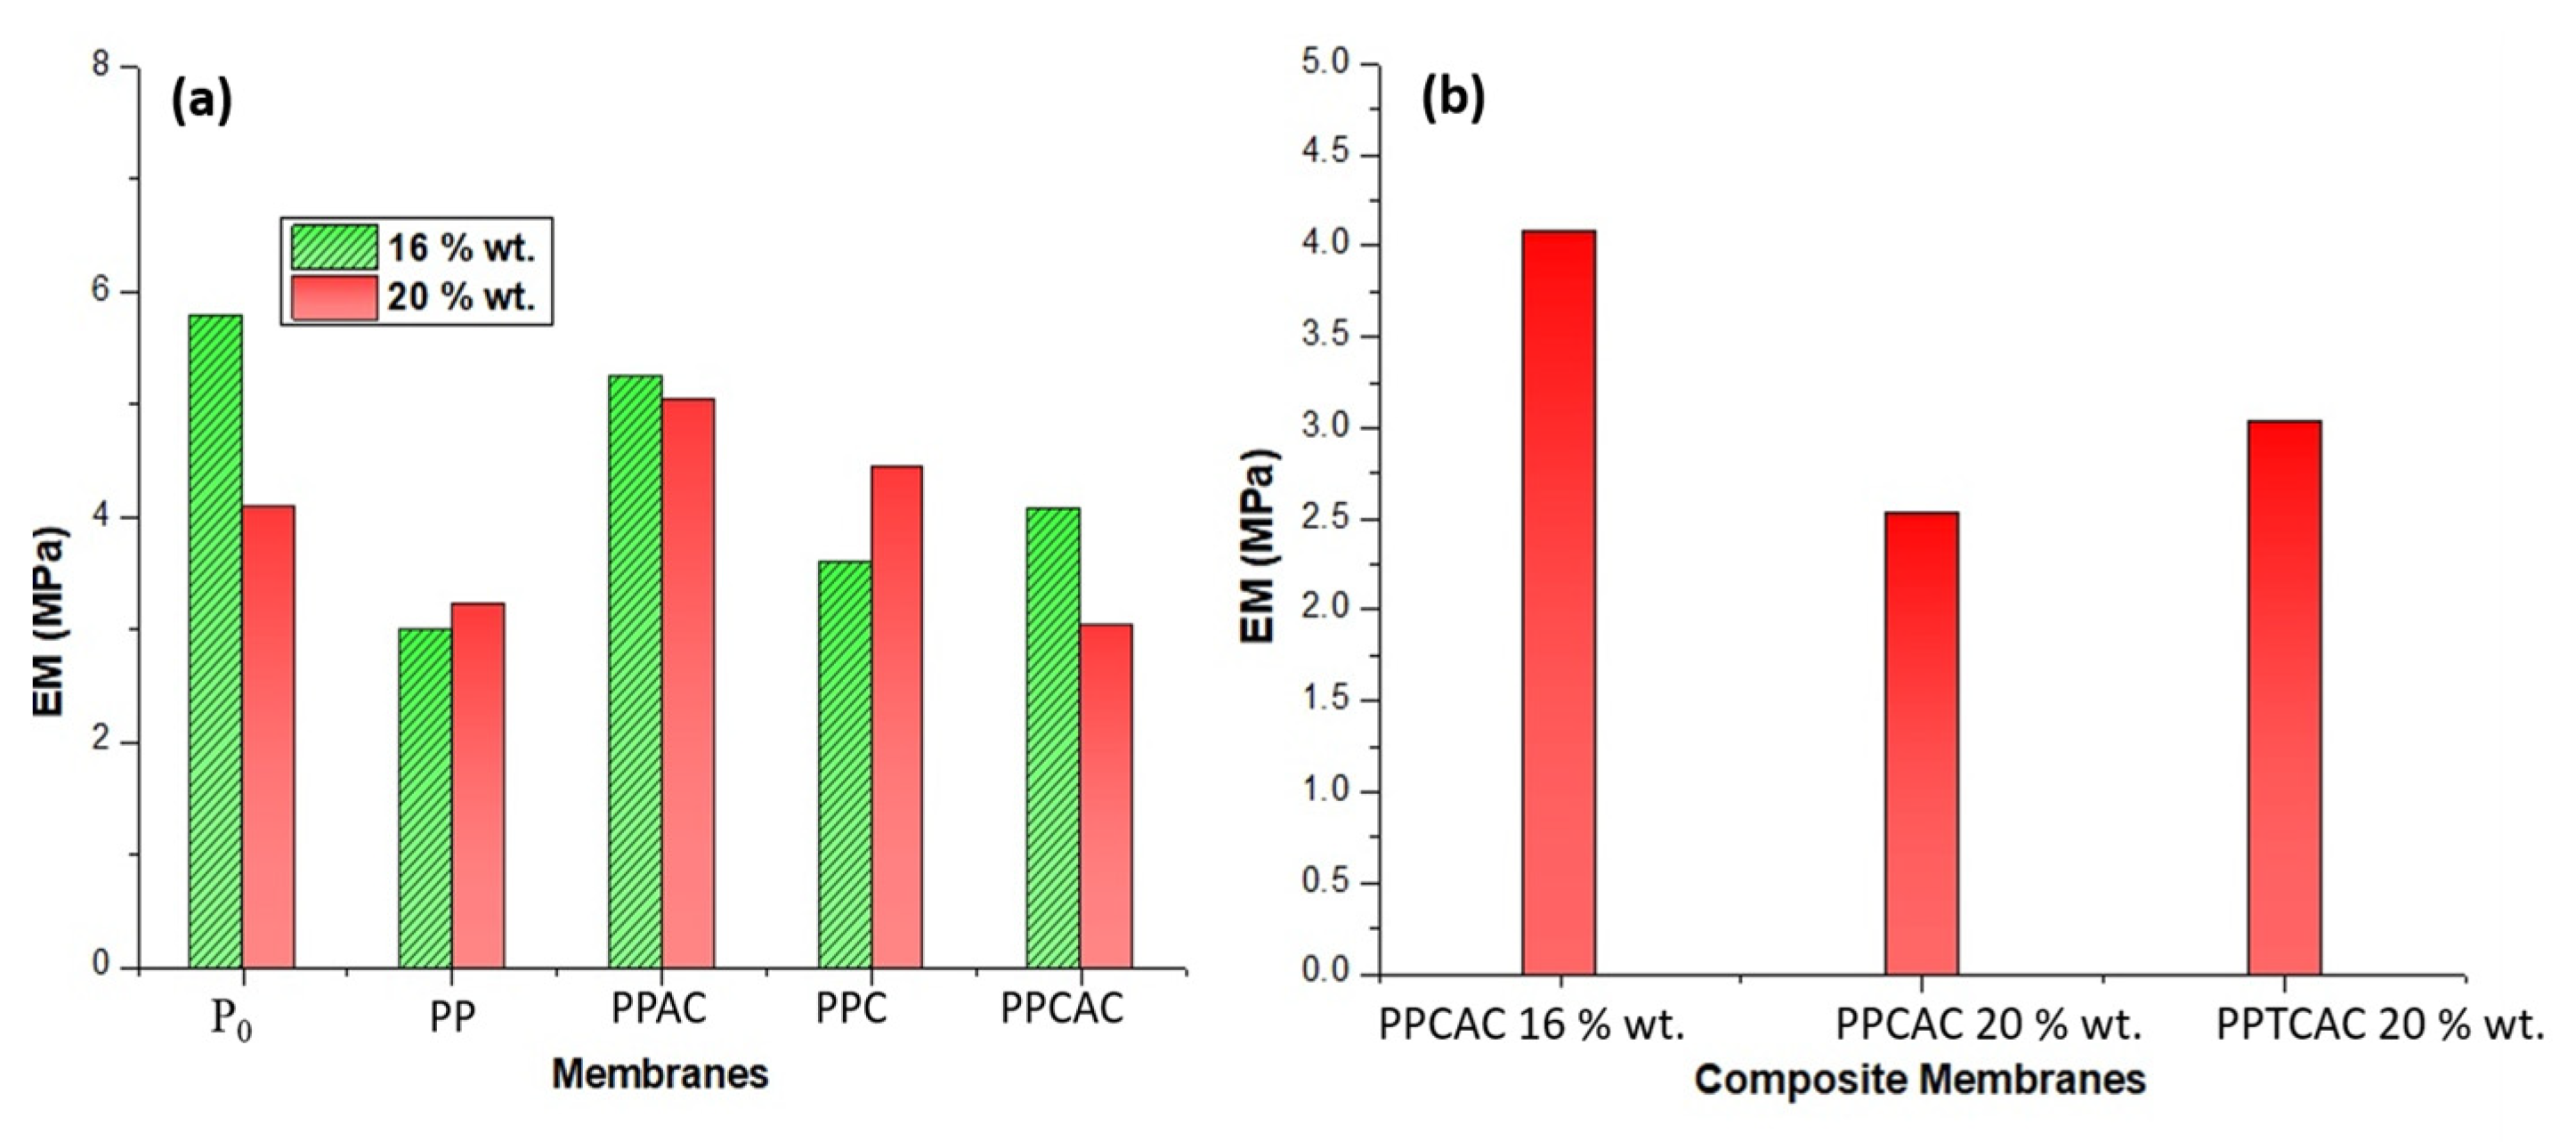
3.7. Tensile Strength
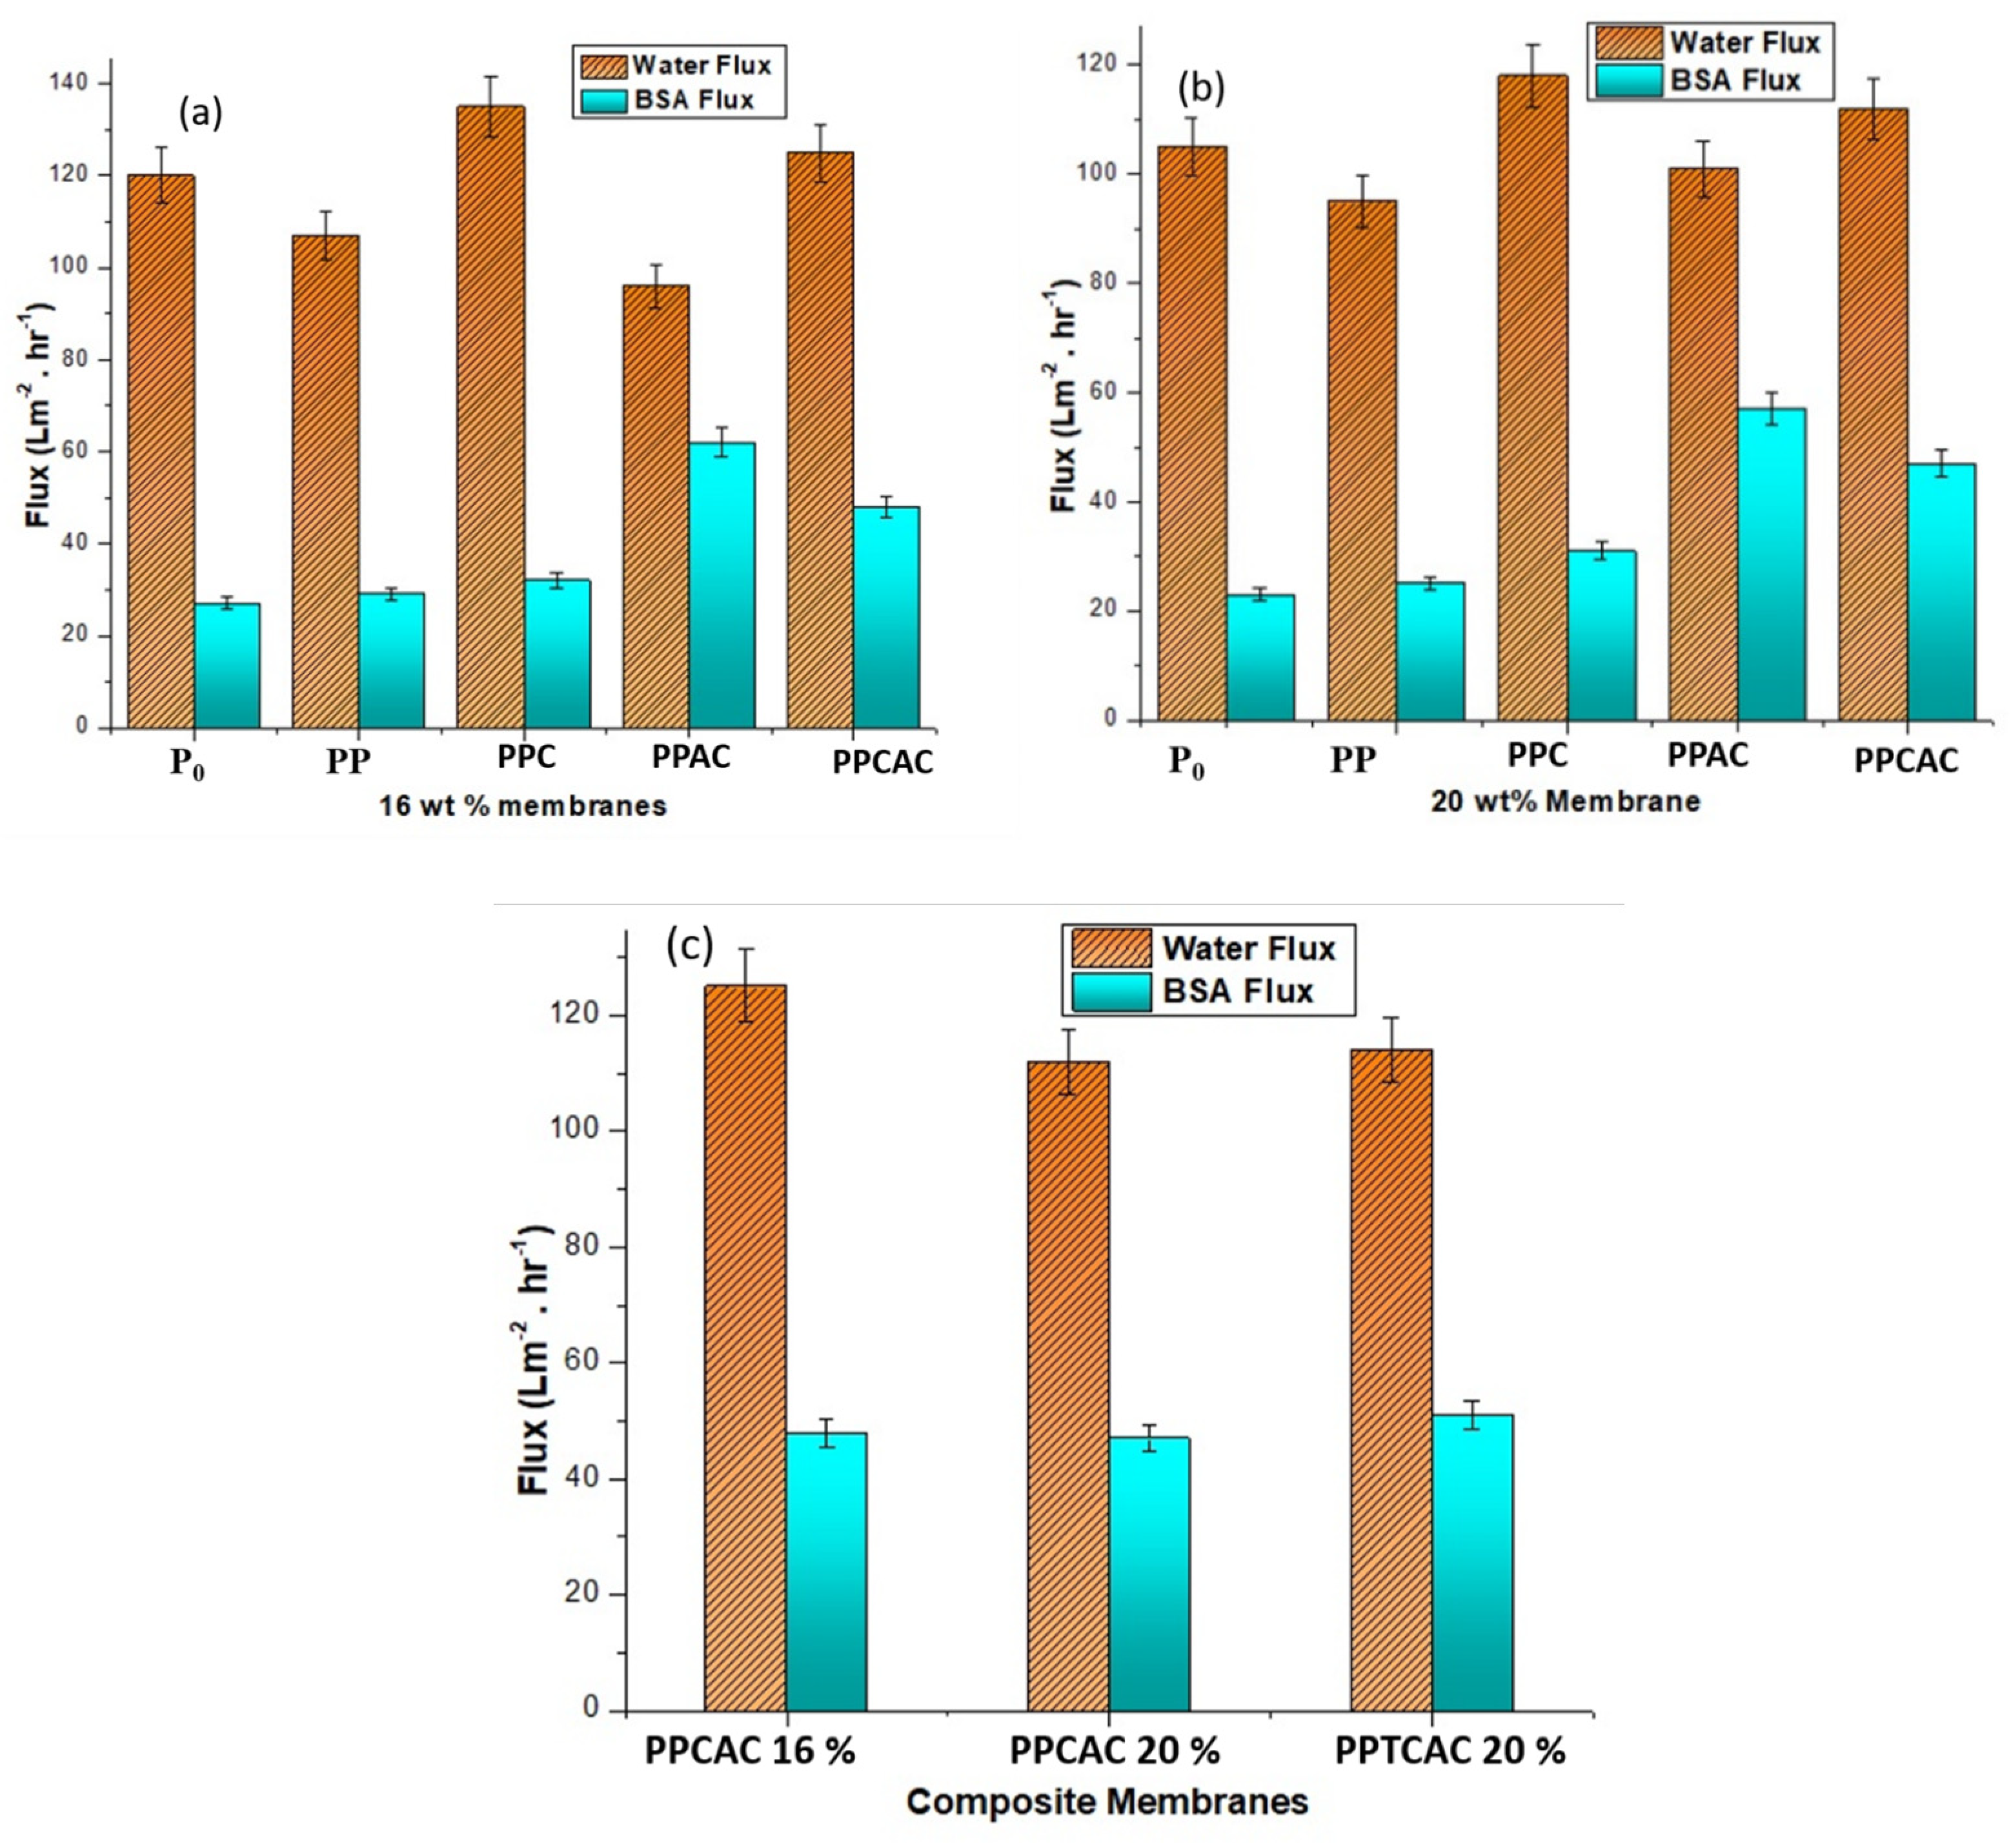
3.8. Water Flux and Bovine Serum Albumin Flux
4. Conclusions
Author Contributions
Funding
Informed Consent Statement
Data Availability Statement
Acknowledgments
Conflicts of Interest
References
- Kunbhar, Z. 21 million in Pakistan don’t have access to clean water. GulfNews, 22 March 2018. [Google Scholar]
- Gu, L.; Xie, M.Y.; Jin, Y.; He, M.; Xing, X.Y.; Yu, Y.; Wu, Q.Y. Construction of antifouling membrane surfaces through layer-by-layer self-assembly of lignosulfonate and polyethyleneimine. Polymers 2019, 11, 1782. [Google Scholar] [CrossRef] [Green Version]
- Richardson, S.D.; Plewa, M.J.; Wagner, E.D.; Schoeny, R.; DeMarini, D.M. Occurrence, genotoxicity, and carcinogenicity of regulated and emerging disinfection by-products in drinking water: A review and roadmap for research. Mutat. Res.—Rev. Mutat. Res. 2007, 636, 178–242. [Google Scholar] [CrossRef] [PubMed]
- Zhao, X.; Su, Y.; Cao, J.; Li, Y.; Zhang, R.; Liu, Y.; Jiang, Z. Fabrication of antifouling polymer-inorganic hybrid membranes through the synergy of biomimetic mineralization and nonsolvent induced phase separation. J. Mater. Chem. A 2015, 3, 7287–7295. [Google Scholar] [CrossRef]
- Velu, S.; Muruganandam, L.; Arthanareeswaran, G. Preparation and performance studies on polyethersulfone ultrafiltration membranes modified with gelatin for treatment of tannery and distillery wastewater. Brazilian J. Chem. Eng. 2015, 32, 179–189. [Google Scholar] [CrossRef] [Green Version]
- Singh, R.; Hankins, N.P. Introduction to Membrane Processes for Water Treatment; Elsevier B.V.: Amsterdam, The Netherlands, 2016. [Google Scholar] [CrossRef]
- van Rijn, C.J.M. Nano and Micro Engineered Membrane Technology, 1st ed.; Elsevier Ltd.: Amsterdam, The Netherlands, 2004; ISBN 9780444514899. [Google Scholar]
- Peters, T. Membrane technology for water treatment. Chem. Eng. Technol. 2010, 33, 1233–1240. [Google Scholar] [CrossRef]
- Lakhotia, S.R.; Mukhopadhyay, M.; Kumari, P. Cerium oxide nanoparticles embedded thin-film nanocomposite nanofiltration membrane for water treatment. Sci. Rep. 2018, 8, 1–10. [Google Scholar] [CrossRef]
- Nguyen, T.; Roddick, F.A.; Fan, L. Biofouling of water treatment membranes: A review of the underlying causes, monitoring techniques and control measures. Membranes 2012, 2, 804–840. [Google Scholar] [CrossRef] [Green Version]
- Sadr, S.M.K.; Saroj, D.P. Membrane Technologies for Municipal Wastewater Treatment; Elsevier Ltd.: Amsterdam, The Netherlands, 2015; ISBN 9781782421269. [Google Scholar]
- van den Berg, T.; Ulbricht, M. Polymer nanocomposite ultrafiltration membranes: The influence of polymeric additive, dispersion quality and particle modification on the integration of zinc oxide nanoparticles into polyvinylidene difluoride membranes. Membranes 2020, 10, 197. [Google Scholar] [CrossRef] [PubMed]
- Milescu, R.A.; McElroy, C.R.; Farmer, T.J.; Williams, P.M.; Walters, M.J.; Clark, J.H. Fabrication of PES/PVP water filtration membranes using cyrene®, a safer bio-based polar aprotic solvent. Adv. Polym. Technol. 2019, 2019, 9692859. [Google Scholar] [CrossRef] [Green Version]
- Nagy, A.; Harrison, A.; Sabbani, S.; Munson, R.S.; Dutta, P.K.; Waldman, W.J. Silver nanoparticles embedded in zeolite membranes: Release of silver ions and mechanism of antibacterial action. Int. J. Nanomed. 2011, 6, 1833–1852. [Google Scholar] [CrossRef] [Green Version]
- Zhang, P.; Zhang, N.; Wang, Q.; Wang, P.; Yuan, J.; Shen, J.; Fan, X. Disulfide bond reconstruction: A novel approach for grafting of thiolated chitosan onto wool. Carbohydr. Polym. 2019, 203, 369–377. [Google Scholar] [CrossRef] [PubMed]
- Mello, R.S.; Bedendo, G.C.; Nome, F.; Fiedler, H.D.; Laranjeira, M.C.M. Preparation of chitosan membranes for filtration and concentration of compounds under high pressure process. Polym. Bull. 2006, 56, 447–454. [Google Scholar] [CrossRef]
- Cunha, A.G.; Fernandes, S.C.M.; Freire, C.S.R.; Silvestre, A.J.D.; Neto, C.P.; Gandini, A. What is the real value of chitosan’s surface energy? Biomacromolecules 2008, 9, 610–614. [Google Scholar] [CrossRef] [PubMed]
- Singh, P.; Chauhan, K.; Priya, V.; Singhal, R.K. A greener approach for impressive removal of As(III)/As(v) from an ultra-low concentration using a highly efficient chitosan thiomer as a new adsorbent. RSC Adv. 2016, 6, 64946–64961. [Google Scholar] [CrossRef]
- Federer, C.; Kurpiers, M.; Bernkop-Schnürch, A. Thiolated Chitosans: A Multi-talented Class of Polymers for Various Applications. Biomacromolecules 2021, 22, 24–56. [Google Scholar] [CrossRef] [PubMed]
- Bubanale, S.; Shivashankar, M. History, Method of Production, Structure and Applications of Activated Carbon. Int. J. Eng. Res. 2017, V6, 495–498. [Google Scholar] [CrossRef]
- Singh, R.K.; Mishra, S.K.; Velramar, B.; Kumar, P.R. Development of Biologically-Based Activated Carbon for Advanced Water and Wastewater Treatment Process. In Bioremediation of Pollutants; Elsevier: Amsterdam, The Netherlands, 2020; pp. 215–225. ISBN 9780128190258. [Google Scholar]
- Miao, J.; Zhang, L.C.; Lin, H. A novel kind of thin film composite nanofiltration membrane with sulfated chitosan as the active layer material. Chem. Eng. Sci. 2013, 87, 152–159. [Google Scholar] [CrossRef]
- Ingole, P.G.; Sawant, S.Y.; Ingole, N.P.; Pawar, R.R.; Bajaj, H.C.; Singh, K.; Cho, M.H.; Lee, H.K. Preparation of activated carbon incorporated polysulfone membranes for dye separation. Membr. Water Treat. 2016, 7, 477–493. [Google Scholar] [CrossRef]
- Qian, X.; Li, N.; Wang, Q.; Ji, S. Chitosan/graphene oxide mixed matrix membrane with enhanced water permeability for high-salinity water desalination by pervaporation. Desalination 2018, 438, 83–96. [Google Scholar] [CrossRef]
- Bagheripour, E.; Moghadassi, A.R.; Hosseini, S.M.; Ray, M.B.; Parvizian, F.; Van der Bruggen, B. Highly hydrophilic and antifouling nanofiltration membrane incorporated with water-dispersible composite activated carbon/chitosan nanoparticles. Chem. Eng. Res. Des. 2018, 132, 812–821. [Google Scholar] [CrossRef]
- Amiera, N.; Arsyad, S.; Khairul, M.; Abdul, A.; Noor, M.; Hazim, M. Effect of chemical treatment on production of activated carbon from Cocos nucifera L. (coconut) shell by microwave irradiation method. J. Trop. Resour. Sustain. Sci. 2016, 4, 112–116. [Google Scholar]
- Singh, K.; Devi, S.; Bajaj, H.C.; Ingole, P.; Choudhari, J.; Bhrambhatt, H. Optical Resolution of Racemic Mixtures of Amino Acids through Nanofiltration Membrane Process. Sep. Sci. Technol. 2014, 49, 2630–2641. [Google Scholar] [CrossRef]
- Shu, J.; Cheng, S.; Xia, H.; Zhang, L.; Peng, J.; Li, C.; Zhang, S. Copper loaded on activated carbon as an efficient adsorbent for removal of methylene blue. RSC Adv. 2017, 7, 14395–14405. [Google Scholar] [CrossRef] [Green Version]
- Gharaie, S.S.; Habibi, S.; Nazockdast, H. Fabrication and characterization of chitosan/gelatin/thermoplastic polyurethane blend nanofibers. J. Text. Fibrous Mater. 2018, 1, 1–8. [Google Scholar] [CrossRef]
- Hwang, L.L.; Chen, J.C.; Wey, M.Y. The properties and filtration efficiency of activated carbon polymer composite membranes for the removal of humic acid. Desalination 2013, 313, 166–175. [Google Scholar] [CrossRef]
- Kanwal, A.; Iqbal, A.; Arshad, R.; Akhtar, S.; Razzaq, S.; Ahmad, N.M.; Naz, H.; Shahnaz, G. Formulation and Evaluation of Novel Thiolated Intra Pocket Periodontal Composite Membrane of Doxycycline. AAPS PharmSciTech 2019, 20, 1–14. [Google Scholar] [CrossRef]
- Kalin, M.; Polajnar, M. The correlation between the surface energy, the contact angle and the spreading parameter, and their relevance for the wetting behaviour of DLC with lubricating oils. Tribol. Int. 2013, 66, 225–233. [Google Scholar] [CrossRef]
- Sam, S.; Malinga, S.P.; Mabuba, N. Carbon nanodots embedded on a polyethersulfone membrane for cadmium(II) removal from water. Membranes 2021, 11, 114. [Google Scholar] [CrossRef] [PubMed]
- Bhatti, H.T.; Ahmad, N.M.; Niazi, M.B.K.; Alvi, M.A.U.R.; Ahmad, N.; Anwar, M.N.; Cheema, W.; Tariq, S.; Batool, M.; Aman, Z.; et al. Graphene Oxide-PES-Based Mixed Matrix Membranes for Controllable Antibacterial Activity against Salmonella typhi and Water Treatment. Int. J. Polym. Sci. 2018, 2018, 7842148. [Google Scholar] [CrossRef] [Green Version]
- Nadir, I.; Rana, N.F.; Ahmad, N.M.; Tanweer, T.; Batool, A.; Taimoor, Z.; Riaz, S.; Ali, S.M. Cannabinoids and terpenes as an antibacterial and antibiofouling promotor for PES water filtration membranes. Molecules 2020, 25, 691. [Google Scholar] [CrossRef] [PubMed] [Green Version]
- Shrestha, A. Characterization of porous membranes via porometry. Master’s Thesis, University of Colorado at Boulder, Boulder, CO, USA, 2012. [Google Scholar]
- Shahnaz, G.; Edagwa, B.J.; McMillan, J.; Akhtar, S.; Raza, A.; Qureshi, N.A.; Yasinzai, M.; Gendelman, H.E. Development of mannose-anchored thiolated amphotericin B nanocarriers for treatment of visceral leishmaniasis. Nanomedicine 2017, 12, 99–115. [Google Scholar] [CrossRef] [PubMed]
- Wang, K.; Abdala, A.A.; Hilal, N.; Khraisheh, M.K. Mechanical Characterization of Membranes; Elsevier B.V.: Amsterdam, The Netherlands, 2017; ISBN 9780444637918. [Google Scholar]
- Alenazi, N.A.; Hussein, M.A.; Alamry, K.A.; Asiri, A.M. Modified polyether-sulfone membrane: A mini review. Des. Monomers Polym. 2017, 20, 532–546. [Google Scholar] [CrossRef] [PubMed] [Green Version]


| Sample | 16% wt. PES | 20% wt. PES | |||||
|---|---|---|---|---|---|---|---|
| PVP (%) | Chitosan (%) | Activated Carbon (%) | PVP (%) | Chitosan (%) | Activated Carbon (%) | Thiolated chitosan (%) | |
| P0 | - | - | - | - | - | - | - |
| PP | 1 | - | - | 1 | - | - | - |
| PPC | 1 | 1.25 | - | 1 | 1.25 | - | - |
| PPAC | 1 | - | 1.25 | 1 | - | 1.25 | - |
| PPCAC | 1 | 1.25 | 1.25 | 1 | 1.25 | 1.25 | -- |
| PPTCAC | - | - | - | 1 | - | 1.25 | 1.25 |
Publisher’s Note: MDPI stays neutral with regard to jurisdictional claims in published maps and institutional affiliations. |
© 2021 by the authors. Licensee MDPI, Basel, Switzerland. This article is an open access article distributed under the terms and conditions of the Creative Commons Attribution (CC BY) license (https://creativecommons.org/licenses/by/4.0/).
Share and Cite
Nayab, S.S.; Abbas, M.A.; Mushtaq, S.; Khan Niazi, B.; Batool, M.; Shehnaz, G.; Ahmad, N.; Ahmad, N.M. Anti-Foulant Ultrafiltration Polymer Composite Membranes Incorporated with Composite Activated Carbon/Chitosan and Activated Carbon/Thiolated Chitosan with Enhanced Hydrophilicity. Membranes 2021, 11, 827. https://doi.org/10.3390/membranes11110827
Nayab SS, Abbas MA, Mushtaq S, Khan Niazi B, Batool M, Shehnaz G, Ahmad N, Ahmad NM. Anti-Foulant Ultrafiltration Polymer Composite Membranes Incorporated with Composite Activated Carbon/Chitosan and Activated Carbon/Thiolated Chitosan with Enhanced Hydrophilicity. Membranes. 2021; 11(11):827. https://doi.org/10.3390/membranes11110827
Chicago/Turabian StyleNayab, Syeda Samia, M. Asad Abbas, Shehla Mushtaq, Bilal Khan Niazi, Mehwish Batool, Gul Shehnaz, Naveed Ahmad, and Nasir M. Ahmad. 2021. "Anti-Foulant Ultrafiltration Polymer Composite Membranes Incorporated with Composite Activated Carbon/Chitosan and Activated Carbon/Thiolated Chitosan with Enhanced Hydrophilicity" Membranes 11, no. 11: 827. https://doi.org/10.3390/membranes11110827
APA StyleNayab, S. S., Abbas, M. A., Mushtaq, S., Khan Niazi, B., Batool, M., Shehnaz, G., Ahmad, N., & Ahmad, N. M. (2021). Anti-Foulant Ultrafiltration Polymer Composite Membranes Incorporated with Composite Activated Carbon/Chitosan and Activated Carbon/Thiolated Chitosan with Enhanced Hydrophilicity. Membranes, 11(11), 827. https://doi.org/10.3390/membranes11110827