Abstract
In this work, a three-dimensional mathematical model including the fluid flow, heat transfer, mass transfer, and charge transfer incorporating electrochemical reactions was developed and applied to investigate the transport phenomena and performance in high-temperature proton exchange membrane fuel cells (HT-PEMFCs) with a membrane phosphoric acid doping level of 5, 7, 9, 11. The cell performance is evaluated and compared in terms of the polarization curve. The distributions of temperature, oxygen mass fraction, water mass fraction, proton conductivity, and local current density of four cases are given and compared in detail. Results show that the overall performance and local transport characteristics are significantly affected by the membrane phosphoric acid doping level.
1. Introduction
Fuel cells are energy conversion devices where the chemical energy of a fuel is directly converted to electrical and thermal energy. Proton exchange membrane fuel cells (PEMFCs) can be used as a power source for various applications due to their high power density, high energy efficiency, and environmental friendliness [1,2]. The operating temperature of low-temperature proton exchange membrane fuel cells (LT-PEMFCs) is below <100 °C. The membrane of LT-PEMFCs must maintain a sufficient hydration level to ensure high proton conductivity. However, water flooding may occur inside fuel cells and then cause cell performance degradation. Therefore, water and thermal management strategies of LT-PEMFCs were extensively investigated [3,4,5]. In order to simplify the water and thermal management, high-temperature proton exchange membrane fuel cells (HT-PEMFCs) with operating temperature above 100 °C were proposed and studied. The advantages of HT-PEMFCs compared with LT-PEMFCs include high CO tolerance, fast reaction kinetics, and easy water management [6,7].
There are lots of studies related to the material and flow field design of HT-PEMFCs. The performance of fuel cells with different bipolar plate materials (aluminum, copper, and stainless steel) was studied numerically and experimentally by Wilberforce et al. [8]. It was reported that the fuel cell with the aluminum bipolar plate provides the best performance among the three different materials. Numerical studies were performed to investigate the performance of fuel cells with different channel to rib ratios [9]. The transport characteristics within fuel cells were analyzed and a maximum power density was observed with a ratio of 1.0. Bottomed-baffles were applied into the anode and cathode channels to improve cell performance [10]. The effect of the bottomed-baffle number on the polarization curves of fuel cells was systematically investigated. It was revealed that the maximum net cell power was provided by the fuel cell with five bottomed-baffles. Metal foams were used as a flow distributor of fuel cells to enhance cell performance [11]. It was reported that the current density improvement was achieved by the application of metal foams. Uniform distributions of species, temperature, and current density were also obtained. The transport phenomena in fuel cells with different flow field designs were numerically studied by Li et al. [12]. It was suggested that the flow field can be optimized to improve the cell performance and uniformity of the reactants inside fuel cells. Experimental studies were carried out to investigate the cell performance of fuel cells with serpentine and parallel channels [13]. Results showed that the fuel cell with serpentine channels provides better performance and higher pressure drop as well. A modified-serpentine flow field was designed and investigated numerically and experimentally by Singdeo et al. [14]. It was found that the uniformity of reactant and product distribution was enhanced compared with the serpentine flow field.
Numerical studies about the fuel cell components and operating conditions of HT-PEMFCs were also performed by researchers. The effects of membrane thickness and ionomer volume fraction in the catalyst layers on the performance were numerically analyzed by Mohanty et al. [15]. Their work confirmed that cell performance increases with decreasing membrane thickness. The cell performance is also strongly influenced by the ionomer volume fraction in the catalyst layers. The transport phenomena of fuel cells with/without microporous layers were numerically investigated and assessed by Nanadegani et al. [16]. The effect of adding microporous layers on heat and mass transfer processes was analyzed. The cell performance is significantly improved due to the presence of microporous layers. The mass transport impact on the cell performance was numerically studied by Das et al. [17]. The polarization curves of fuel cells under different inlet velocities, membrane thicknesses, membrane ionic conductivities, and porosities were obtained and compared. The effect of operating temperature on transport processes of heat, species, and charge inside fuel cells was numerically studied by Elden et al. [18]. The corresponding cell performance was also evaluated and compared.
The perfluorosulfonic acid (PFSA) membrane is used in LT-PEMFCs, while the polybenzimidazole (PBI) membrane is utilized in HT-PEMFCs. In order to obtain high proton conductivity, the PBI membrane is always doped with phosphoric acid, sulfuric acid, etc. [19,20,21]. Constant proton conductivities of the membrane are widely used in mathematical models to investigate the multi-physics phenomena and performance in HT-PEMFCs [10,15,17,21,22,23]. However, the membrane proton conductivity is a function of temperature and phosphoric acid doping level [24,25,26,27]. The transport processes and cell performance are greatly influenced by the membrane conductivity, which has a strong relationship with the phosphoric acid doping level. Therefore, it is necessary to perform a comprehensive investigation to examine the effect of membrane phosphoric acid doping level on local transport phenomena and overall performance in HT-PEMFCs. In the present work, a three-dimensional mathematical model including the fluid flow, heat transfer, mass transfer, charge transfer, and electrochemical reactions was developed and employed to study the transport characteristics and performance in HT-PEMFCs with different membrane phosphoric acid doping levels. The obtained results can improve the understanding of transport characteristics in HT-PEMFCs.
2. Model Description
2.1. Physical Model
As shown in Figure 1, a single channel unit is selected as the computational domain, which includes the anode/cathode current collectors (CCs), gas flow channels (GFCs), gas diffusion layers (GDLs), catalyst layers (CLs), and membrane. The detailed geometric parameters of fuel cell components are given in Table 1. The operating temperature and pressure are 453.15 K and 1.0 atm, respectively. The reactants of hydrogen and air are provided at the anode and cathode inlet of GFCs with the co-flow arrangement, respectively. The assumptions made in the study are as follows: the fluid flow is laminar; ideal gas law is applied; the GDLs and CLs are isotropic and homogeneous; the membrane is impervious to reactant gases; contact resistances between different layers are neglected.
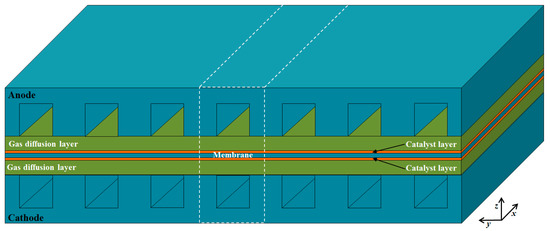
Figure 1.
Schematic of a single fuel cell and the computational domain.

Table 1.
Geometric parameters of the computational domain.
2.2. Governing Equations
The governing equations of mass, momentum, species, energy, charge are given as follows:
Mass equation:
where ρ and are the density and velocity, respectively. Smass is the source term of the mass equation.
Momentum equation:
where P and μ are the pressure and dynamic viscosity, respectively. Smom is the source term of the momentum equation.
Species equation:
where Yi and Deff,i are the mass fraction and effective diffusivity, respectively. Si is the source term of the species equation.
Energy equation:
where Cp and keff are the specific heat and effective thermal conductivity, respectively. ST is the source term of the energy equation. The effective thermal conductivity can be determined by the following expression:
where ks is the thermal conductivity of the solid phase, and kf is the thermal conductivity of the gas phase.
Charge equation:
where σeff,s is the effective electrical conductivity, σeff,m the effective proton conductivity, ϕs the electrical potential, ϕm the proton potential. Ss/m is the source term of the charge equation. The Butler–Volmer equation is applied to describe the hydrogen oxidation reaction and oxygen reduction reaction in the anode and cathode CLs, respectively.
The volumetric current density in the CLs can be determined by:
The anode and cathode over-potentials are represented as:
The open circuit voltage can be determined by the following expression.
The membrane proton conductivity is a function of the temperature and phosphoric acid doping level [20,27]:
where DL is the phosphoric acid doping level, and the effective electrical conductivity and proton conductivity of the GDLs and CLs are modified by the Bruggeman correlation:
The source terms of the above-mentioned governing equations are summarized in Table 2, and Table 3 gives the parameters used in the mathematical model.
Table 2.
Source terms of the governing equations.
Table 3.
Parameters used in the mathematical model.
2.3. Numerical Implementation
The implementation of the fuel cell mathematical model is performed in the software ANSYS FLUENT. The finite volume method is used for solving partial differential equations. The electron and proton transport are described by the equations defined by user-defined functions. At the inlet of the GFCs, the mass flow rate, temperature, and species mass fractions are prescribed. At the outlet of the GFCs, a pressure-outlet boundary condition is assigned. The anode and cathode mass flow rates are 7.117 × 10⁻⁷ kg/s and 2.073 × 10⁻⁸ kg/s, respectively. The detailed boundary conditions are illustrated in Table 4.
Table 4.
Parameters used in the mathematical model.
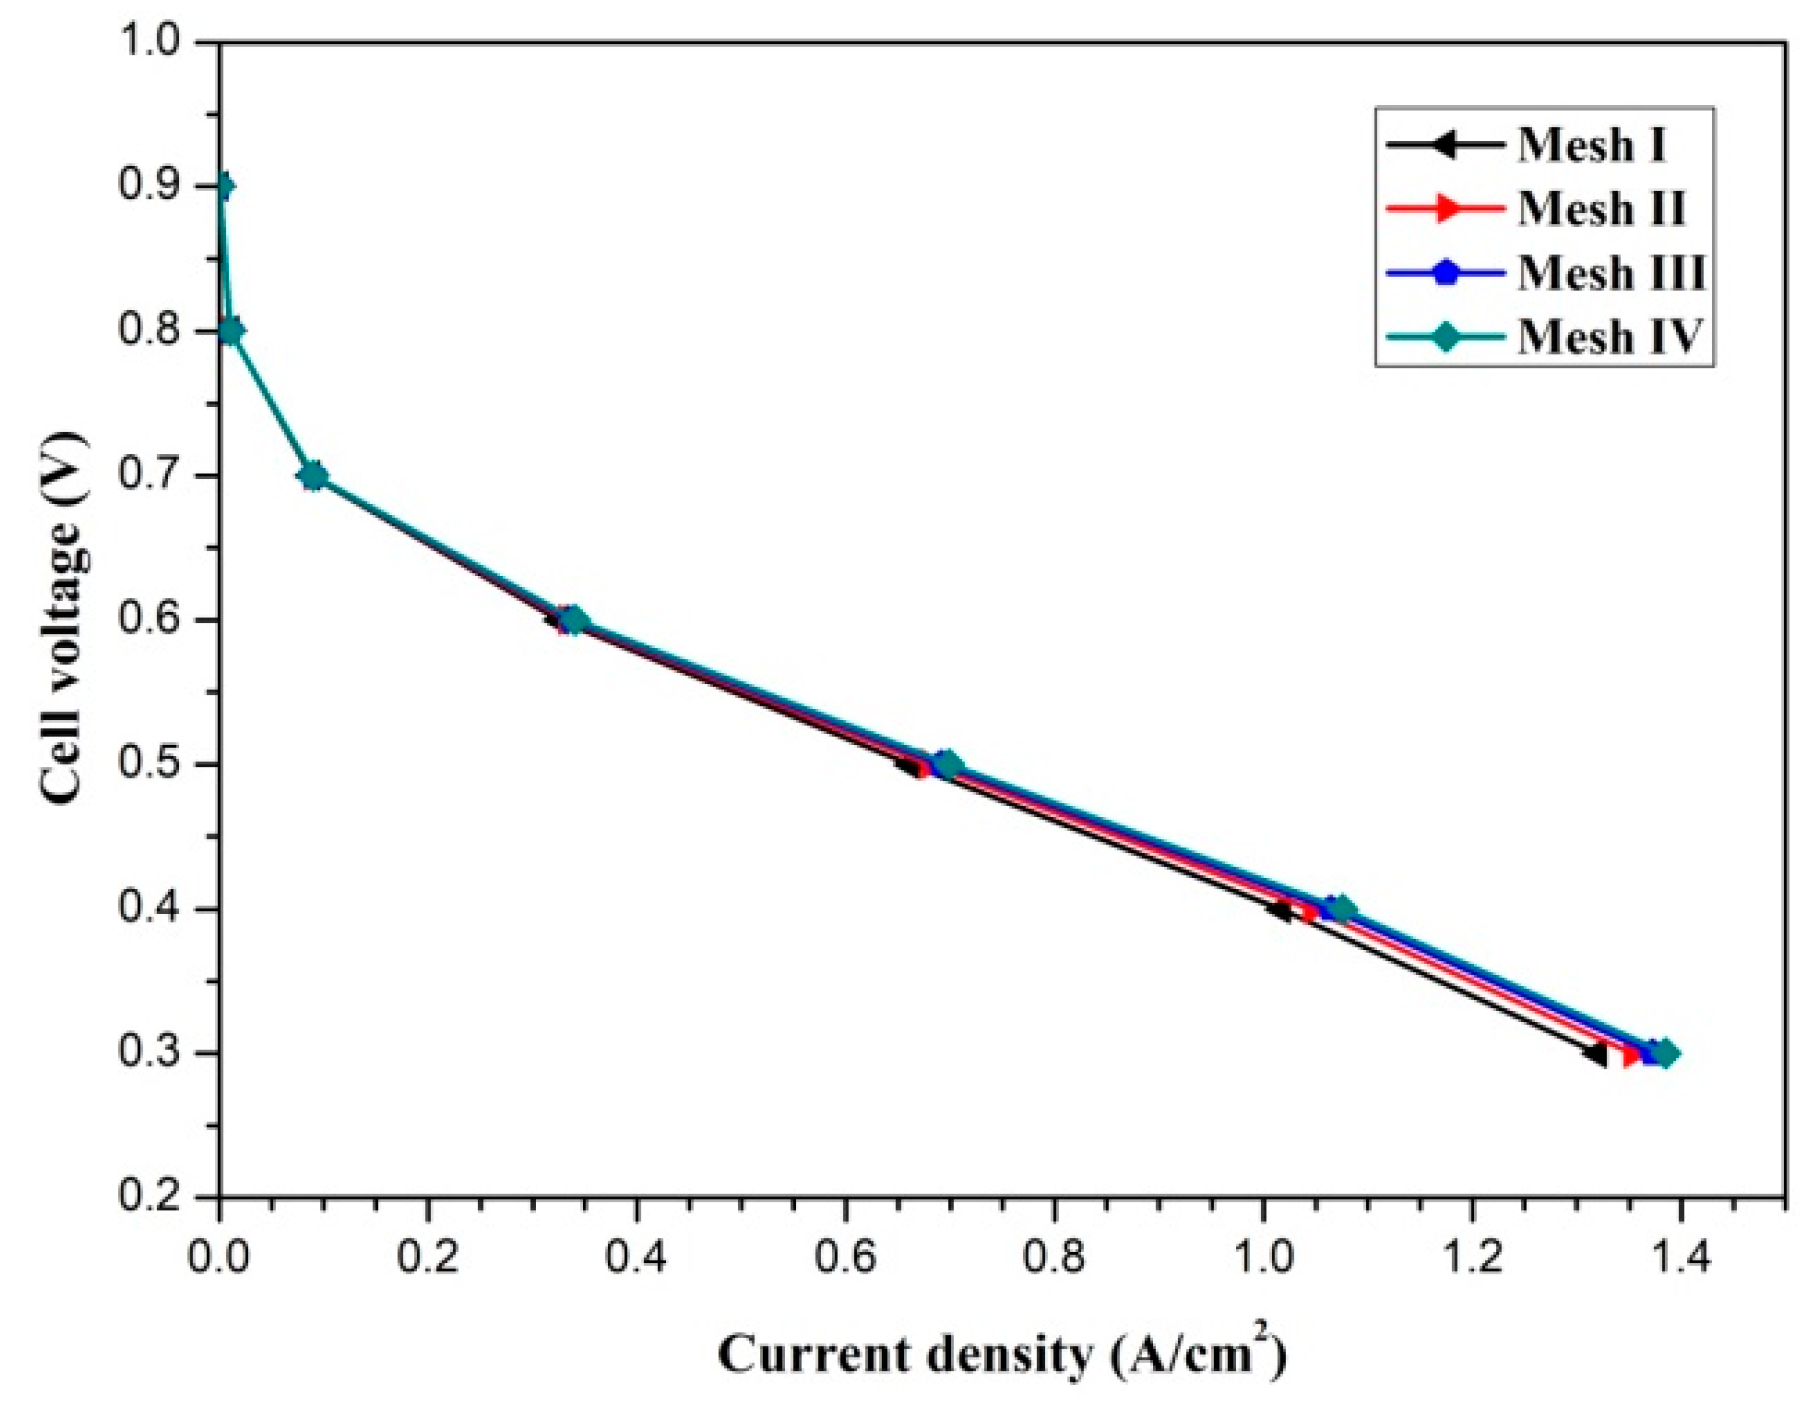
The pressure and velocity fields are linked by the Semi-Implicit Method for Pressure Linked Equations (SIMPLE) algorithm. Four mesh systems (x × y × z), namely, mesh I (50 × 12 × 48), mesh II (75 × 16 × 64), mesh III (100 × 20 × 80), and mesh IV (125 × 24 × 96) are utilized to examine the mesh independence. The polarization curves of the fuel cell with different mesh numbers are presented in Figure 2. Mesh system III is selected to balance the accuracy and computational resources. The model validation was carried out and can be found in our previous study [11].

Figure 2.
The mesh independence test.
3. Results and Discussion
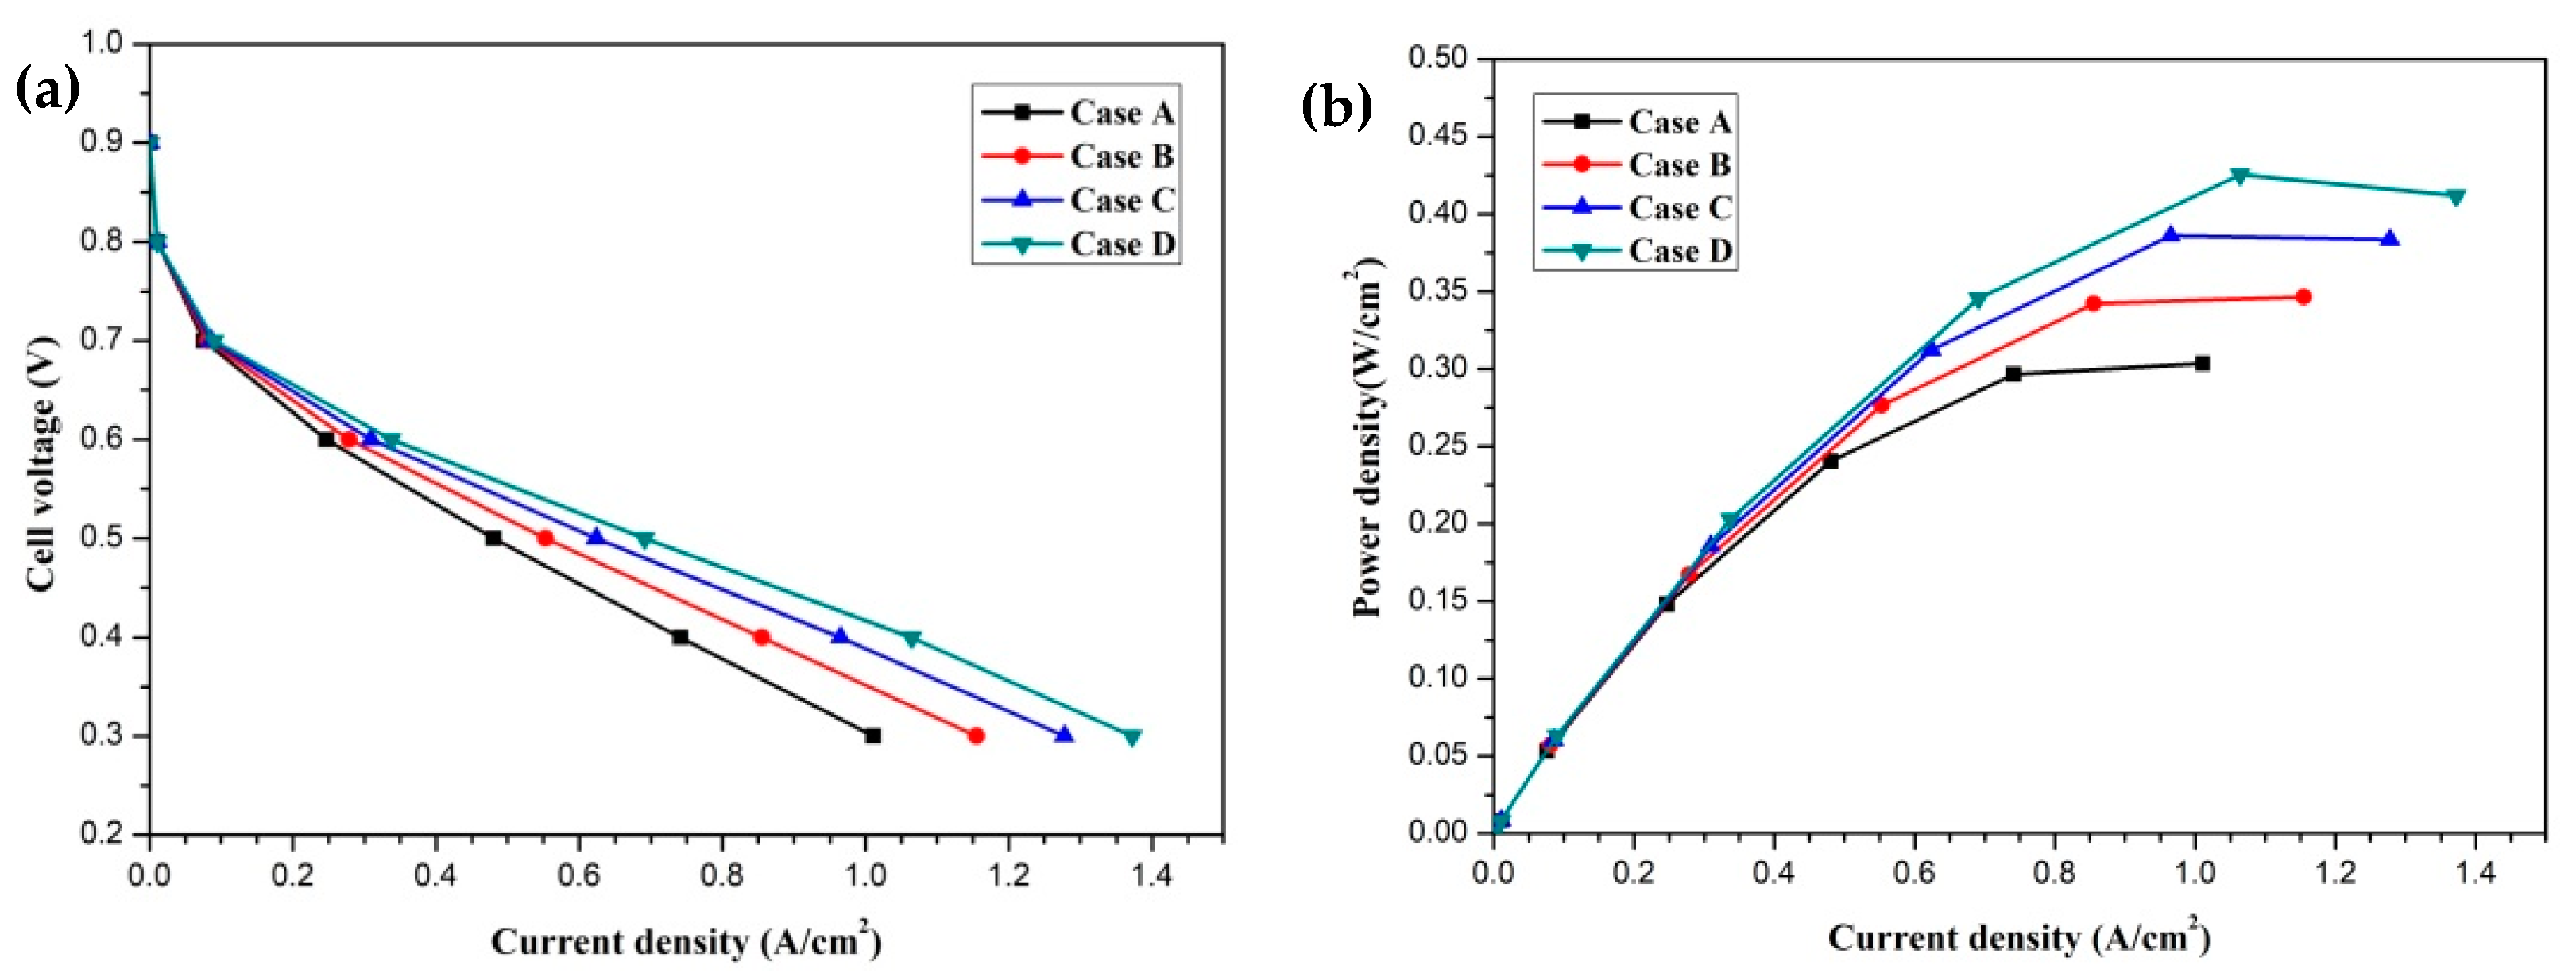
In this section, the transport characteristics and performance of HT-PEMFCs with different membrane phosphoric acid doping levels (DLs) are presented and compared in detail. Four cases are labeled as Case A, Case B, Case C, and Case D, which represent DL = 5, DL = 7, DL = 9, and DL = 11, respectively. The DL of the membrane is defined as the molar percentage of the acid (mol% H3PO4) per repeat unit of the PBI polymer [20]. The effect of the membrane phosphoric acid doping level on cell performance is given in Figure 3. The current density-cell voltage and current density-power density curves are presented and compared. The polarization curves of four cases are illustrated in Figure 3a. It is clearly seen that the cell performance is significantly affected by the DL and it is improved with an increase in DL. This is attributed to the decrease in the proton transport resistance. The proton conductivity is a function of temperature and DL. The proton conductivity is increased with increasing DL. This means that the proton transport process is enhanced and the ohmic loss is decreased. The current densities of four cases at the cell voltage 0.3 V are 1.011 A/cm2, 1.155 A/cm2, 1.278 A/cm2 and 1.372 A/cm2, respectively. The current density–power density curves are shown in Figure 3b. It can be observed that the power densities of four cases at the cell voltage 0.3 V are 0.303 W/cm2, 0.346 W/cm2, 0.383 W/cm2 and 0.412 W/cm2, respectively.

Figure 3.
The cell performance of fuel cells with different membrane phosphoric acid doping levels (Case A: DL = 5; Case B: DL = 7; Case C: DL = 9; Case D: DL = 11): (a) cell voltage-current density curve; (b) power density-current density curve.
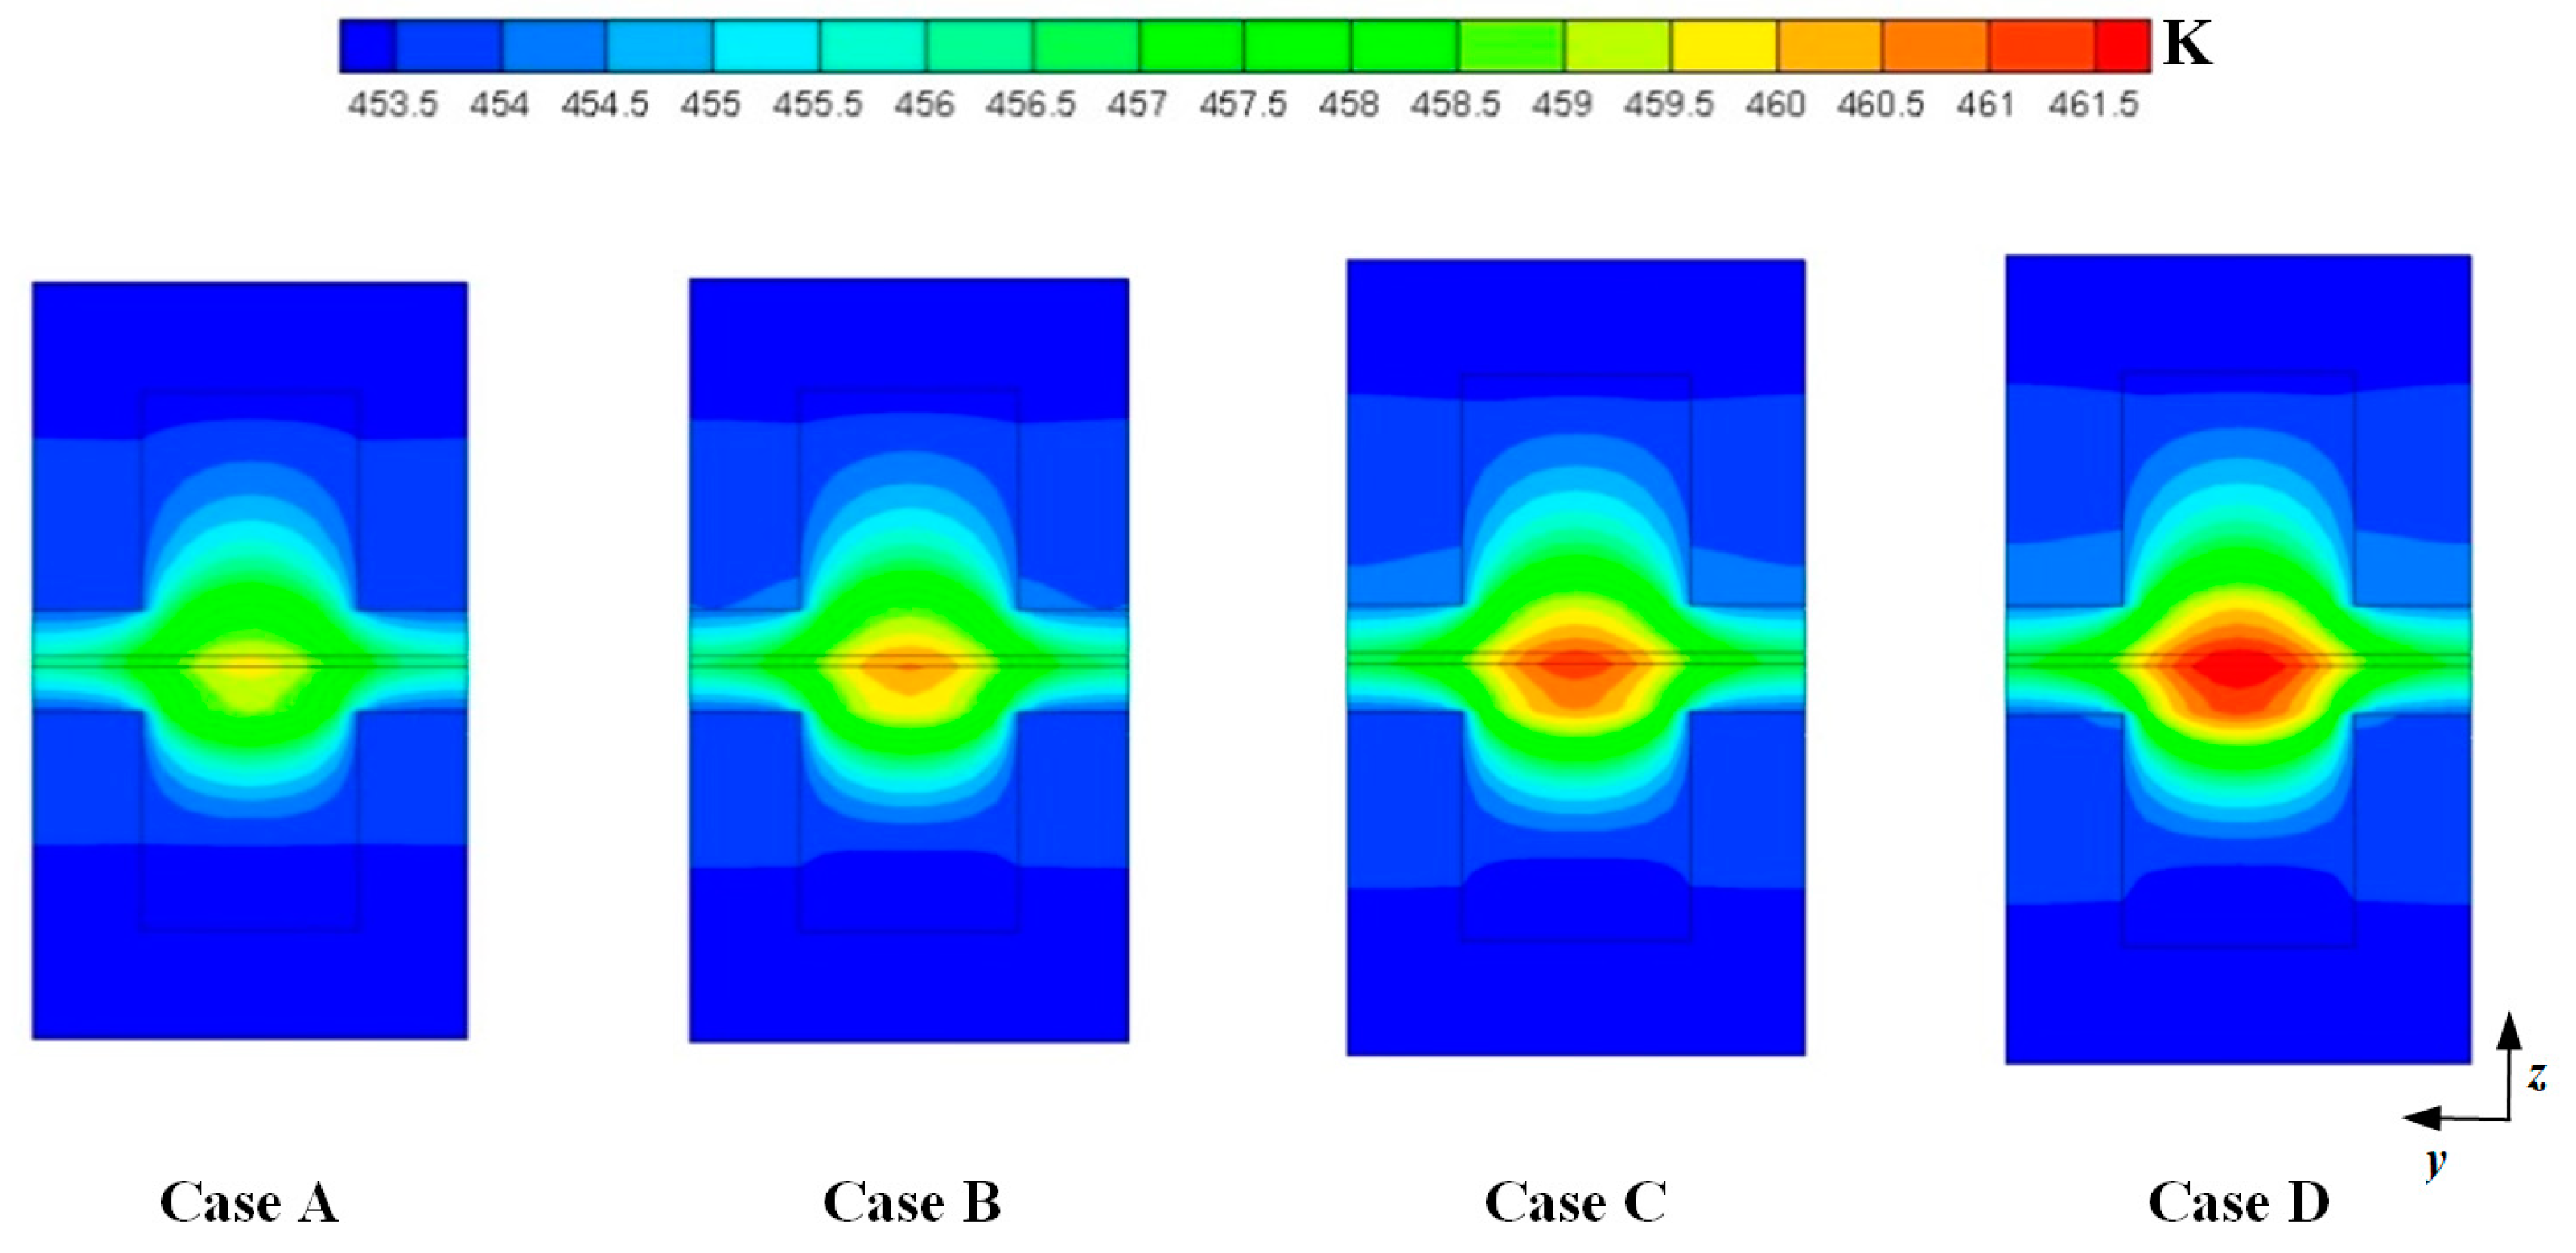
Figure 4 shows the temperature distributions at the middle plane of fuel cells at the cell voltage 0.3 V. For the four cases, the maximum temperature is observed at the cathode side and the temperature under the channel is higher than that under the ribs. This is because the produced heat is easily dissipated through the ribs. It can also be seen that the maximum temperature is gradually increased when DL is increased from 5 to 11. This is because more heat can be generated when the current density is increased. As above mentioned, the current density is increased when DL is increased from 5 to 11. The values of the maximum temperature of four cases are 459.731 K, 460.578 K, 461.351 K, and 462.019 K, respectively.

Figure 4.
Temperature distributions at the middle plane of fuel cells (Case A: DL = 5; Case B: DL = 7; Case C: DL = 9; Case D: DL = 11).
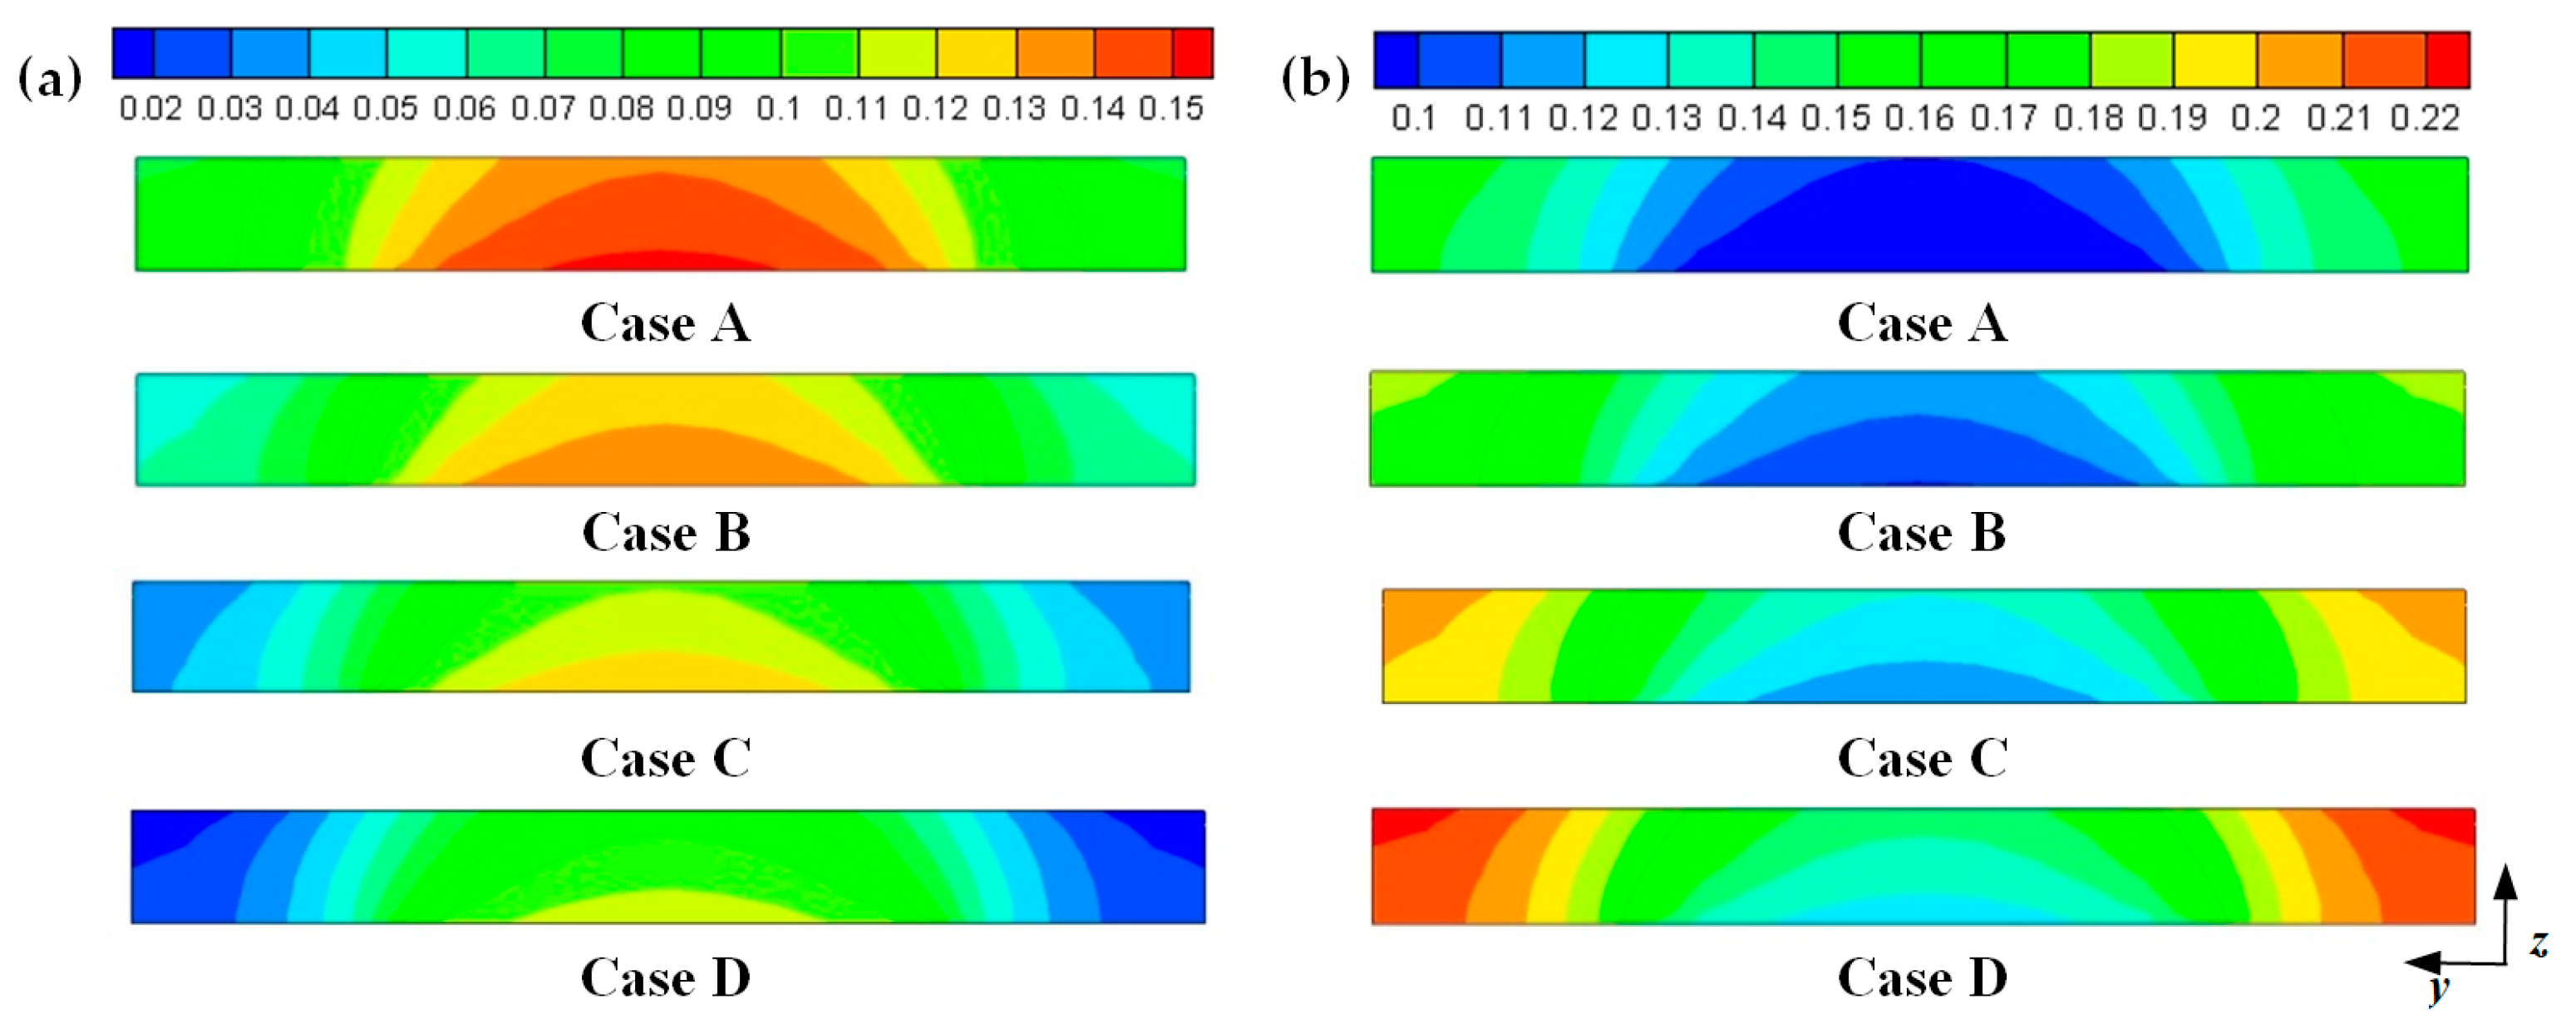
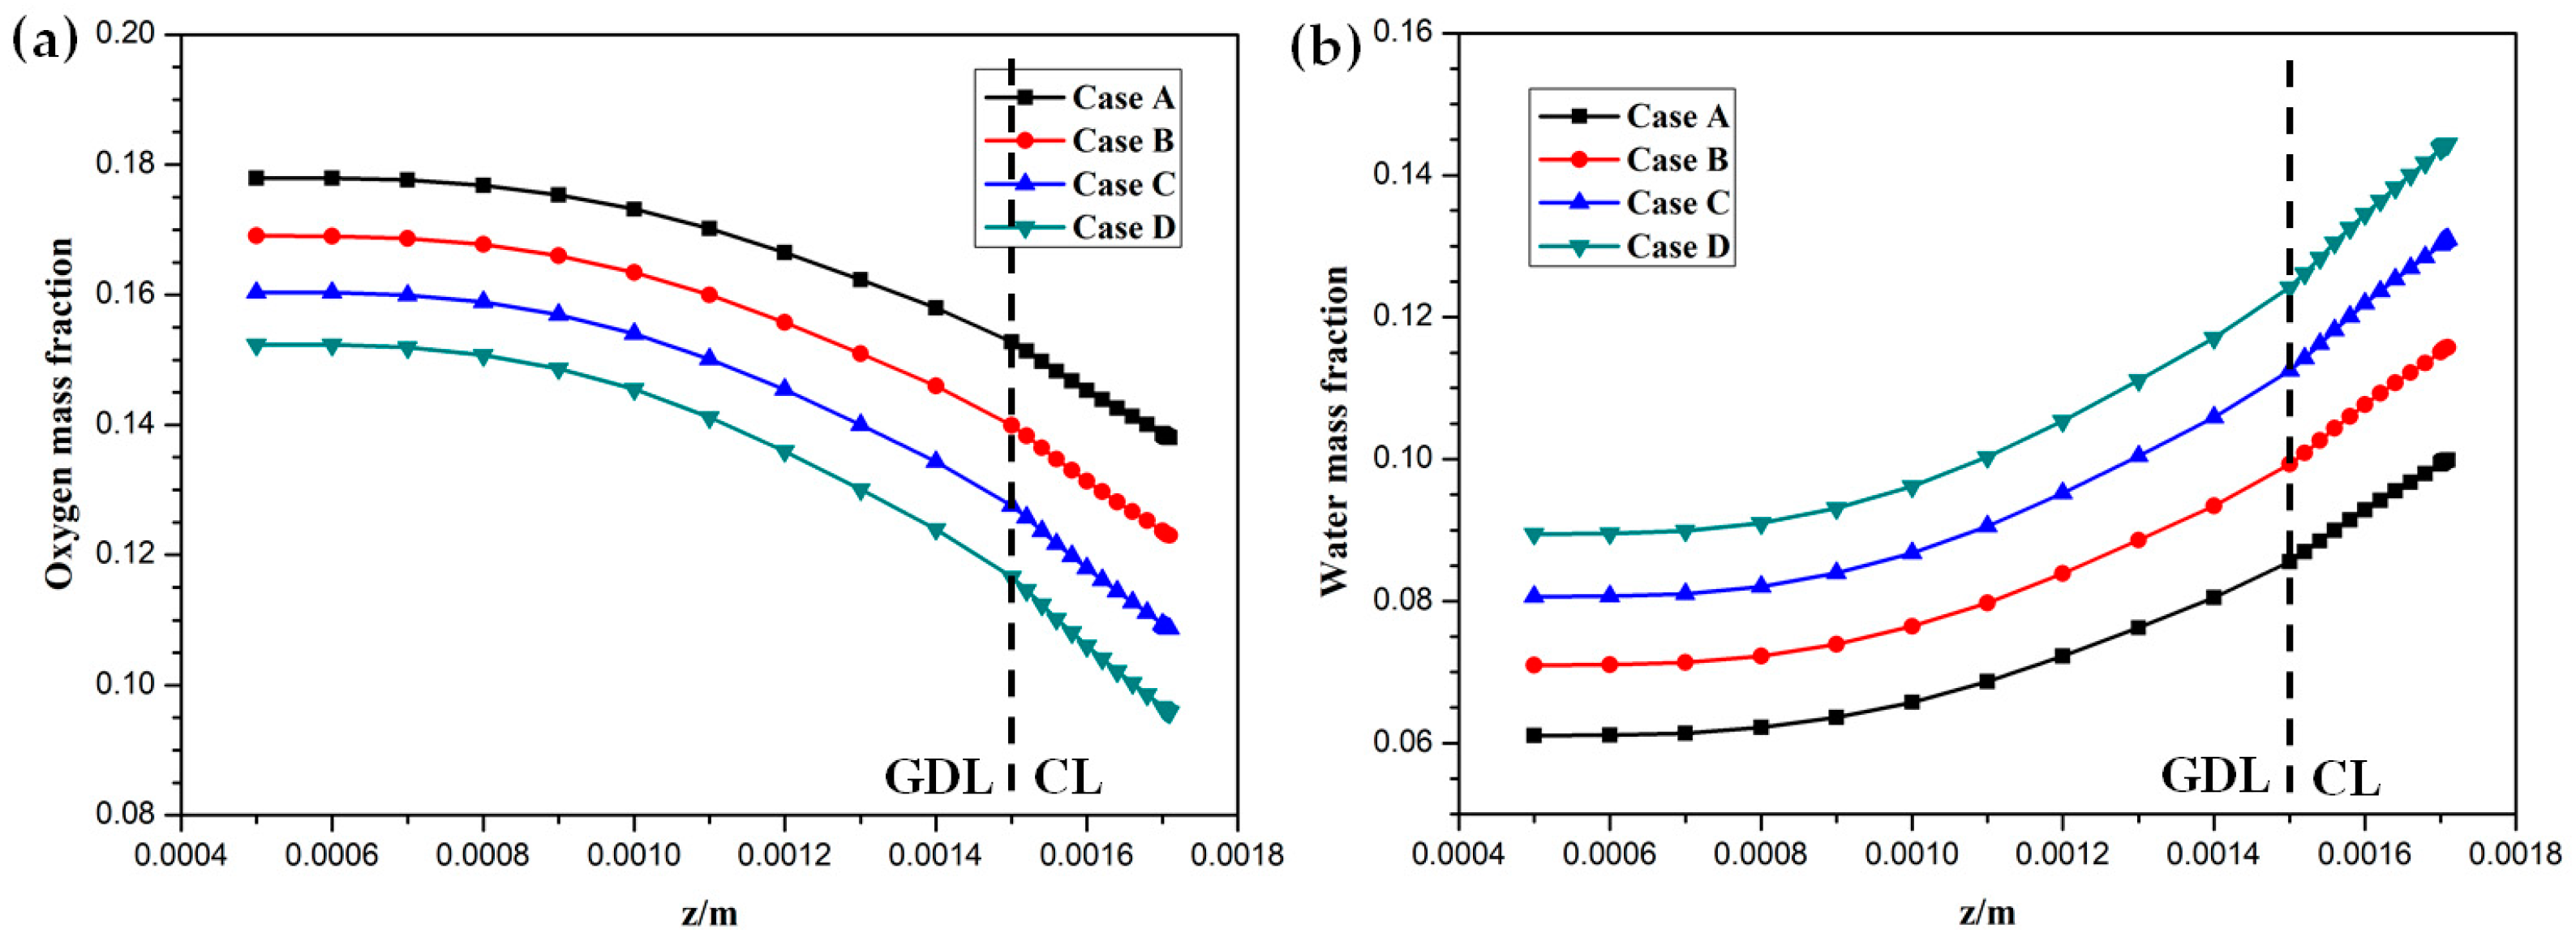
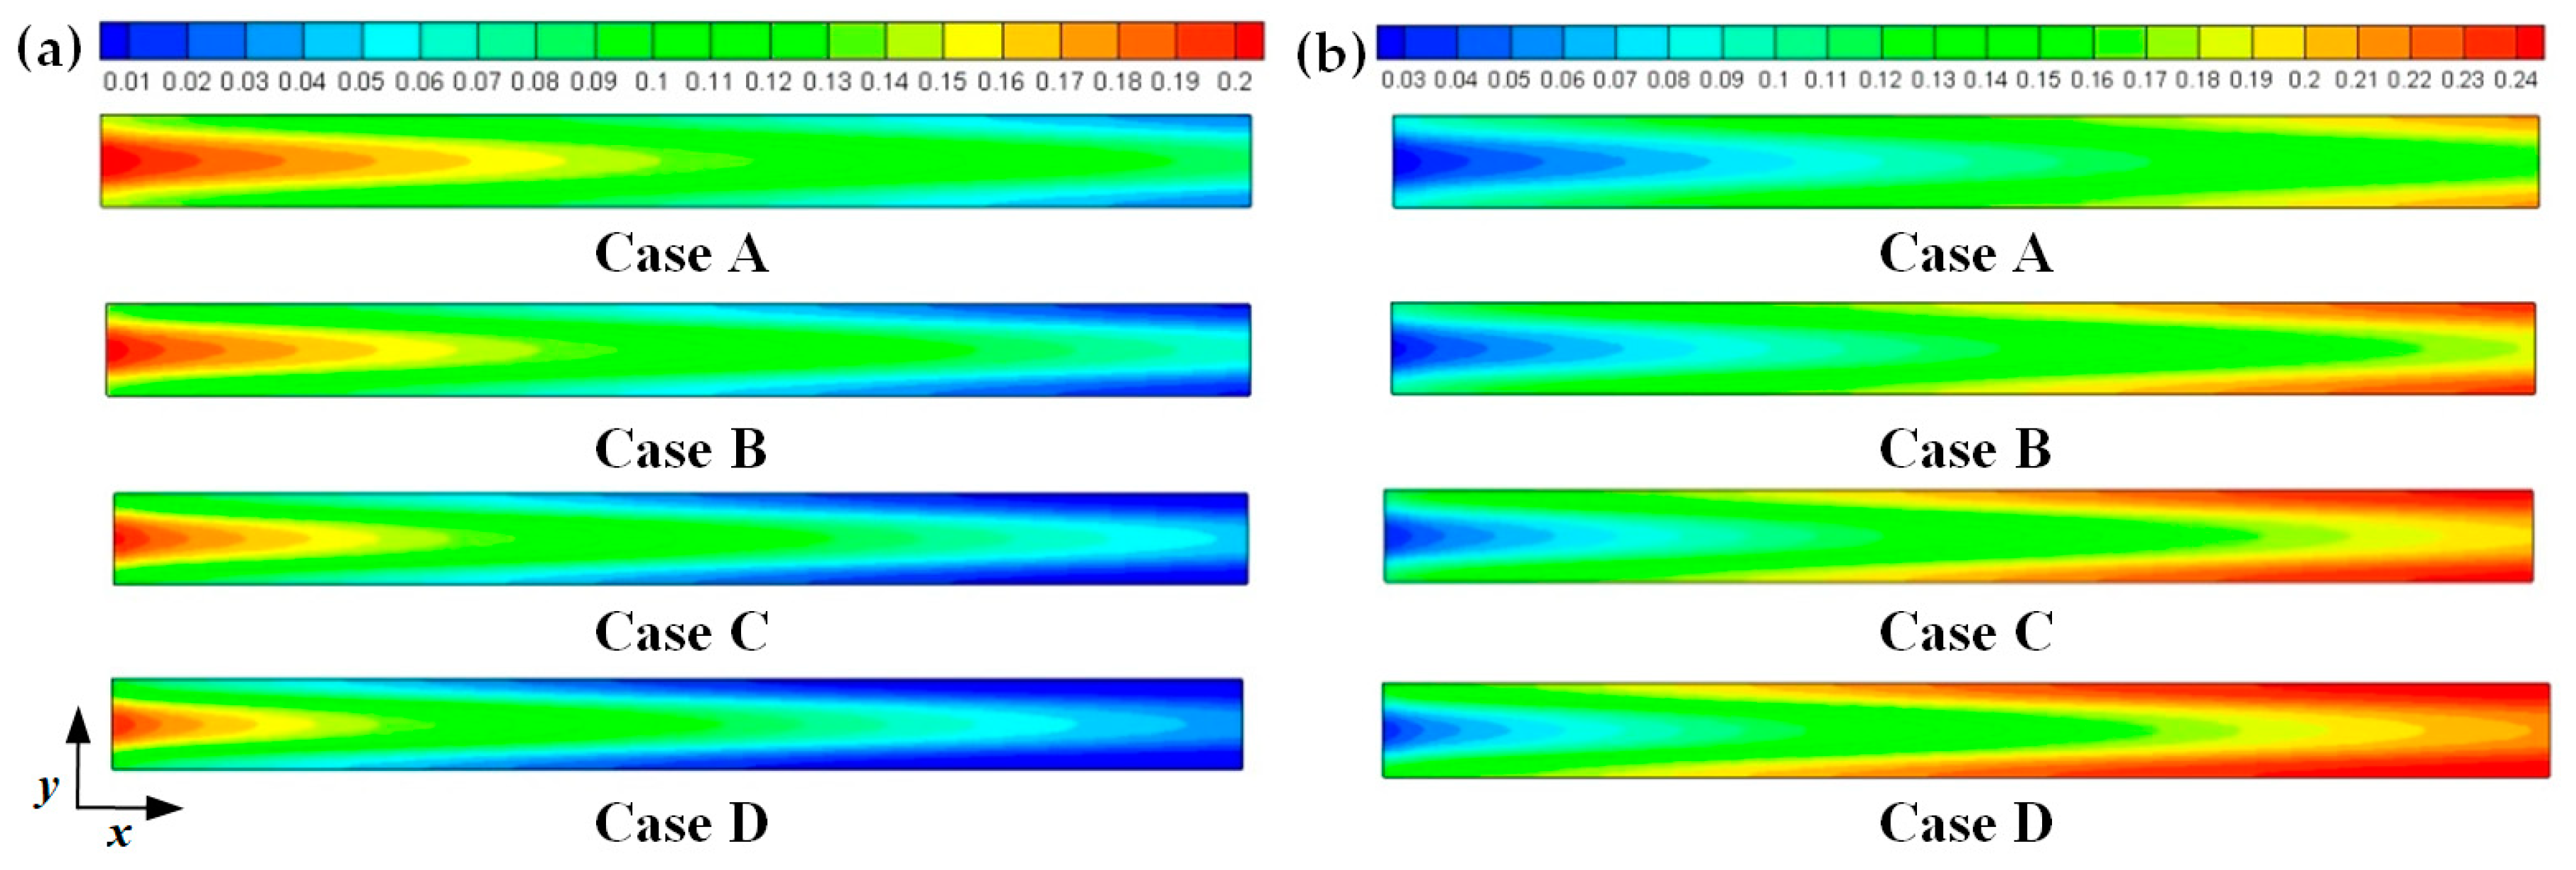
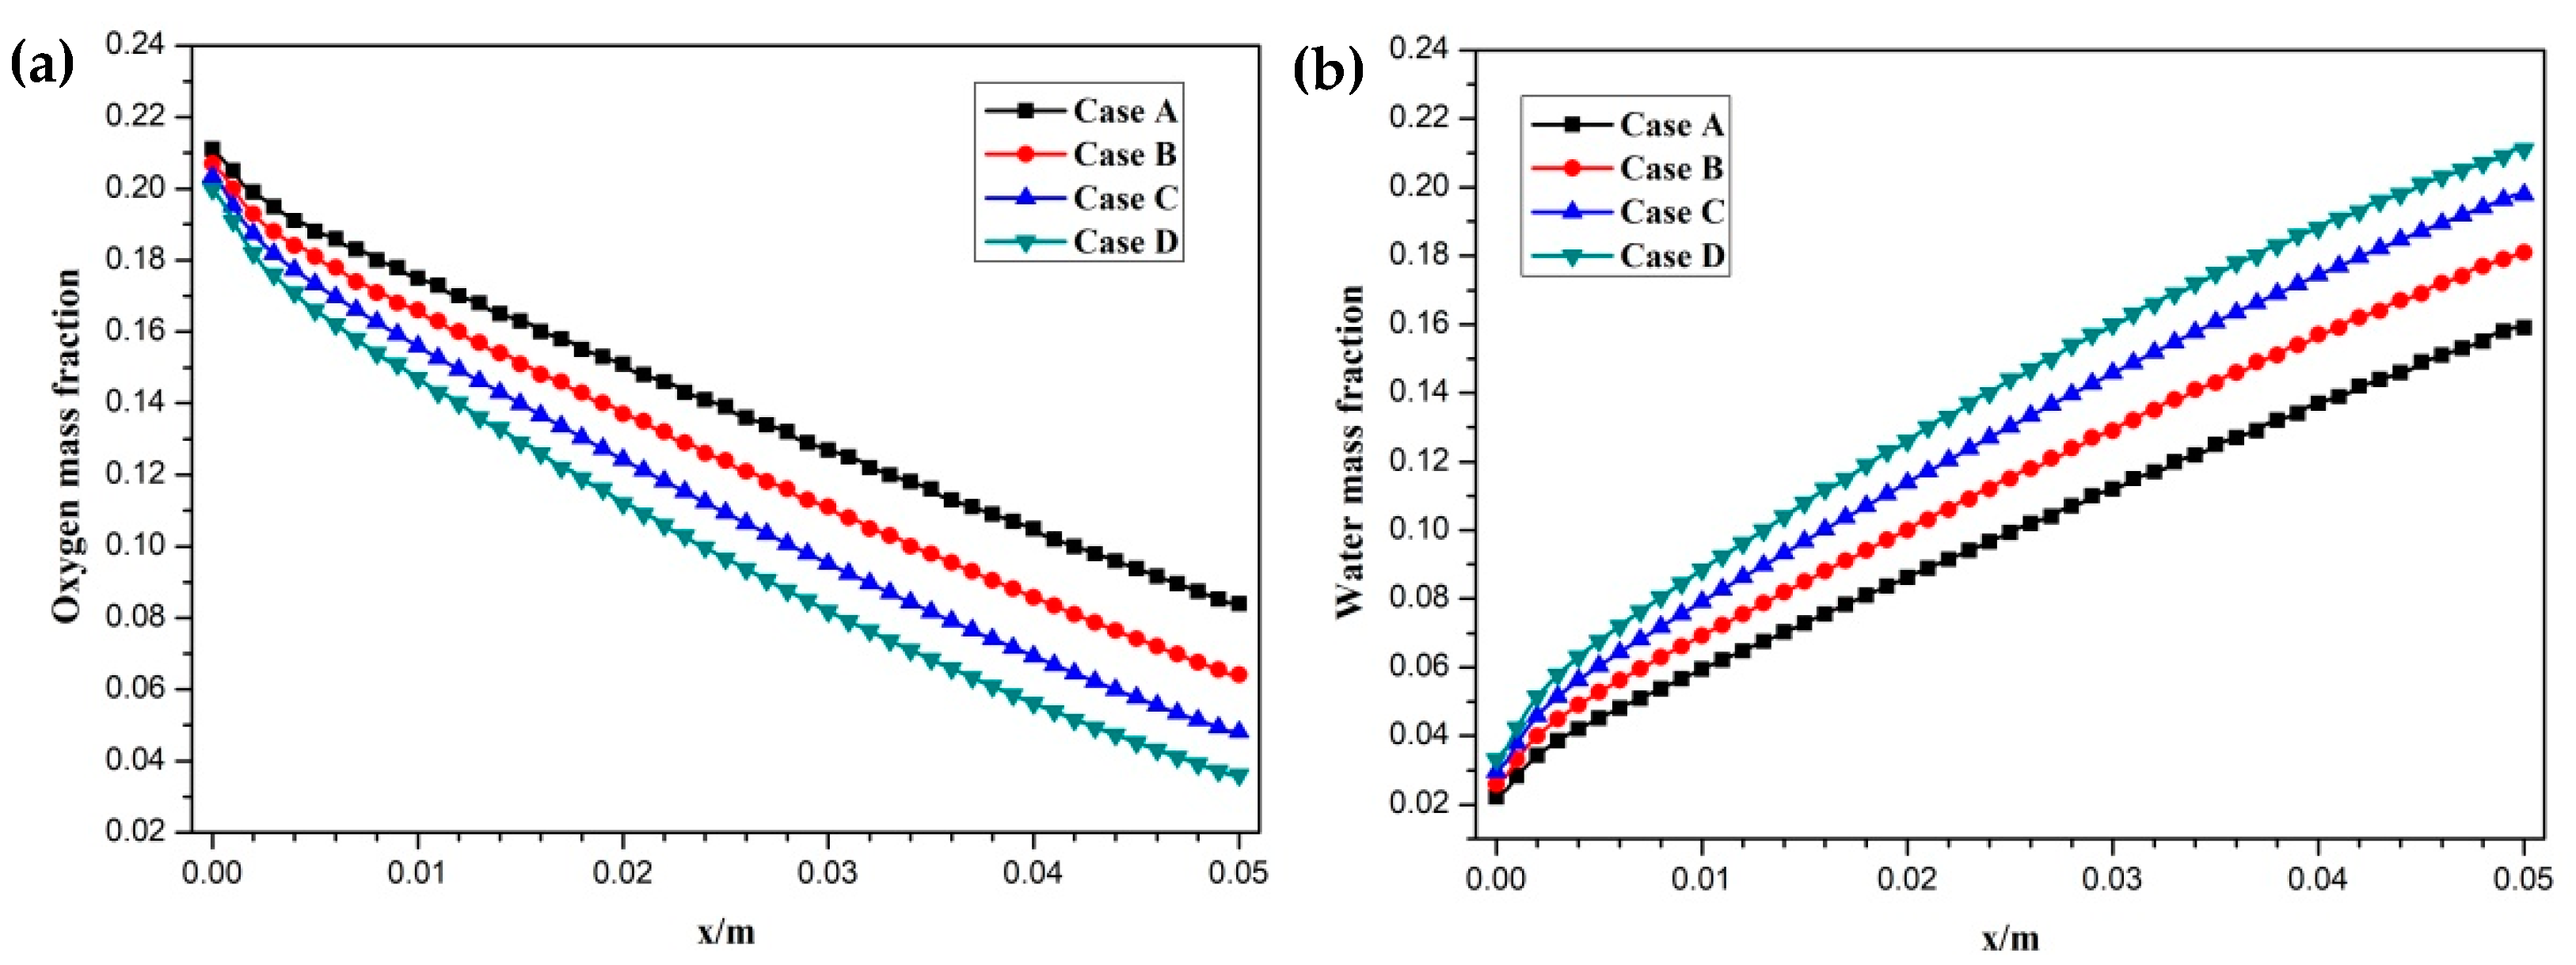
Hydrogen and oxygen are respectively transported from the anode and cathode GFCs and then consumed at the corresponding CLs. Meanwhile, water is produced at the cathode CL. The oxygen and water transport characteristics inside cathode CL and GDL of four cases at the cell voltage 0.3 V are shown in Figure 5 Figure 6 Figure 7 Figure 8. Figure 5 presents the oxygen and water mass fraction distributions at the middle plane of fuel cells. It is clearly seen that oxygen and water mass fraction is non-uniformly distributed due to the existence of ribs. The oxygen mass fraction under the channel region is greater than that under the rib regions, while the water mass fraction under the channel region is lower than that under the rib regions. This is because the species transport resistance is increased under the rib regions. The oxygen and water mass fraction profiles at the middle line of the above-mentioned planes are given in Figure 6. It is observed that the oxygen mass fraction gradually decreases, and the water mass fraction gradually increases from the GDL to the CL. This is attributed to the electrochemical reaction in the cathode CL. The oxygen mass fraction of four cases is decreased from 0.178 to 0.138, from 0.169 to 0.123, from 0.160 to 0.109, and from 0.152 to 0.096, respectively. And the corresponding water mass fraction is increased from 0.061 to 0.099, from 0.071 to 0.116, from 0.081 to 0.131, and from 0.089 to 0.144, respectively. Figure 7 shows the oxygen and water mass fraction distributions at the interface of GDL and CL. It can be seen that oxygen and water mass fraction is non-uniformly distributed along the flow direction due to the electrochemical reaction in the cathode CL. The oxygen and water mass fraction profiles at the middle line of the above-mentioned planes are plotted in Figure 8. It is observed that the oxygen mass fraction gradually decreases, and the water mass fraction gradually increases along the flow direction due to oxygen consumption and water production. The oxygen mass fraction of four cases is decreased from 0.211 to 0.084, from 0.207 to 0.064, from 0.203 to 0.048, and from 0.200 to 0.036, respectively. The corresponding water mass fraction is increased from 0.022 to 0.159, from 0.026 to 0.181, from 0.029 to 0.198, and from 0.033 to 0.211, respectively.
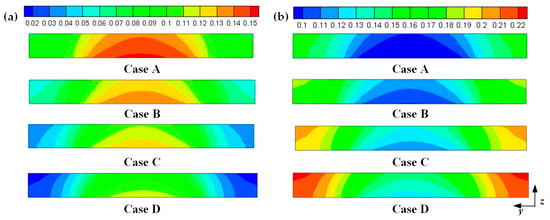
Figure 5.
Species mass fraction at the middle plane of fuel cells (Case A: DL = 5; Case B: DL = 7; Case C: DL = 9; Case D: DL = 11): (a) oxygen mass fraction: (b) water mass fraction.

Figure 6.
Species mass fraction profile distributions at y = 0.001 m (Case A: DL = 5; Case B: DL = 7; Case C: DL = 9; Case D: DL = 11): (a) oxygen mass fraction; (b) water mass fraction.
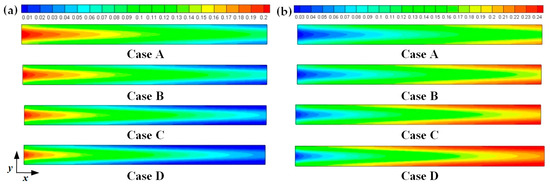
Figure 7.
Species mass fraction at the cathode GDL and CL interface of fuel cells (Case A: DL = 5; Case B: DL = 7; Case C: DL = 9; Case D: DL = 11): (a) oxygen mass fraction; (b) water mass fraction.
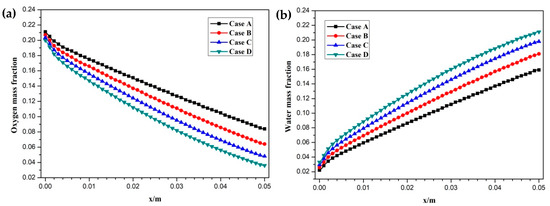
Figure 8.
Species mass fraction profile distributions at y = 0.001 m (Case A: DL = 5; Case B: DL = 7; Case C: DL = 9; Case D: DL = 11): (a) oxygen mass fraction; (b) water mass fraction.
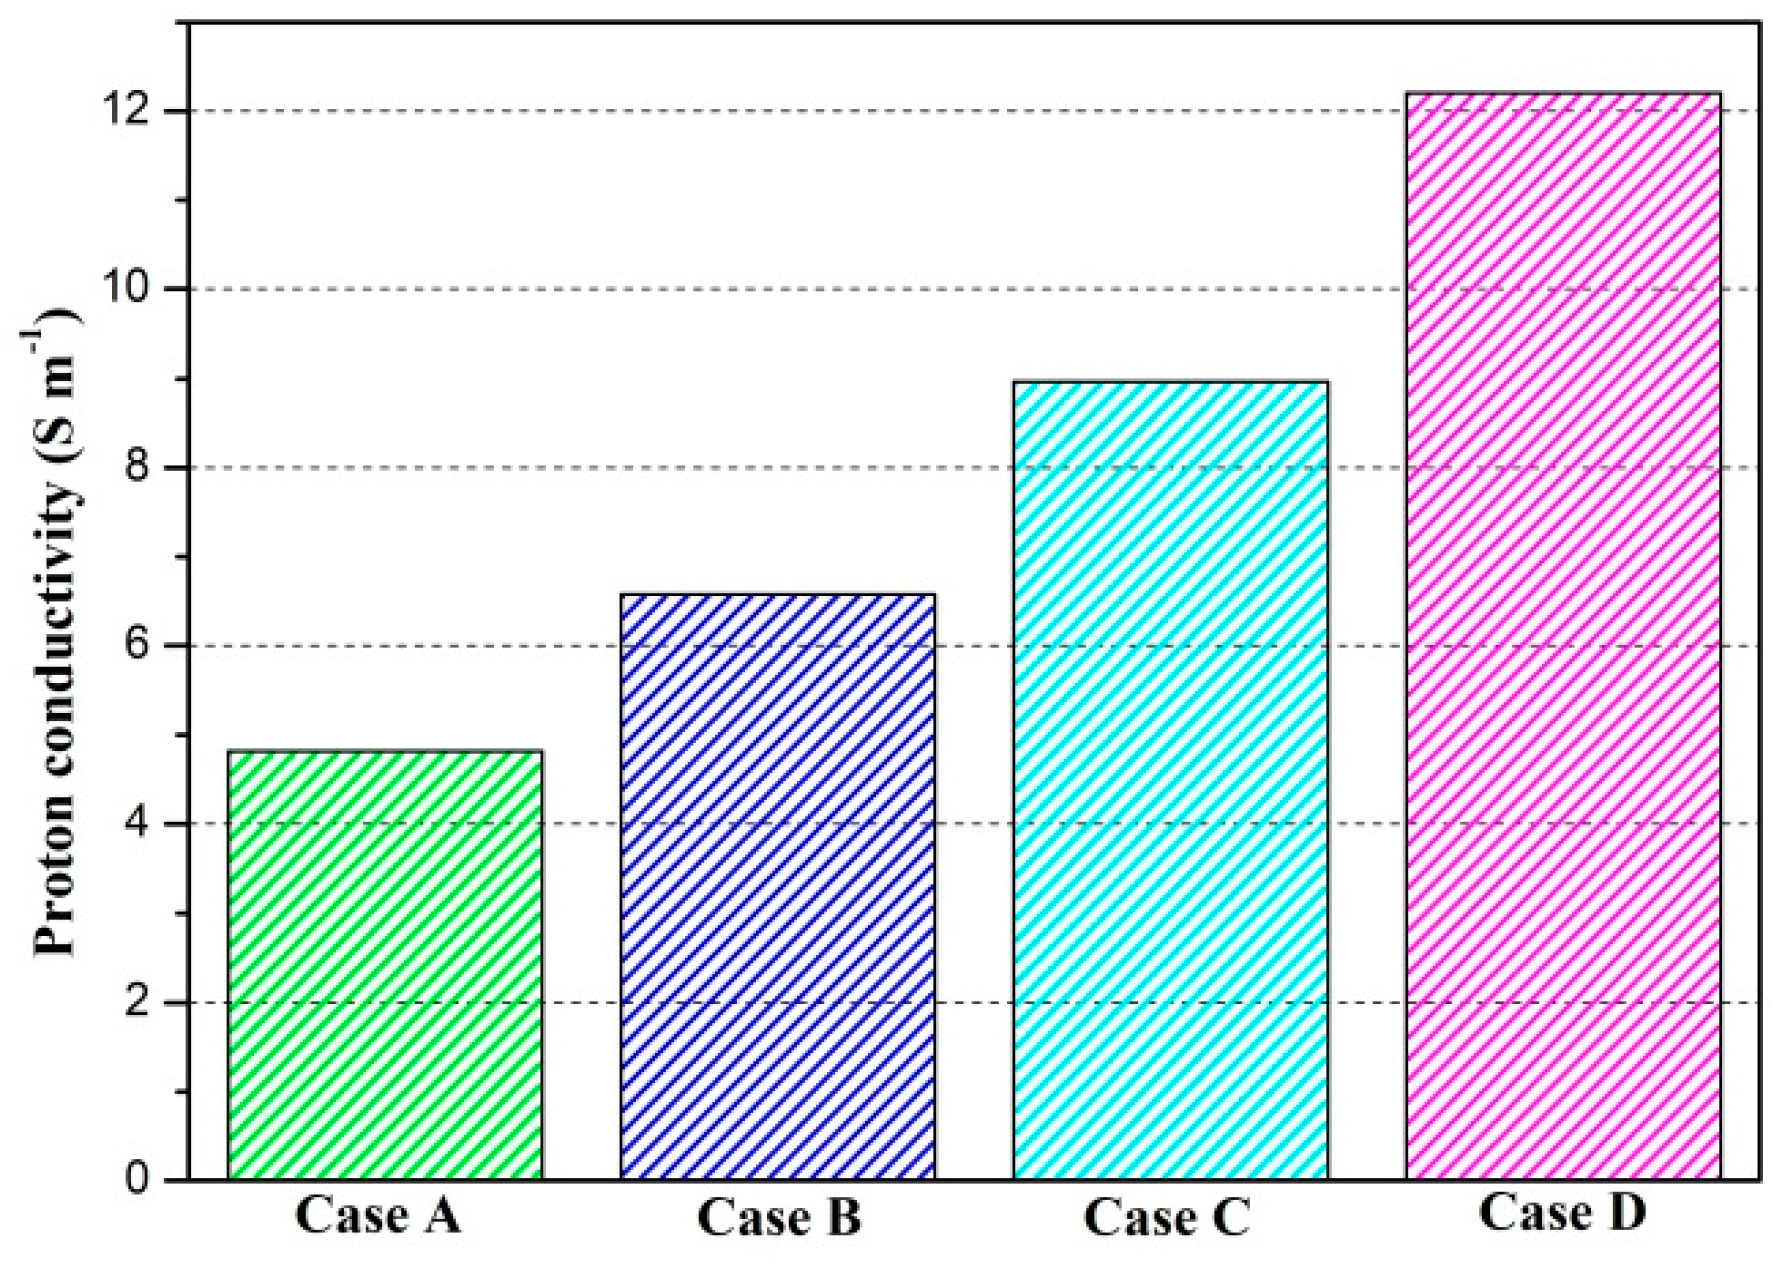
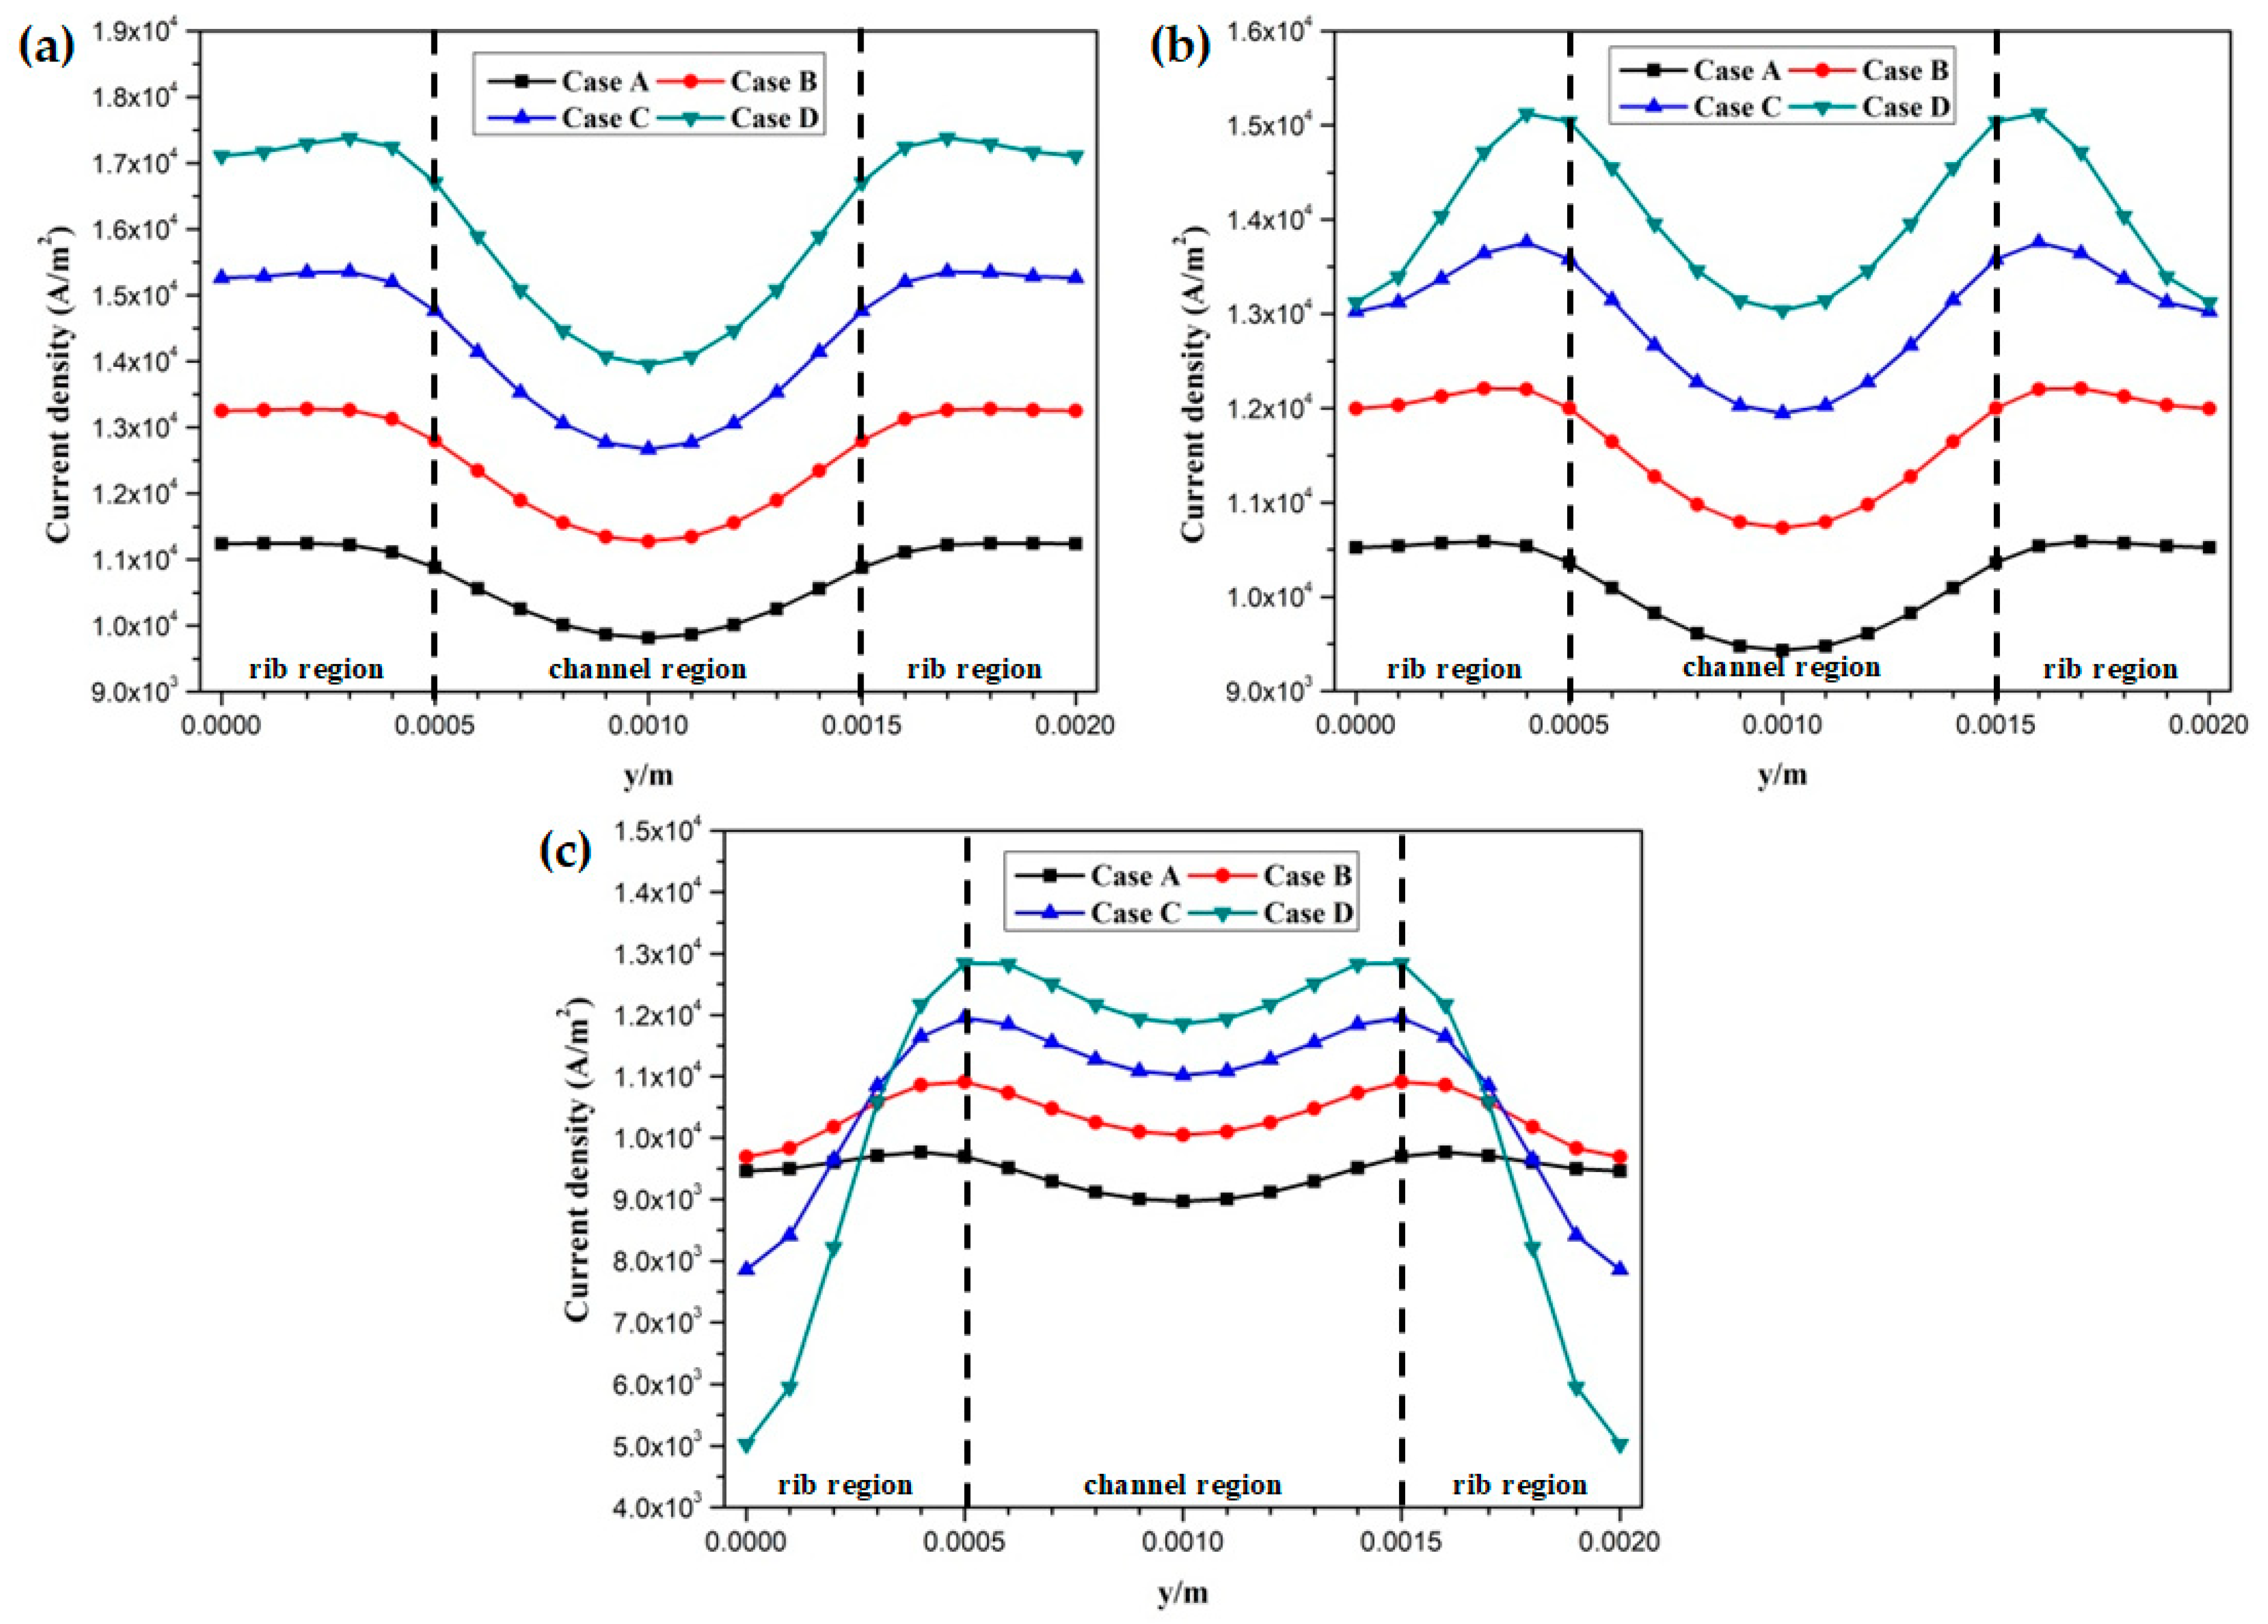
The proton conductivities of the membrane of four cases at the cell voltage 0.3 V are given in Figure 9. It can be observed that the proton conductivity is gradually increased from Case A to Case D, and the proton conductivities of four cases are 4.82 S/m, 6.58 S/m, 8.96 S/m, and 12.20 S/m, respectively. Local current densities of four cases at the cell voltage 0.3 V are demonstrated in Figure 10. It is clearly observed each local current density profile is symmetrically distributed, and it is also gradually decreased along the flow direction. This is because the oxygen is gradually consumed along the flow direction and the molar concentration is also decreased. As shown in Figure 10a, the minimum current density is observed at the middle of the GFC region. The maximum current density is obtained by Case D, followed by Case C, Case B, and Case A. The local current density at the middle of the plane is given in Figure 10b. It can be seen that the current density of Case D and Case C sharply decreases at the rib regions, while that of Case B and Case A only slightly decreases at the same regions. In Figure 10c, Case D provides the maximum and minimum local current densities of four cases. This means that the current density of Case D is extremely non-uniformly distributed in comparison with other cases.
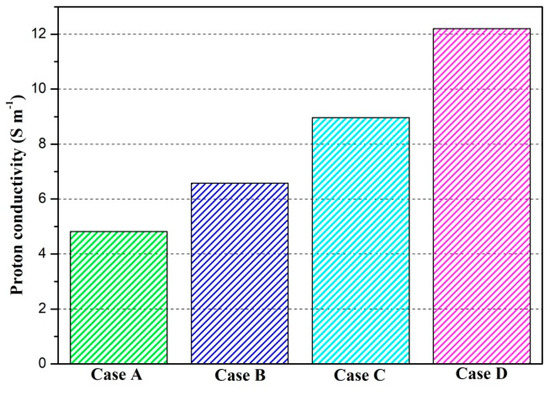
Figure 9.
Proton conductivity of the membrane of four cases (Case A: DL = 5; Case B: DL = 7; Case C: DL = 9; Case D: DL = 11).
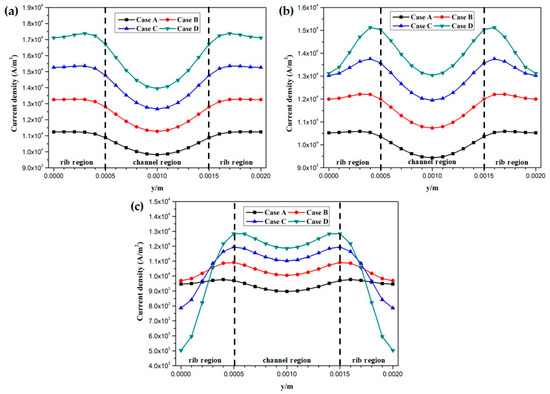
Figure 10.
Local current density distribution of fuel cells at the middle plane of membrane (Case A: DL = 5; Case B: DL = 7; Case C: DL = 9; Case D: DL = 11): (a) x = 0.005 m; (b) x = 0.025 m; (c) x = 0.045 m.
4. Conclusions
A three-dimensional mathematical model is established to investigate the performance and transport phenomena in HT-PEMFCs. The effect of membrane phosphoric acid doping level on polarization curves, distributions of temperature, species mass fraction, proton conductivity, and local current density are studied in detail. It is found that the current density at cell voltage 0.3 V is greatly improved from 1.011 A/cm2 to 1.372 A/cm2 when the doping level is increased from 5 to 11. The maximum temperature is observed at the cathode CL and increased with the increasing doping level. The distributions of oxygen and water mass fraction are also affected by the doping level. A higher water mass fraction and a lower oxygen mass fraction are observed with an increase in the doping level. The proton conductivity is also significantly increased with the increasing doping level. In addition, the trend and magnitude of local current density is strongly affected by the doping level.
Author Contributions
Conceptualization, S.L. and C.P.; methodology, S.L.; software, C.P.; formal analysis, C.W.; investigation, Y.C.; writing—original draft preparation, S.L.; writing—review and editing, G.Y. and Q.S.; supervision, Q.S.; project administration, S.L.; funding acquisition, S.L. All authors have read and agreed to the published version of the manuscript.
Funding
This research was funded by National Natural Science Foundation of China, grant number 52001045 and Fundamental Research Funds for the Central Universities of China, grant number 3132021210.
Institutional Review Board Statement
Not applicable.
Informed Consent Statement
Not applicable.
Data Availability Statement
Data are contained within this study.
Acknowledgments
This work was supported by the National Natural Science Foundation of China (No.52001045), China Postdoctoral Science Foundation (No.2019M651097), Natural Science Foundation of Liaoning Province (No.2019-BS-026 and No.2020-HYLH-38), Dalian City Innovative Support Program for High-Level Talents (No.2019RQ036), and the Fundamental Research Funds for the Central Universities of China (No.3132021210 and No.3132019327).
Conflicts of Interest
The authors declare no conflict of interest.
References
- Sazali, N.; Wan Salleh, W.N.; Jamaludin, A.S.; Mhd Razali, M.N. New perspectives on fuel cell technology: A brief review. Membranes 2020, 10, 99. [Google Scholar] [CrossRef]
- Dickinson, E.J.F.; Smith, G. Modelling the proton-conductive membrane in practical polymer electrolyte membrane fuel cell (PEMFC) simulation: A review. Membranes 2020, 10, 310. [Google Scholar] [CrossRef]
- Nguyen, T.V.; White, R.E. A water and heat management model for proton exchange membrane fuel cells. J. Electrochem. Soc. 1993, 140, 2178–2186. [Google Scholar] [CrossRef]
- Wang, Y.; Chen, K.S.; Mishler, J.; Cho, S.C.; Adroher, X.C. A review of polymer electrolyte membrane fuel cells: Technology, applications, and needs on fundamental research. Appl. Energy 2011, 88, 981–1007. [Google Scholar] [CrossRef] [Green Version]
- Tran, T.D.; Huang, S.; Vu, D.H.; Duy, V.N. Effects of gas channel design on water management and on the performance of polymer electrolyte membrane fuel cells: A review. Int. J. Electrochem. Sci. 2018, 13, 10480–10495. [Google Scholar] [CrossRef]
- Rasheed, R.K.A.; Liao, Q.; Zhang, C.Z.; Chan, S.H. A review on modeling of high temperature proton exchange membrane fuel cells. Int. J. Hydrogen Energy 2017, 42, 3142–3165. [Google Scholar] [CrossRef]
- Seng, L.K.; Masdar, M.S.; Shyuan, L.K. Ionic liquid in phosphoric acid-doped polybenzimidazole (PA-PBI) as electrolyte membranes for PEM fuel cells: A review. Membranes 2021, 11, 728. [Google Scholar] [CrossRef]
- Wilberforce, T.; Ijaodola, O.; Emmanuel, O.; Thompson, J.; Olabi, A.G.; Abdelkareem, M.A.; Sayed, E.T.; Elsaid, K.; Maghrabie, H.M. Optimization of fuel cell performance using computational fluid dynamics. Membranes 2021, 11, 146. [Google Scholar] [CrossRef]
- Xia, L.; Xu, Q.; He, Q.; Ni, M.; Seng, M. Numerical study of high temperature proton exchange membrane fuel cell (HT-PEMFC) with a focus on rib design. Int. J. Hydrogen Energy 2021, 46, 21098–21111. [Google Scholar] [CrossRef]
- Perng, S.W.; Wu, H.W.; Chen, Y.B.; Zeng, Y.K. Performance enhancement of a high temperature proton exchange membrane fuel cell by bottomed-baffles in bipolar-plate channels. Appl. Energy 2019, 255, 113815. [Google Scholar] [CrossRef]
- Li, S.; Sunden, B. Three-dimensional modeling and investigation of high temperature proton exchange membrane fuel cells with metal foams as flow distributor. Int. J. Hydrogen Energy 2017, 42, 27323–27333. [Google Scholar] [CrossRef]
- Li, S.; Yuan, J.; Xie, G.; Sunden, B. Numerical investigation of transport phenomena in high temperature proton exchange membrane fuel cells with different flow field designs. Numer. Heat Transf. A 2017, 72, 807–820. [Google Scholar] [CrossRef]
- Taccani, R.; Zuliani, N. Effect of flow field design on performances of high temperature PEM fuel cells: Experimental analysis. Int. J. Hydrogen Energy 2011, 36, 10282–10287. [Google Scholar] [CrossRef]
- Singdeo, D.; Dey, T.; Gaikwad, S.; Andreasen, S.J.; Ghosh, P.C. A new modified serpentine flow field for application in high temperature polymer electrolyte fuel cell. Appl. Energy 2017, 195, 13–22. [Google Scholar] [CrossRef] [Green Version]
- Mohanty, S.; Desai, A.N.; Singh, S.; Ramadesigan, V.; Shaneeth, M. Effects of the membrane thickness and ionomer volume fraction on the performance of PEMFC with U-shaped serpentine channel. Int. J. Hydrogen Energy 2021, 46, 20650–20663. [Google Scholar] [CrossRef]
- Nanadegani, F.S.; Lay, E.N.; Sunden, B. Computational analysis of the impact of a micro porous layer (MPL) on the characteristics of a high temperature PEMFC. Electrochim. Acta 2020, 333, 135552. [Google Scholar] [CrossRef]
- Das, S.K.; Gibson, H.A. Three dimensional multi-physics modeling and simulation for assessment of mass transport impact on the performance of a high temperature polymer electrolyte membrane fuel cell. J. Power Sources 2021, 499, 229844. [Google Scholar] [CrossRef]
- Elden, G.; Celik, M.; Genc, G.; Yapici, H. The effects of temperature on transport phenomena in phosphoricacid doped polybenzimidazole polymer membrane fuel cell. Energy 2016, 103, 772–783. [Google Scholar] [CrossRef]
- Xing, B.; Savadogo, O. The effect of acid doping on the conductivity of polybenzimidazole. New Mater. Electrochem. Syst. 1999, 2, 95–102. [Google Scholar]
- Li, Q.F.; Hjuler, H.A.; Bjerrum, N. Phosphoric acid doped polybenzimidazole membranes: Physiochemical characterization and fuel cell applications. J. Appl. Electrochem. 2001, 31, 773–779. [Google Scholar] [CrossRef]
- Wu, H.W.; Ho, T.Y.; Han, Y.J. Parametric optimization of wall-mounted cuboid rows installed in interdigitated flow channel of HT-PEM fuel cells. Energy 2021, 216, 119261. [Google Scholar] [CrossRef]
- Huang, T.; Wang, W.; Yuan, Y.; Huang, J.; Chen, X.; Zhang, J.; Kong, X.; Zhang, Y.; Wan, Z. Optimization of high-temperature proton exchange membrane fuel cell flow channel based on genetic algorithm. Energy Rep. 2021, 7, 1374–1384. [Google Scholar] [CrossRef]
- Sezgin, B.; Caglayan, D.G.; Devrim, Y.; Steenberg, T.; Eroglu, I. Modeling and sensitivity analysis of high temperature PEM fuel cells by using Comsol multiphysics. Int. J. Hydrogen Energy 2016, 41, 10001–10009. [Google Scholar] [CrossRef]
- Chippar, P.; Ju, H. Three-dimensional non-isothermal modeling of a phosphoric acid-doped polybenzimidazole (PBI) membrane fuel cell. Solid State Ion. 2012, 225, 30–39. [Google Scholar] [CrossRef]
- Zhang, J.; Zhang, C.; Hao, D.; Ni, M.; Huang, S.; Liu, D.; Zheng, Y. 3D non-isothermal dynamic simulation of high temperature proton exchange membrane fuel cell in the start-up process. Int. J. Hydrogen Energy 2021, 46, 2577–2593. [Google Scholar] [CrossRef]
- Diaz, L.A.; Abuin, G.C.; Corti, H.R. Acid-doped ABPBI membranes prepared by low-temperature casting: Proton conductivity and water uptake properties compared with other polybenzimidazole-based membranes. J. Electrochem. Soc. 2016, 163, F485–F491. [Google Scholar] [CrossRef]
- Cheddie, D.F.; Munroe, N.D.H. A two-phase model of an intermediate temperature PEM fuel cell. Int. J. Hydrogen Energy 2007, 32, 832–841. [Google Scholar] [CrossRef]

Publisher’s Note: MDPI stays neutral with regard to jurisdictional claims in published maps and institutional affiliations. |
© 2021 by the authors. Licensee MDPI, Basel, Switzerland. This article is an open access article distributed under the terms and conditions of the Creative Commons Attribution (CC BY) license (https://creativecommons.org/licenses/by/4.0/).