Application of a Solid Ceramic Membrane for Monitoring Volatile Organic Compounds in Industrial Wastewater

Abstract
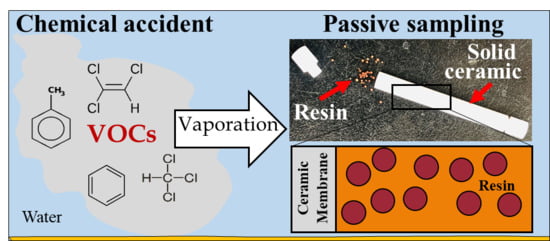
1. Introduction
2. Materials and Methods
2.1. Chemicals and Reagents
2.2. Preparation of the Solid Ceramic Dosimeter and Calibration
2.3. Instrumental Analysis
2.4. VOC Kinetics in the Solid Ceramic Dosimeter
2.5. Field Application
3. Results and Discussion
3.1. Validation of the Analytical Method
3.2. Calibration and Performance of the Solid Ceramic Dosimeter
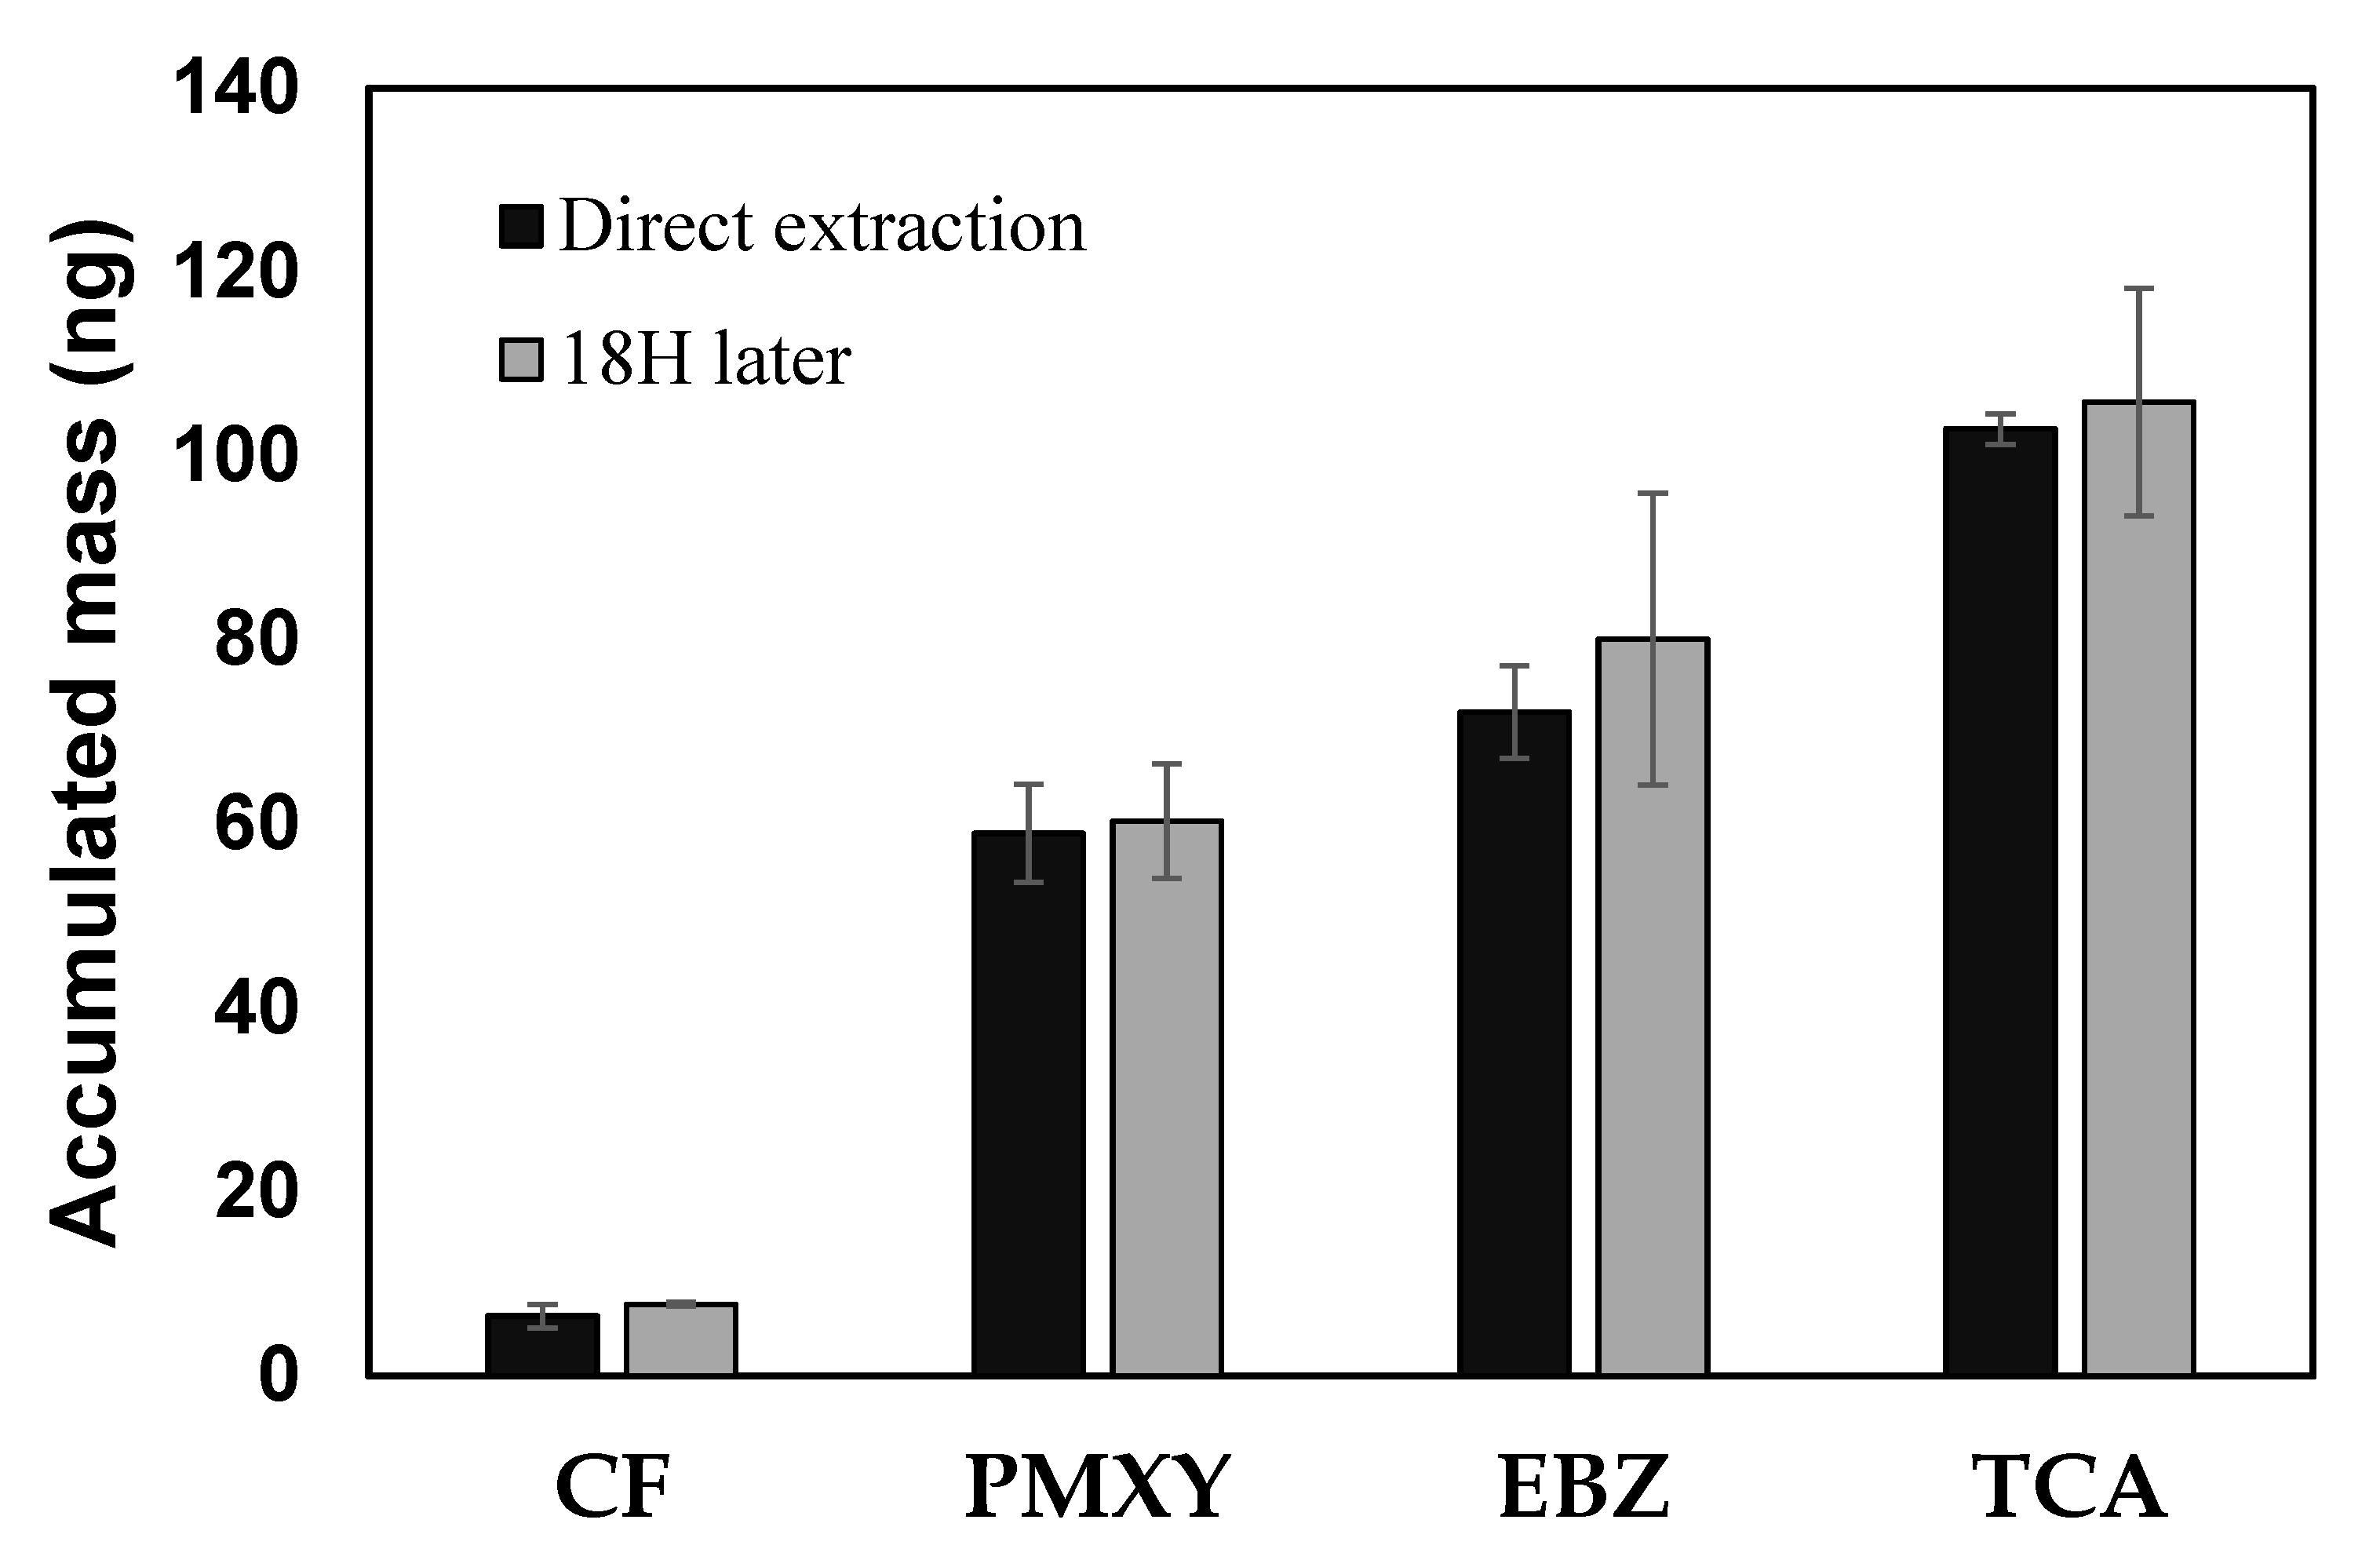
3.3. Stability of the SCD at Low Temperatures
3.4. Field Application to Industrial Wastewater
4. Conclusions
Supplementary Materials
Author Contributions
Funding
Acknowledgments
Conflicts of Interest
References
- Chung, S.T.; Kim, K.I. Case studies of chemical incidents and emergency information service in Korea. J. Loss. Prev. Process Ind. 2009, 22, 361–366. [Google Scholar] [CrossRef]
- Bloemen, H.J.; Burn, J. Chemistry and Analysis of Volatile Organic Compounds in the Environment, 1st ed.; Springer Science & Business Media: Dordrecht, The Netherland, 1993. [Google Scholar]
- Rathbun, R. Transport, behavior, and fate of volatile organic compounds in streams. Crit. Rev. Environ. Sci. Technol. 2000, 30, 129–295. [Google Scholar] [CrossRef]
- Jung, D.; Kim, J.-A.; Park, M.-S.; Yim, U.H.; Choi, K. Human health and ecological assessment programs for Hebei Spirit oil spill accident of 2007: Status, lessons, and future challenges. Chemosphere 2017, 173, 180–189. [Google Scholar] [CrossRef]
- Zabiegała, B.; Kot-Wasik, A.; Urbanowicz, M.; Namieśnik, J. Passive sampling as a tool for obtaining reliable analytical information in environmental quality monitoring. Anal. Bioanal. Chem. 2010, 396, 273–296. [Google Scholar] [CrossRef] [PubMed]
- Kot-Wasik, A.; Zabiegała, B.; Urbanowicz, M.; Dominiak, E.; Wasik, A.; Namieśnik, J. Advances in passive sampling in environmental studies. Anal. Chim. Acta 2007, 602, 141–163. [Google Scholar] [CrossRef] [PubMed]
- Bopp, S.K.; McLachlan, M.S.; Schirmer, K. Passive sampler for combined chemical and toxicological long-term monitoring of groundwater: The ceramic toximeter. Environ. Sci. Technol. 2007, 41, 6868–6876. [Google Scholar] [CrossRef] [PubMed]
- Bopp, S.; Weiß, H.; Schirmer, K. Time-integrated monitoring of polycyclic aromatic hydrocarbons (PAHs) in groundwater using the Ceramic Dosimeter passive sampling device. J. Chromatogr. A 2005, 1072, 137–147. [Google Scholar] [CrossRef] [PubMed]
- Cristale, J.; Katsoyiannis, A.; Jones, K.C.; Lacorte, S. Assessment of flame retardants in river water using a ceramic dosimeter passive sampler. Environ. Pollut. 2013, 172, 163–169. [Google Scholar] [CrossRef] [PubMed]
- Huckins, J.N.; Petty, J.D.; Booij, K. Introduction to Passive Sampling. In Monitors of Organic Chemicals in the Environment: Semipermeable Membrane Devices, 1st ed.; Springer Science & Business Media: New York, NY, USA, 2006. [Google Scholar]
- Bonifacio, R.G.; Nam, G.-U.; Eom, I.-Y.; Hong, Y.-S. Development of Solid Ceramic Dosimeters for the Time-Integrative Passive Sampling of Volatile Organic Compounds in Waters. Environ. Sci. Technol. 2017, 51, 12557–12565. [Google Scholar] [CrossRef] [PubMed]
- Seethapathy, S.; Gorecki, T.; Li, X. Passive sampling in environmental analysis. J. Chromatogr. A 2008, 1184, 234–253. [Google Scholar] [CrossRef] [PubMed]
- Weiß, H.; Schirmer, K.; Bopp, S.; Grathwohl, P. Use of ceramic dosimeters in water monitoring. Compr. Anal. Chem. 2007, 48, 279–293. [Google Scholar]
- Zogorski, J.S.; Carter, J.M.; Ivahnenko, T.; Lapham, W.W.; Moran, M.J.; Rowe, B.L.; Squillace, P.J.; Toccalino, P.L. The Quality of Our Nation’s Waters—Volatile Organic Compounds in the Nation’s Ground Water and Drinking-Water Supply Wells; U.S. Geological Survey Circular: Denver, CO, USA, 2006.
- OEHHA Home Page. Available online:https://oehha.ca.gov/proposition-65/proposition-65-list (accessed on 12 January 2020).
- IARC Monographs on the Identification of Carcinogenic Hazards to Humans Home Page. Available online: https://monographs.iarc.fr/list-of-classifications/ (accessed on 12 January 2020).
- Sander, R. Compilation of Henry’s law constants (version 4.0) for water as solvent. Atmos. Chem. Phys. 2015, 15, 4399–4981. [Google Scholar] [CrossRef]
- United States Environmental Protection Agency (USEPA). Method 5035A: Closed-System Purge-and-Trap and Extraction for Volatile Organics in Soil and Waste Samples. Draft Revision 1; United States Environmental Protection Agency: Washington, DC, USA, 2002.
- United States Environmental Protection Agency (USEPA). Definition and Procedure for the Determination of the Method Detection Limit, Revision 2; United States Environmental Protection Agency: Washington, DC, USA, 2016.
- European Commission. Guidance Document on Analytical Quality Control and Method Validation Procedures for Pesticide Residues and Analysis in Food and Feed, Revision 0; European Commission: Brussel, Belgium, 2017. [Google Scholar]


| Compound | Abbreviation | Predominant Use Group | CAS No. | Toxicity | Henry’s Law Constant (kH, at 283 K) |
|---|---|---|---|---|---|
| 1,1,1-Trichloroethane | TCA | Solvent | 71-55-6 | Carcinogen | 0.465 |
| Carbon tetrachloride | CTC | Solvent | 56-23-5 | Carcinogen | 0.822 |
| Tetrachloroethylene | PCE | Solvent | 127-18-4 | Carcinogen | 0.511 |
| Trichloroethene | TCE | Solvent | 79-01-6 | Carcinogen | 0.256 |
| Bromodichloromethane | BDCM | Trihalomethane (chlorination by-product) | 75-27-4 | Carcinogen | 0.074 |
| Chloroform | CF | Trihalomethane (chlorination by-product) | 67-66-3 | Carcinogen | 0.111 |
| Bromoform | BF | Trihalomethane (chlorination by-product) | 75-25-2 | Carcinogen | 0.017 |
| Dibromochloromethane | DBCM | Trihalomethane (chlorination by-product) | 124-48-1 | Carcinogen | 0.034 |
| Benzene | BNZ | Gasoline hydrocarbon | 71-43-2 | Carcinogen | 0.19 |
| Toluene | TOL | Gasoline hydrocarbon | 108-88-3 | Carcinogen | 0.186 |
| Ethylbenzene | EBZ | Gasoline hydrocarbon | 100-41-4 | Carcinogen | 0.218 |
| p-Xylene | PXY | Gasoline hydrocarbon | 106-42-3 | Toxic | 0.246 |
| m-Xylene | MXY | Gasoline hydrocarbon | 108-38-3 | Toxic | 0.226 |
| o-Xylene | OXY | Gasoline hydrocarbon | 95-47-6 | Toxic | 0.157 |
| Oven temperature | 65 °C | Loop fill mode | Standard |
| Manifold temperature | 260 °C | Loop fill time | 2.5 min |
| Transfer line temperature | 260 °C | Loop equilibrium time | 2.5 min |
| Vial equilibrium time | 25 min | Injection time | 2 min |
| Shaking | Low | Aux flow | 30 mL/min |
| Mode | Flow | Auxiliary gas | He |
| Aux pressure | 100 kPa | Vial press | 5 kPa |
| Aux flow | 30 mL/min | Communication pipe | Nope |
| Pressure equilibrium time | 1 min |
| Compound | RT (min) | Primary Ion (Da) | HS-GC-MS | ||||
|---|---|---|---|---|---|---|---|
| Spiking Level (ug/L) | MDL (ug/L) | LOQ (ug/L) | RSD (%) | Recovery (%) | |||
| CF | 12.9 | 83 | 0.5 | 0.23 | 0.72 | 20.02 | 71.69 |
| TCA | 13.36 | 97 | 0.5 | 0.22 | 0.71 | 14.46 | 98.48 |
| CTC | 13.71 | 117 | 1 | 0.21 | 0.68 | 6.7 | 102.03 |
| BNZ | 14.07 | 78 | 2 | 1.03 | 3.29 | 13.92 | 118.15 |
| TCE | 15.32 | 95 | 0.5 | 0.24 | 0.76 | 13.32 | 114.45 |
| BDCM | 16.42 | 83 | 2 | 0.91 | 2.88 | 15.96 | 90.33 |
| TOL | 17.83 | 92 | 0.5 | 0.13 | 0.4 | 11.43 | 70.86 |
| PCE | 18.98 | 164 | 2 | 0.53 | 1.67 | 6.9 | 121.29 |
| DBCM | 19.42 | 129 | 2 | 0.68 | 2.18 | 12.31 | 88.3 |
| EBZ | 20.87 | 91 | 0.5 | 0.18 | 0.58 | 6.06 | 95.85 |
| PXY and MXY | 21.12 | 91 | 1 | 0.27 | 0.86 | 8.35 | 102.42 |
| OXY | 21.94 | 91 | 1 | 0.2 | 0.64 | 5.57 | 115.53 |
| BF | 22.39 | 173 | 2 | 0.81 | 2.58 | 14.86 | 86.88 |
| VOCs | Dceramic (× 10−9 m2/s) | ||||||
|---|---|---|---|---|---|---|---|
| 2.53 μg/L | 8.21 μg/L | 43.11 μg/L | 82.08 μg/L | Avg. | SD | Bonifacio et al. [11] | |
| CF | 1.36 | 1.32 | 0.92 | 1.20 | 0.20 | ||
| TCA | 0.79 | 0.63 | 0.47 | 0.63 | 0.63 | 0.11 | 0.20 (±0.02) |
| CTC | 0.76 | 0.63 | 0.54 | 0.63 | 0.64 | 0.08 | |
| BNZ | 1.08 | 1.21 | 1.04 | 1.11 | 0.07 | 0.10 (±0.03) | |
| TCE | 0.8 | 1.12 | 0.56 | 1.17 | 0.91 | 0.25 | 0.09 (±0.02) |
| BDCM | 0.64 | 0.66 | 0.68 | 0.66 | 0.02 | ||
| TOL | 1.93 | 1.31 | 0.91 | 1.12 | 1.32 | 0.38 | 0.13 (±0.002) |
| PCE | 0.81 | 0.75 | 0.61 | 0.62 | 0.70 | 0.09 | 0.09 (±0.01) |
| DBCM | 1.73 | 1.36 | 1.22 | 1.44 | 0.22 | ||
| EBZ | 1.87 | 1.34 | 0.95 | 1.02 | 1.30 | 0.36 | 0.13 (±0.03) |
| PXY + MXY | 1.49 | 1.59 | 1.32 | 0.85 | 1.31 | 0.28 | 0.12 (±0.01) |
| OXY | 1.38 | 1.46 | 1.04 | 1.18 | 1.27 | 0.17 | |
| BF | 0.59 | 0.87 | 0.84 | 0.77 | 0.13 | ||
| Compound | Point A | Point B | Point C | Point D | Point E |
|---|---|---|---|---|---|
| CF | <LOQ | <LOQ | <LOQ | 2.00 | <LOQ |
| TCA | ND | ND | ND | ND | ND |
| CTC | ND | 3.03 | 1.40 | 9.22 | 9.57 |
| BNZ | <LOQ | <LOQ | <LOQ | <LOQ | <LOQ |
| TCE | ND | ND | ND | ND | ND |
| BDCM | <LOQ | <LOQ | ND | 4.55 | <LOQ |
| TOL | 3.03 | ND | <LOQ | 1.15 | ND |
| PCE | ND | ND | ND | ND | ND |
| DBCM | 14.84 | 8.25 | ND | 6.10 | ND |
| EBZ | 4.38 | 1.73 | 1.62 | 2.99 | 1.38 |
| PXY and MXY | 5.12 | 4.75 | 4.81 | 4.72 | 4.58 |
| OXY | 1.92 | 1.77 | 1.82 | ND | 1.78 |
| BF | 66.14 | 32.46 | ND | 8.18 | ND |
| Compound | Passive Sampling | Grab Sampling | p-Value | ||
|---|---|---|---|---|---|
| Avg. | SD | Avg. | SD | ||
| CF | 13.2902 | 3.1152 | 20.8662 | 7.4238 | 0.51 |
| TOL | 0.5004 | 0.0781 | 0.9165 | 0.7056 | 0.82 |
| EBZ | 0.4542 | 0.0776 | 0.9242 | 0.0698 | 0.96 |
© 2020 by the authors. Licensee MDPI, Basel, Switzerland. This article is an open access article distributed under the terms and conditions of the Creative Commons Attribution (CC BY) license (http://creativecommons.org/licenses/by/4.0/).
Share and Cite
Kim, I.; Yoon, J.; Kim, S.D. Application of a Solid Ceramic Membrane for Monitoring Volatile Organic Compounds in Industrial Wastewater. Membranes 2020, 10, 186. https://doi.org/10.3390/membranes10080186
Kim I, Yoon J, Kim SD. Application of a Solid Ceramic Membrane for Monitoring Volatile Organic Compounds in Industrial Wastewater. Membranes. 2020; 10(8):186. https://doi.org/10.3390/membranes10080186
Chicago/Turabian StyleKim, Injeong, Jinseul Yoon, and Sang Don Kim. 2020. "Application of a Solid Ceramic Membrane for Monitoring Volatile Organic Compounds in Industrial Wastewater" Membranes 10, no. 8: 186. https://doi.org/10.3390/membranes10080186
APA StyleKim, I., Yoon, J., & Kim, S. D. (2020). Application of a Solid Ceramic Membrane for Monitoring Volatile Organic Compounds in Industrial Wastewater. Membranes, 10(8), 186. https://doi.org/10.3390/membranes10080186