Article

Simulation Study on Direct Contact Membrane Distillation Modules for High-Concentration NaCl Solution

1
Key Laboratory of Power Station Energy Transfer Conversion and System (North China Electric Power University), Ministry of Education, Beijing 102206, China
2
School of Energy and Power Engineering, Lanzhou University of Technology, Lanzhou 730050, China
3
School of Environmental Science and Technology, Dalian University of Technology, Dalian 116024, China
*
Authors to whom correspondence should be addressed.
Membranes 2020, 10(8), 179; https://doi.org/10.3390/membranes10080179
Submission received: 5 July 2020 / Revised: 23 July 2020 / Accepted: 3 August 2020 / Published: 5 August 2020
(This article belongs to the Section Inorganic Membranes)

Abstract

:
Membrane distillation technology, as a new membrane-based water treatment technology that combines the membrane technology and evaporation process, has the advantages of using low-grade heat, working at atmospheric pressure with simple configuration, etc. In this study, heat and mass transfer were coupled at the membrane surfaces through the user-defined function program. The effects of feed temperature, feed velocity and permeate velocity on temperature polarization were mainly investigated for a high-concentration NaCl solution. The temperature polarization was increased with the increase of feed temperature and the decrease of feed and permeate velocity. The effects of temperature, inlet velocity and solution concentration on the evaporation efficiency of the membrane module for co- and counter-current operations were investigated in detail. The counter-current operation performed better than co-current operation in most cases, except for the condition where the NaCl concentration was relatively low or the module length was long enough. In addition, the optimal membrane thickness for both PVDF and PTFE was studied. The optimal membrane thickness was found in the range of 10 to 20 μm, which corresponded to the highest permeate flux for the selected materials, pore size distribution, and operation conditions. Membrane material with lower thermal conductivity and larger porosity was prone to get higher permeate flux and had larger optimal membrane thickness. Increasing feed velocity or feed temperature could decrease the optimal membrane thickness.

Graphical Abstract

1. Introduction

High-salt wastewater treatment attracts the attention of researchers and engineers in the field of wastewater treatment for production processes in chemical industries, seawater desalination, water recovery from desulfurization process in power plants, etc. In power plants, a large amount of desulfurization wastewater is produced in the process of flue gas desulfurization (FGD) and, in many countries, FGD wastewater is required to be recovered and reused due to environmental requirements and economic considerations. The process is usually composed of a pretreatment unit, after which wastewater contains mainly salt, and evaporation unit, where most of water is recovered accompanied even by a crystallization process. In the evaporation step, evaporation techniques such as mechanical vapor recompression (MVR) or membrane distillation (MD) are used for water recovery. MVR is popularly applied but consumes high power and leads to high cost. However, MD can make use of heat energy instead of power energy. In power plants, sufficient low-grade heat sources are available, which are not efficiently reused currently. From the point view of energy saving, one feasible method is to concentrate the solution close to saturation by MD, and then to further vaporize by MVR to separate completely water from salt. MD is a promising technology for desalting wastewater. It is a thermally driven separation process using a hydrophobic microporous membrane, different from the pressure-driven membrane process [1,2,3,4,5,6,7]. Heat and mass transfer through the membrane are both involved in the process [8]. The polarization effects due to concentration profile, or temperature profile, can lead to low vapor pressure difference, causing a performance reduction. Low-pressure operation condition and high rejection factors of non-volatile solutes, utilization of low-grade waste heat is the main advantage of the MD process [9]. Direct contact membrane distillation (DCMD) is a MD configuration where both feed and permeate solutions are in direct contact with the membrane. Vapor is condensed in the permeate side by direct contact with cooling water. DCMD is a simple configuration and has been widely studied [10].
DCMD performance is often characterized by permeate flux, temperature polarization, concentration polarization [11], and energy efficiency [12,13], etc. Temperature polarization and concentration polarization refer to the temperature or concentration difference between the bulk solution and the solution near the membrane interface, which results in a reduction of the driving force. Temperature polarization is caused by the existence of thermal gradient near the membrane surface. Concentration polarization is caused by the accumulation of solutes adjacent to the feed side of the membrane. It reduces the transmembrane vapor pressure difference [14]. There are several factors affecting the performance of DCMD, including the operation conditions, membrane characteristics, and flow patterns. Numerous studies have successfully investigated the heat and mass transfer mechanisms either by the using Nusselt and Sherwood numbers [8,15,16,17,18], or by computational fluid dynamics (CFD) simulation [19,20,21,22,23,24,25,26,27,28,29,30,31]. Unidimensional numbers based on specific parameters or physical assumptions offer a simplified method. It takes much less computational time, but cannot capture the local variation of polarization, permeate flux, and conductive heat loss along the membrane. CFD has the advantage of studying the full temperature, velocity, and concentration fields along the membrane. Some studies focused on the coupled simulation of momentum, heat and mass transfer [8,20], some were targeted at understanding the flow patterns on MD performance related to module orientation and design [19,24,28,30], and some investigated the influence of membrane properties, including membrane materials, thickness, porosity, and tortuosity [32,33,34,35,36]. It is generally accepted that an optimal membrane thickness exists due to the balance between mass transport and heat transfer [35] for membrane structures and the permeability can be improved by reducing tortuosity or by increasing porosity and pore size [32,33,34].
The CFD simulation of DCMD modules was employed to investigate the heat transfer and mass transfer of DCMD modules for concentrated NaCl solution. The evaporation process at the high-concentration state is more critical as it is close to the final step of MD process, and it was not well studied. In this work, the treatment of high salt solutions with MD was studied. The real conditions for treating desulfurization wastewater in power plants were used as boundary conditions to explore the influence of the temperatures of both permeate and feed solutions, as well as the flow rate of the feed solution. The salt concentration used in the current study was high, thus the concentration polarization could be negligible [37]. The effects of Tf, vf, vp and cf on evaporation efficiency (EE) for co- and counter-current operations were investigated in detail. The optimal membrane thickness for various membranes was analyzed in different operation conditions. The performance of membrane distillation in high-salt solution including evaporation efficiency and permeate flux were evaluated for different flow patterns, membrane materials and operation conditions, which could provide guidance for optimizing DCMD processes.

2. Theoretical Background

DCMD is the MD configuration in which both feed and permeate solutions are in direct contact with the hydrophobic porous membrane. The transmembrane temperature gradient serves as the driving force for mass transfer. As shown in Figure 1, heat was transferred from the feed solution to the heat boundary layer, and then the membrane surface, where water was vaporized. The heat loss from the feed solution was composed of the latent heat of vaporization, and the heat conduction of the membrane itself. The latter reduced the temperature difference between the two solutions. After, the vapor was diffused to the permeate side through the membrane. Vapor condensed at the interface. Conductive heat was transferred from the feed side to the permeate side of the membrane and then through the heat boundary layer.
The temperature polarization was schematically shown in Figure 1. Temperatures, Tfm, Tpm at the membrane–liquid interfaces were different from bulk solution temperature, Tf, Tp, caused by the resistance to the heat flux across the membrane boundary [26]. Furthermore, a concentration boundary layer was also formed near the membrane surface of the liquid layer, so that the membrane surface solute concentration was higher than the bulk solute concentration, i.e., the concentration polarization [18]. Temperature and concentration polarization reduced the mass transfer driving force, leading to a reduction in permeation flux, which needed to be considered in the simulation.
The heat transfer from feed solution to membrane surface of feed side was given by,
Q f = h f ( T f T fm ) .
The heat transfer across the membrane consists of two parts: the latent heat of vaporization and the heat conduction. The latter one was considered as energy loss. The evaporation efficiency (EE) was defined as the ratio of the efficient heat due to vaporization and the total heat transfer through the membrane and was calculated as,
E E = Q N Q N + Q c ,
where QN and Qc could be calculated as,
Q N = N Δ H
Q c = k m δ ( T fm T pm )
The heat transfer from the membrane surface of permeate side to permeate solution was given by,
Q p = h p ( T p T pm ) .
According to the conservation of energy,
Q f = Q N + Q c = Q p .
The latent heat of vaporization was obtained by [8],
Δ H = 0.001351 T fm 2 1.4461 T fm + 2986.5.
The thermal conductivity was obtained by [18],
k m = ε k g + ( 1 ε ) k s .
When Tf ranged from 45 to 60 °C, the mean free path in DCMD was from 0.107 to 0.11 μm. The pore size of membrane ranged from 0.2 to 1.0 μm. Kn number ranged from 0.107 to 0.55. The mass transport took places via the combination of Knudsen diffusion and Molecular diffusion [38], and the mass transfer model was given by,
N = ( ε λ ) P T D w - a δ R T m × ln ( D Kn ( P T P pm ) + ( ε λ ) P T D w - a D Kn ( P T P fm ) + ( ε λ ) P T D w - a )
D kn = 4 3 ε d m λ R T m 2 π m w
P fm = ( 1 x s ) P ( T f m ) γ w .
The activity coefficient of water under different concentration conditions could be obtained by the following empirical formula [39]:
γ w = 1 0.5 x s 10 x s 2 ,
where xs was the molar fraction of solute in the solution. Dw−a was evaluated by the empirical formula, given by [40],
P T D w - a = ( 1.895 × 10 5 ) T 2.072 .
The water vapor pressure Pfm, and Ppm were calculated through Tfm, Tpm by Antoine equation,
P ( T ) = exp ( 23.1964 3816.44 T 46.13 ) .
In the MD process, the temperature polarization was measured with the temperature polarization coefficient (TPC),
T P C = T fm T pm T f T p .
The concentration polarization was characterized using a concentration polarization coefficient (CPC), which was defined as the ratio of the membrane surface concentration to the feed inlet concentration,
C P C = c fm c f .

3. Methodology

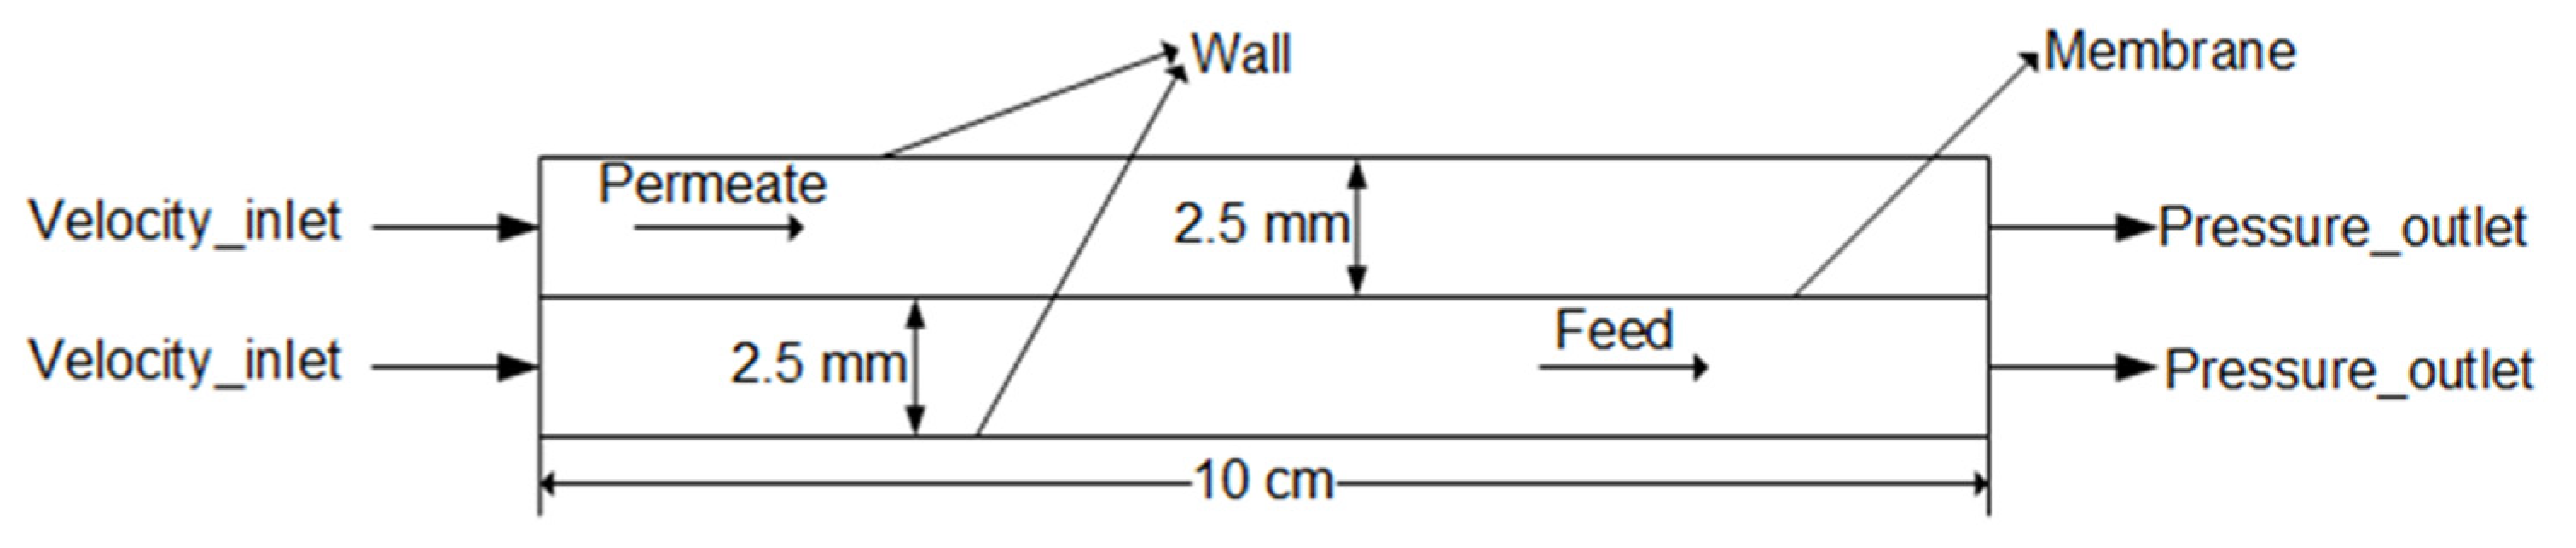
3.1. Geometry and Governing Equations

As shown in Figure 2, the geometry model was a rectangle flow channel which was 100 mm long, 2.5 mm high. The computational domain consisted of permeate and feed channels. Boundary conditions were set as shown in Figure 2. The inlet of permeate and feed channel were set to Velocity-Inlet. The outlet of permeate and feed channel were set to Pressure-Outlet. The membrane materials used in the simulation were shown in Table 1. The membrane module was placed horizontally. The NaCl solution was taken as feed solution, and pure water was used as the cooling substance. Tf was set from 45 to 75 °C according to the fact that the desulfurization wastewater temperature was about 50 °C [41]. The temperature difference of feed and permeate solution was from 20 to 50 °C. The flow rate was set from 0.05 to 0.25 m/s. In Section 4.3, in order to investigate the temperature field and EE of co- and counter-current operations obviously, the calculation domain of x direction was extended by three times.
In the current work, quadrilateral structured mesh was generated. In order to describe the fluid properties of the boundary layer near the membrane accurately, finer grids on both sides of the membrane were taken. The first layer of mesh on both sides of the film had a thickness of 10 μm and a growth factor of 1.05. Grids consisted of about 12,000. Grid independent analysis was undertaken to determine the grid sizes by examining the pressure drop of the modules via a hydrodynamic simulation.
The laminar model was chosen to describe the feed and permeate flows in the channels. The second-order upwind scheme was chosen to discrete the equations. The SIMPLE algorithm was used to solve the equations. The residuals of all the variables were set to 10−6.
The feed and permeate flow were governed by continuity equation, Navier-Stokes equations and energy equation,
  u = 0
ρ [ u t + ( u · ) u ] = p + · σ , σ = μ [ u + ( u ) T ]
ρ c p [ T t + ( u · ) T ] = · ( k T ) .
where σ was the viscous stress tensor, u, p,   ρ were the velocity vector, pressure, density, respectively, μ was dynamic viscosity, cp was the fluid heat capacity.
Mass transport was modeled using advection-diffusion equation,
c t + ( u · ) c = · ( D c )
where D was the effective mass diffusivity.
Effective mass diffusivity D was obtained by [22],
D ( T ) = 17.872 × 10 14 × ϑ N a ϑ C l ϑ N a + ϑ C l T
ϑ N a = 50.11 ( 1 + 0.02 ( T 298.15 ) ,   ϑ C l = 76.35 ( 1 + 0.02 ( T 298.15 ) ,  
where ϑNa was the equivalent limiting ionic conductance of the sodium and ϑCl was the equivalent limiting ionic conductance of the chloride.
In order to simulate the transmembrane mass transfer process, it was necessary to load the mass source of water on the first layer grid near the permeate side and the feed side of the membrane. Besides, the transmembrane heat transfer process was achieved by loading the heat transfer source.
S w = N b ,
where b was the height of the first grid. For the membrane distillation process, the mass source term on the liquid side was not only related to the feed side grid temperature, but also affected by the corresponding permeate side grid temperature, and it was achieved by the user-defined function (UDF).
The function of the UDF program was divided into three steps. First, the temperatures of cell center on both sides of the membrane wall was obtained by the UDF program, which were Tfm, Tpm, respectively. Then, the heat and mass transfer sources were calculated by UDF program through Equations (9)–(14). Finally, the UDF program was used to add the heat flux to membrane wall as boundary condition and mass transfer source as source terms.

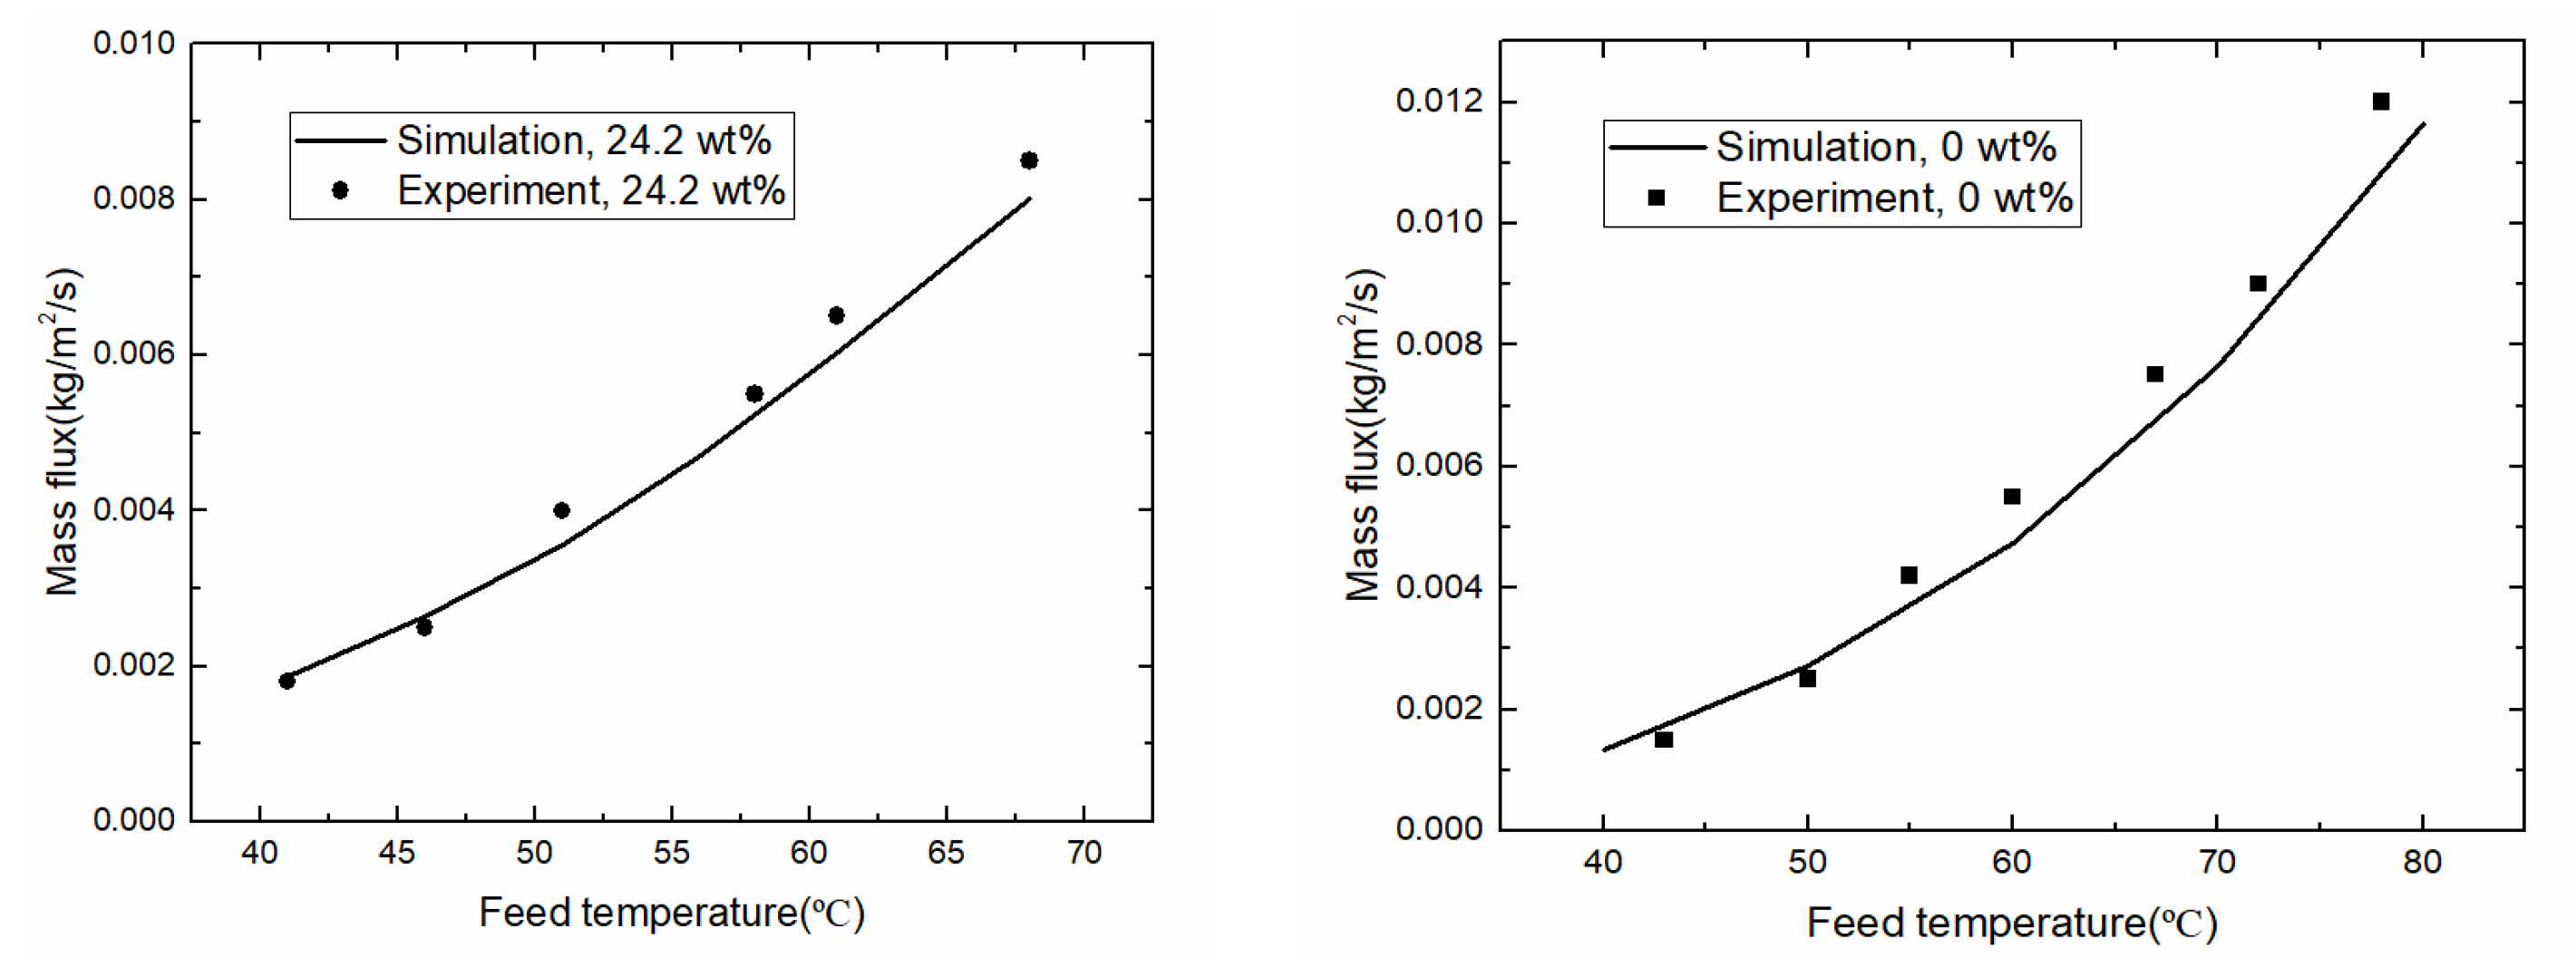
3.2. Model Validation

The experimental data in the literature [18] were used to verify the model. In Figure 3, permeate fluxes were shown in different feed temperature for pure water and 24.2 wt.% NaCl solution, respectively. The simulation results agreed to the experiment data, which showed the results based on the current simulation model were reliable and the developed simulation methods were suitable for the following analysis.

4. Results and Discussion

In the current work, the influence of Tf, vf, vp on the temperature polarization in high-salt solution were simulated and analyzed. The effects of Tf, vf, vp and solution salinity on EE were studied. The optimal membrane thickness was discovered in different operation conditions.

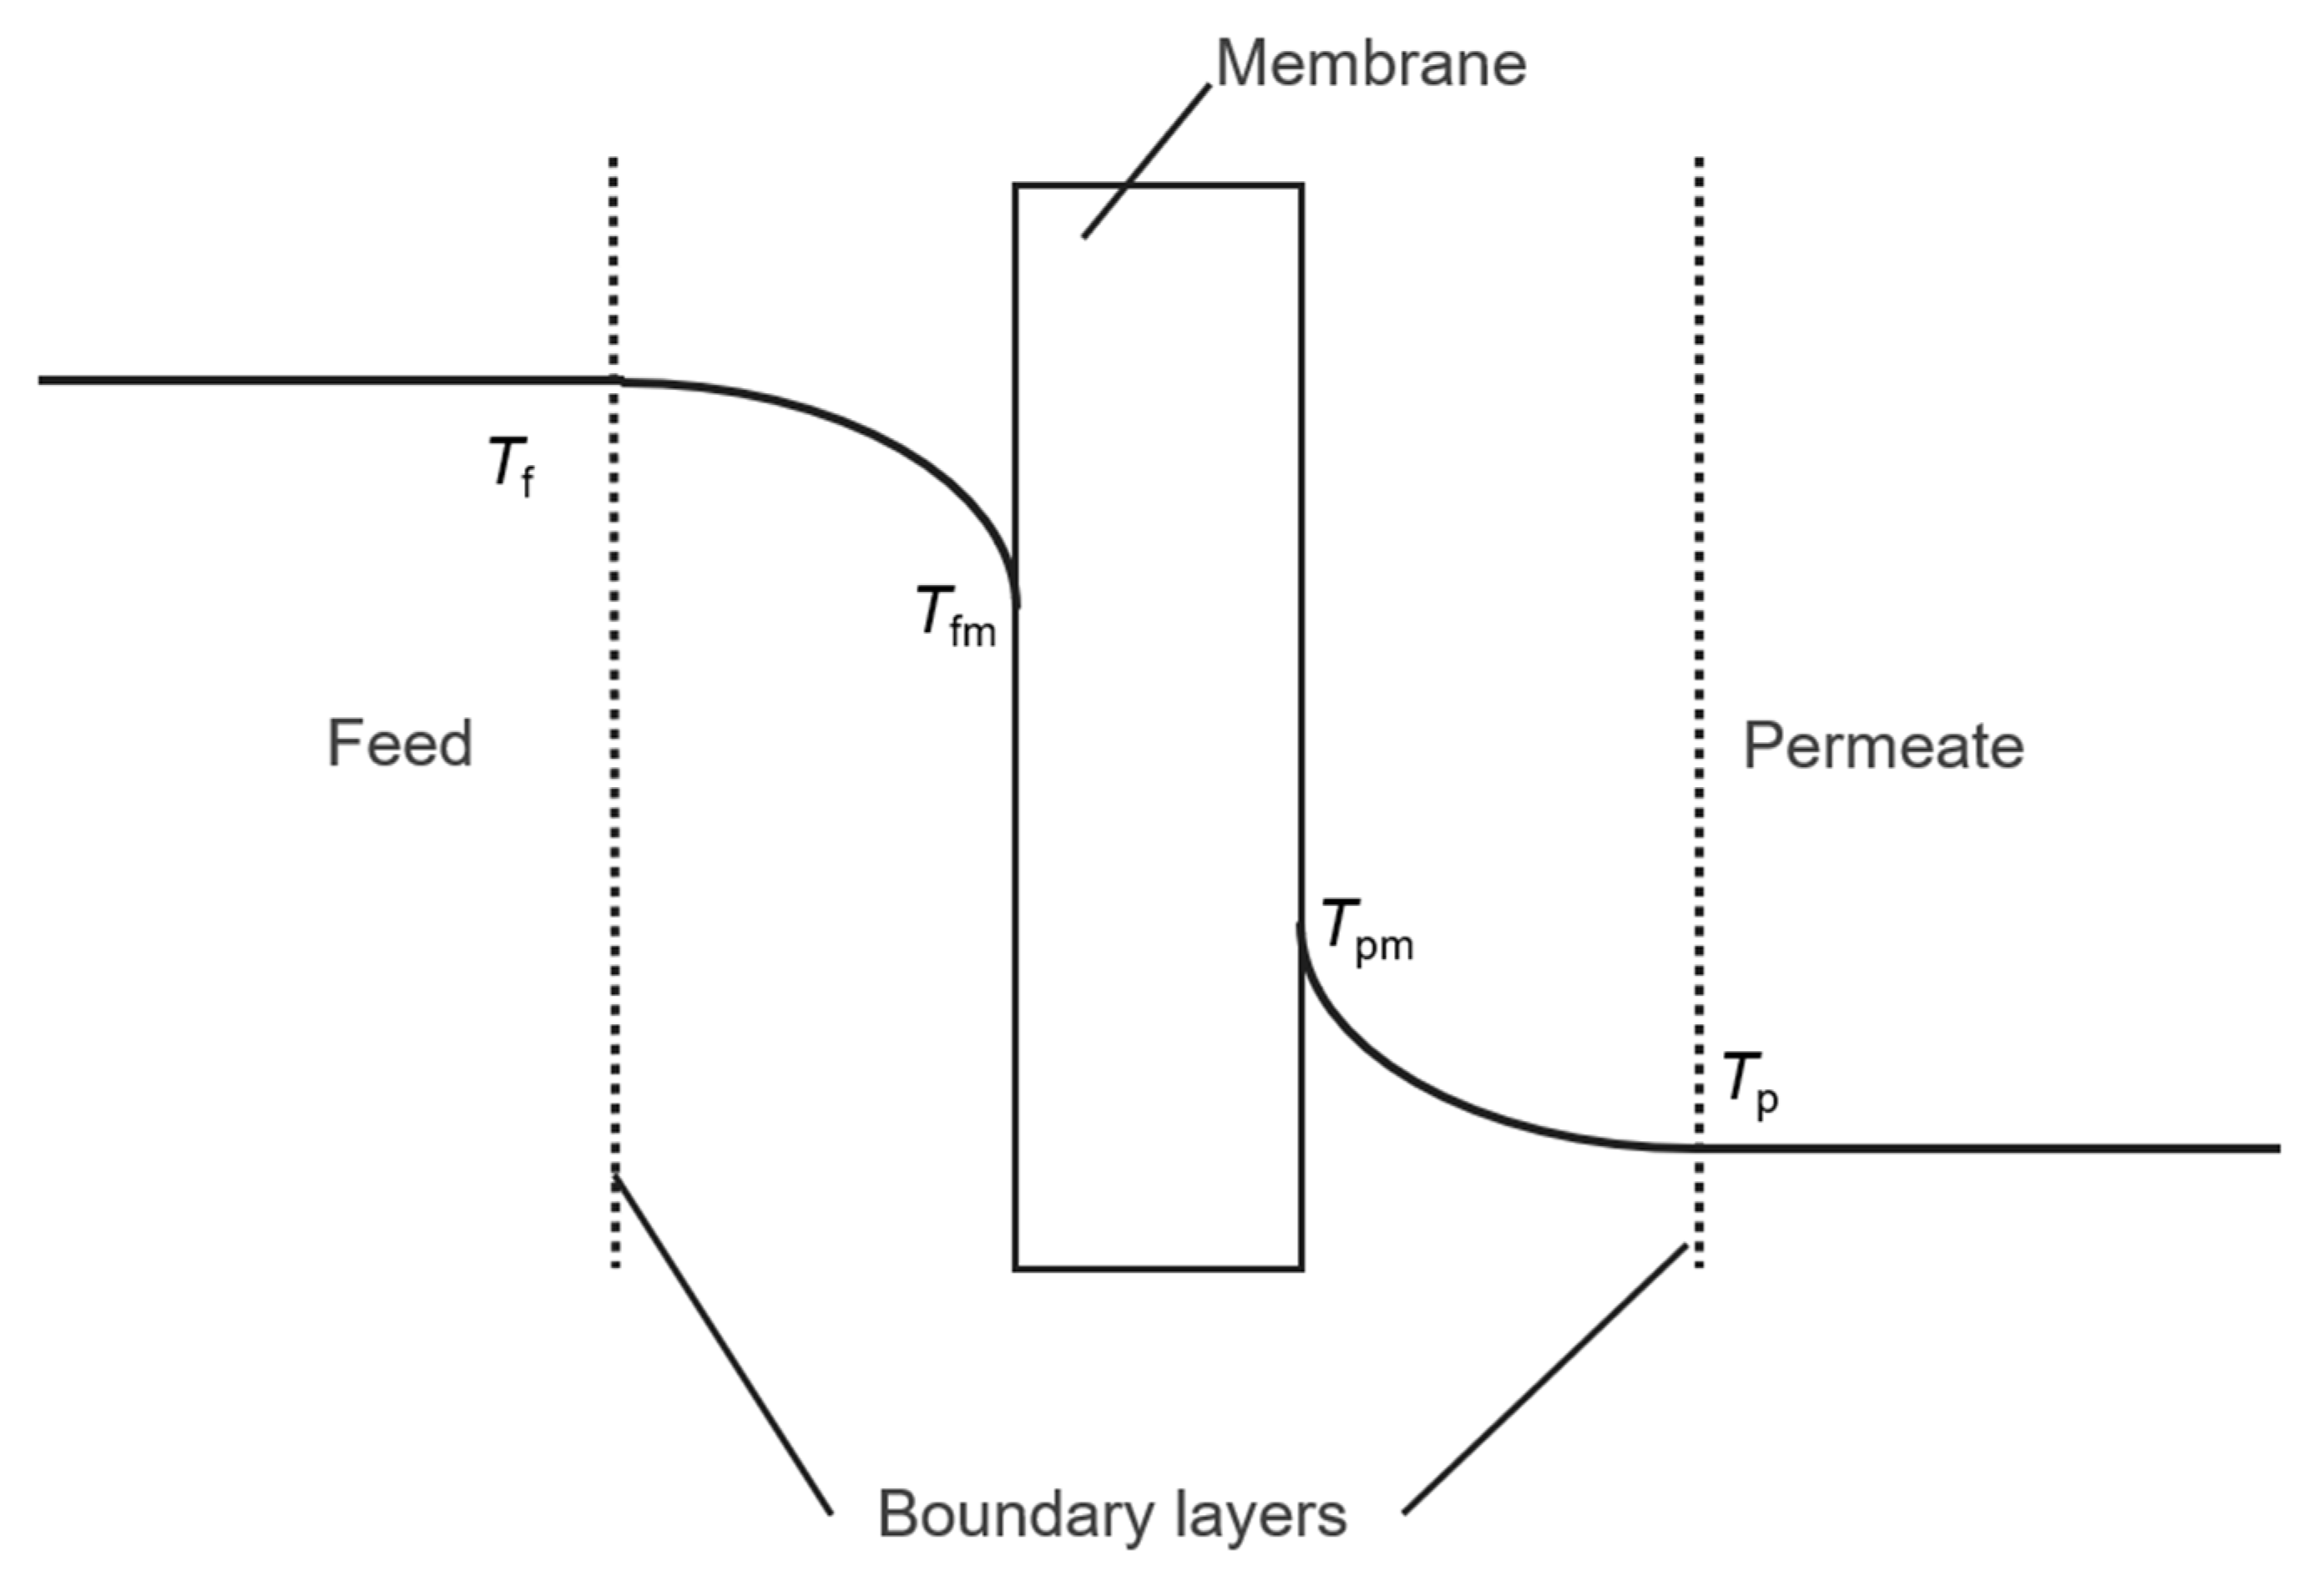
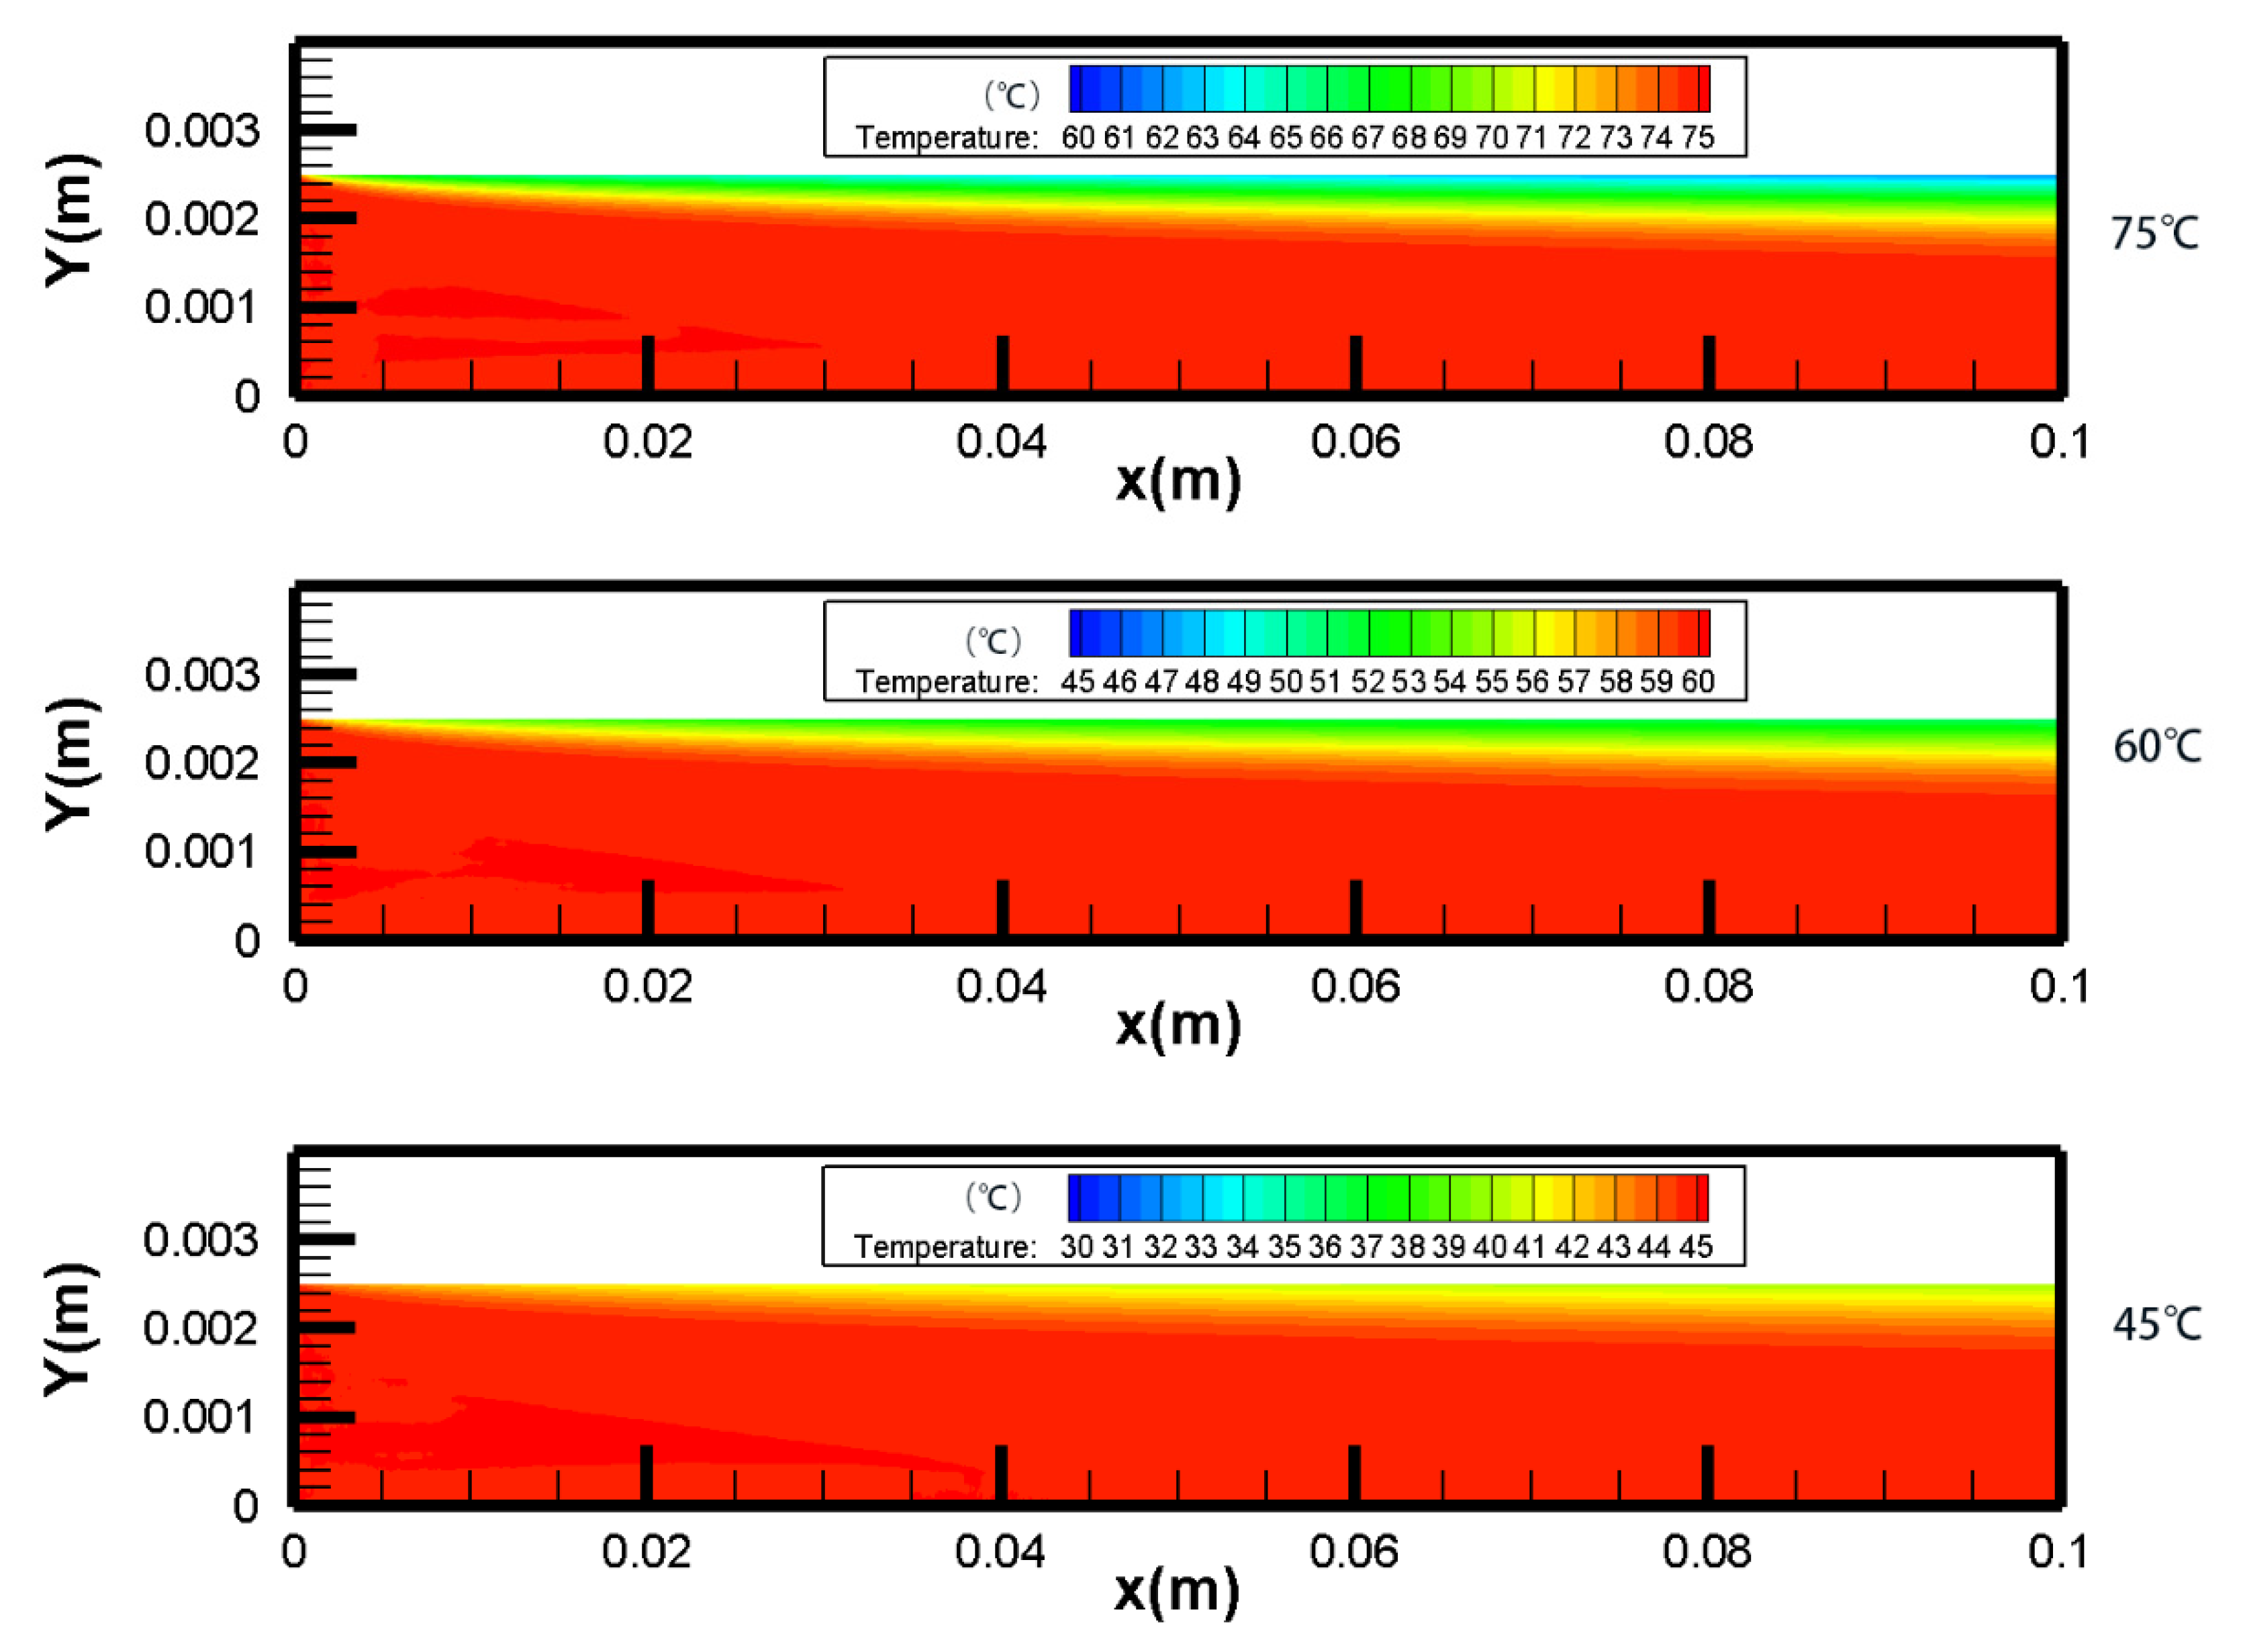
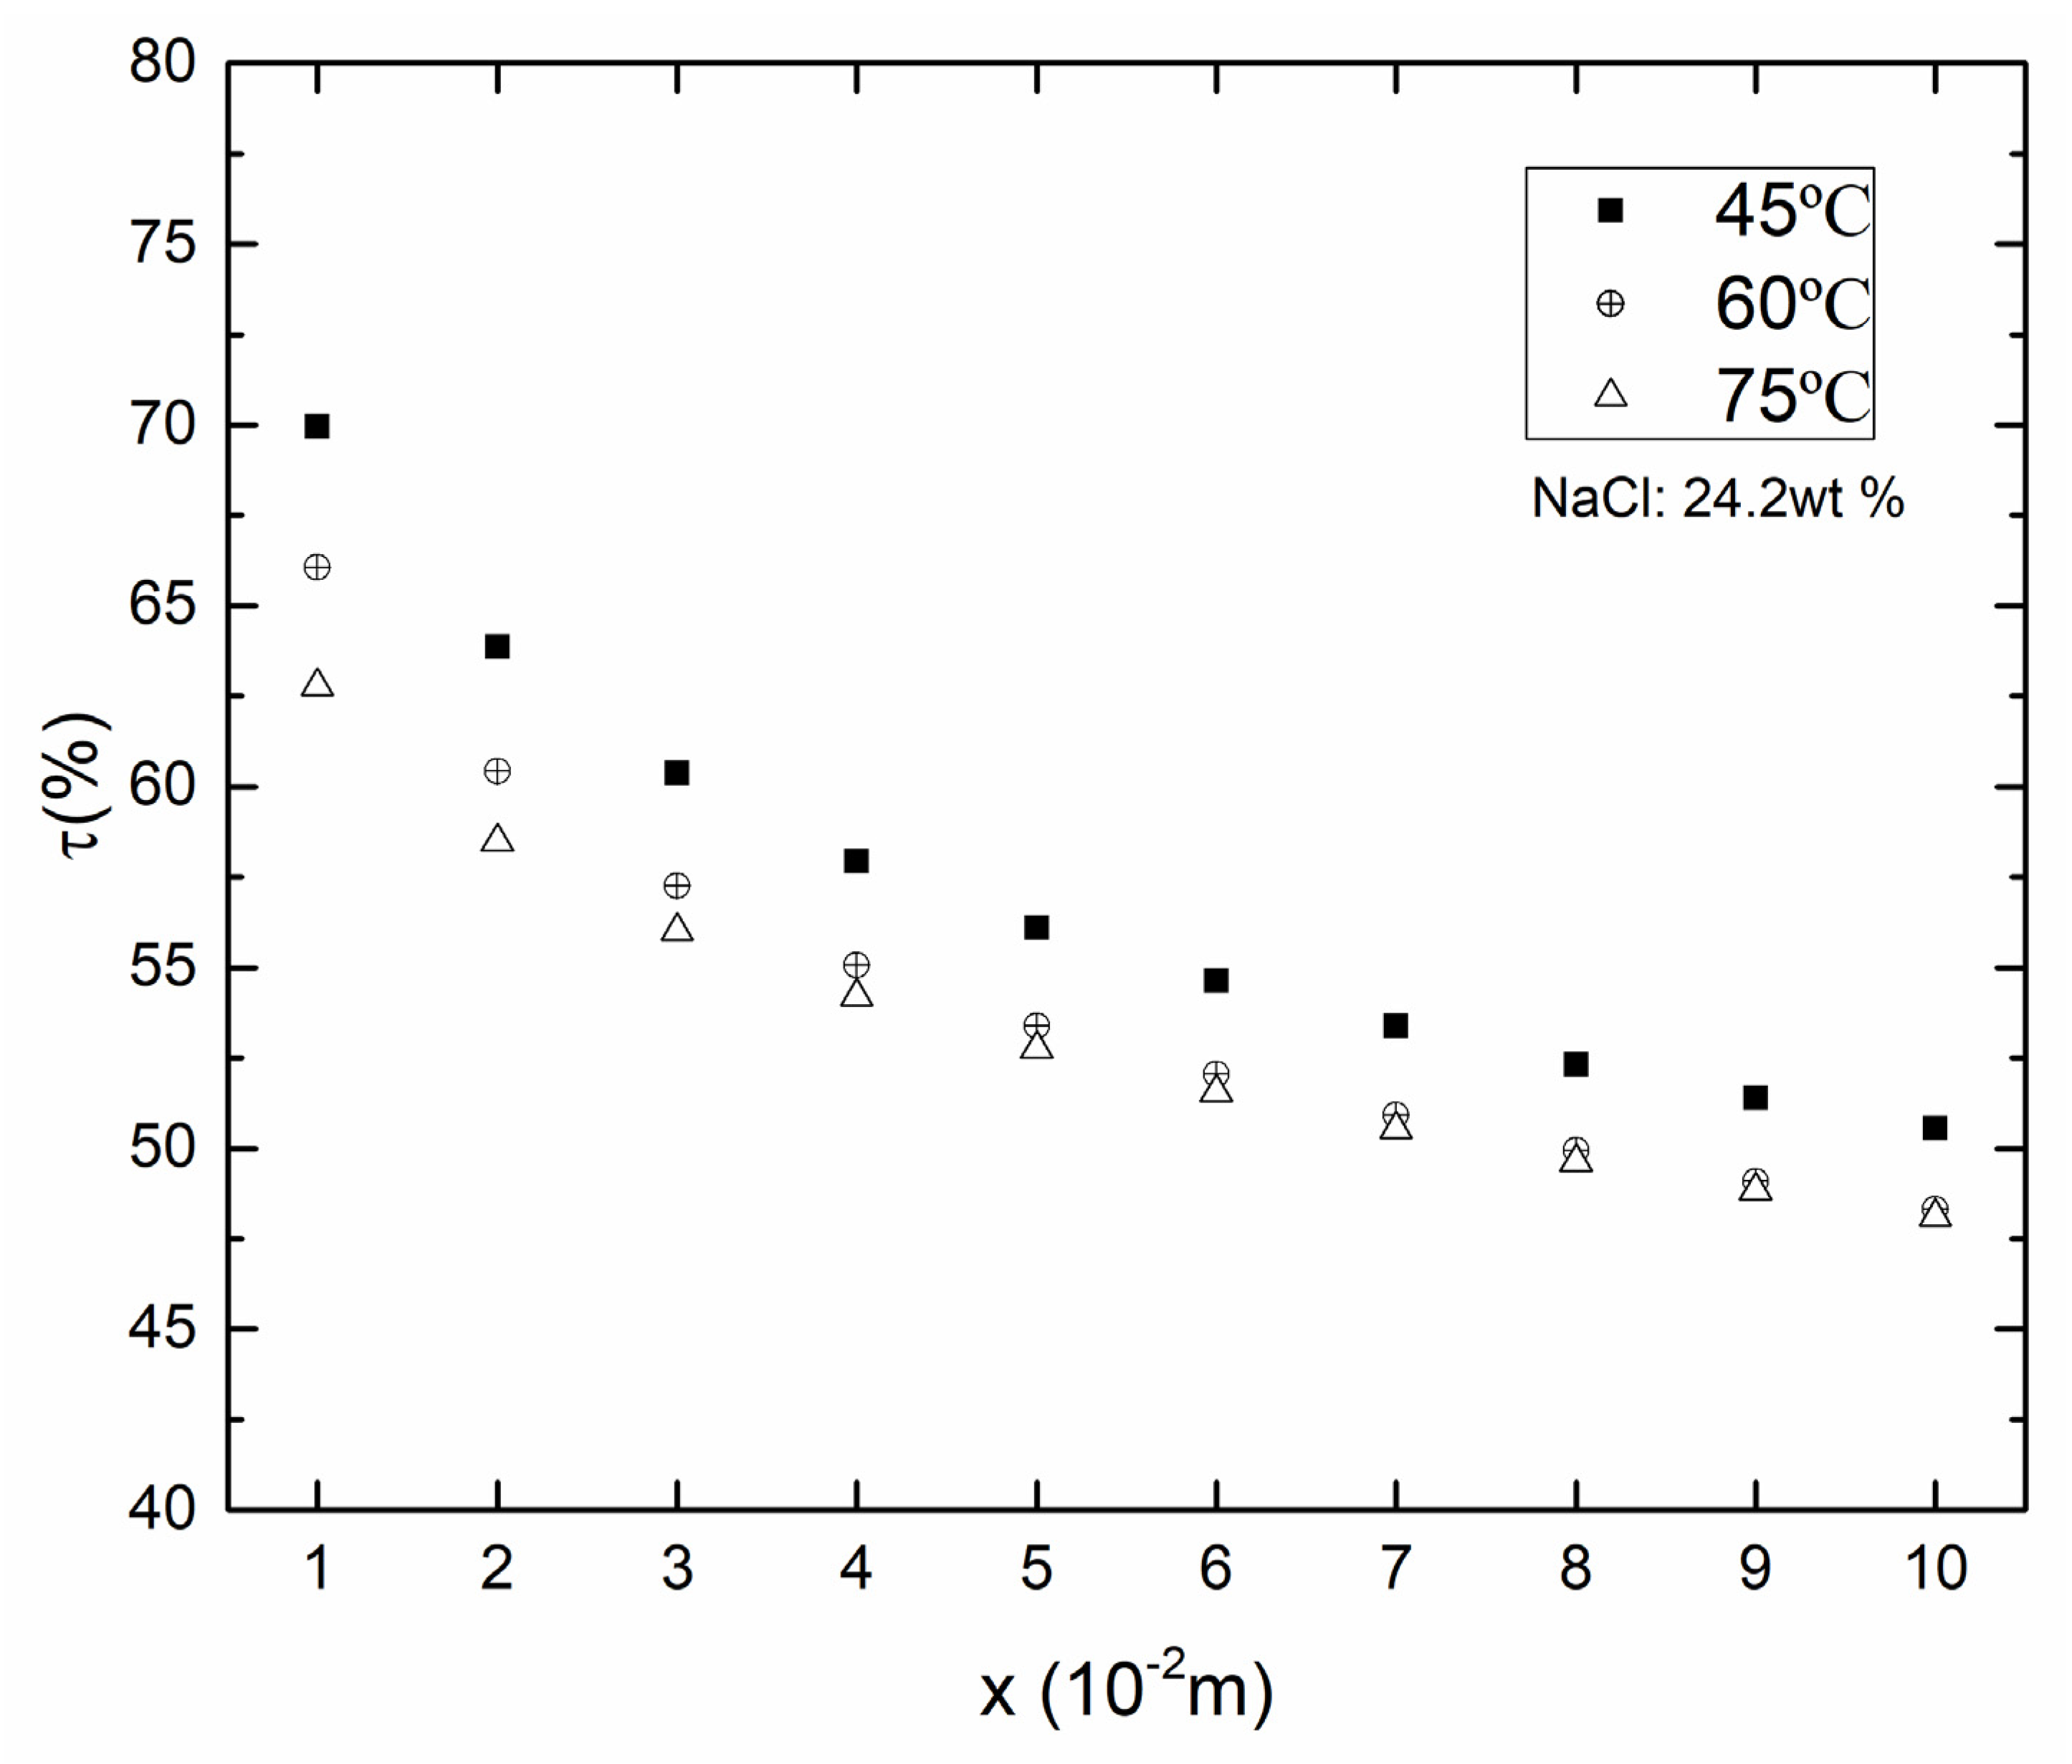
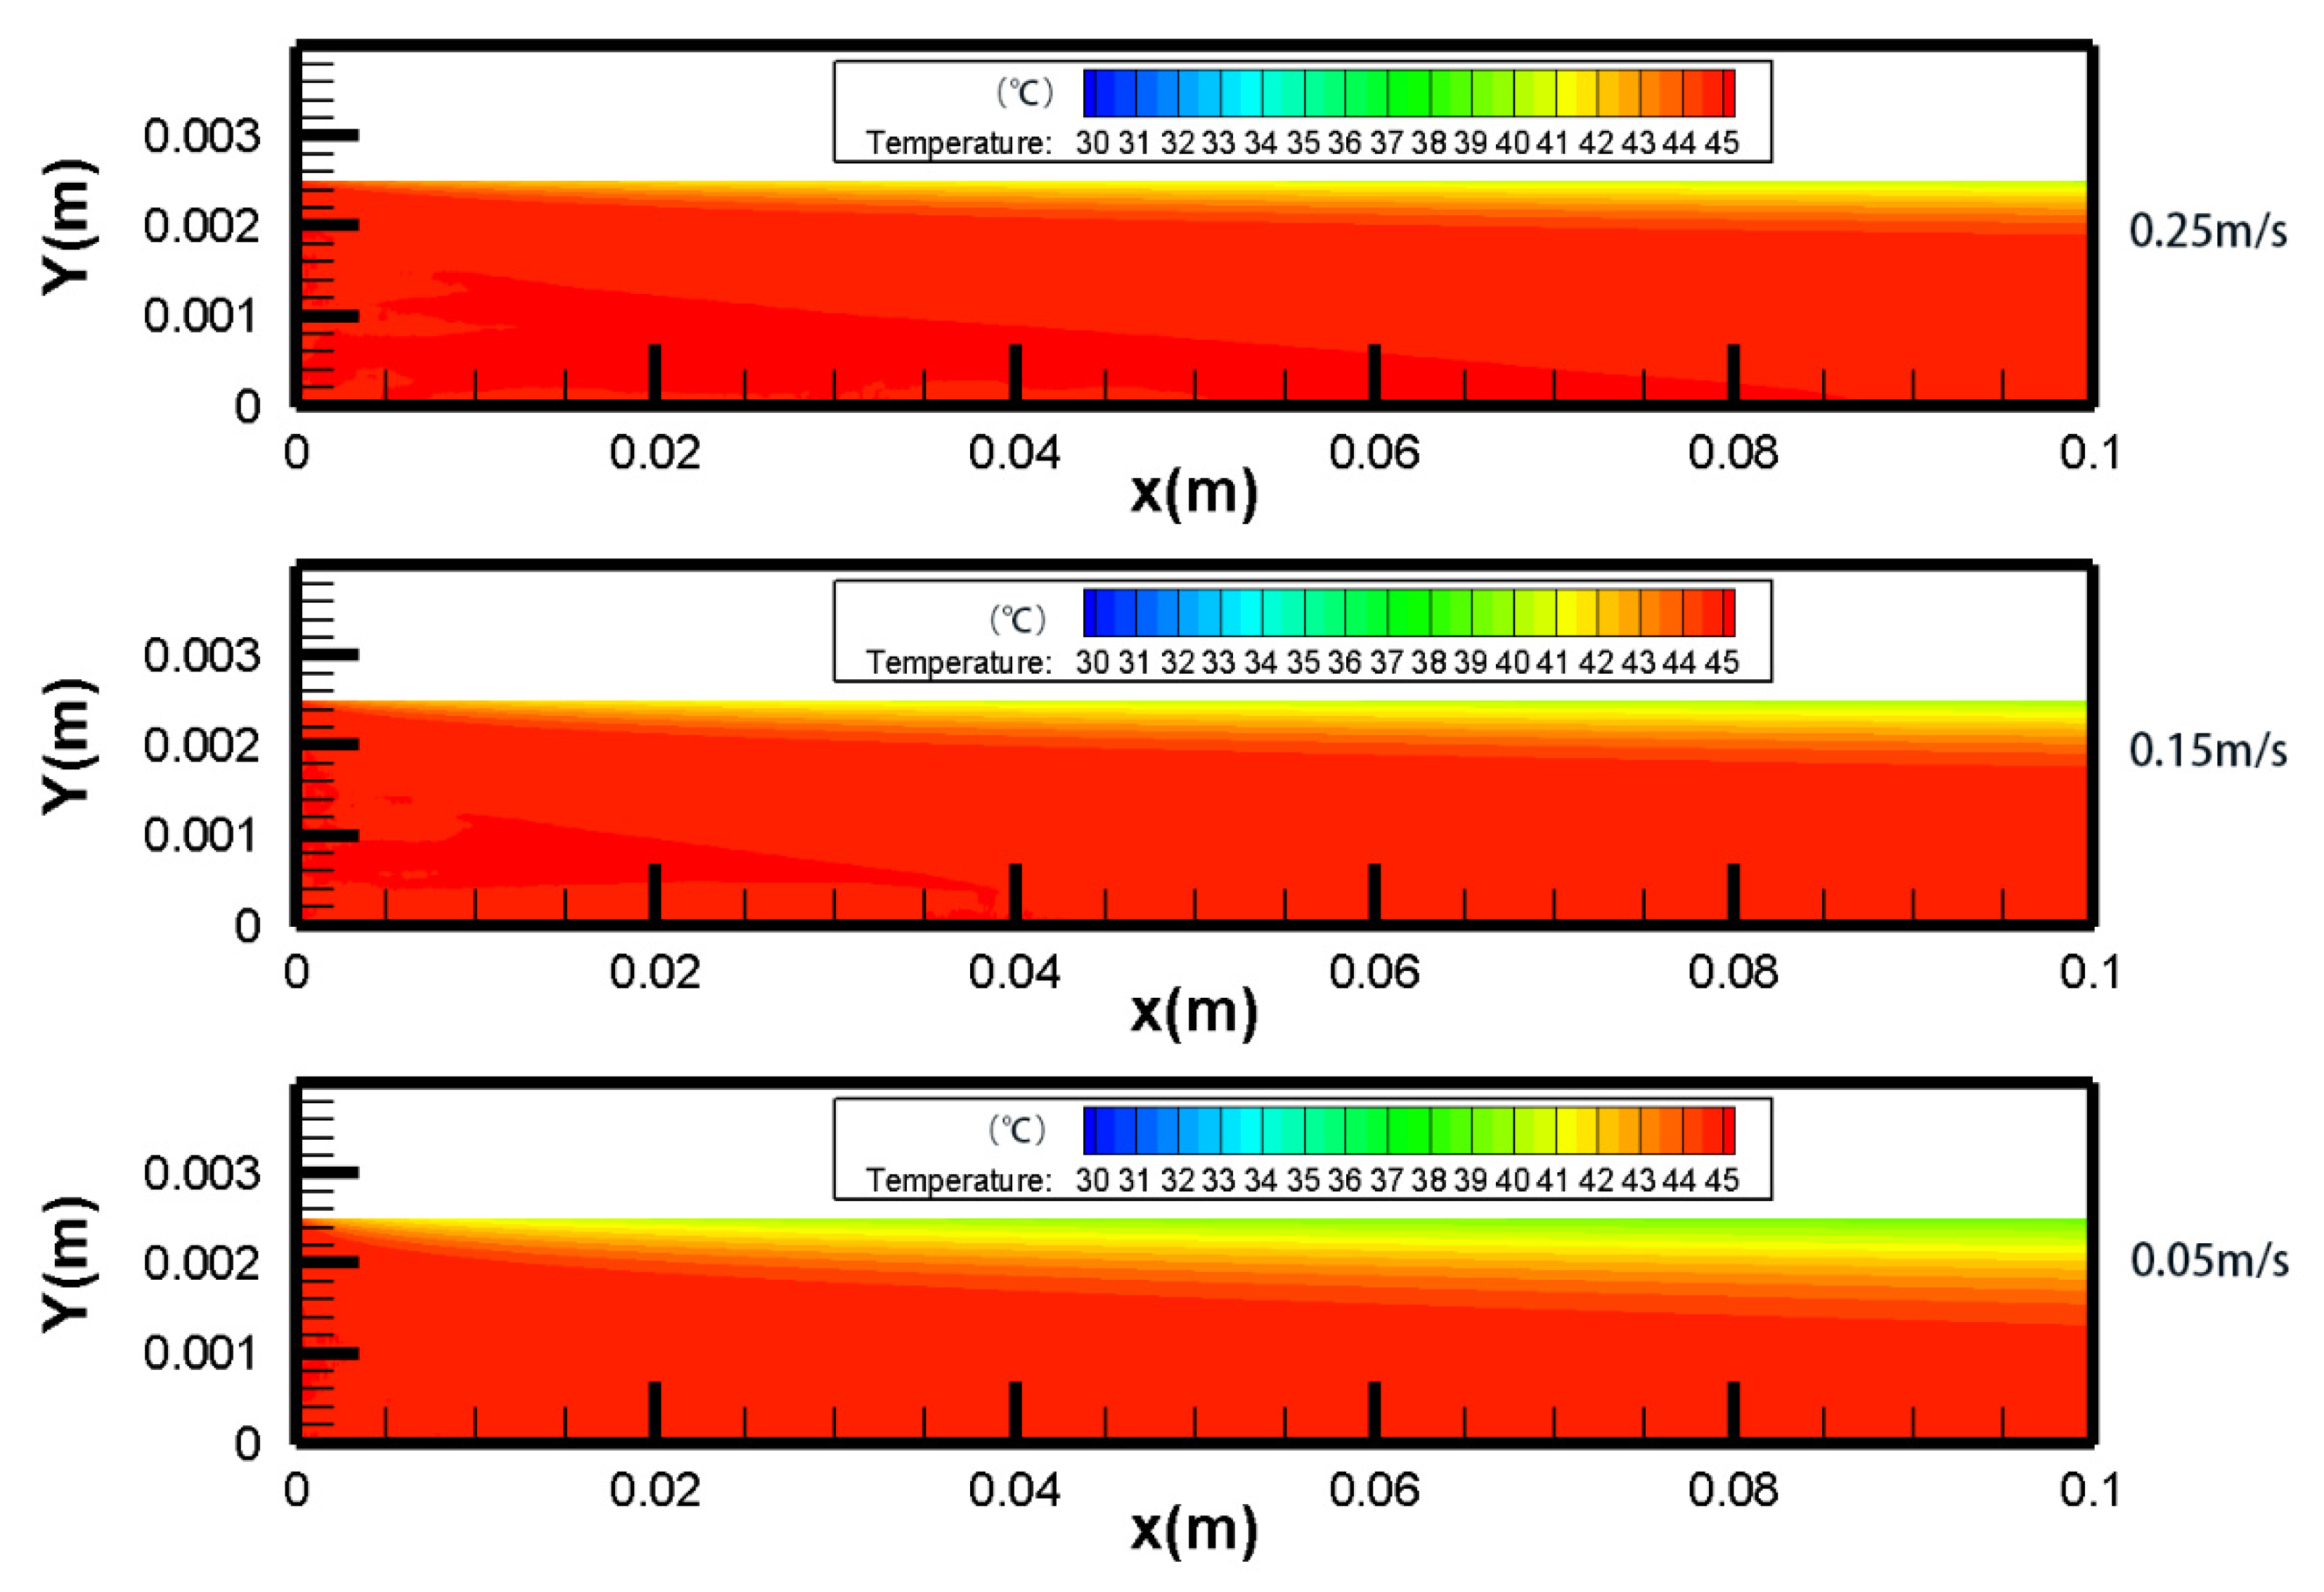
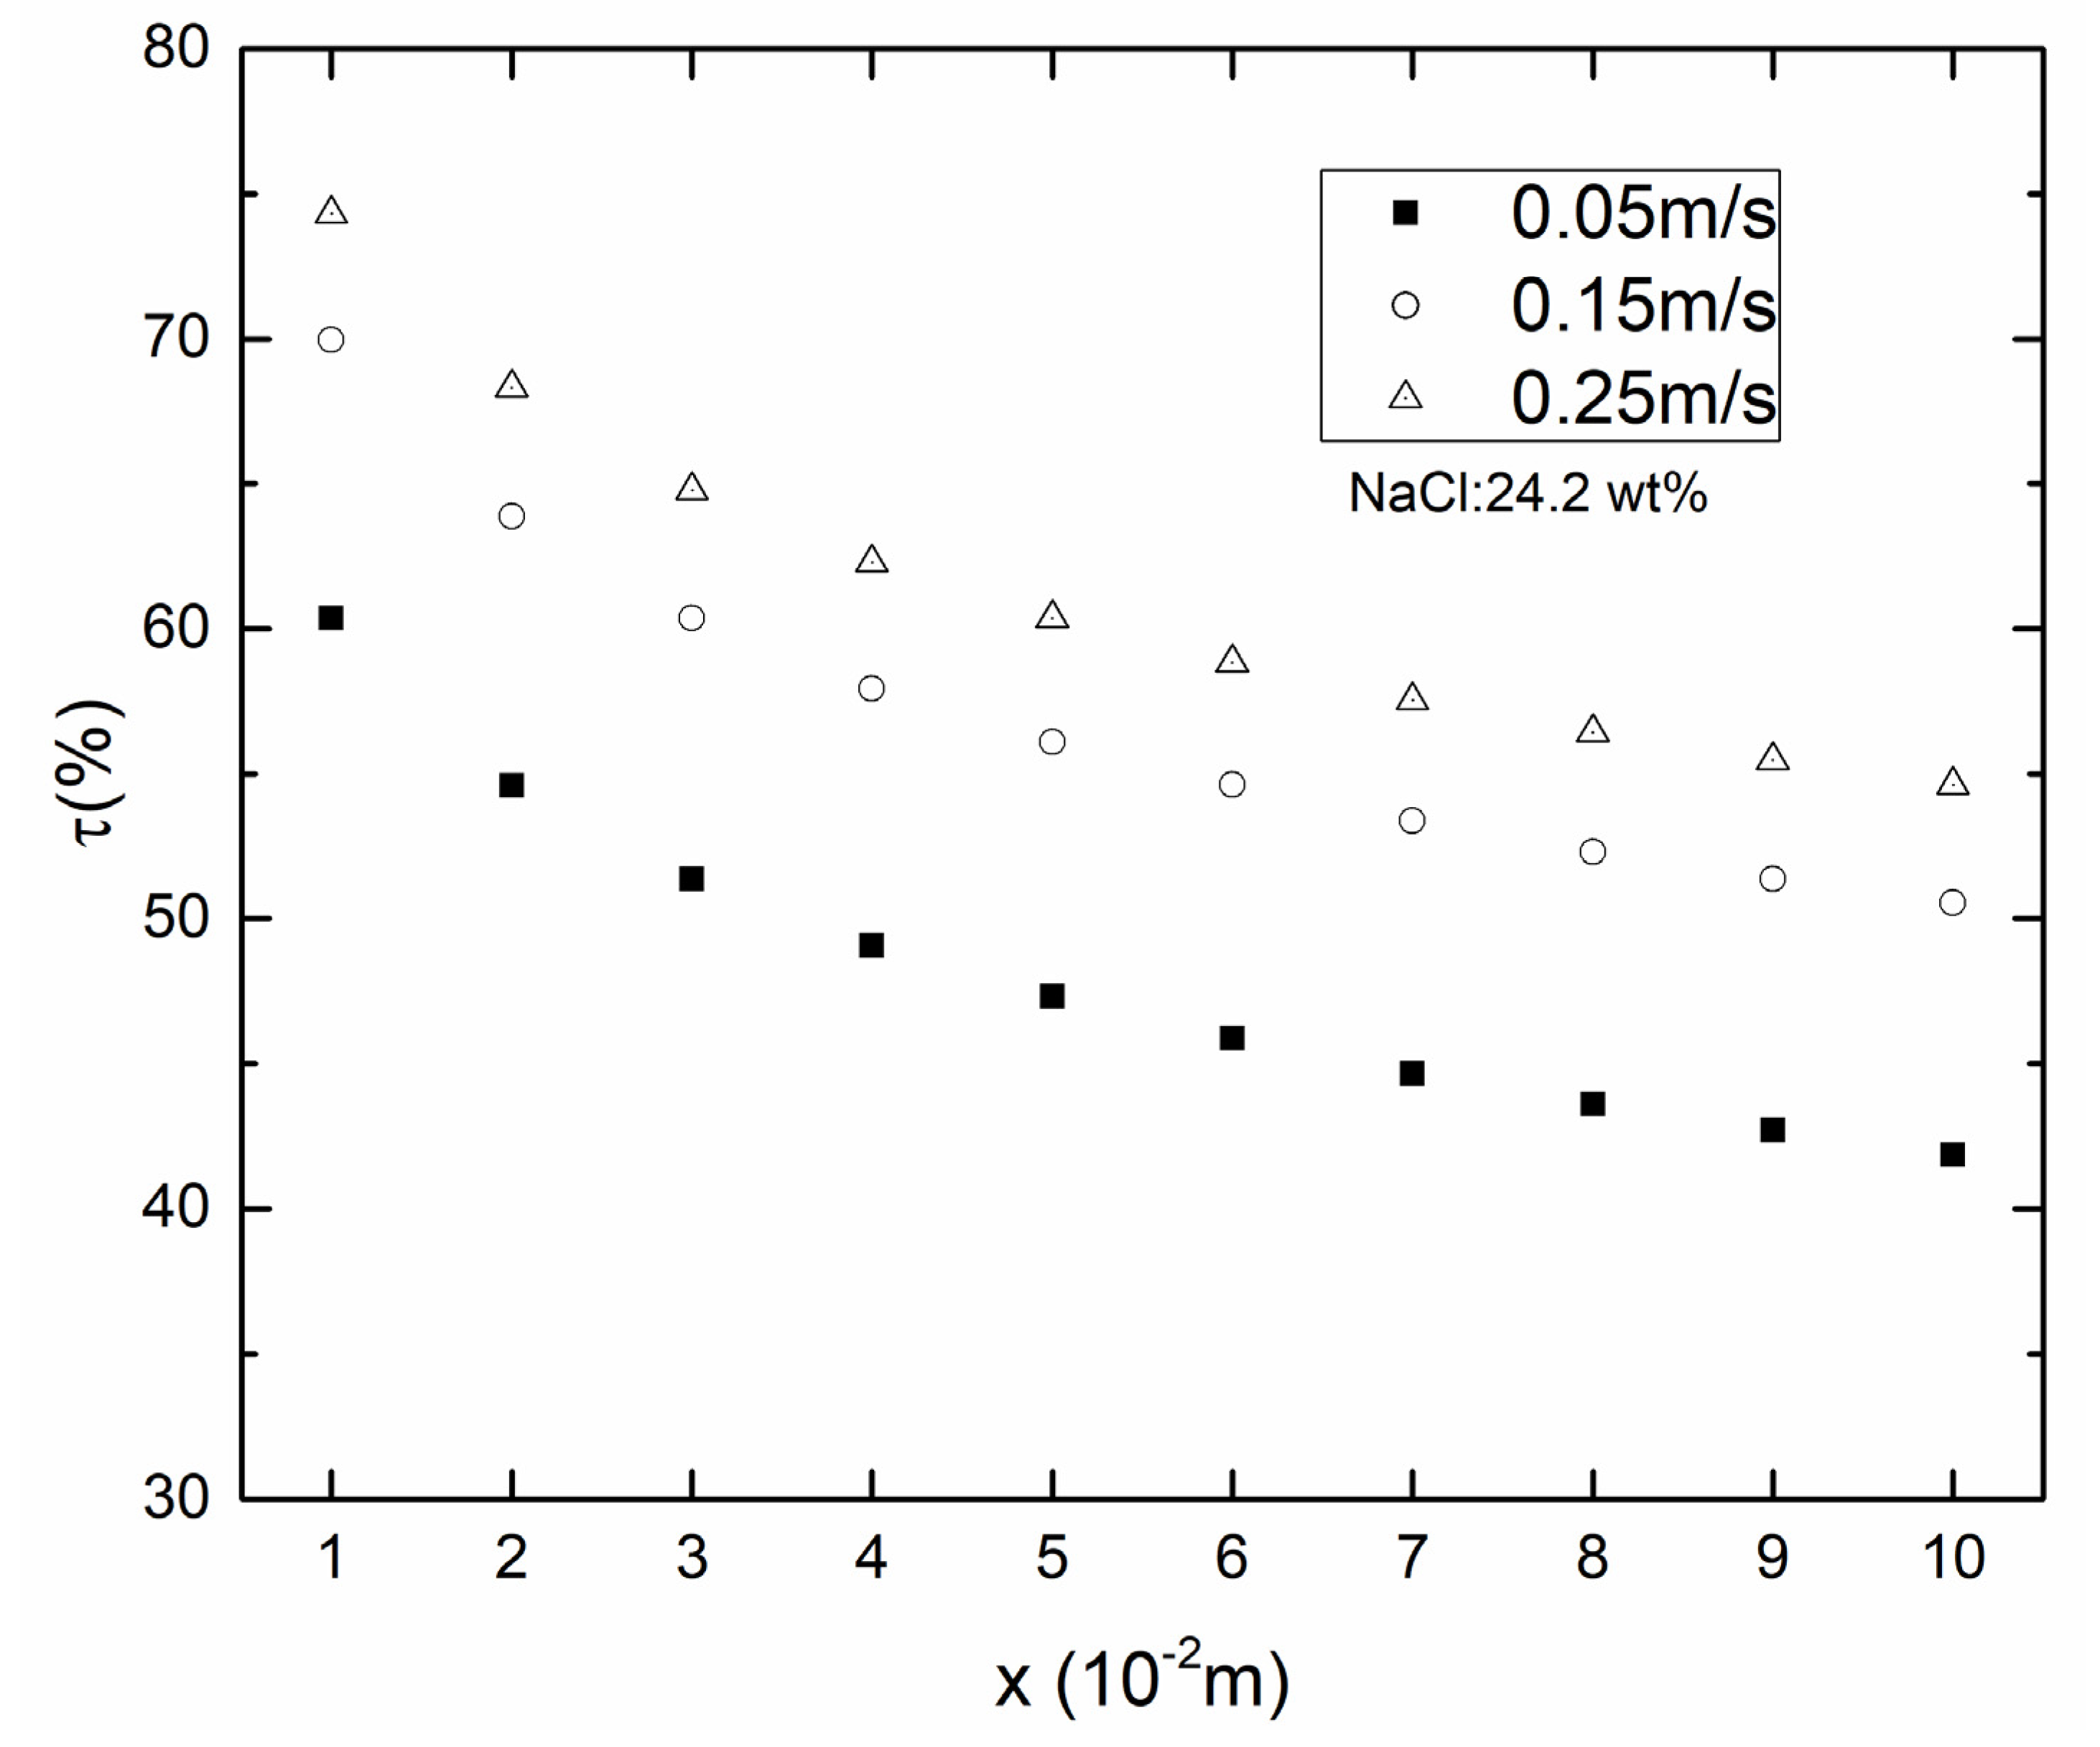
4.1. Temperature Polarization

As shown in Figure 4 and Figure 5, there was a decrease in both TPC and Tf over the membrane surface along the x-axis in each Tf. This was because that the temperature boundary layer became thicker along the x direction, and the temperature difference between the membrane surface and the bulk area became larger, which caused a decrease of TPC. With the Tf was increased from 45 to 75 °C, the TPC decreased correspondingly from 69.9% (x = 0.01 m) to 62.8% (x = 0.01 m). The variation of temperature difference between two sides of the membrane surface was smaller than that of the temperature difference between the bulk and membrane surface, which led to the decrease of TPC.
Ali’s [42] study showed the theoretical and experimental TPC as a function of Reynolds number (Re) in the range of 1000 to 5000. When the Re was below 1000, which was exactly the Re of current study, TPC was around 0.68, showing good coincidence with the current study.
As shown in Figure 6 and Figure 7, the temperature boundary layer became thinner with the increasing vf, vp. When the vf, vp were 0.05 m/s, TPC decreased from 60.36% at inlet to 41.87% at outlet and the temperature difference between inlet and outlet at feed side was 5.86 °C. When vf, vp were increased to 0.25 m/s, TPC decreased from 75.32% at inlet to 54.62% at outlet and the temperature difference between inlet and outlet at feed side was decreased to 4.56 °C. Results suggested that increasing the vf, vp could reduce temperature polarization significantly.

4.2. Co- and Counter-Current Operations

In this section, in order to well investigate the temperature field and EE of co- and counter-current operations, the calculation domain of x direction was extended by 3 times. The influence of vf, vp, Tf and salinity on EE for co- and counter-current operation was evaluated in detail.

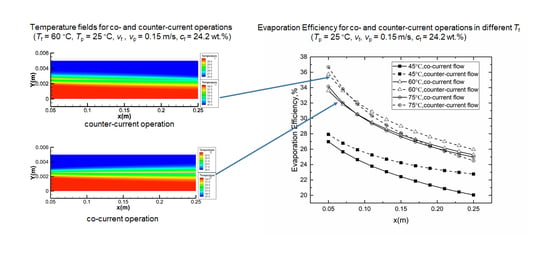
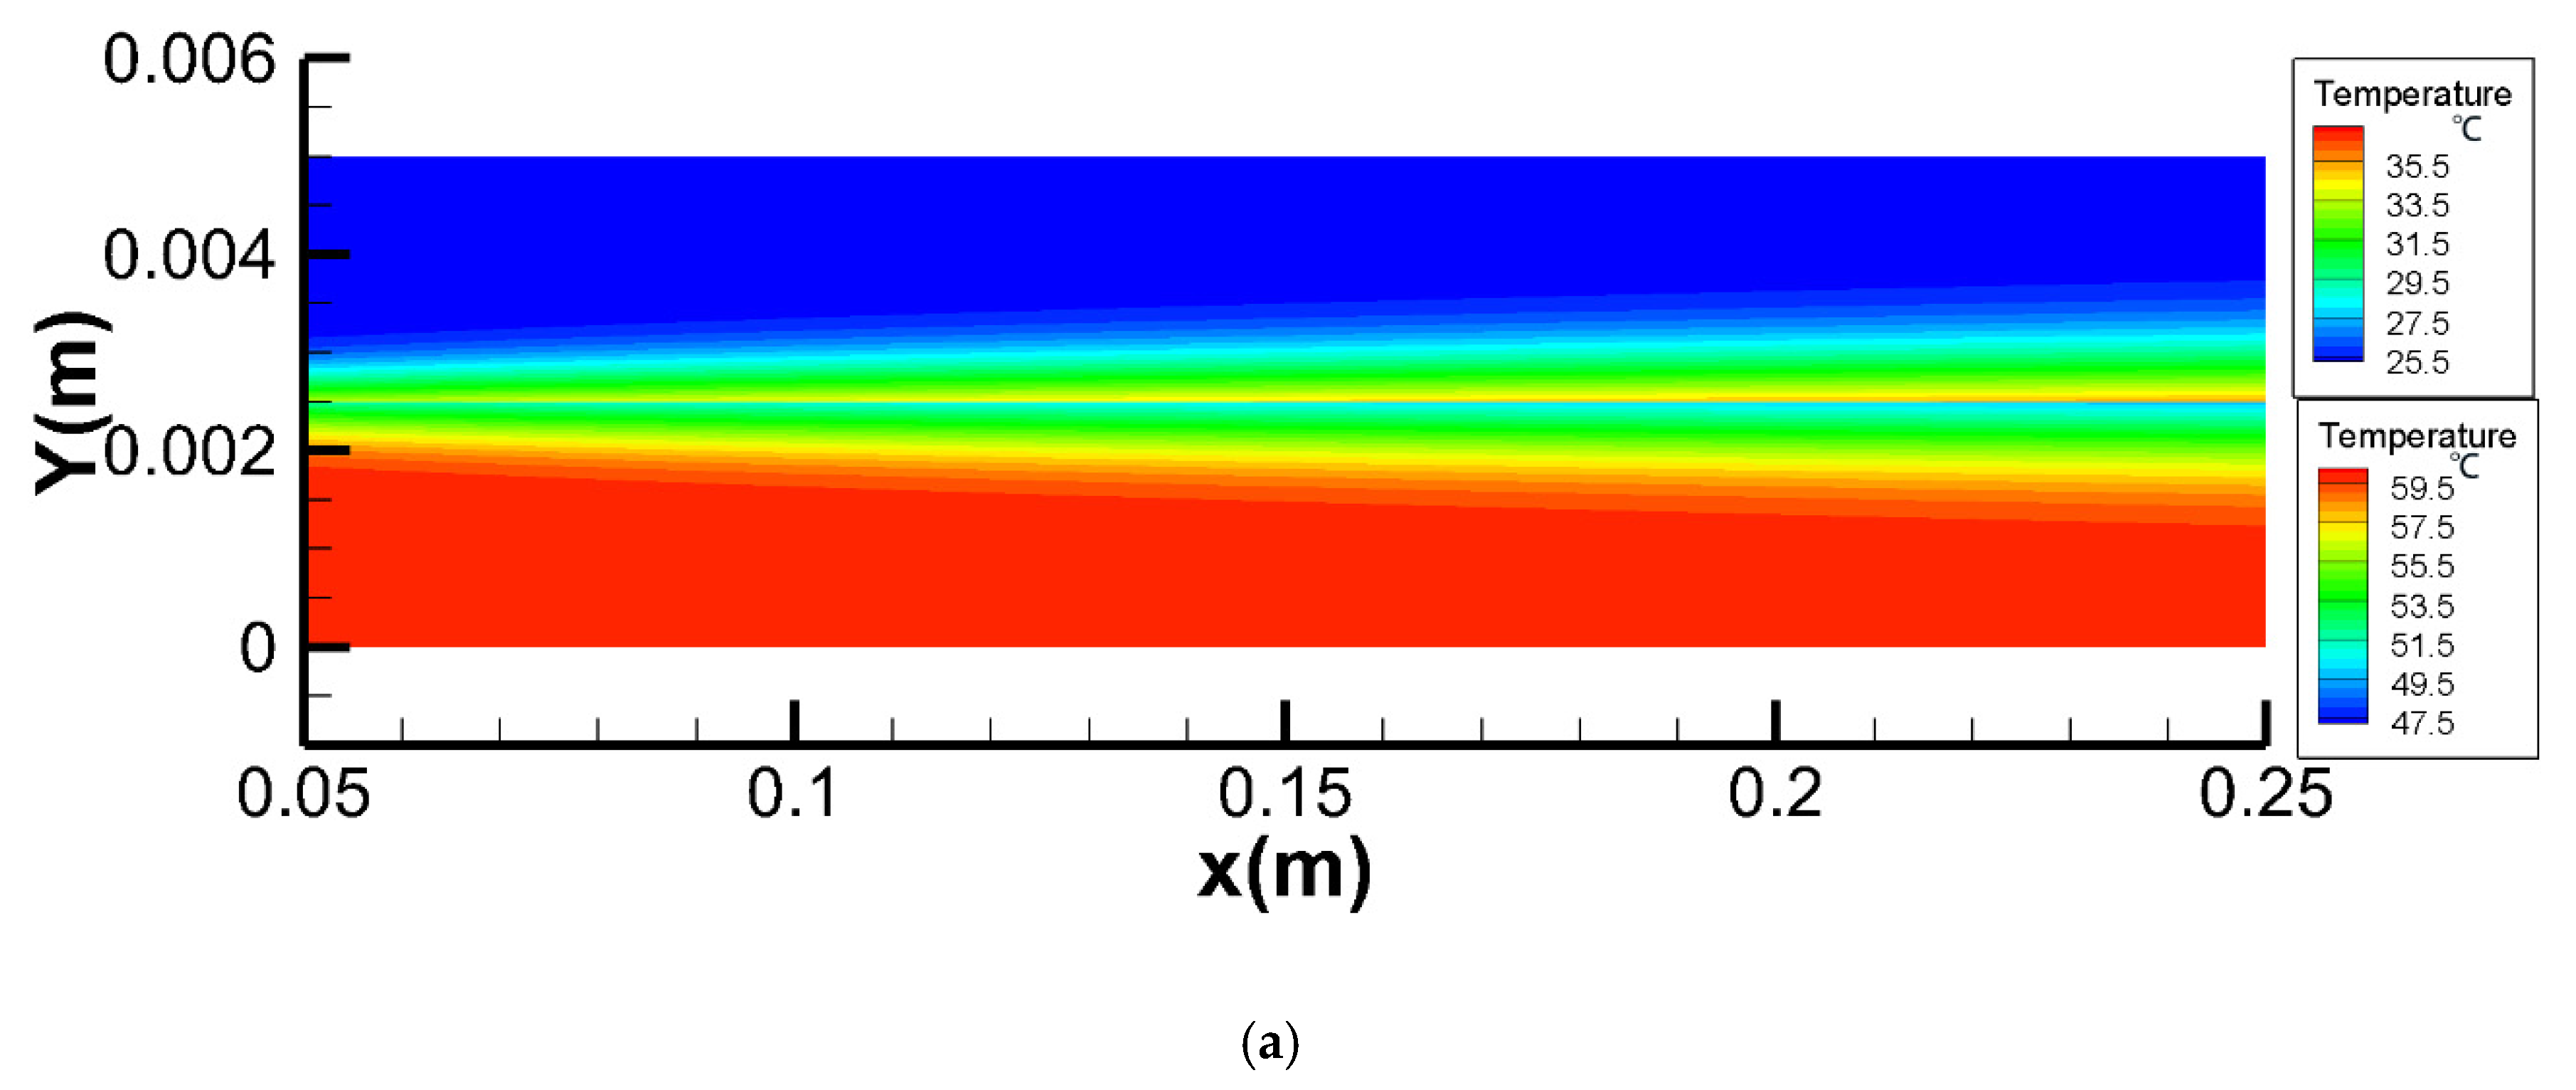
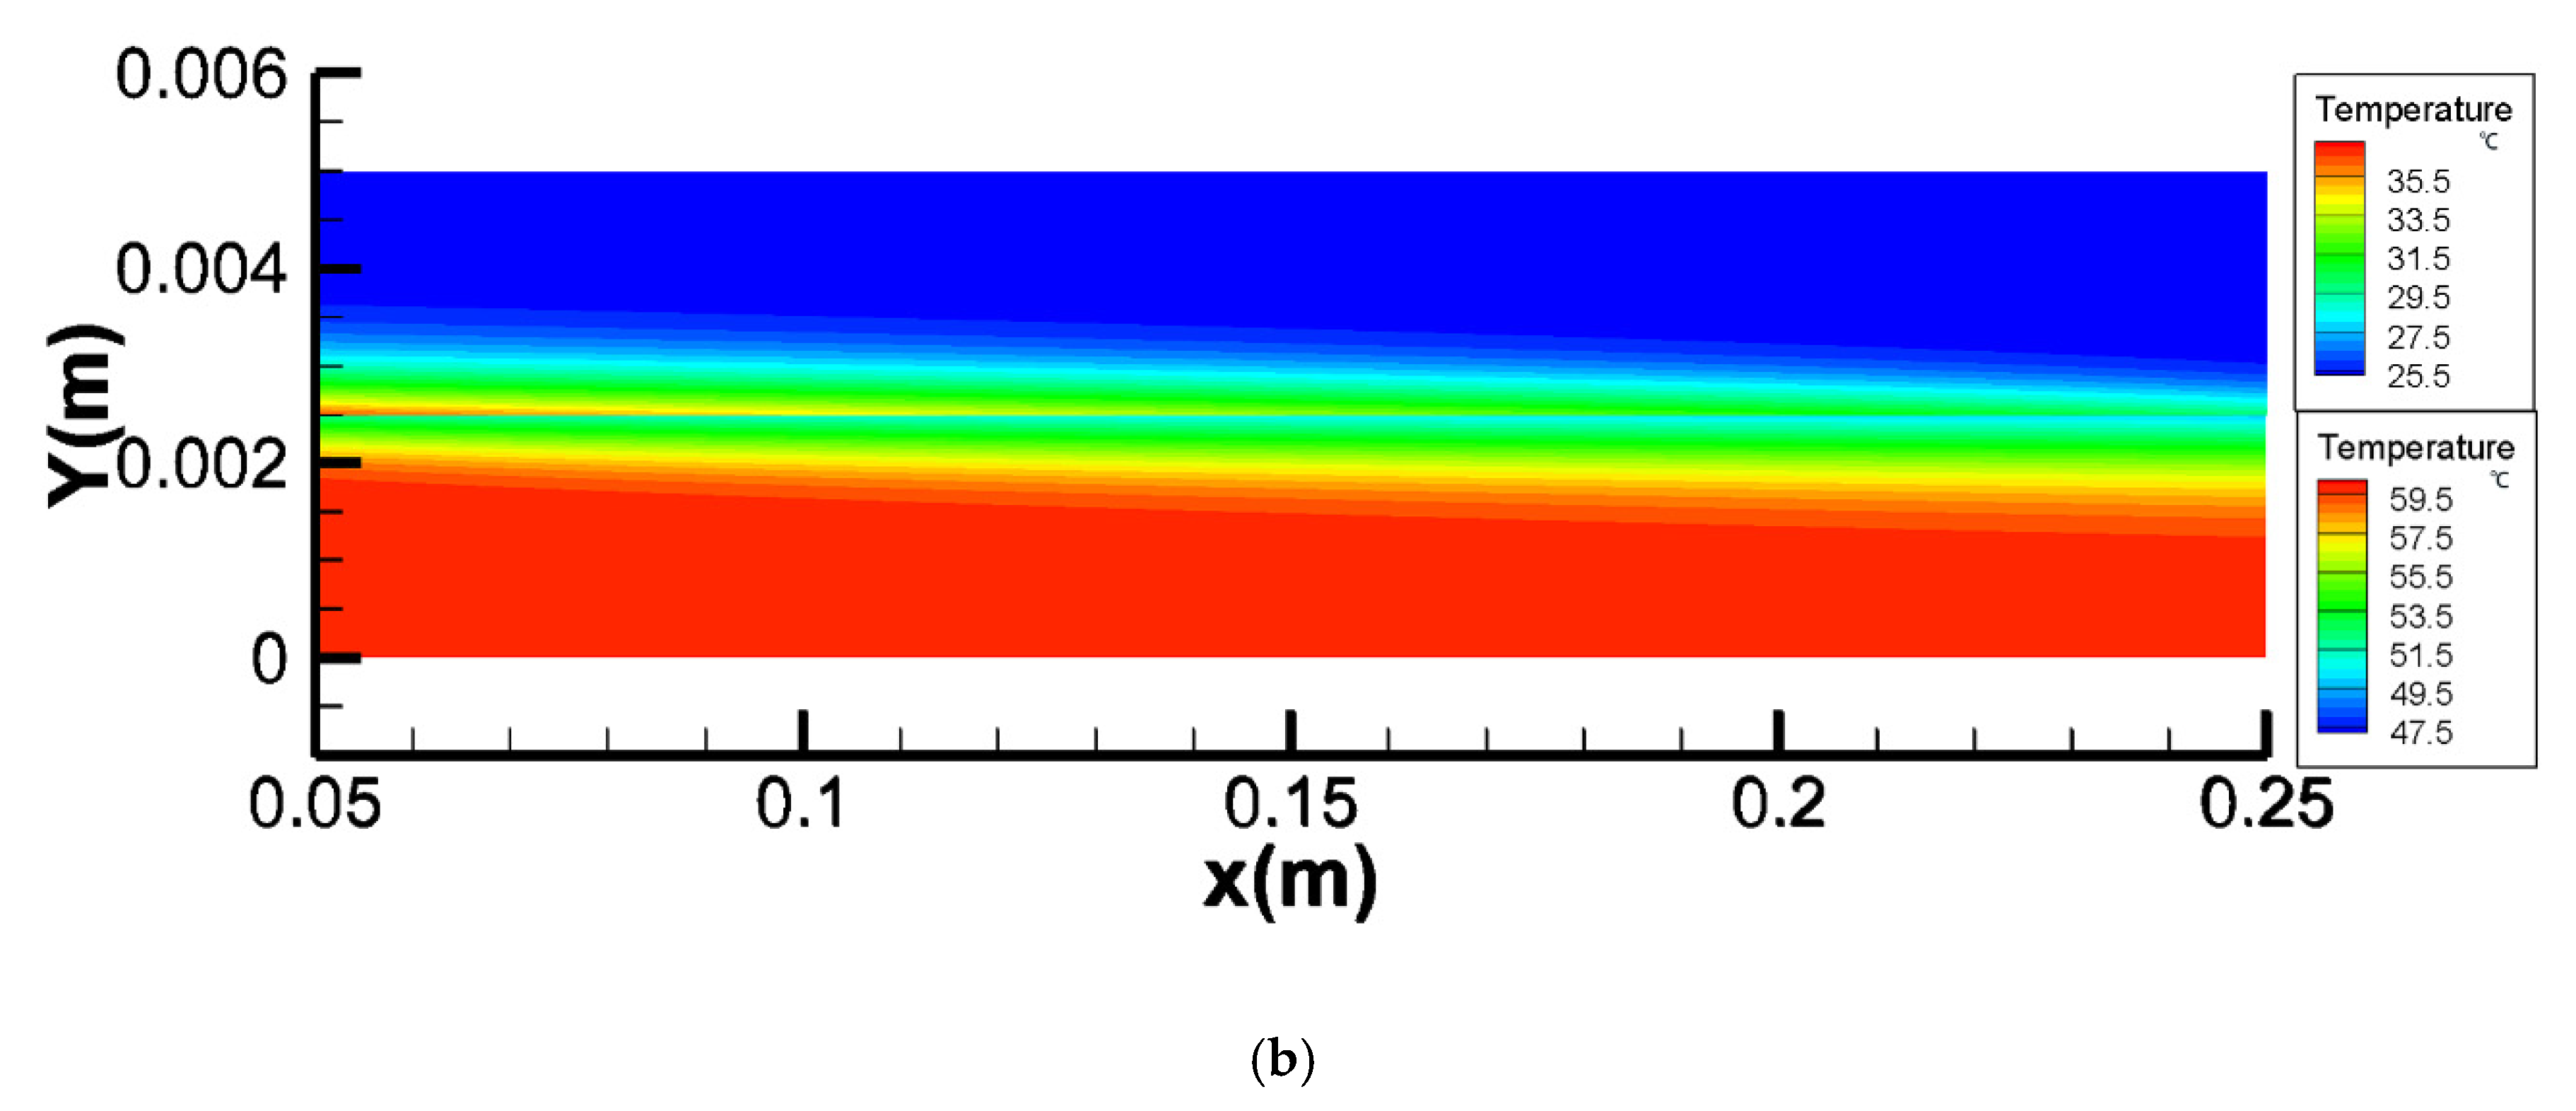
4.2.1. Temperature Fields

As shown in Figure 8, there was a decrease in Tf and an increase in Tp along the x-axis in co- and counter-current operations. In the studied cases, the feed side temperature difference between the inlet and outlet for co- and counter-current operations was 2.06 °C and 4.42 °C, respectively, which indicated that counter-current operation performed better than co-current. The temperature distribution of both feed and permeate sides along the x-axis was more homogeneous in counter-current operation, which resulted less thermal stress on the membrane. It was beneficial to prolong the working life of the membrane module. The temperature fields of count-current and co-current were well coincided with experimental data [43].

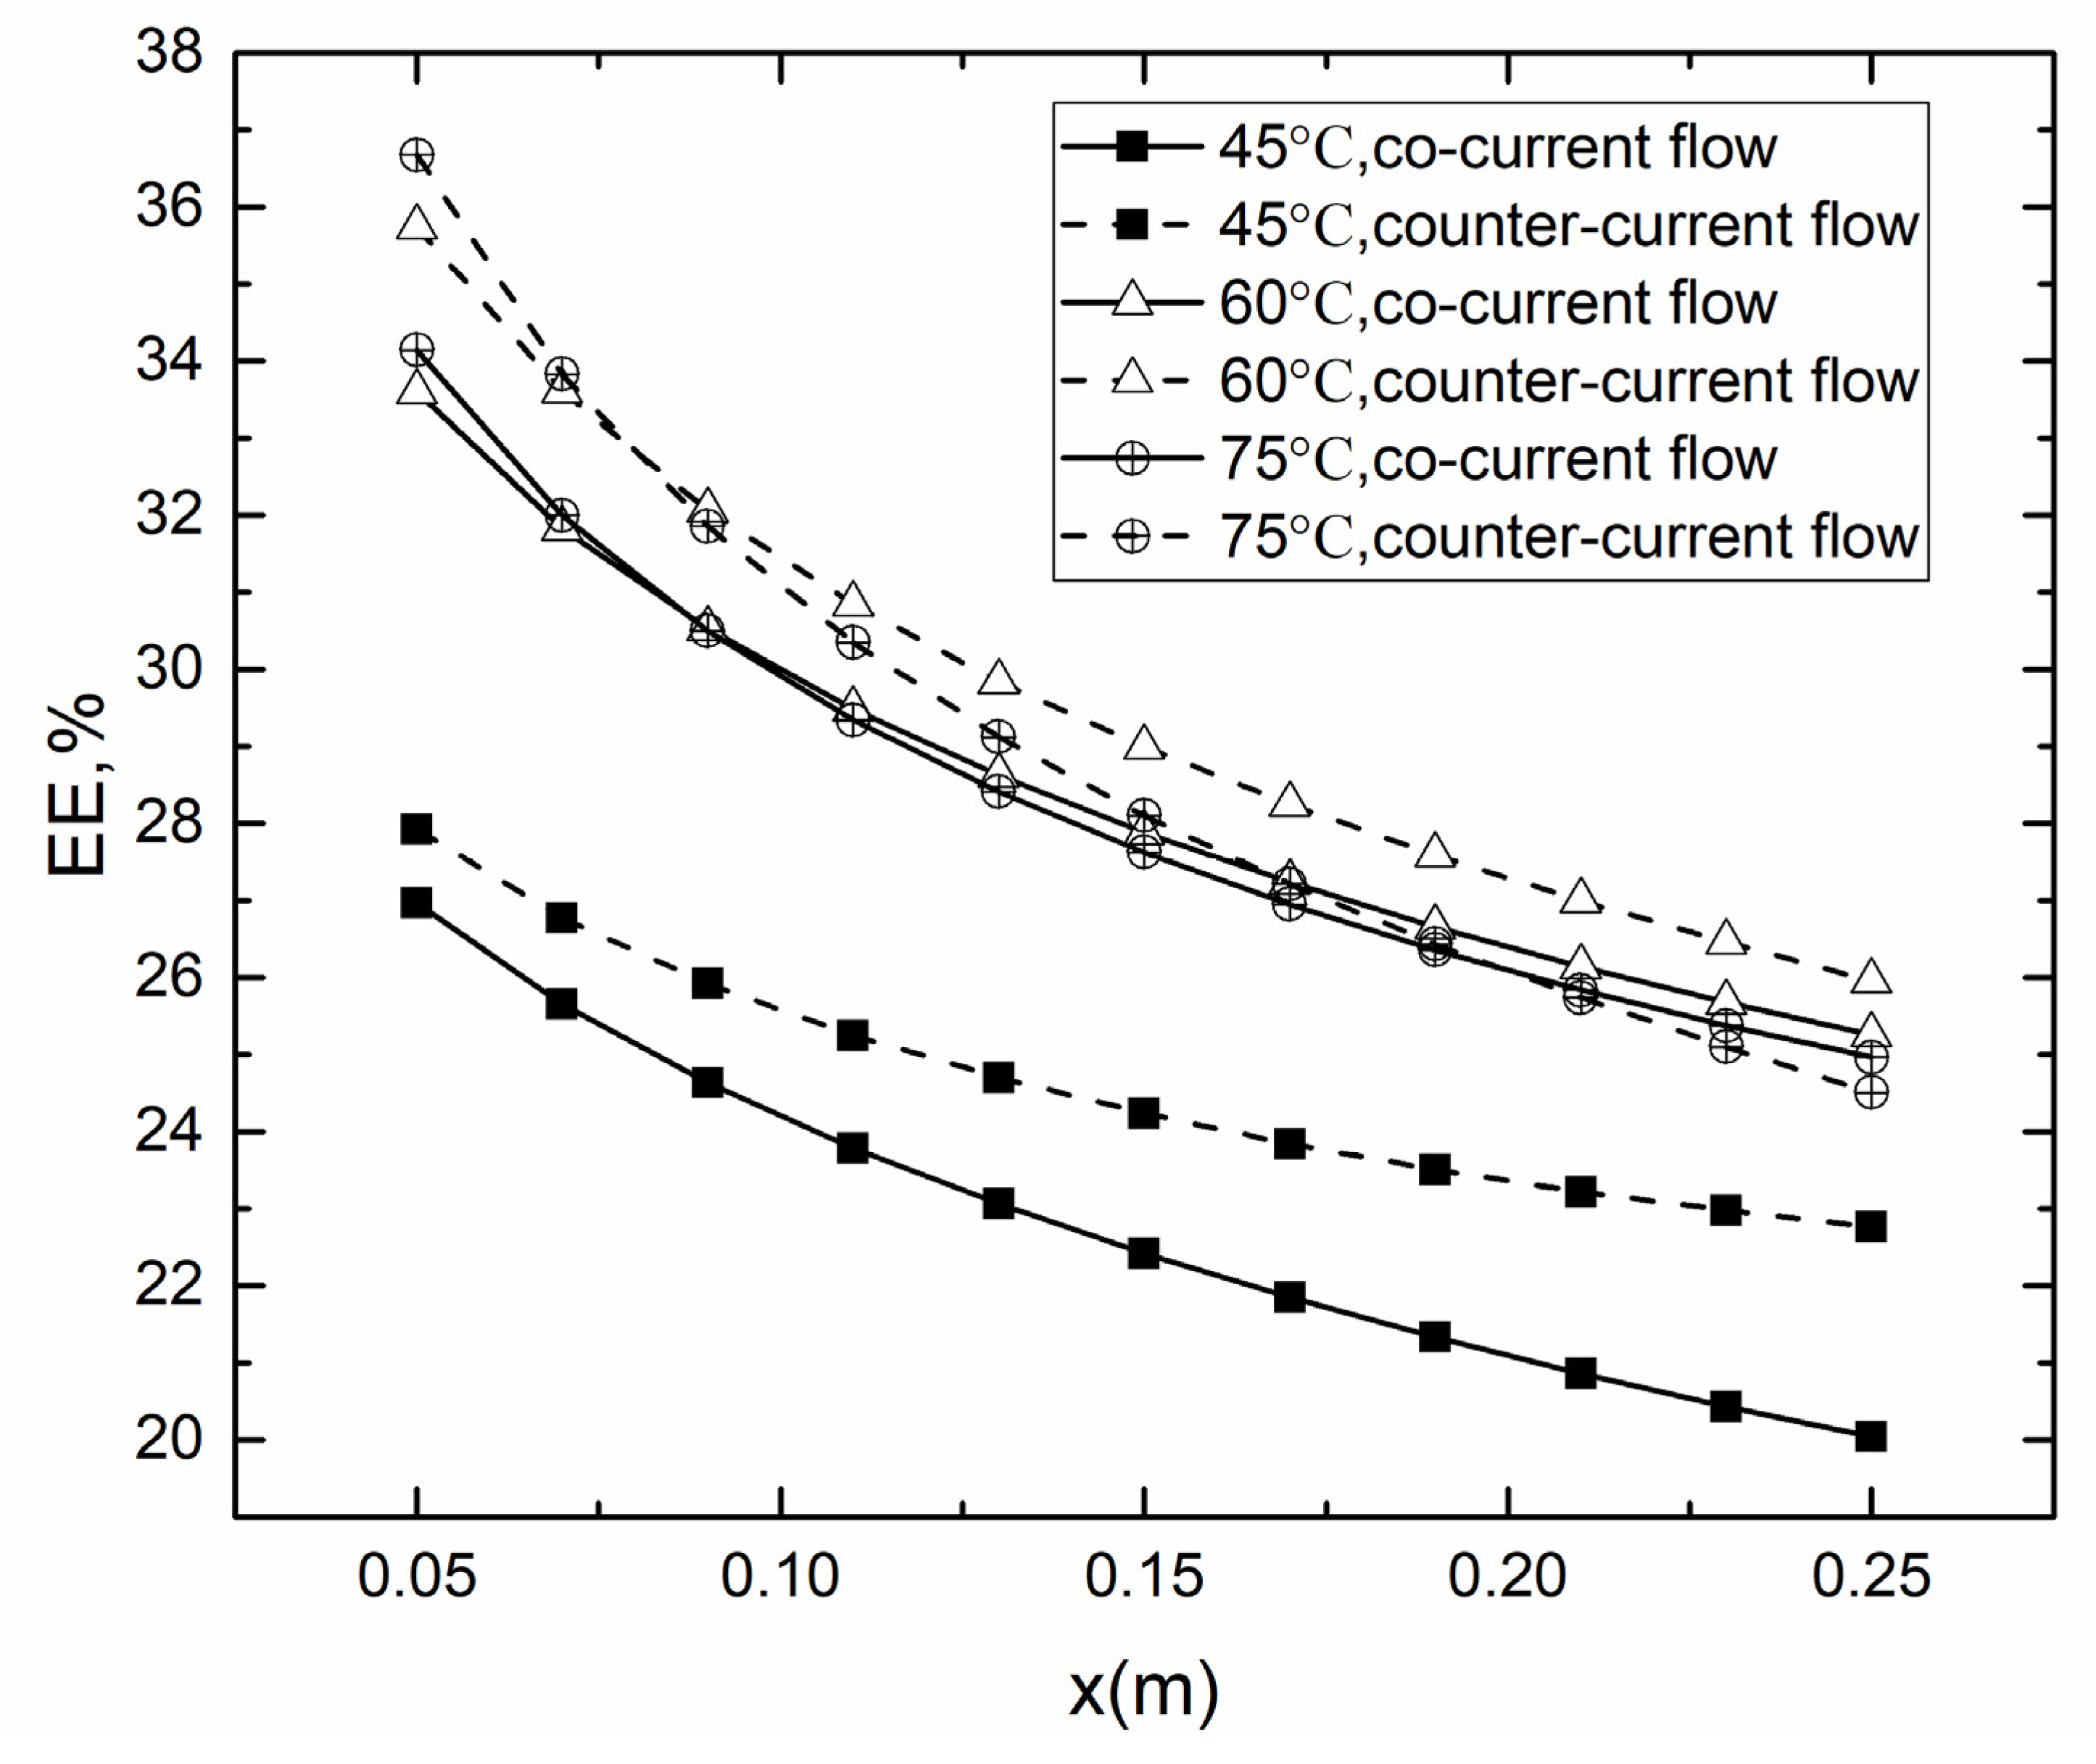
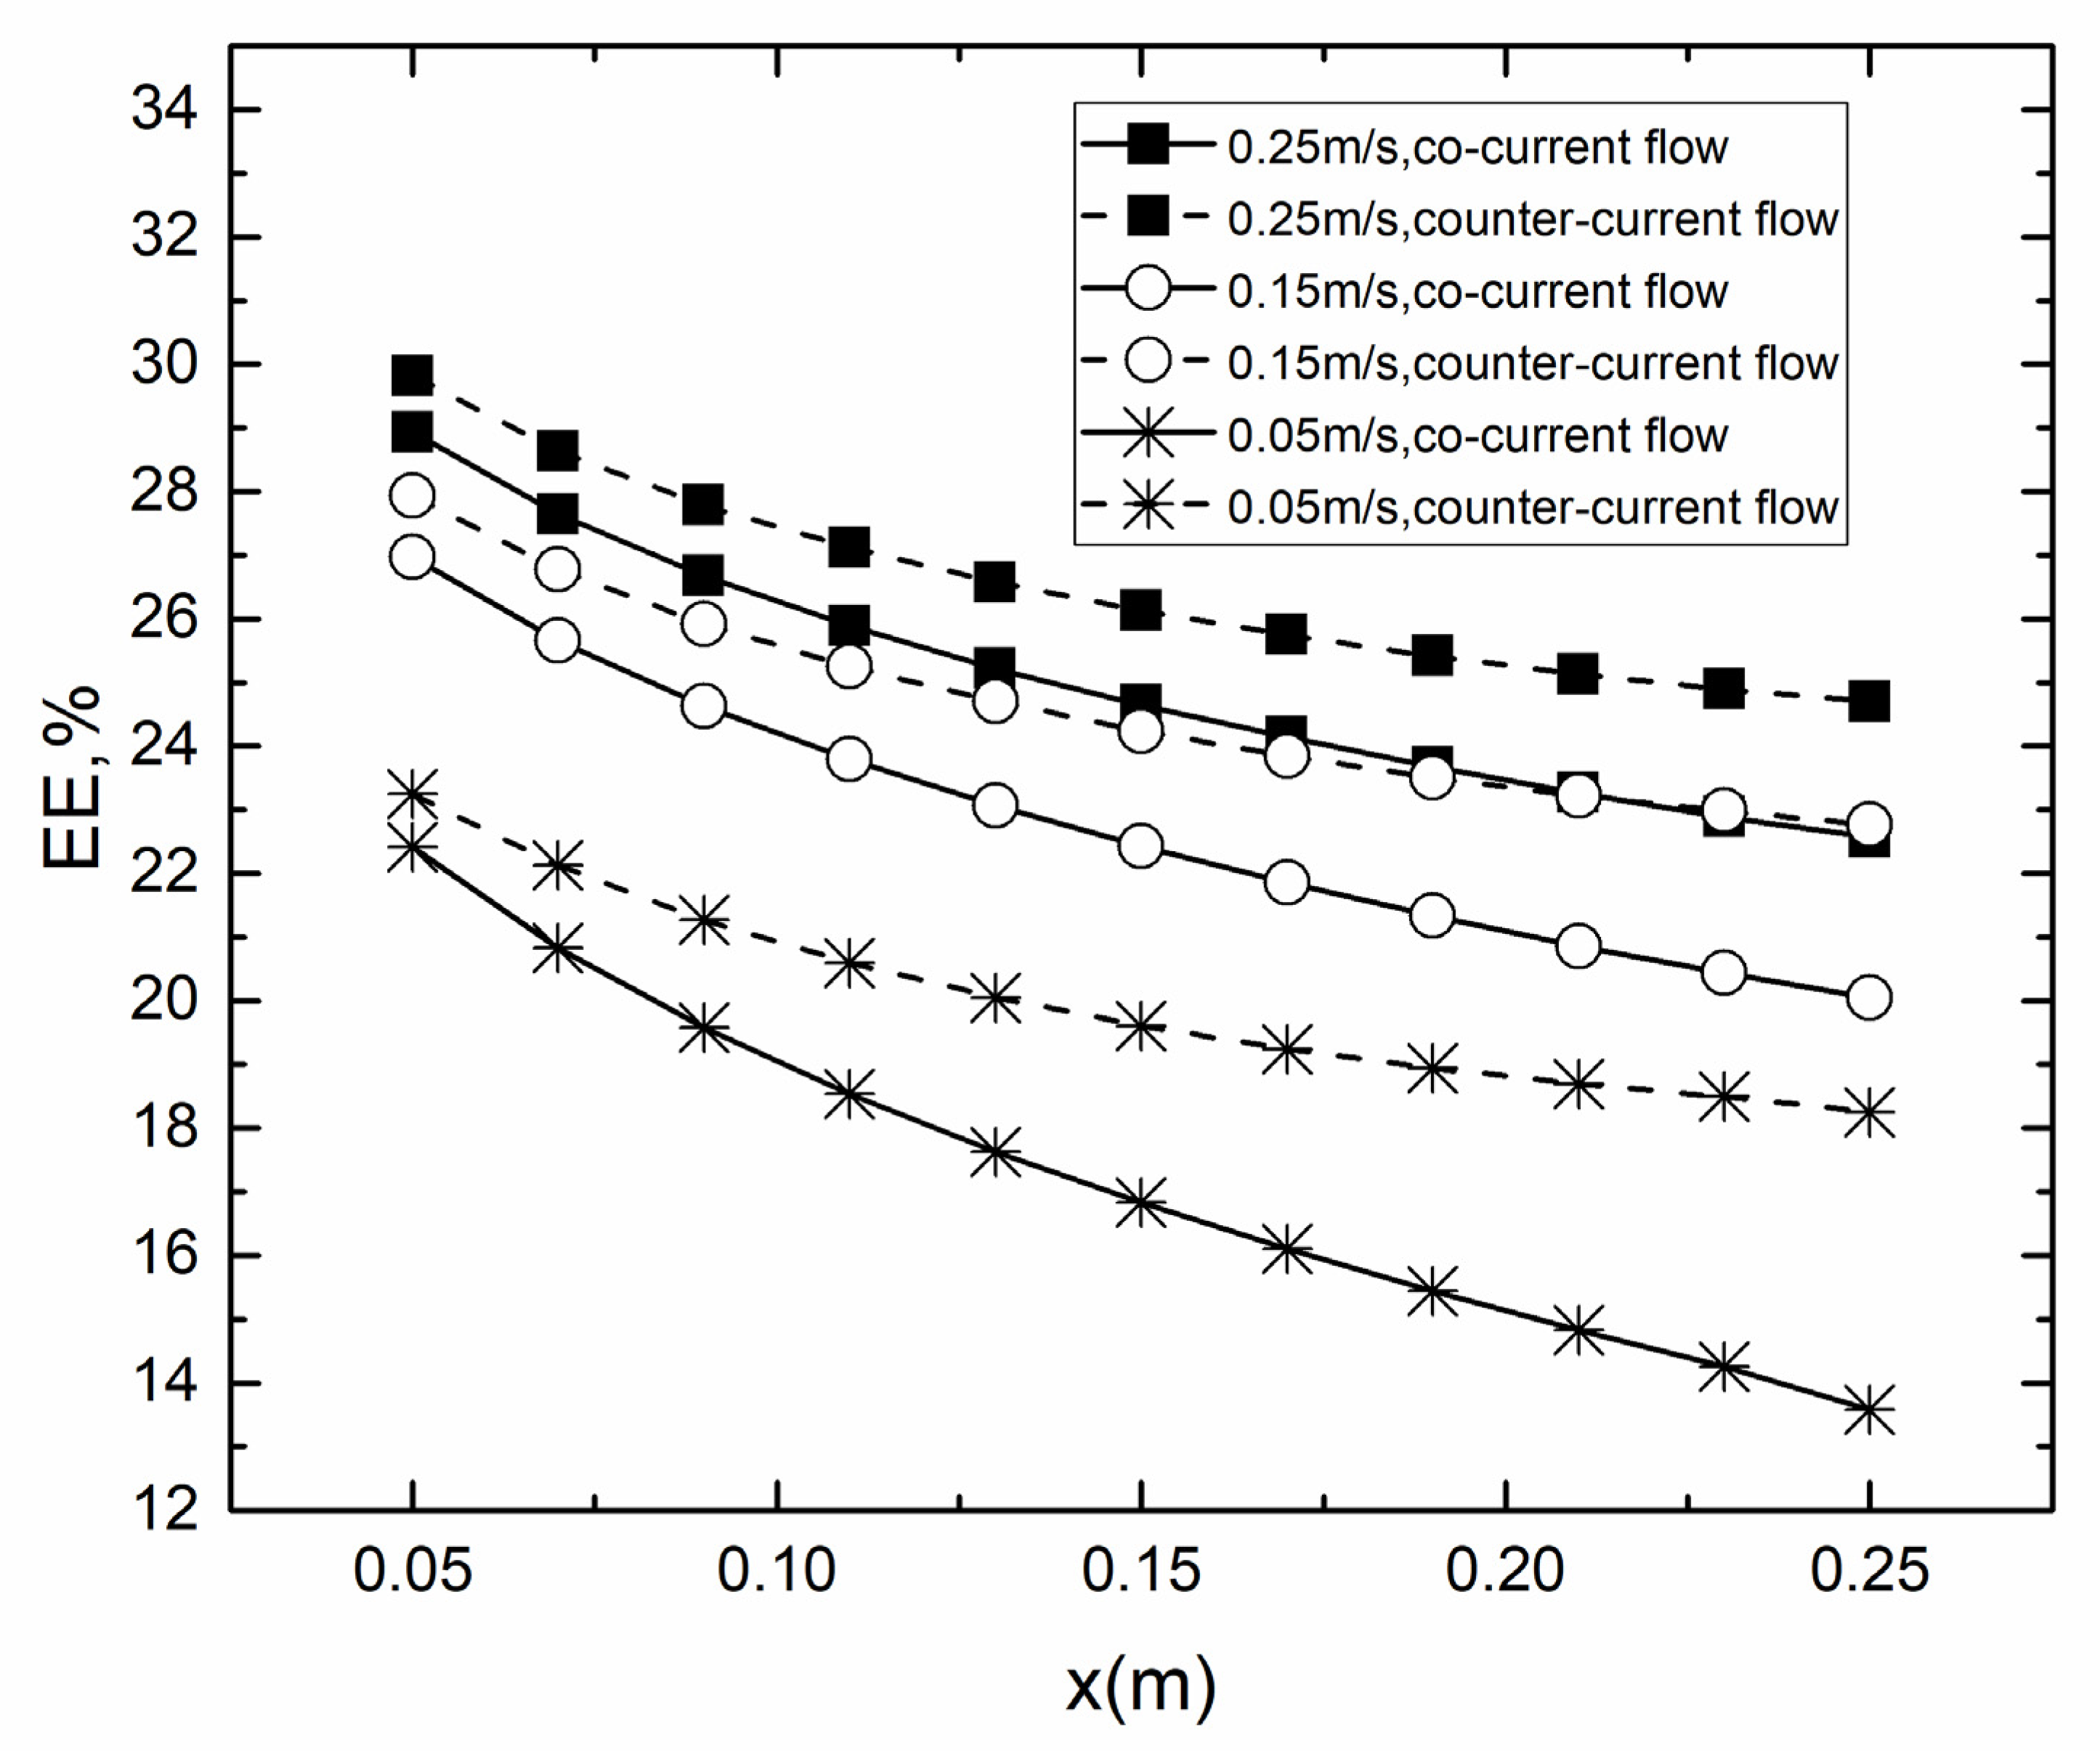
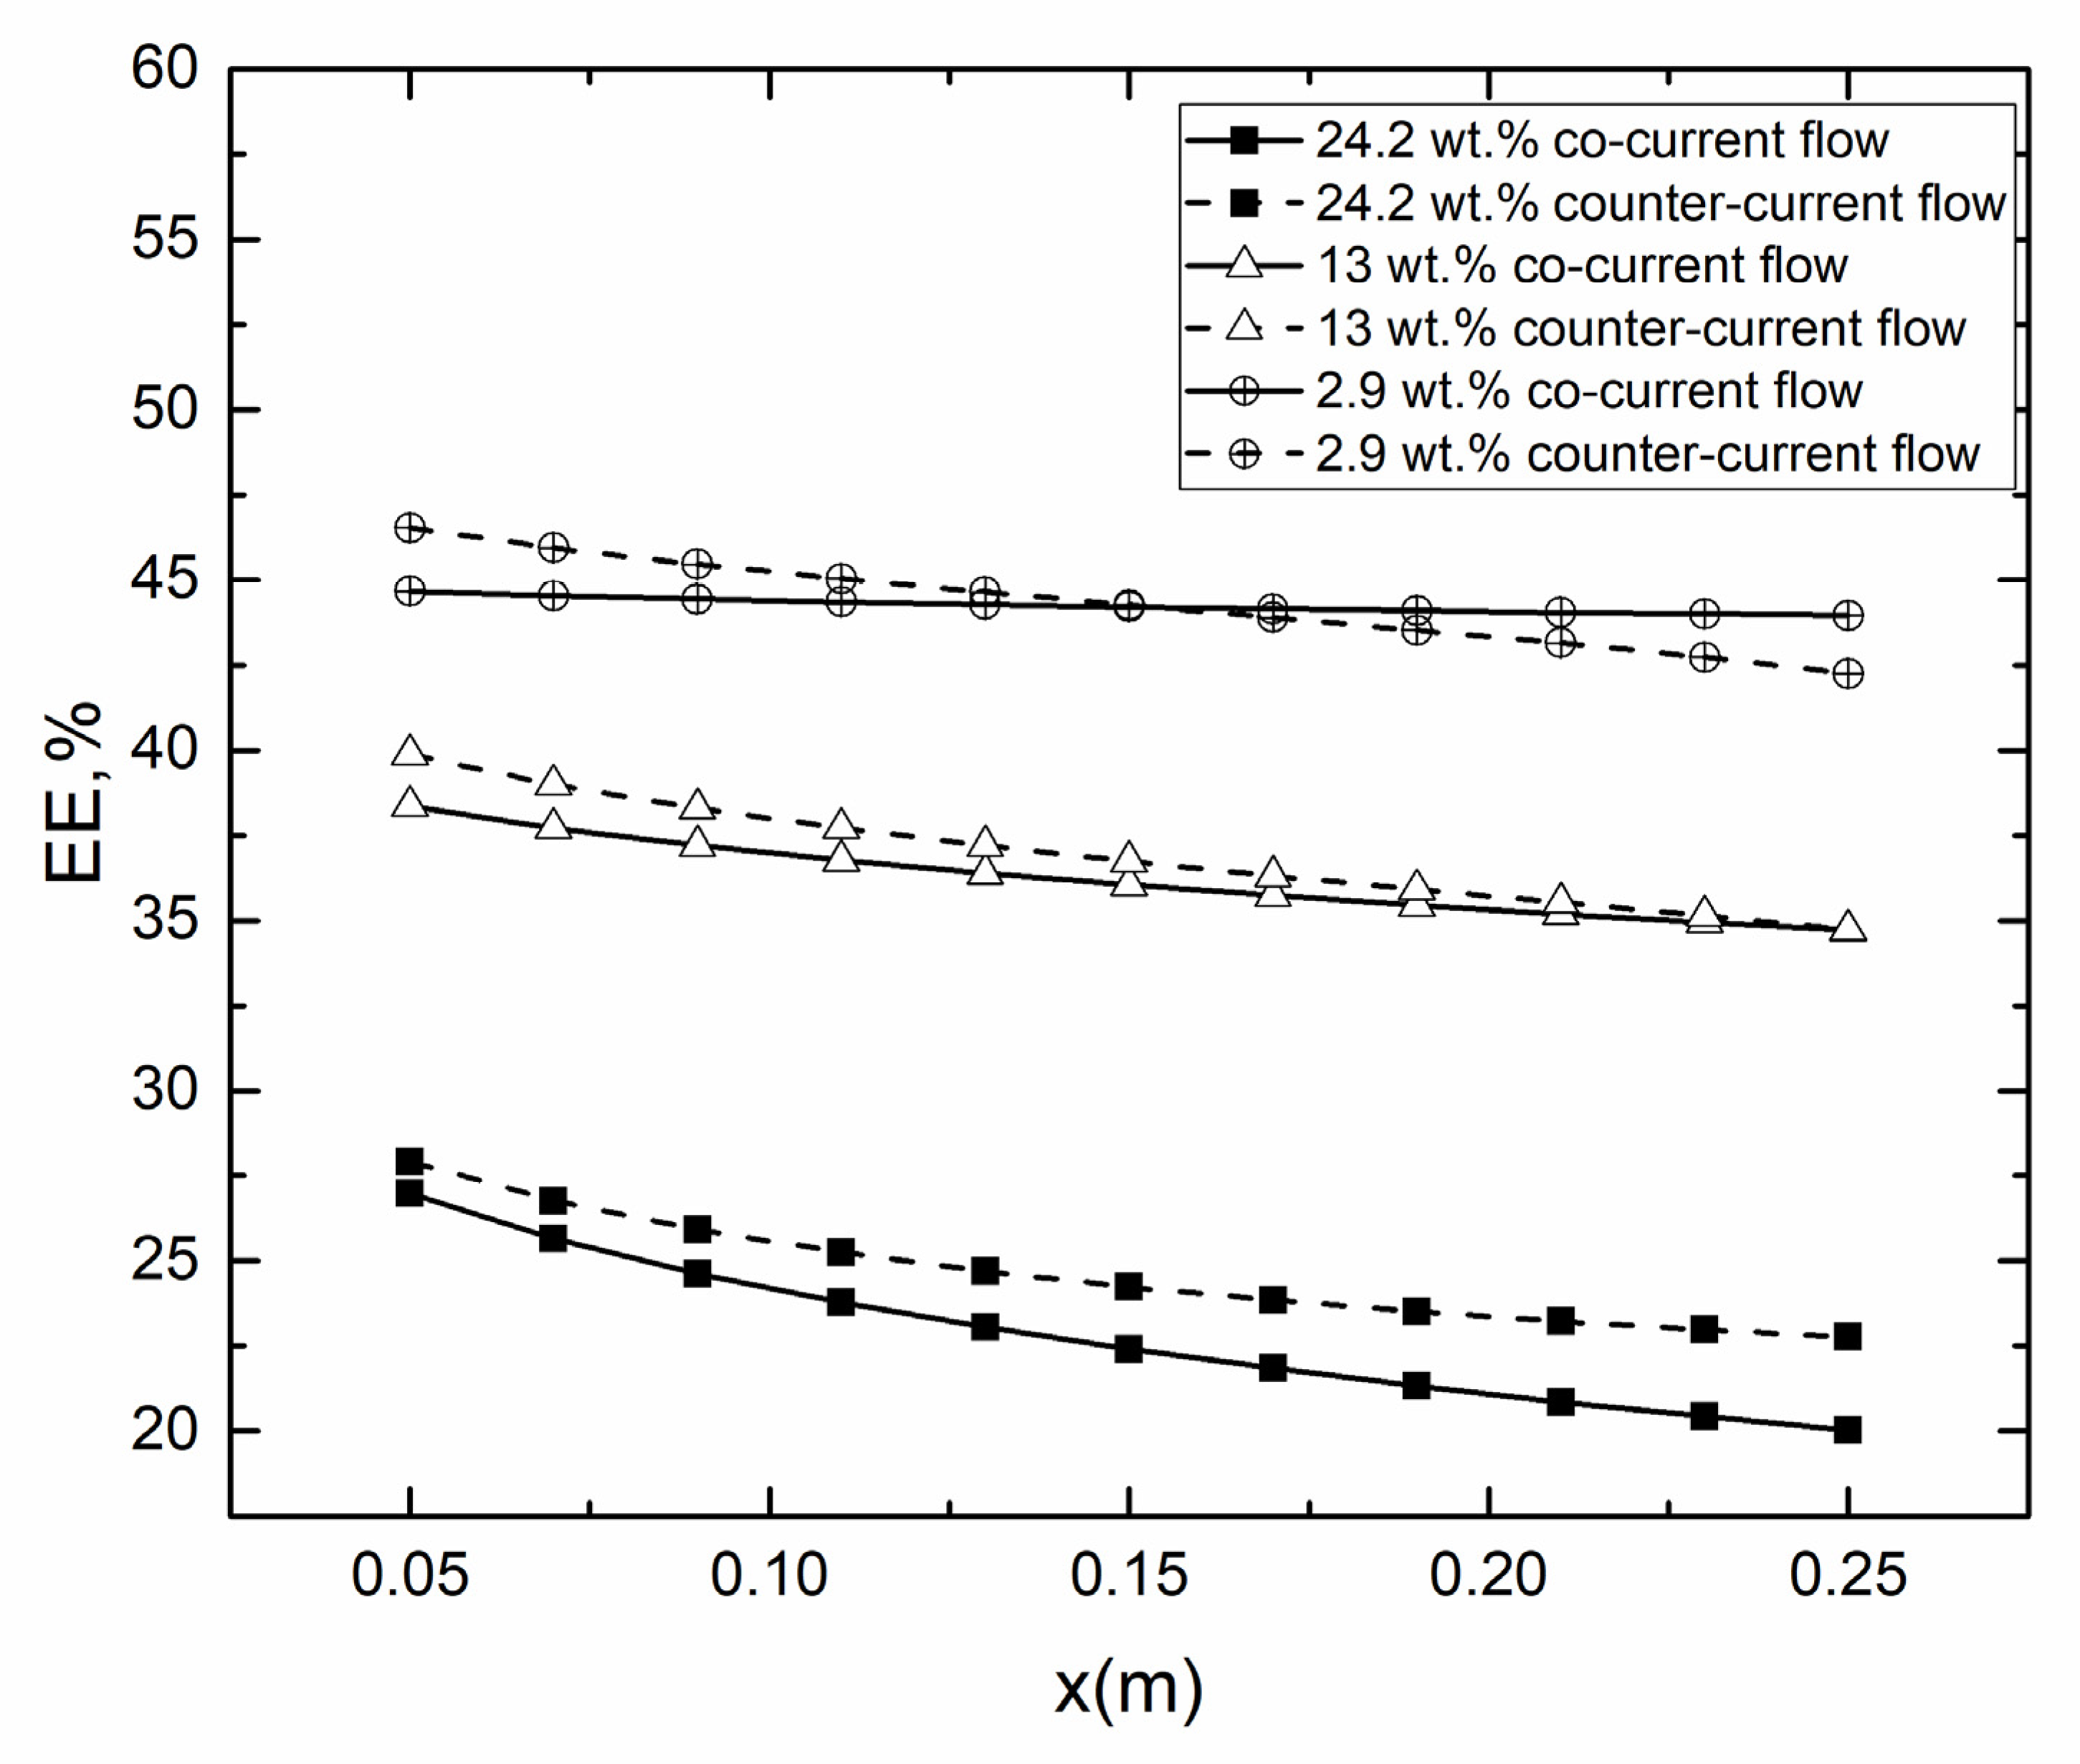
4.2.2. Evaporation Efficiency for Co- and Counter-Current Operations

As shown in Figure 9, the EE was increased with the increase of Tf in all cases. It could be concluded that temperature difference was the main influencing factor for EE. Besides, there was a decrease of EE over the membrane surface along the x-axis due to the decrease of temperature. It was essential to control the length of membrane module to avoid the effect. Comparing the co- and counter-current operations in different Tf, it was found that the counter-current operation performed better than co-current at upstream at all the studied temperatures. The priority of counter- to co-current operation at 45 °C was more evident than at 75 °C. This phenomenon could be attributed to several factors. In general, the temperature difference between feed and permeate membrane surface in counter-current operation was larger than co-current operation. The higher temperature difference lead to higher EE. According to Lou’s study [22], the concentration polarization of counter-current was less than that of co-current operation in the upstream and larger than that of co-current operation in the downstream.
As shown in Figure 10, the decrease in EE with x-axis occurred in all cases due to the reduced temperature difference across the membrane and increased cf. The EE for counter-current operation performed better than that for co-current operation in the same vf, vp. With the vf, vp increasing, the EE of both co- and counter-current increased. The difference of EE between counter- and co-current was decreasing along x-axis. When vf and vp were both 0.05 m/s, the EE for counter-current operation decreased slowly along the x-axis compared to co-current operation. This was due to the fact that the temperature different between the feed and permeate surface along x-axis was almost constant for counter-current operation and gradually decreased for co-current operation.
As shown in Figure 11, it was found that the EE was generally low in high-salt solution due to the high concentration resulting in small permeate flux. It was worth noting that the EE for co-current operation started to higher than counter-current when the concentration was 2.9 wt.% at x = 0.15, which suggested that, in low concentrations, the impact of concentration polarization on EE was larger than temperature difference.

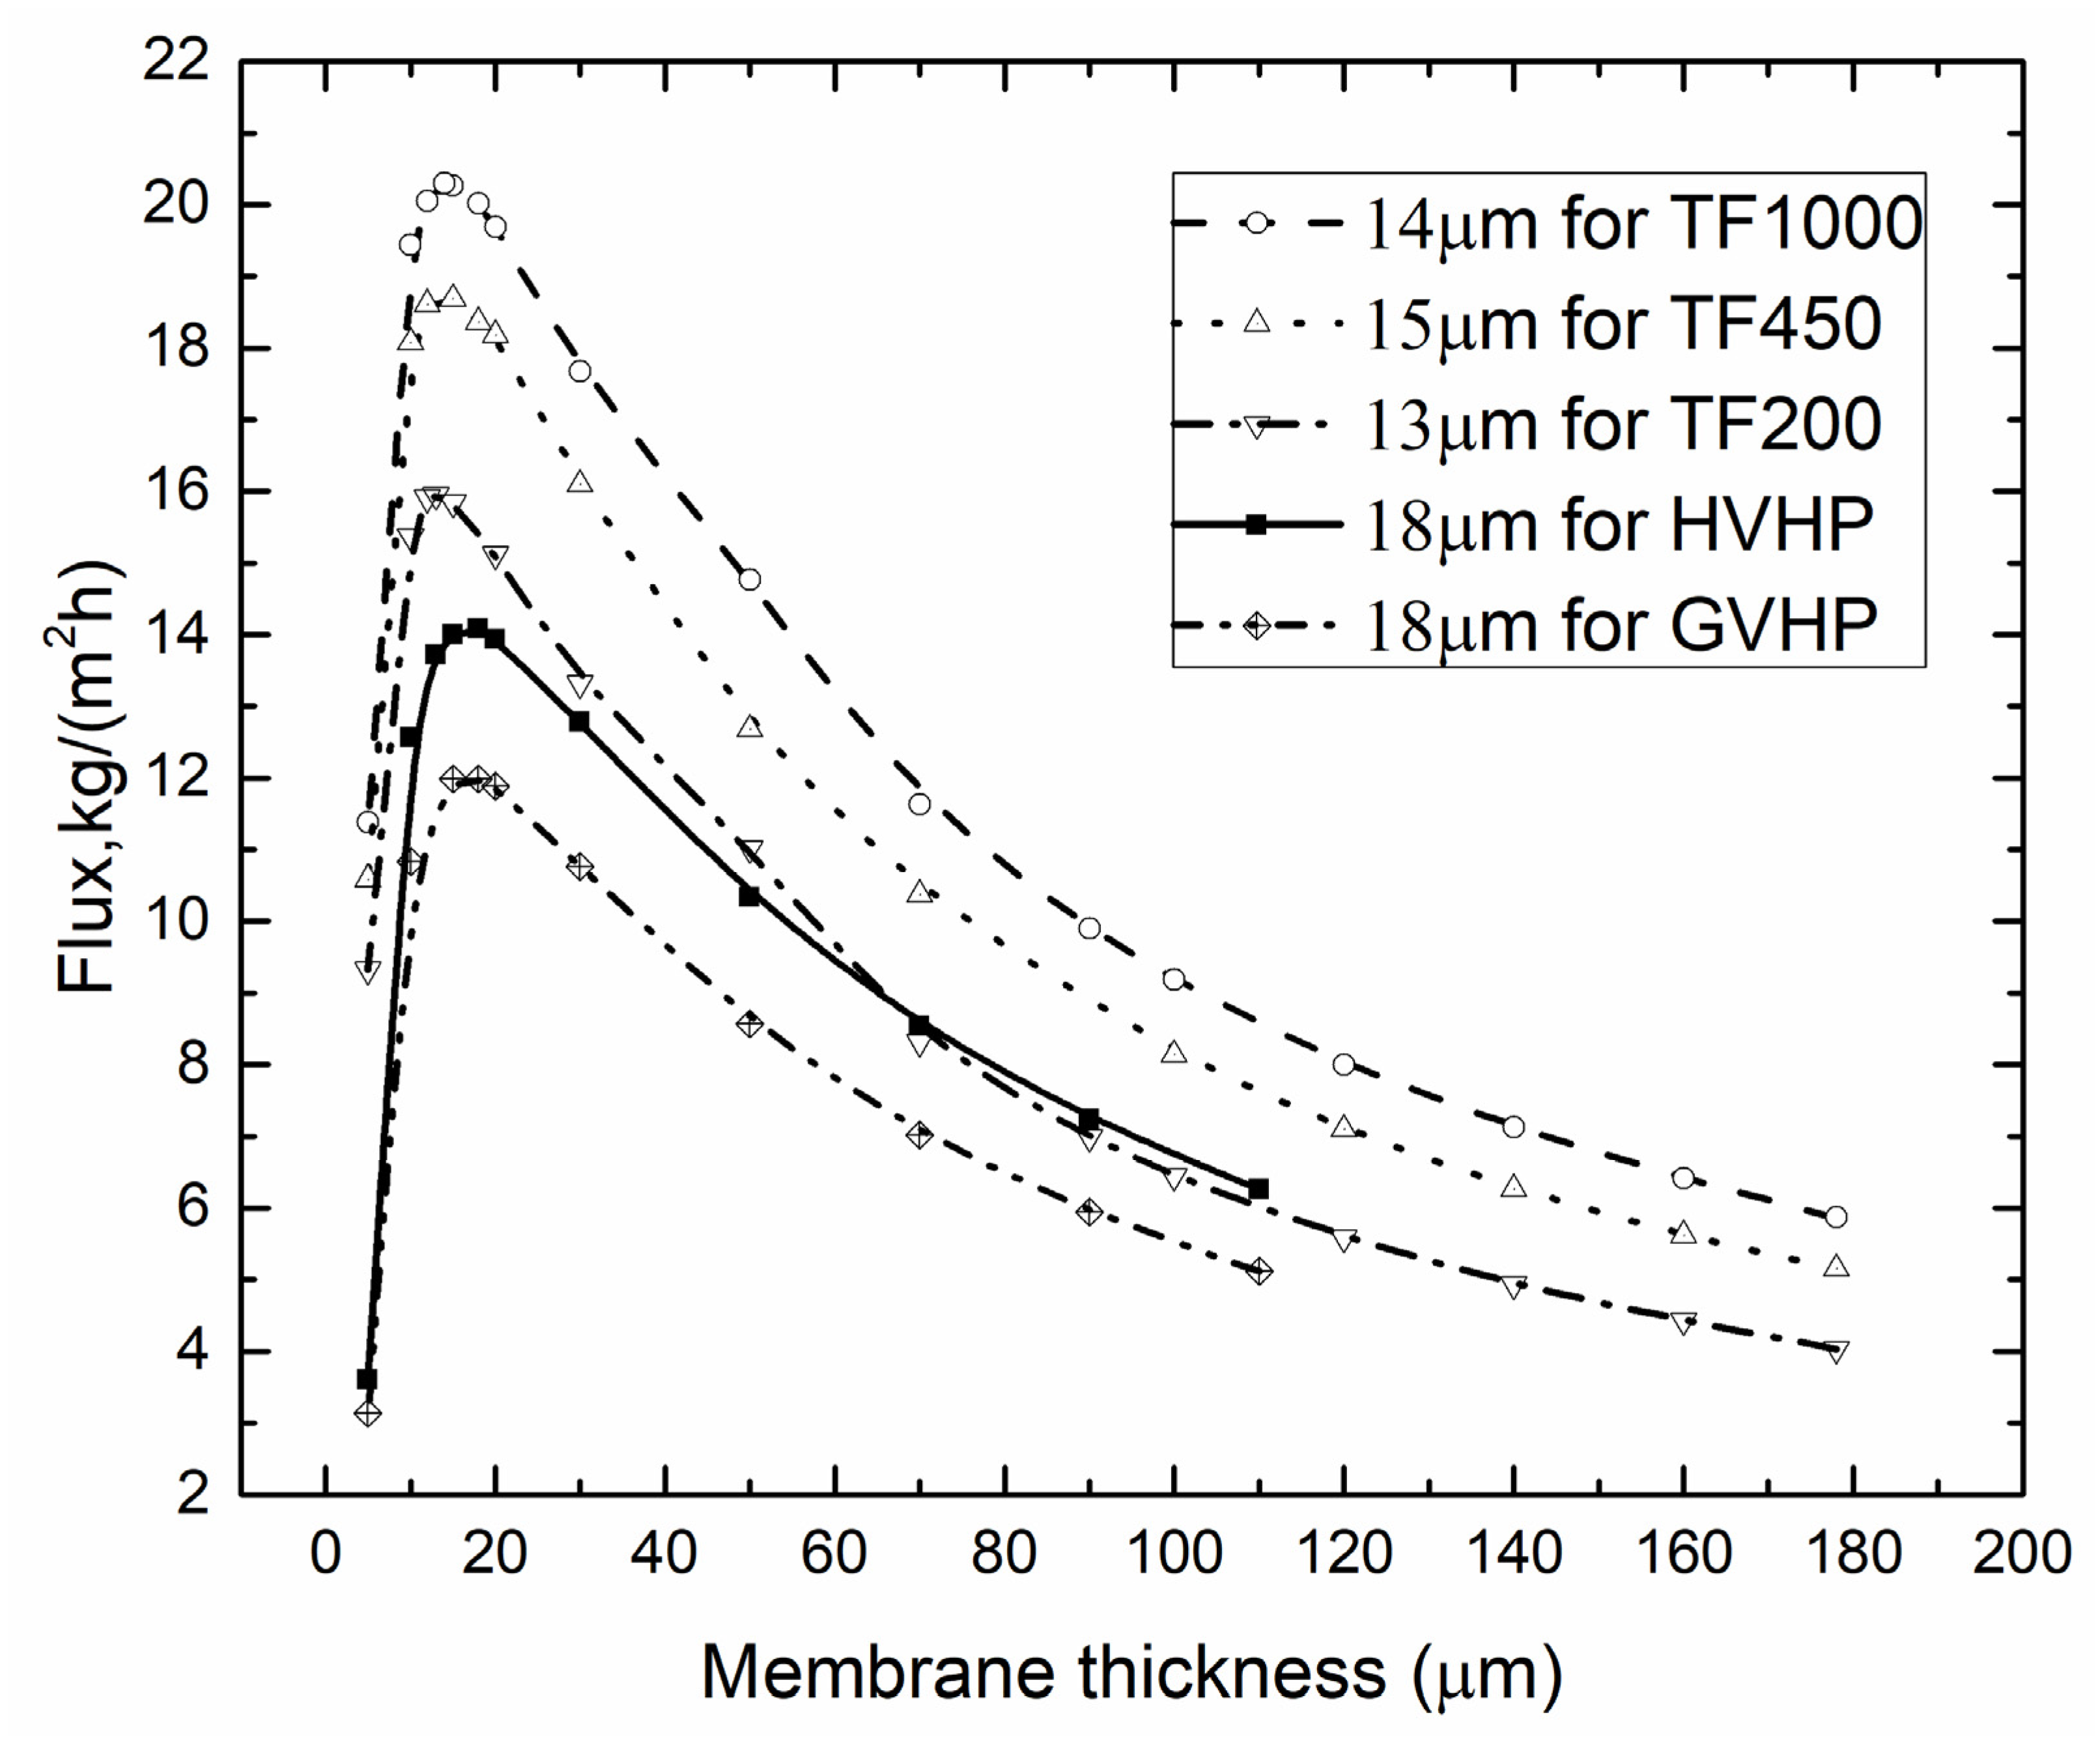
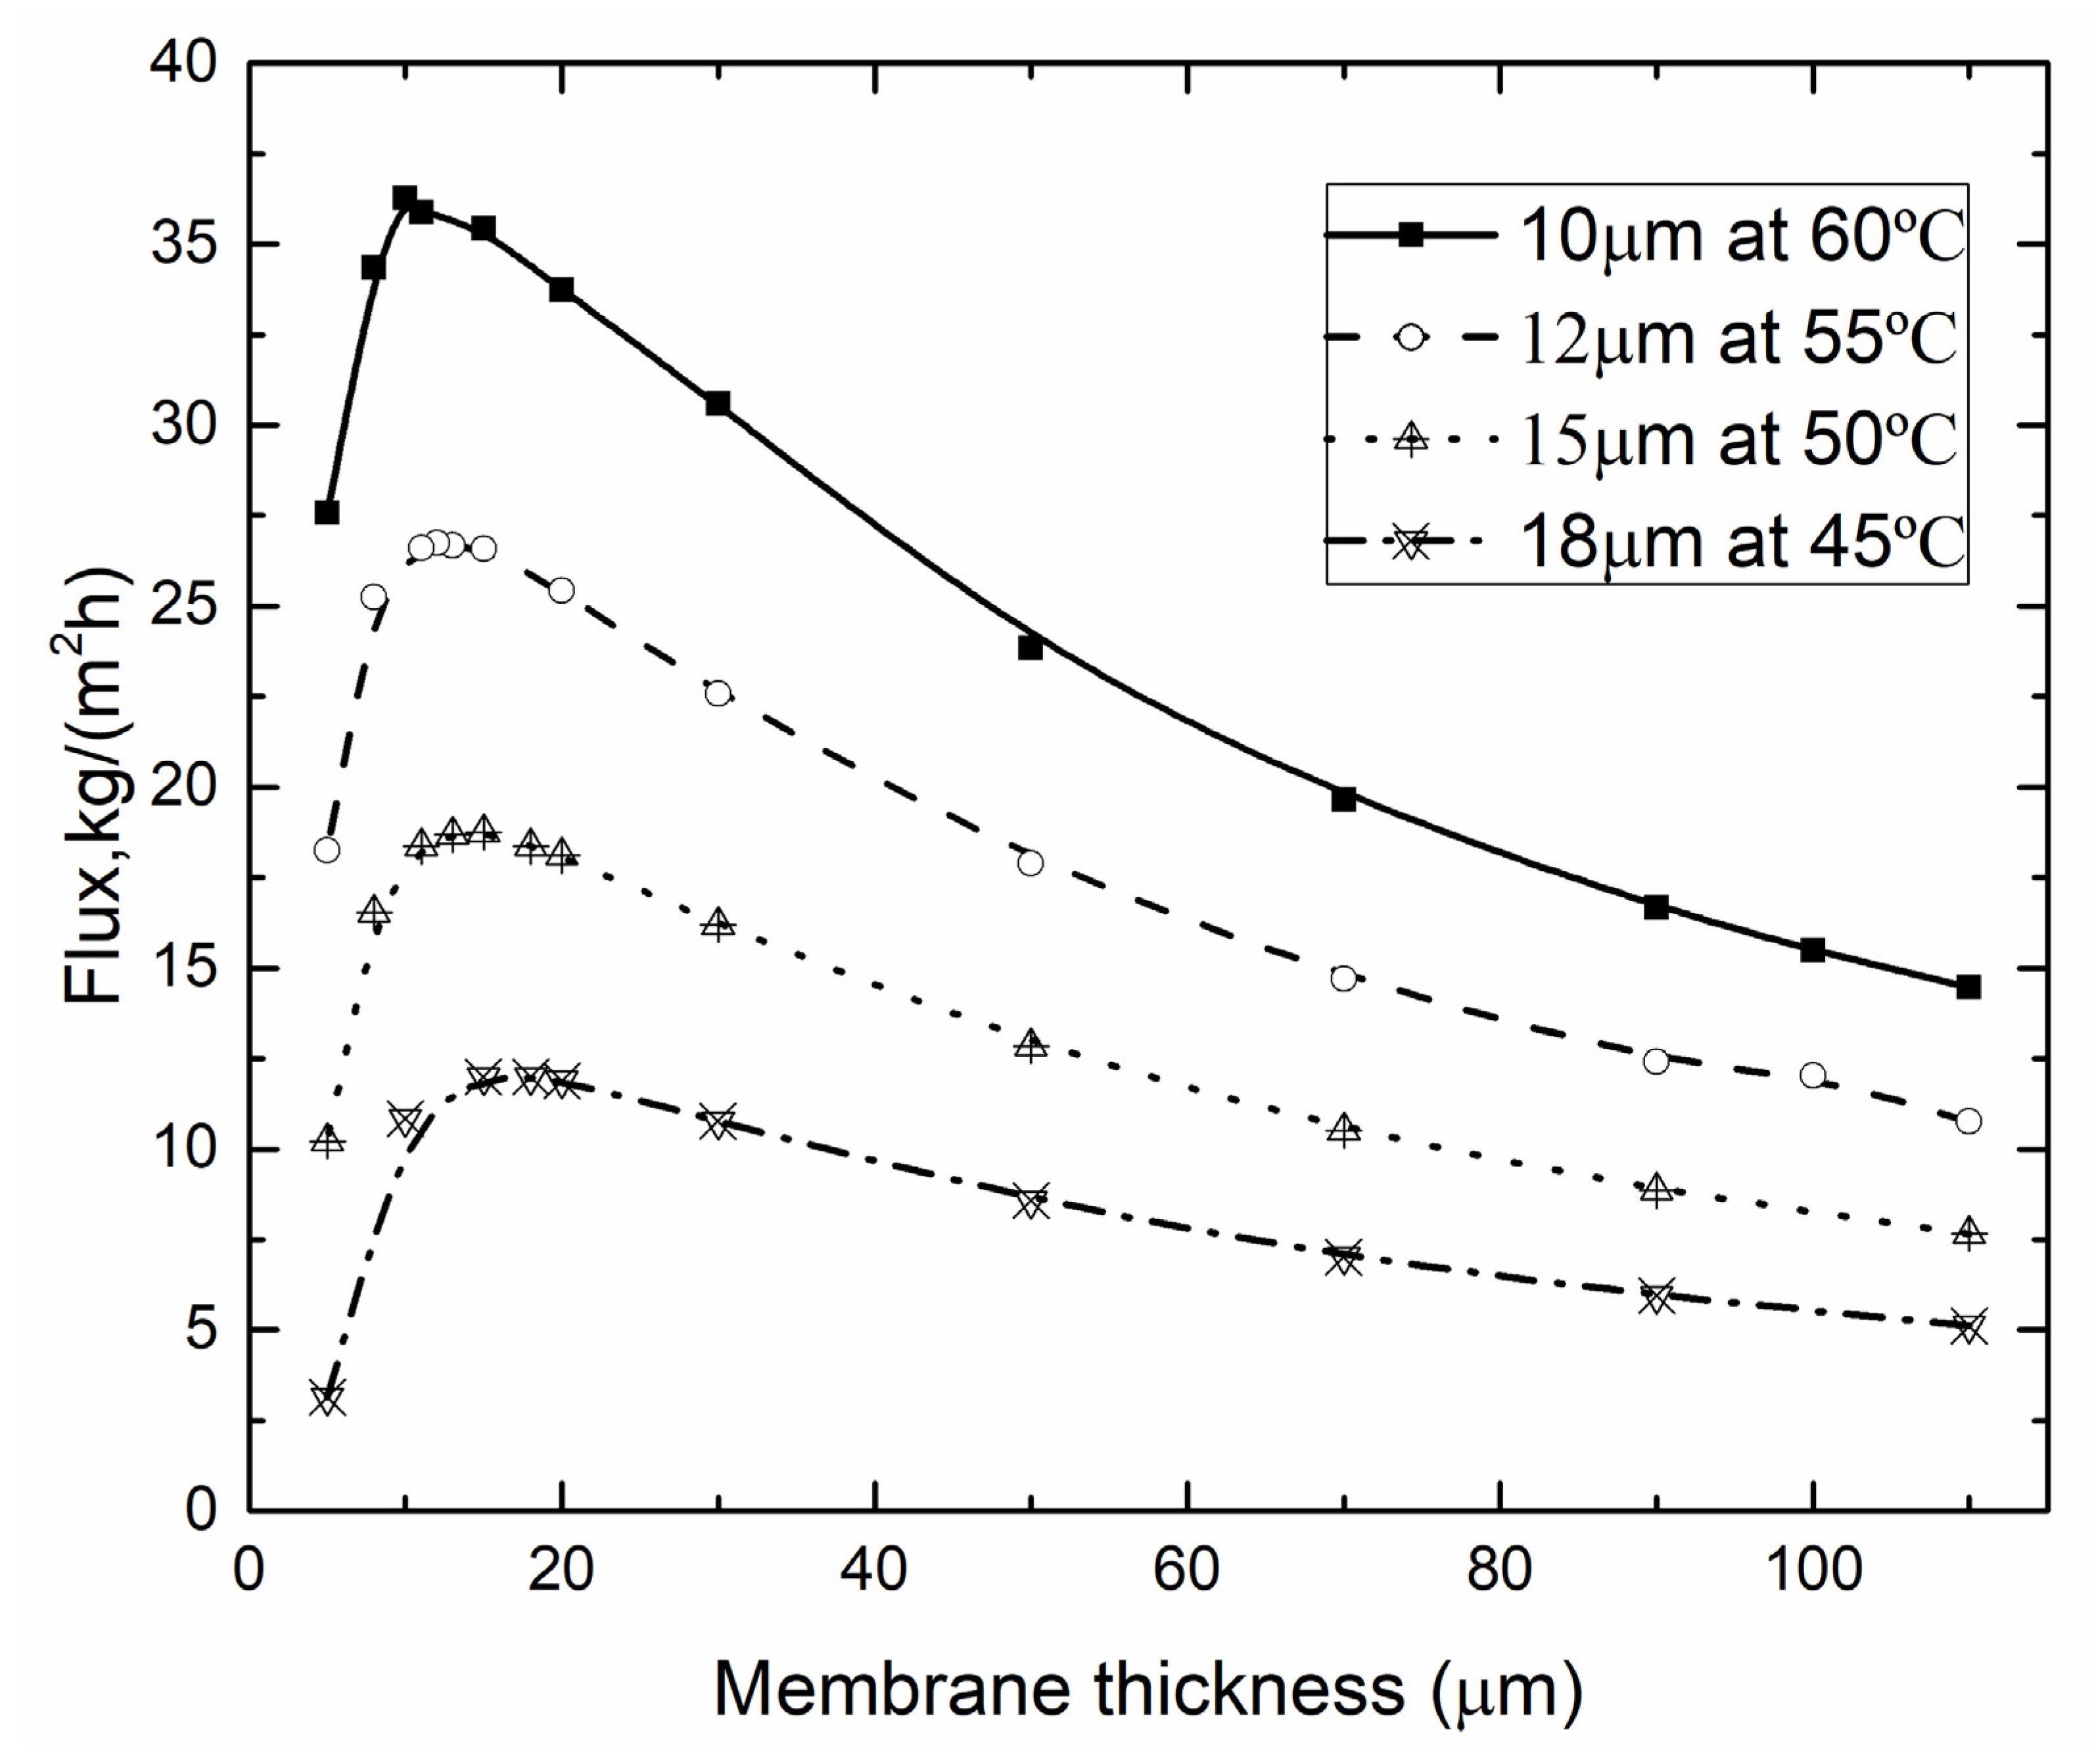
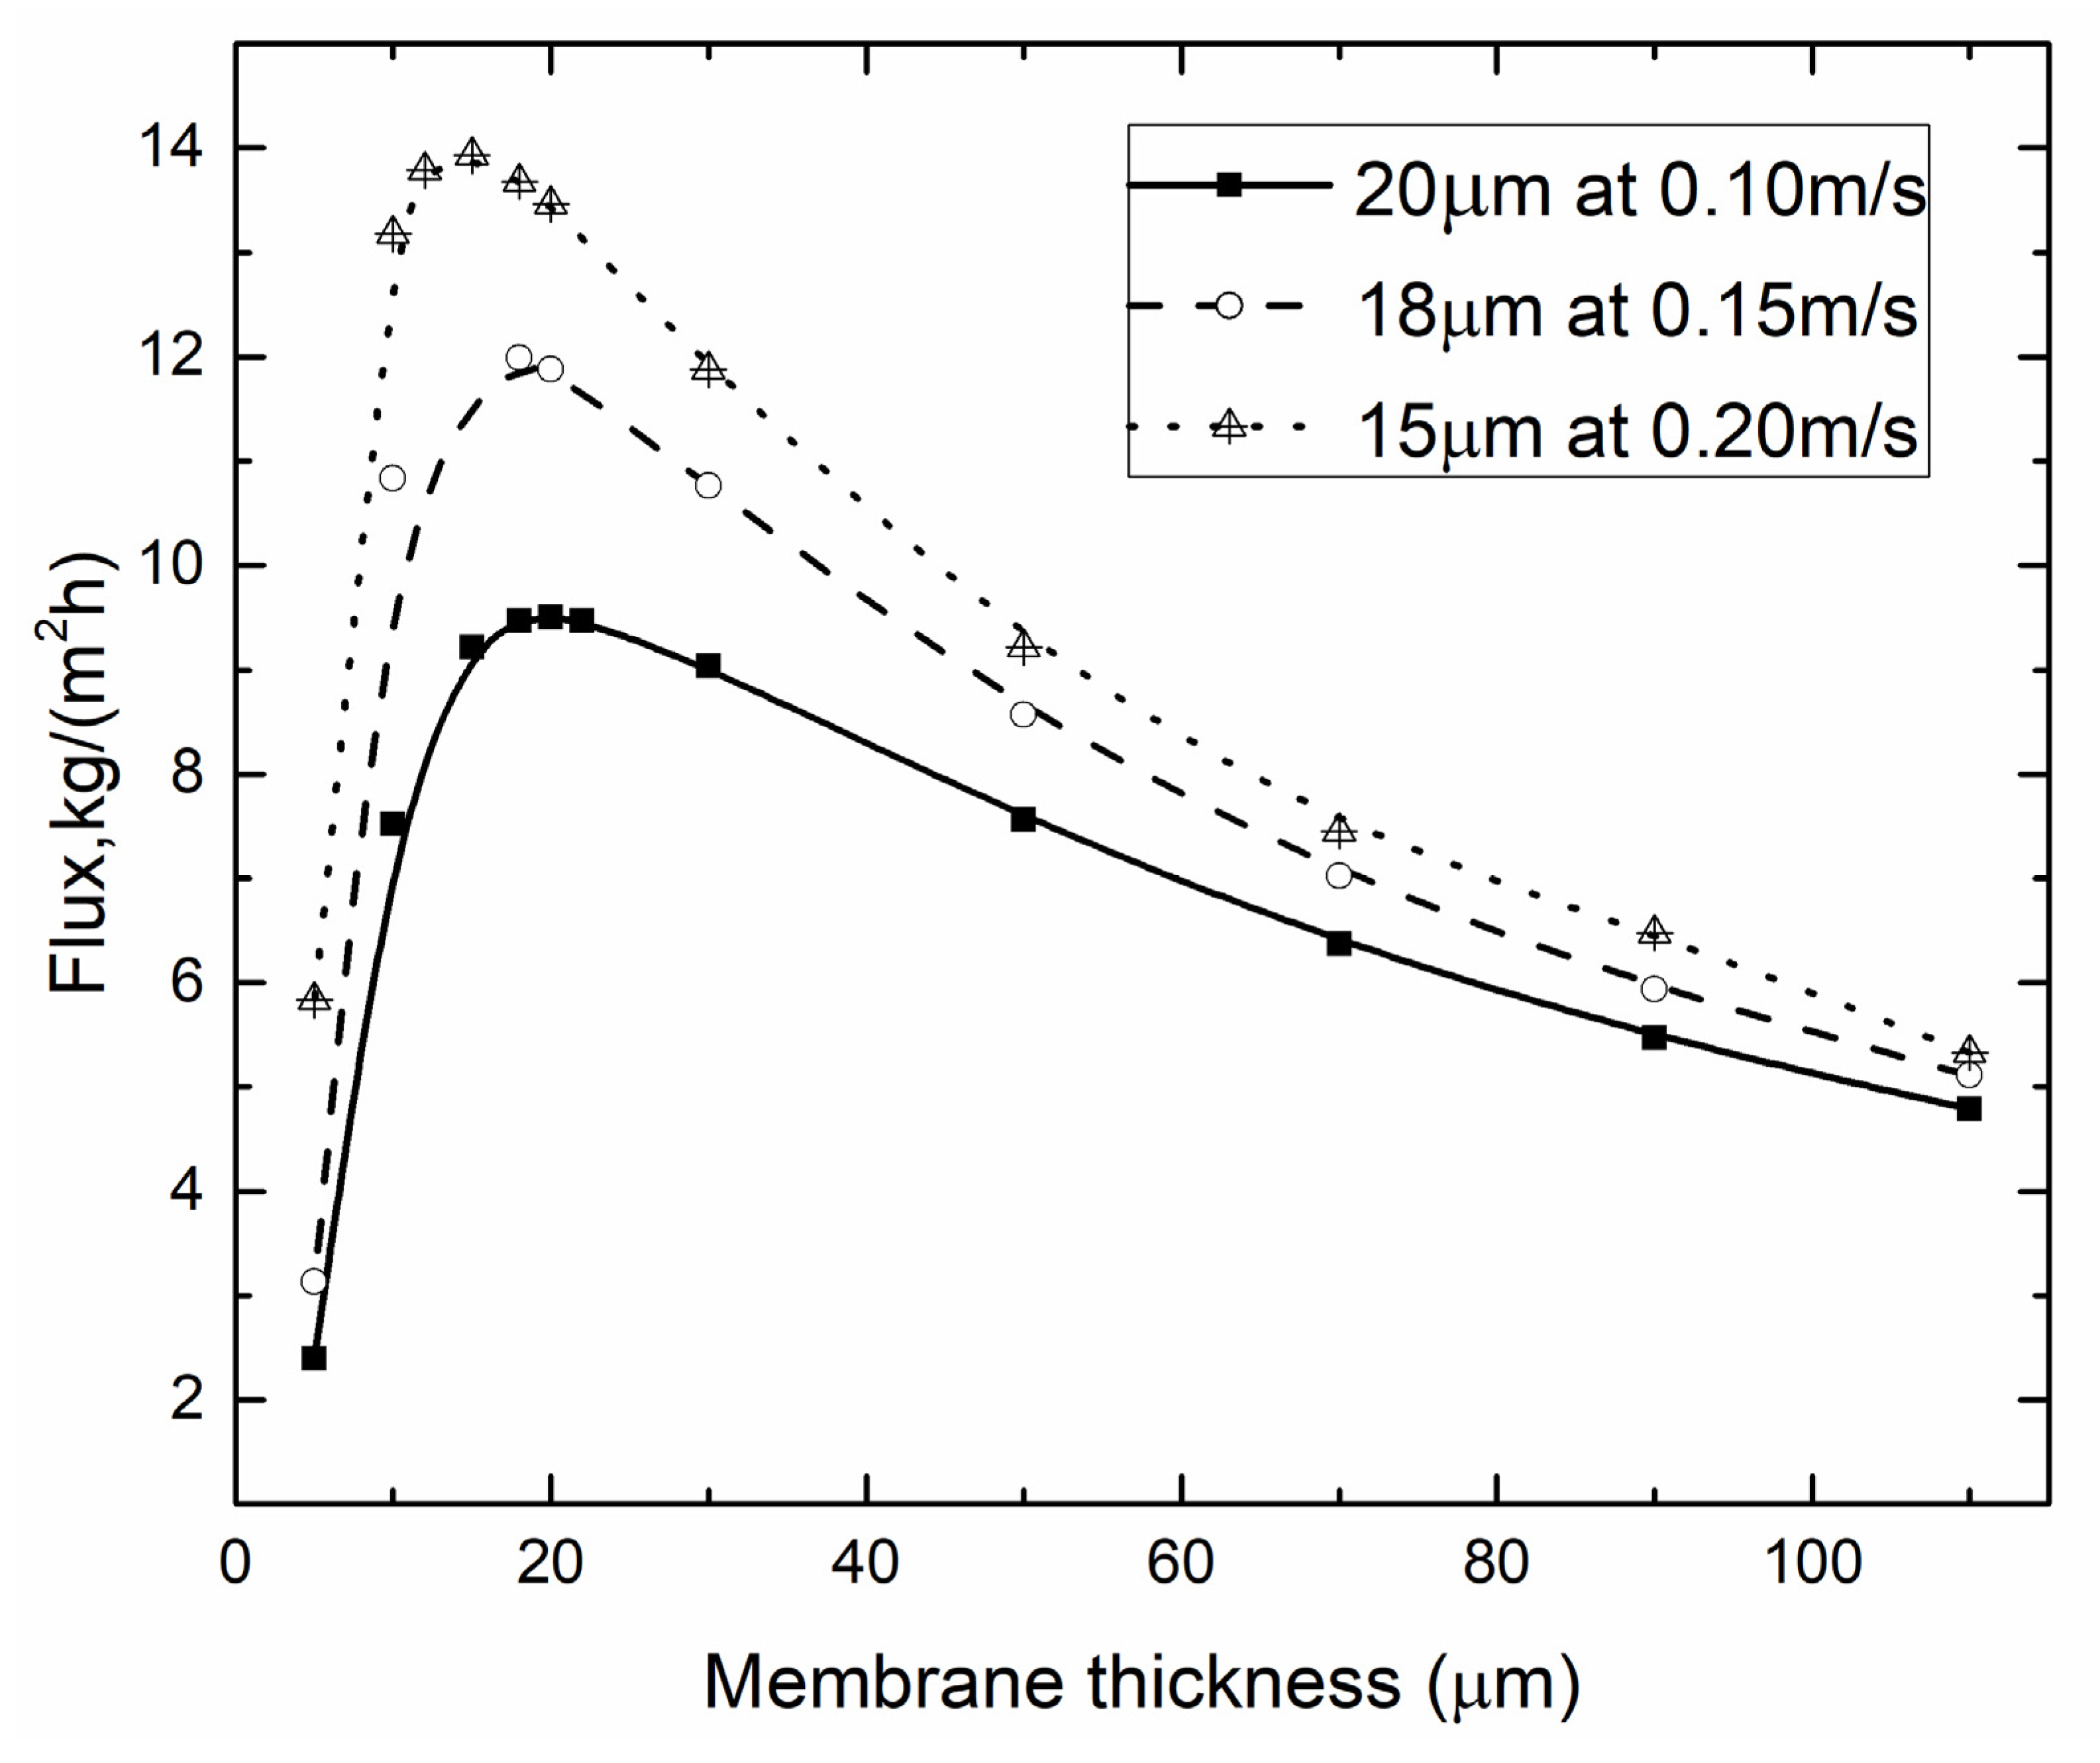
4.3. Optimal Membrane Thickness

Theoretically, two competitive effects are associated with membrane thickness. The thin membrane gives low mass transfer resistance and thus provide high transmembrane water flux at fixed operation condition. However, as the membrane thickness decreases, conductive heat loss through the membrane increases, leading to a low temperature gradient across the membrane and resulting low flux. Therefore, there must be an optimal thickness balancing the mass transfer resistance and conductive heat losses, and this thickness depends on operating conditions and other membrane characteristics.
Membrane thickness is an important property of membrane module but seldom studied [35,44,45,46]. Martinez [46] established a resistance-in-series model which was quite suitable to express the change of membrane thickness due to the import of transport resistance. Swaminathan [44] coupled the membrane thickness with the module size together and got the cost-optimal membrane thickness. Wu figured out the optimal membrane thickness both by analytical model and by experiment. The results indicated that the optimal thickness was much thicker than that could be made in experiment. Eykens [35] made a systematic research on membrane thickness. The influence of membrane thickness on DCMD at various salinities was investigated in detail. However, there were no studies involving in comparing of different membranes on membrane thickness and permeate flux.
The current study investigated the influence of membrane pore size, conductivity, tortuosity and porosity through comparing the different membrane materials, i.e., TF450 and HVHP, had the same pore size while the membrane conductivity, tortuosity and porosity were different, GVHP and HVHP had the same membrane conductivity, tortuosity and porosity while the pore size was different.
Figure 12 showed the flux as function of membrane thickness for different membrane materials. There existed a threshold of permeate flux. By decreasing the membrane thickness, the permeate flux could be improved until reached this threshold. In Wu’s work [45], they found that the flux decreases with the decrease of membrane thickness through experiment, which was well reproduced in our simulations. The optimal membrane thickness and the largest permeate flux varied with different membrane materials. When the membrane thickness was kept as 15 μm, the permeate flux increased with the increasing of pore size for TF1000, TF450 and TF200, that was 20.30, 18.68, and 15.948 kg/(m2∙h), respectively. It indicated that the pore size had great impact on the permeate flux. The effect of thermal conductivity and porosity could be analyzed through TF450 and HVHP which had the same pore size, corresponding to permeate flux of 20.30 kg/(m2∙h) and 13.8 kg/(m2∙h). The thermal conductivity was 0.031 and 0.041 W∙m−1∙K−1 and the porosity was 0.8 and 0.75, respectively. Membrane material which had lower thermal conductivity and larger porosity showed higher permeate flux and thicker optimal membrane thickness. Lower thermal conductivity was helpful to reduce the heat loss, and larger porosity was beneficial to improving permeate flux. However, the optimal membrane thickness at 24.2 wt% was quite different with literature [30] (18 μm in the current work for GVHP and 49 μm in the literature for PP). The reason is that the tortuosity in our study is larger—the larger tortuosity means a thinner optimal membrane thickness. The membrane thermal conductivity is lower, the lower membrane conductivity also corresponds to a thinner optimal membrane thickness.

4.3.1. Optimal Membrane Thickness for Different Tf

Figure 13 demonstrated the impact of Tf on the permeate flux and the membrane thickness for GVHP. Increase of permeate flux was observed when Tf increased from 45 to 60 °C. It was clearly seen that the higher Tf corresponded to the thinner membrane thickness. When Tf was 45 °C, the optimal membrane thickness was 18 μm. However, when Tf reached 60 °C, the optimal membrane thickness turned to 10 μm.

4.3.2. Optimal Membrane Thickness for Different vf, vp

As shown in Figure 14, the permeate flux was improved with the increasing of vf, vp. The optimal membrane thickness differed with different vf, vp. When vf, vp was 0.1 m/s, the optimal membrane thickness was 20 μm, corresponding to permeate flux at 9.51 kg/(m2∙h), while these data became 15 μm corresponding to 13.93 kg/(m2∙h) when vf, vp reached 0.2 m/s. The vf, vp affected the optimal membrane thickness to a certain extent, but its impact was small.
The developed model could contribute to industrial application of MD, especially for supporting MD module designs in terms of optimization on membrane material and structure, working conditions or operating mode. In the current work, when the pore size varied from 0.2–1 μm, the Knudsen diffusion mechanism should be mainly considered for flux prediction, since the Knudsen diffusion coefficient is 50 times higher than that of molecular diffusion for the average pore size of 0.2 μm, and 10 times higher for the average pore size of 1 μm, when the membrane porosity is fixed. In the industries such as power plants, where a large amount of heat supply is present, the feed temperature should be properly increased to promote flux. In the industries such as for chemical synthesis with a low enthalpy of reaction, the selection of feed and permeate velocities, or pressure loss should be mainly considered for obtaining higher evaporation efficiency, where the model can be used for optimization by applying the conditions of the specific industries. Usually, counter-current operation performs better than co-current operation in terms of evaporation efficiency. Counter-current operation mode should be considered as priority. However, when the placement of MD module is geometrically limited and the aspect ratio of the membrane is high, counter-current mode is not necessarily better, the selection of co-current or counter-current mode can be determined by using simulation with the current model.

5. Conclusions

The simulation model coupling heat and mass transfer at the membrane surface through a user-defined function program was established. The optimal thickness for typical commercialized PVDF and PTFE membranes was studied, and it was found to be decreased with the increase of vf, vp or Tf. The TPC increased with the decrease of Tf or the increase of vf, vp. The counter-current operation mode performed better than co-current operation in most cases except for the condition where the cf was low and the module length was long enough. The difference of EE between co- and counter-current was due to the combined effect of temperature difference and concentration polarization. In addition, membranes with lower thermal conductivity and larger porosity were prone to get higher permeate flux and thinner optimal membrane thickness. The developed model could also provide guidance for MD module designs.

Author Contributions

Conceptualization, W.N., Y.L. and X.D.; Data curation, W.N.; Formal analysis, W.N. and J.Z.; Funding acquisition, Y.L. and X.D.; Investigation, W.N. and J.Z.; Methodology, W.N., Y.L. and X.D.; Project administration, Y.L. and X.D.; Resources, X.D.; Software, W.N., J.Z. and G.Z.; Supervision, Y.L., X.D. and Y.D.; Validation, W.N., J.Z. and G.Z.; Visualization, W.N. and Y.L.; Writing—original draft, W.N. and J.Z.; Writing—review & editing, Y.L., X.D. and Y.D. All authors have read and agreed to the published version of the manuscript.

Funding

This research was funded by National Key R&D Program of China, grant number 2018YFB0604304, and the National Natural Science Foundation of China, grant number 51821004.

Conflicts of Interest

The authors declare no conflict of interest.
Nomenclature
QHeat flux, W∙m−2
hConvective heat transfer coefficient, W∙m−2∙K−1
TTemperature, K
vVelocity, m∙s−1
dmHydraulic radius, m
ΔHLatent heat of water, J∙kg−1
NMass flow across membrane, kg∙m−2∙s−1
kThermal conductivity, W∙m−1∙K−1
kmMembrane thermal conductivity, W∙m−1∙K−1
kgThermal conductivity of air, W∙m−1∙K−1
ksThermal conductivity of membrane materials, W∙m−1∙K−1
Dw-aDiffusivity of water vapor-air mixture, m2∙s−2
DknKnudsen diffusion coefficient, m2∙s−1
PVapor pressure, Pa
PTTotal pressure, Pa
RGas constant (8.314 J∙mol−1∙K−2)
xsMolar fraction of solute
mwMolecular weight of water
bHeight of first grid, m
SwSource, kg∙m3∙s1
uVelocity vector, m∙s−1
pPressure, Pa
x,yCartesian coordinates, m
cpSpecific heat capacity, J∙kg−1∙K−1
DMass diffusivity, m2∙s−1
cconcentration, g∙L−1
EEEvaporation Efficiency, %
CPCConcentration polarization coefficient, %
tTime, s
Greek Symbols
δMembrane thickness, m
εMembrane porosity
λMembrane tortuosity
γwActivity coefficient of water
ρ Density, kg∙m−3
σ Viscous stress tensor
μ Dynamic viscosity, Pa∙s
ϑNaThe equivalent limiting ionic conductance of the sodium
ϑClThe equivalent limiting ionic conductance of the chloride
Subscripts
fThe bulk of the feed
fmMembrane surface of the feed
pThe bulk of the permeate
pmMembrane surface of the permeate
mMembrane
NFlux
CConduction
Abbreviations
DCMDDirect contact membrane distillation
FGDFlue gas desulfurization
MDMembrane Distillation
CFDComputational fluid dynamics
CPCConcentration polarization coefficient
TPCTemperature polarization coefficient
UDFUser-defined function
EEEvaporation efficiency

References

  1. Chen, M.; Zhu, L.; Dong, Y.; Li, L.; Liu, J. Engineering, Waste-to-resource strategy to fabricate highly porous whisker-structured mullite ceramic membrane for simulated oil-in-water emulsion wastewater treatment. ACS Sustain. Chem. Eng. 2016, 4, 2098–2106. [Google Scholar] [CrossRef]
  2. Dong, Y.; Ma, L.; Tang, C.Y.; Yang, F.; Quan, X.; Jassby, D.; Zaworotko, M.J.; Guiver, M.D. Stable superhydrophobic ceramic-based carbon nanotube composite desalination membranes. Nano Lett. 2018, 18, 5514–5521. [Google Scholar] [CrossRef] [PubMed] [Green Version]
  3. Liu, J.; Dong, Y.; Dong, X.; Hampshire, S.; Zhu, L.; Zhu, Z.; Li, L. Feasible recycling of industrial waste coal fly ash for preparation of anorthite-cordierite based porous ceramic membrane supports with addition of dolomite. J. Eur. Ceram. Soc. 2016, 36, 1059–1071. [Google Scholar] [CrossRef]
  4. Zhu, L.; Chen, M.; Dong, Y.; Tang, C.Y.; Huang, A.; Li, L. A low-cost mullite-titania composite ceramic hollow fiber microfiltration membrane for highly efficient separation of oil-in-water emulsion. Water Res. 2016, 90, 277–285. [Google Scholar] [PubMed]
  5. Chen, M.; Zhu, L.; Chen, J.; Yang, F.; Tang, C.Y.; Guiver, M.D.; Dong, Y. Spinel-based ceramic membranes coupling solid sludge recycling with oily wastewater treatment. Water Res. 2020, 169, 115180. [Google Scholar]
  6. Zhang, M.; Jin, W.; Yang, F.; Duke, M.C.; Dong, Y.; Tang, C.Y. Engineering Nano-Composite Interlayer for Novel Ceramic-based Forward Osmosis Membrane with Enhanced Performance. Environ. Sci. Technol. 2020, 54, 7715–7724. [Google Scholar] [CrossRef]
  7. Si, Y.; Sun, C.; Li, D.; Yang, F.; Tang, C.Y.; Quan, X.; Dong, Y.; Guiver, M.D. Flexible Superhydrophobic Metal-based Carbon Nanotube Membrane for Electrochemically Enhanced Water Treatment. Environ. Sci. Technol. 2020, 54, 9074–9082. [Google Scholar] [CrossRef]
  8. Phattaranawik, J.; Jiraratananon, R.; Fane, A.G. Heat transport and membrane distillation coefficients in direct contact membrane distillation. J. Membr. Sci. 2003, 212, 177–193. [Google Scholar] [CrossRef]
  9. Deshmukh, A.; Boo, C.; Karanikola, V.; Lin, S.; Straub, A.P.; Tong, T.; Warsinger, D.M.; Elimelech, M. Membrane distillation at the water-energy nexus: Limits, opportunities, and challenges. Energy Environ. Sci. 2018, 11, 1177–1196. [Google Scholar] [CrossRef]
  10. Tomaszewska, M. Direct Contact Membrane Distillation (DCMD) Applications. In Encyclopedia of Membranes; Drioli, E., Giorno, L., Eds.; Springer: Berlin/Heidelberg, Germany, 2015; pp. 1–4. [Google Scholar]
  11. Bouchrit, R.; Boubakri, A.; Hafiane, A.; Bouguecha, S.A.-T. Direct contact membrane distillation: Capability to treat hyper-saline solution. Desalination 2015, 376, 117–129. [Google Scholar] [CrossRef]
  12. Christie, K.S.S.; Horseman, T.; Lin, S. Energy efficiency of membrane distillation: Simplified analysis, heat recovery, and the use of waste-heat. Environ. Int. 2020, 138, 105588. [Google Scholar] [CrossRef]
  13. Deshmukh, A.; Elimelech, M. Understanding the impact of membrane properties and transport phenomena on the energetic performance of membrane distillation desalination. J. Membr. Sci. 2017, 539, 458–474. [Google Scholar] [CrossRef]
  14. Hardikar, M.; Marquez, I.; Achilli, A. Emerging investigator series: Membrane distillation and high salinity: Analysis and implications. Environ. Sci. Water Res. Technol. 2020, 6, 1538–1552. [Google Scholar] [CrossRef]
  15. Hsu, S.T.; Cheng, K.T.; Chiou, J.S. Seawater desalination by direct contact membrane distillation. Desalination 2002, 143, 279–287. [Google Scholar] [CrossRef]
  16. Schofield, R.W.; Fane, A.G.; Fell, C.J.D.; Macoun, R. Factors affecting flux in membrane distillation. Desalination 1990, 77, 279–294. [Google Scholar] [CrossRef]
  17. Khayet, M.; Velázquez, A.; Mengual, J.I. Direct contact membrane distillation of humic acid solutions. J. Membr. Sci. 2004, 240, 123–128. [Google Scholar] [CrossRef]
  18. Yun, Y.; Ma, R.; Zhang, W.; Fane, A.G.; Li, J. Direct contact membrane distillation mechanism for high concentration NaCl solutions. Desalination 2006, 188, 251–262. [Google Scholar] [CrossRef]
  19. Shakaib, M.; Hasani, S.M.F.; Ahmed, I.; Yunus, R.M. A CFD study on the effect of spacer orientation on temperature polarization in membrane distillation modules. Desalination 2012, 284, 332–340. [Google Scholar] [CrossRef]
  20. Hayer, H.; Bakhtiari, O.; Mohammadi, T. Simulation of momentum, heat and mass transfer in direct contact membrane distillation: A computational fluid dynamics approach. J. Ind. Eng. Chem. 2015, 21, 1379–1382. [Google Scholar] [CrossRef]
  21. Chang, H.; Hsu, J.-A.; Chang, C.-L.; Ho, C.-D.; Cheng, T.-W. Simulation study of transfer characteristics for spacer-filled membrane distillation desalination modules. Appl. Energy 2017, 185, 2045–2057. [Google Scholar] [CrossRef]
  22. Lou, J.; Vanneste, J.; Decaluwe, S.C.; Cath, T.Y.; Tilton, N. Computational fluid dynamics simulations of polarization phenomena in Direct Contact Membrane Distillation. J. Membr. Sci. 2019, 591, 117150. [Google Scholar] [CrossRef]
  23. Hitsov, I.; Maere, T.; De Sitter, K.; Dotremont, C.; Nopens, I. Modelling approaches in membrane distillation: A critical review. Sep. Purif. Technol. 2015, 142, 48–64. [Google Scholar] [CrossRef]
  24. Al-Sharif, S.; Albeirutty, M.; Cipollina, A.; Micale, G. Modelling flow and heat transfer in spacer-filled membrane distillation channels using open source CFD code. Desalination 2013, 311, 103–112. [Google Scholar] [CrossRef]
  25. Bhattacharya, M.; Dutta, S.K.; Sikder, J.; Mandal, M.K. Computational and experimental study of chromium (VI) removal in direct contact membrane distillation. J. Membr. Sci. 2014, 450, 447–456. [Google Scholar] [CrossRef]
  26. Janajreh, I.; Suwwan, D.; Hashaikeh, R. Assessment of direct contact membrane distillation under different configurations, velocities and membrane properties. Appl. Energy 2017, 185, 2058–2073. [Google Scholar] [CrossRef]
  27. Ponzio, F.N.; Tamburini, A.; Cipollina, A.; Micale, G.; Ciofalo, M. Experimental and computational investigation of heat transfer in channels filled by woven spacers. Int. J. Heat Mass Transf. 2017, 104, 163–177. [Google Scholar] [CrossRef] [Green Version]
  28. Taamneh, Y.; Bataineh, K. Improving the performance of direct contact membrane distillation utilizing spacer-filled channel. Desalination 2017, 408, 25–35. [Google Scholar] [CrossRef]
  29. Yu, H.; Yang, X.; Wang, R.; Fane, A.G. Numerical simulation of heat and mass transfer in direct membrane distillation in a hollow fiber module with laminar flow. J. Membr. Sci. 2011, 384, 107–116. [Google Scholar] [CrossRef]
  30. Yang, X.; Yu, H.; Wang, R.; Fane, A.G. Analysis of the effect of turbulence promoters in hollow fiber membrane distillation modules by computational fluid dynamic (CFD) simulations. J. Membr. Sci. 2012, 415–416, 758–769. [Google Scholar] [CrossRef] [Green Version]
  31. Yazgan-Birgi, P.; Hassan Ali, M.I.; Arafat, H.A. Comparative performance assessment of flat sheet and hollow fiber DCMD processes using CFD modeling. Sep. Purif. Technol. 2019, 212, 709–722. [Google Scholar] [CrossRef]
  32. Cabassud, C.; Wirth, D. Membrane distillation for water desalination: How to chose an appropriate membrane? Desalination 2003, 157, 307–314. [Google Scholar] [CrossRef]
  33. Drioli, E.; Ali, A.; Macedonio, F. Membrane distillation: Recent developments and perspectives. Desalination 2015, 356, 56–84. [Google Scholar] [CrossRef]
  34. Lawson, K.W.; Hall, M.S.; Lloyd, D.R. Compaction of microporous membranes used in membrane distillation. I. Effect on gas permeability. J. Membr. Sci. 1995, 101, 99–108. [Google Scholar] [CrossRef]
  35. Eykens, L.; Hitsov, I.; De Sitter, K.; Dotremont, C.; Pinoy, L.; Nopens, I.; Van der Bruggen, B. Influence of membrane thickness and process conditions on direct contact membrane distillation at different salinities. J. Membr. Sci. 2016, 498, 353–364. [Google Scholar] [CrossRef]
  36. Shaulsky, E.; Karanikola, V.; Straub, A.P.; Deshmukh, A.; Zucker, I.; Elimelech, M. Asymmetric membranes for membrane distillation and thermo-osmotic energy conversion. Desalination 2019, 452, 141–148. [Google Scholar] [CrossRef]
  37. Martınez-Dıez, L.; Vázquez-González, M.I. Temperature and concentration polarization in membrane distillation of aqueous salt solutions. J. Membr. Sci. 1999, 156, 265–273. [Google Scholar] [CrossRef]
  38. Phattaranawik, J.; Jiraratananon, R.; Fane, A.G. Effect of pore size distribution and air flux on mass transport in direct contact membrane distillation. J. Membr. Sci. 2003, 215, 75–85. [Google Scholar] [CrossRef]
  39. Ibrahim, S.S.; Alsalhy, Q.F. Modeling and simulation for direct contact membrane distillation in hollow fiber modules. Aiche J. 2013, 59, 589–603. [Google Scholar] [CrossRef]
  40. Schofield, R.W.; Fane, A.G.; Fell, C.J.D. Gas and vapour transport through microporous membranes. I. Knudsen-Poiseuille transition. J. Membr. Sci. 1990, 53, 159–171. [Google Scholar] [CrossRef]
  41. Shuangchen, M.; Jin, C.; Gongda, C.; Weijing, Y.; Sijie, Z. Research on desulfurization wastewater evaporation: Present and future perspectives. Renew. Sustain. Energy Rev. 2016, 58, 1143–1151. [Google Scholar] [CrossRef]
  42. Ali, A.; Macedonio, F.; Drioli, E.; Aljlil, S.; Alharbi, O.A. Experimental and theoretical evaluation of temperature polarization phenomenon in direct contact membrane distillation. Chem. Eng. Res. Des. 2013, 91, 1966–1977. [Google Scholar] [CrossRef]
  43. Hwang, H.J.; He, K.; Gray, S.; Zhang, J.; Moon, I.S. Direct contact membrane distillation (DCMD): Experimental study on the commercial PTFE membrane and modeling. J. Membr. Sci. 2011, 371, 90–98. [Google Scholar] [CrossRef] [Green Version]
  44. Swaminathan, J.; Chung, H.W.; Warsinger, D.M.; Lienhard, V.J.H. Energy efficiency of membrane distillation up to high salinity: Evaluating critical system size and optimal membrane thickness. Appl. Energy 2018, 211, 715–734. [Google Scholar] [CrossRef]
  45. Wu, H.Y.; Wang, R.; Field, R.W. Direct contact membrane distillation: An experimental and analytical investigation of the effect of membrane thickness upon transmembrane flux. J. Membr. Sci. 2014, 470, 257–265. [Google Scholar] [CrossRef]
  46. Martínez, L.; Rodríguez-Maroto, J.M. Membrane thickness reduction effects on direct contact membrane distillation performance. J. Membr. Sci. 2008, 312, 143–156. [Google Scholar] [CrossRef]
Figure 1. Heat transfer schematic diagram of direct contact membrane distillation (DCMD).
Membranes 10 00179 g001
Figure 2. Schematics of the 2-D geometry model of the membrane module.
Membranes 10 00179 g002
Figure 3. Model validation in different Tf (cf = 24.2 wt.%, left; pure water, right).
Membranes 10 00179 g003
Figure 4. Contours of temperature distribution in different Tf (vf, vp = 0.15 m/s, Tp = 25 °C, cf = 24.2 wt.%).
Membranes 10 00179 g004
Figure 5. Temperature polarization coefficient in different Tf (vf, vp = 0.15 m/s, Tp = 25 °C, cf = 24.2 wt.%).
Membranes 10 00179 g005
Figure 6. Contours of temperature distribution in different vf, vp (Tf = 45 °C, Tp = 25 °C, cf = 24.2 wt.%).
Membranes 10 00179 g006
Figure 7. Temperature polarization coefficient in different vf, vp (Tf = 45 °C, Tp = 25 °C, cf = 24.2 wt.%).
Membranes 10 00179 g007
Figure 8. Temperature fields for co- and counter-current operations (different color scales were used in the permeate and feed channels, Tf = 60 °C, Tp = 25 °C, vf, vp = 0.15 m/s, cf = 24.2 wt.%). (a) co-current operation. (b) counter-current operation.
Membranes 10 00179 g008aMembranes 10 00179 g008b
Figure 9. Evaporation efficiency (EE) for co- and counter-current operations in different Tf. (Tp = 25 °C, vf, vp = 0.15 m/s, cf = 24.2 wt.%).
Membranes 10 00179 g009
Figure 10. EE for co- and counter-current operations in different vf, vp. (Tf = 45 °C, Tp = 25 °C, cf = 24.2 wt.%).
Membranes 10 00179 g010
Figure 11. EE for co- and counter-current operations in different cf (Tf = 45 °C, Tp = 25 °C, vf, vp = 0.15 m/s).
Membranes 10 00179 g011
Figure 12. Optimal membrane thickness for different membrane materials (Tf = 45 °C, Tp = 25 °C, vf, vp = 0.15 m/s, cf = 24.2 wt.%).
Membranes 10 00179 g012
Figure 13. Optimal membrane thickness for different Tf (Tp = 25 °C, vf, vp = 0.15 m/s, cf = 24.2 wt.%, GVHP).
Membranes 10 00179 g013
Figure 14. Optimal membrane thickness for different vf, vp (Tf = 45 °C, Tp = 25 °C, cf = 24.2 wt.%, GVHP).
Membranes 10 00179 g014
Table 1. Properties of the selected membranes.
Membrane TypeProducerMaterialdp (μm)δ (μm)km (W∙m−1∙K−1)ελRef.
GVHPMilliporePVDF0.221200.0410.752[18]
HVHPMilliporePVDF0.451100.0410.752[18]
TF200GelmanPTFE0.201780.0310.801.8[33]
TF450GelmanPTFE0.451780.0310.801.8[33]
TF1000GelmanPTFE1.001780.0310.801.8[33]

