Purification of Arabinoxylans from Corn Fiber and Preparation of Bioactive Films for Food Packaging


Abstract
1. Introduction
2. Materials and Methods
2.1. Materials
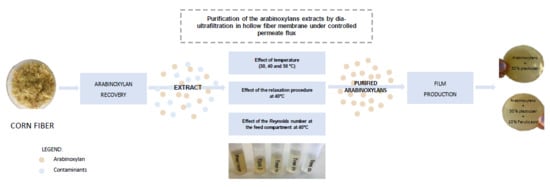
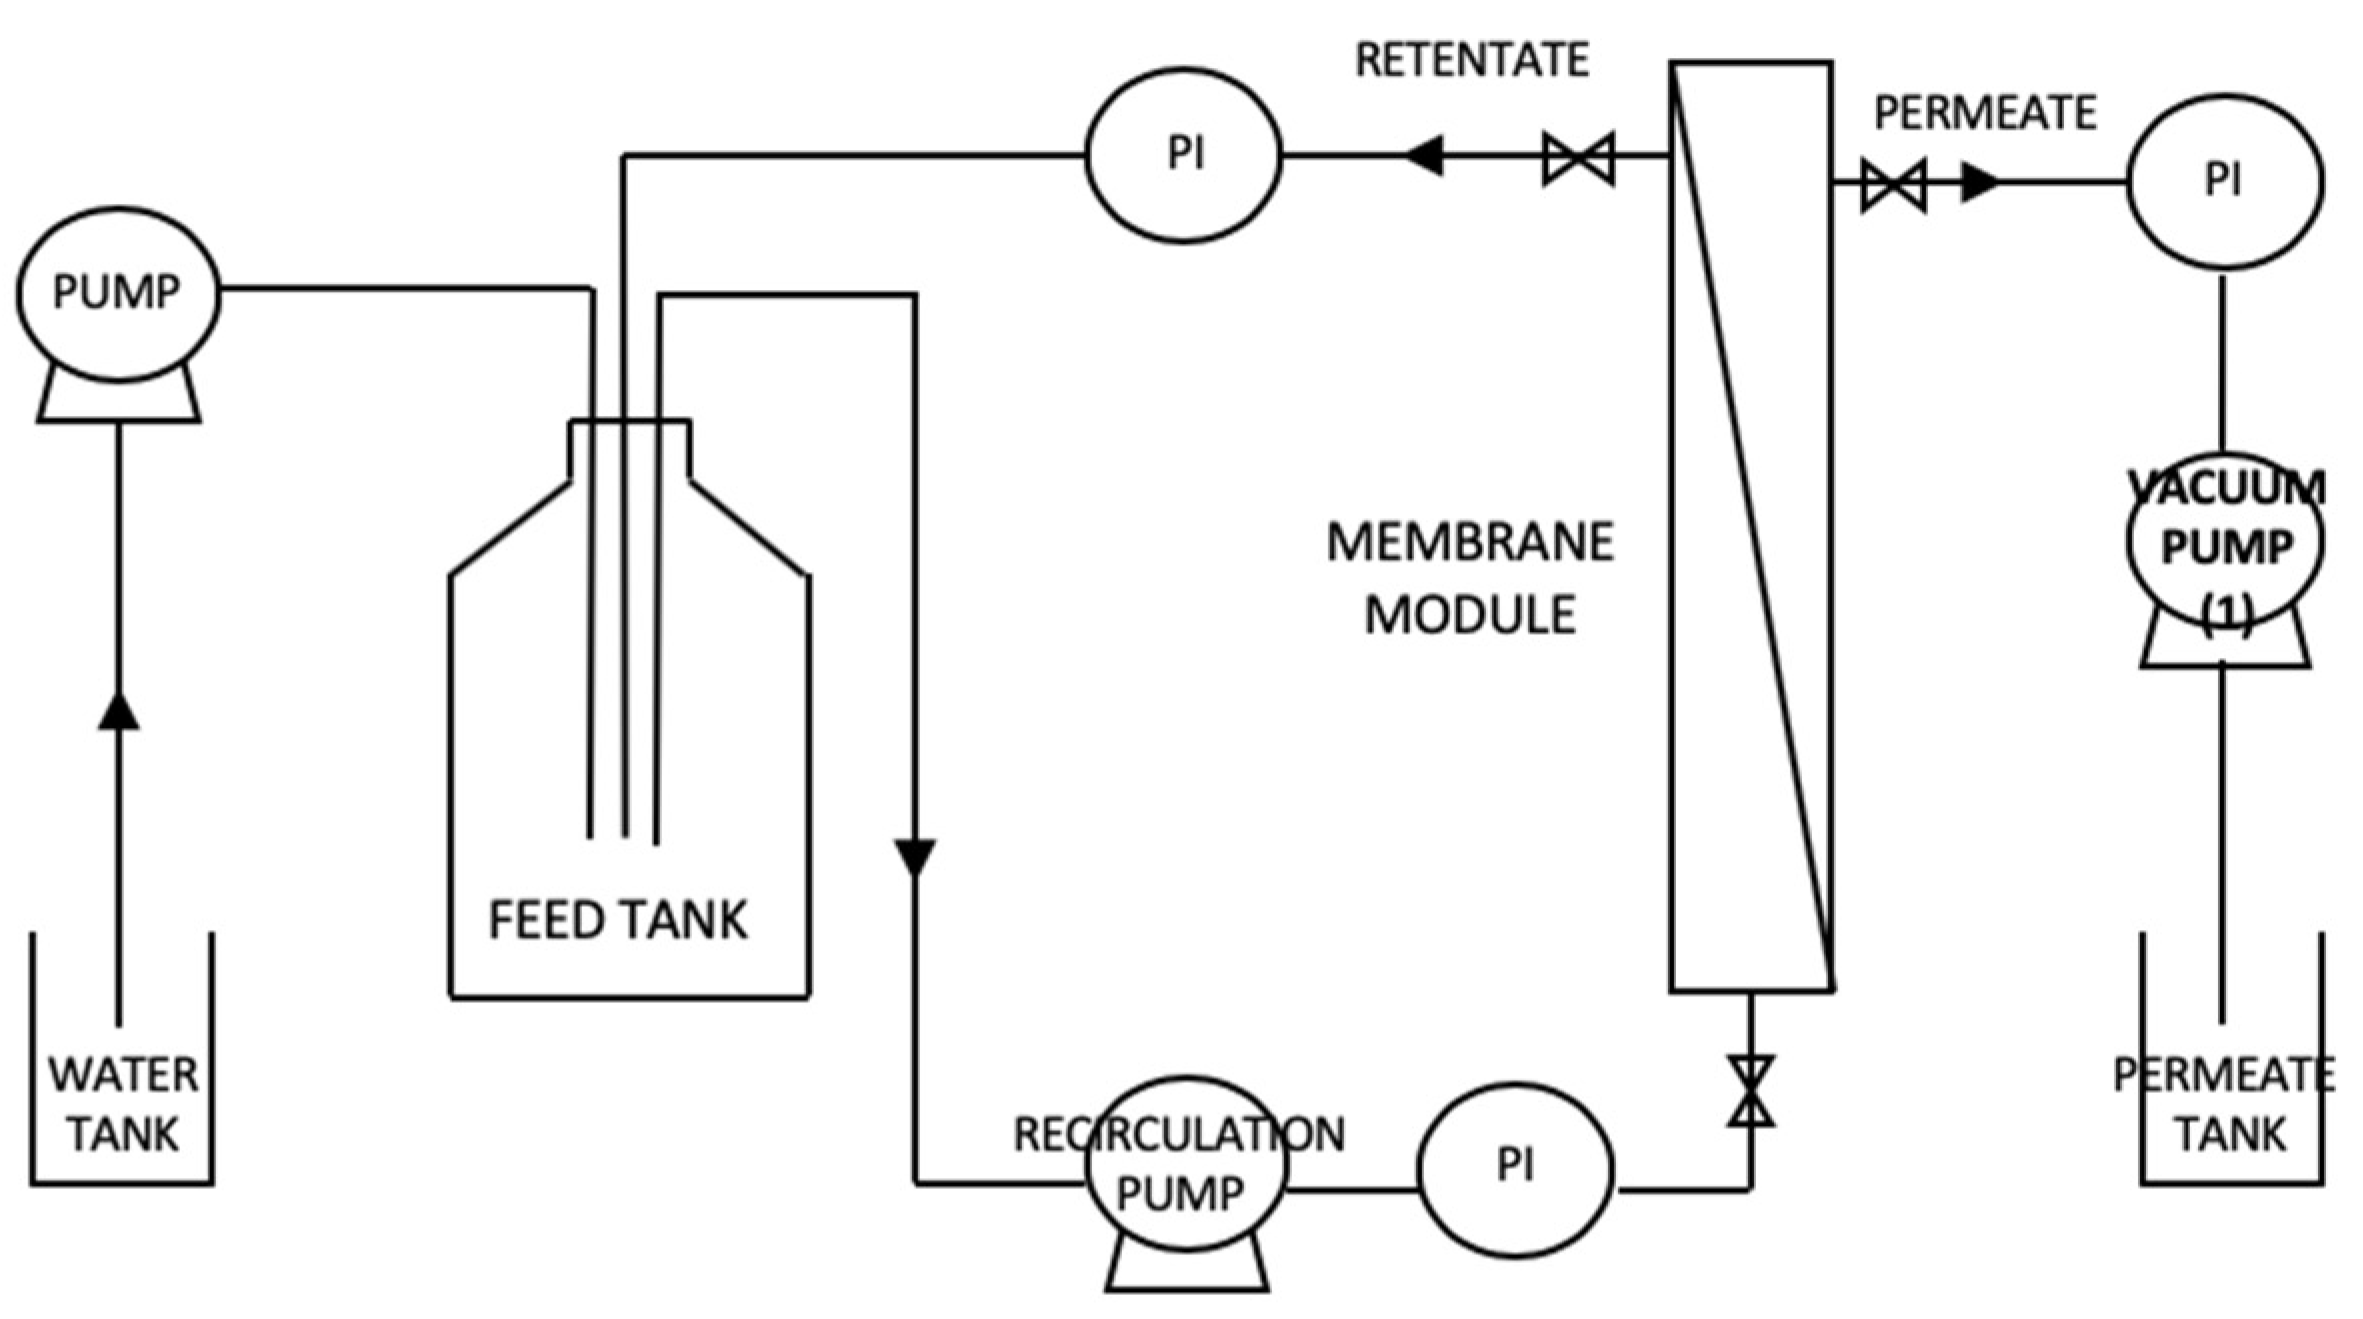
2.2. Purification of the Arabinoxylans Extracts: Membrane Procedure
2.2.1. Modes of Operation and Experimental Set-Ups
2.2.2. Operating Conditions
2.3. Characterization of the Raw Material and the Fractions Produced by Dia-Ultrafiltration
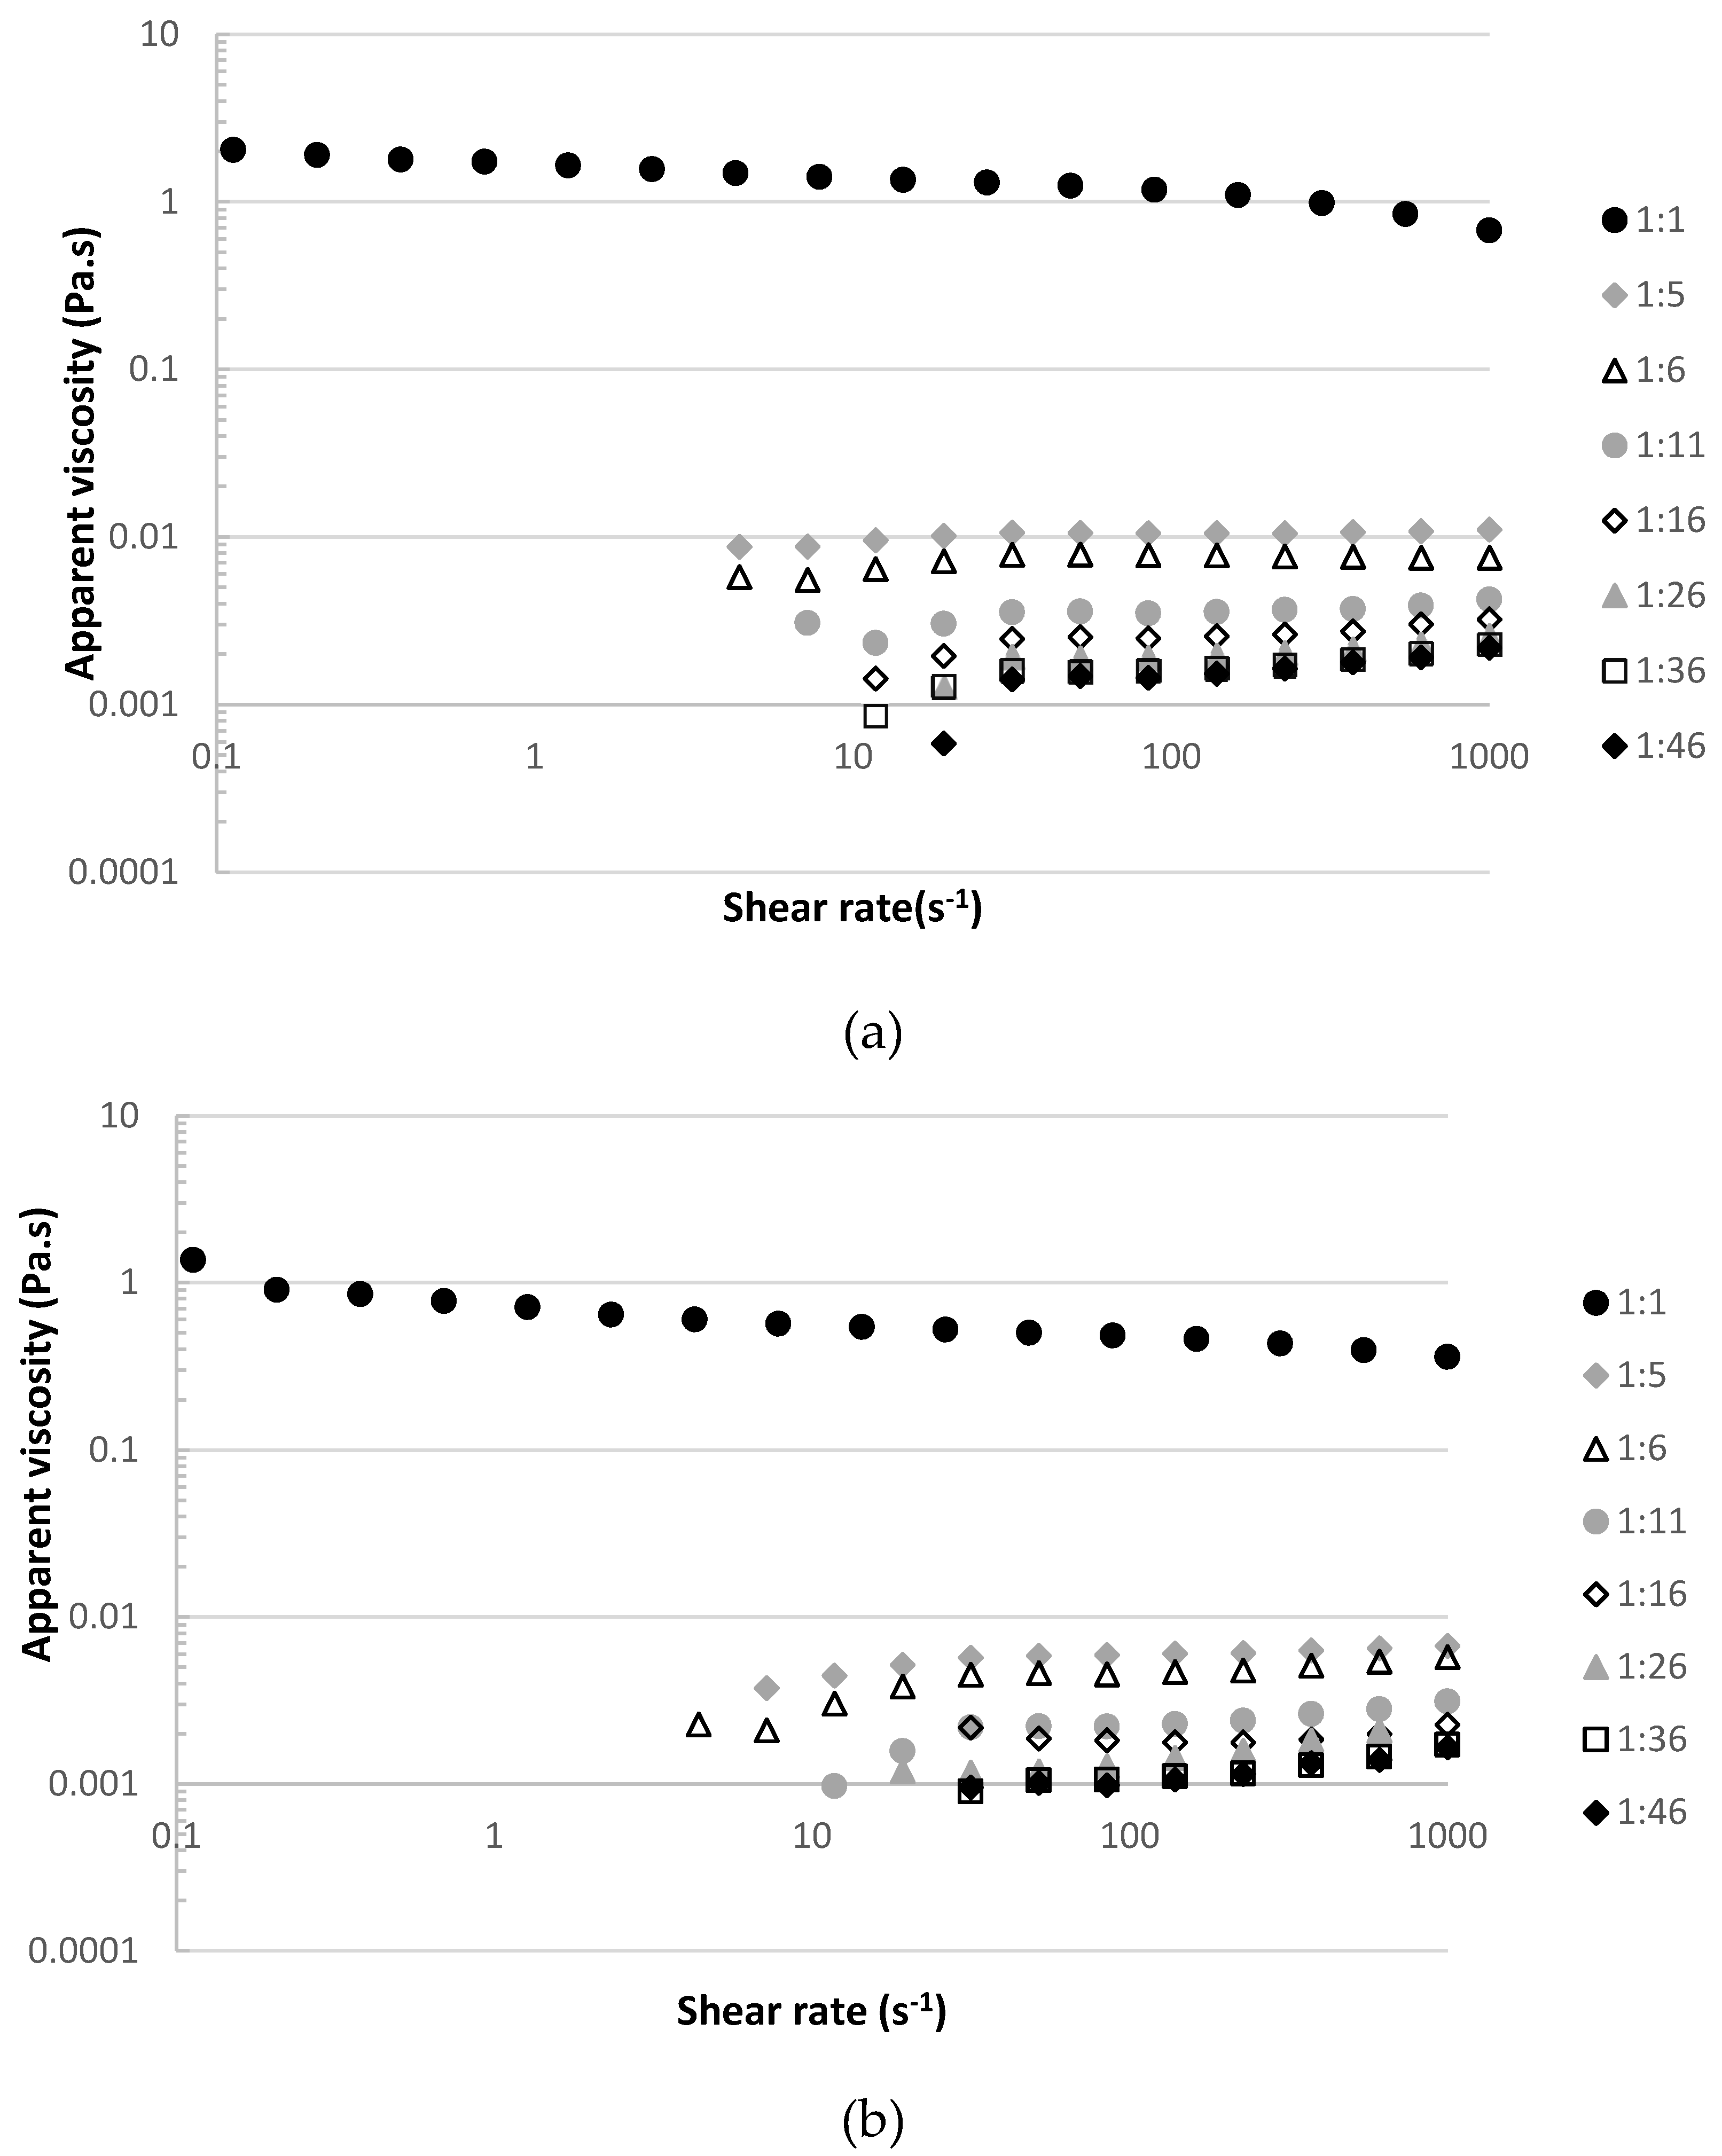
2.3.1. Viscosity of the Raw Material at Different Dilution Ratios
2.3.2. Quantification of Charged Contaminants
2.3.3. Quantification of Contaminants
2.4. Preparation and Characterization of Films
2.4.1. Films Preparation
2.4.2. Films Characterization
Thickness Measurement
Color Measurement
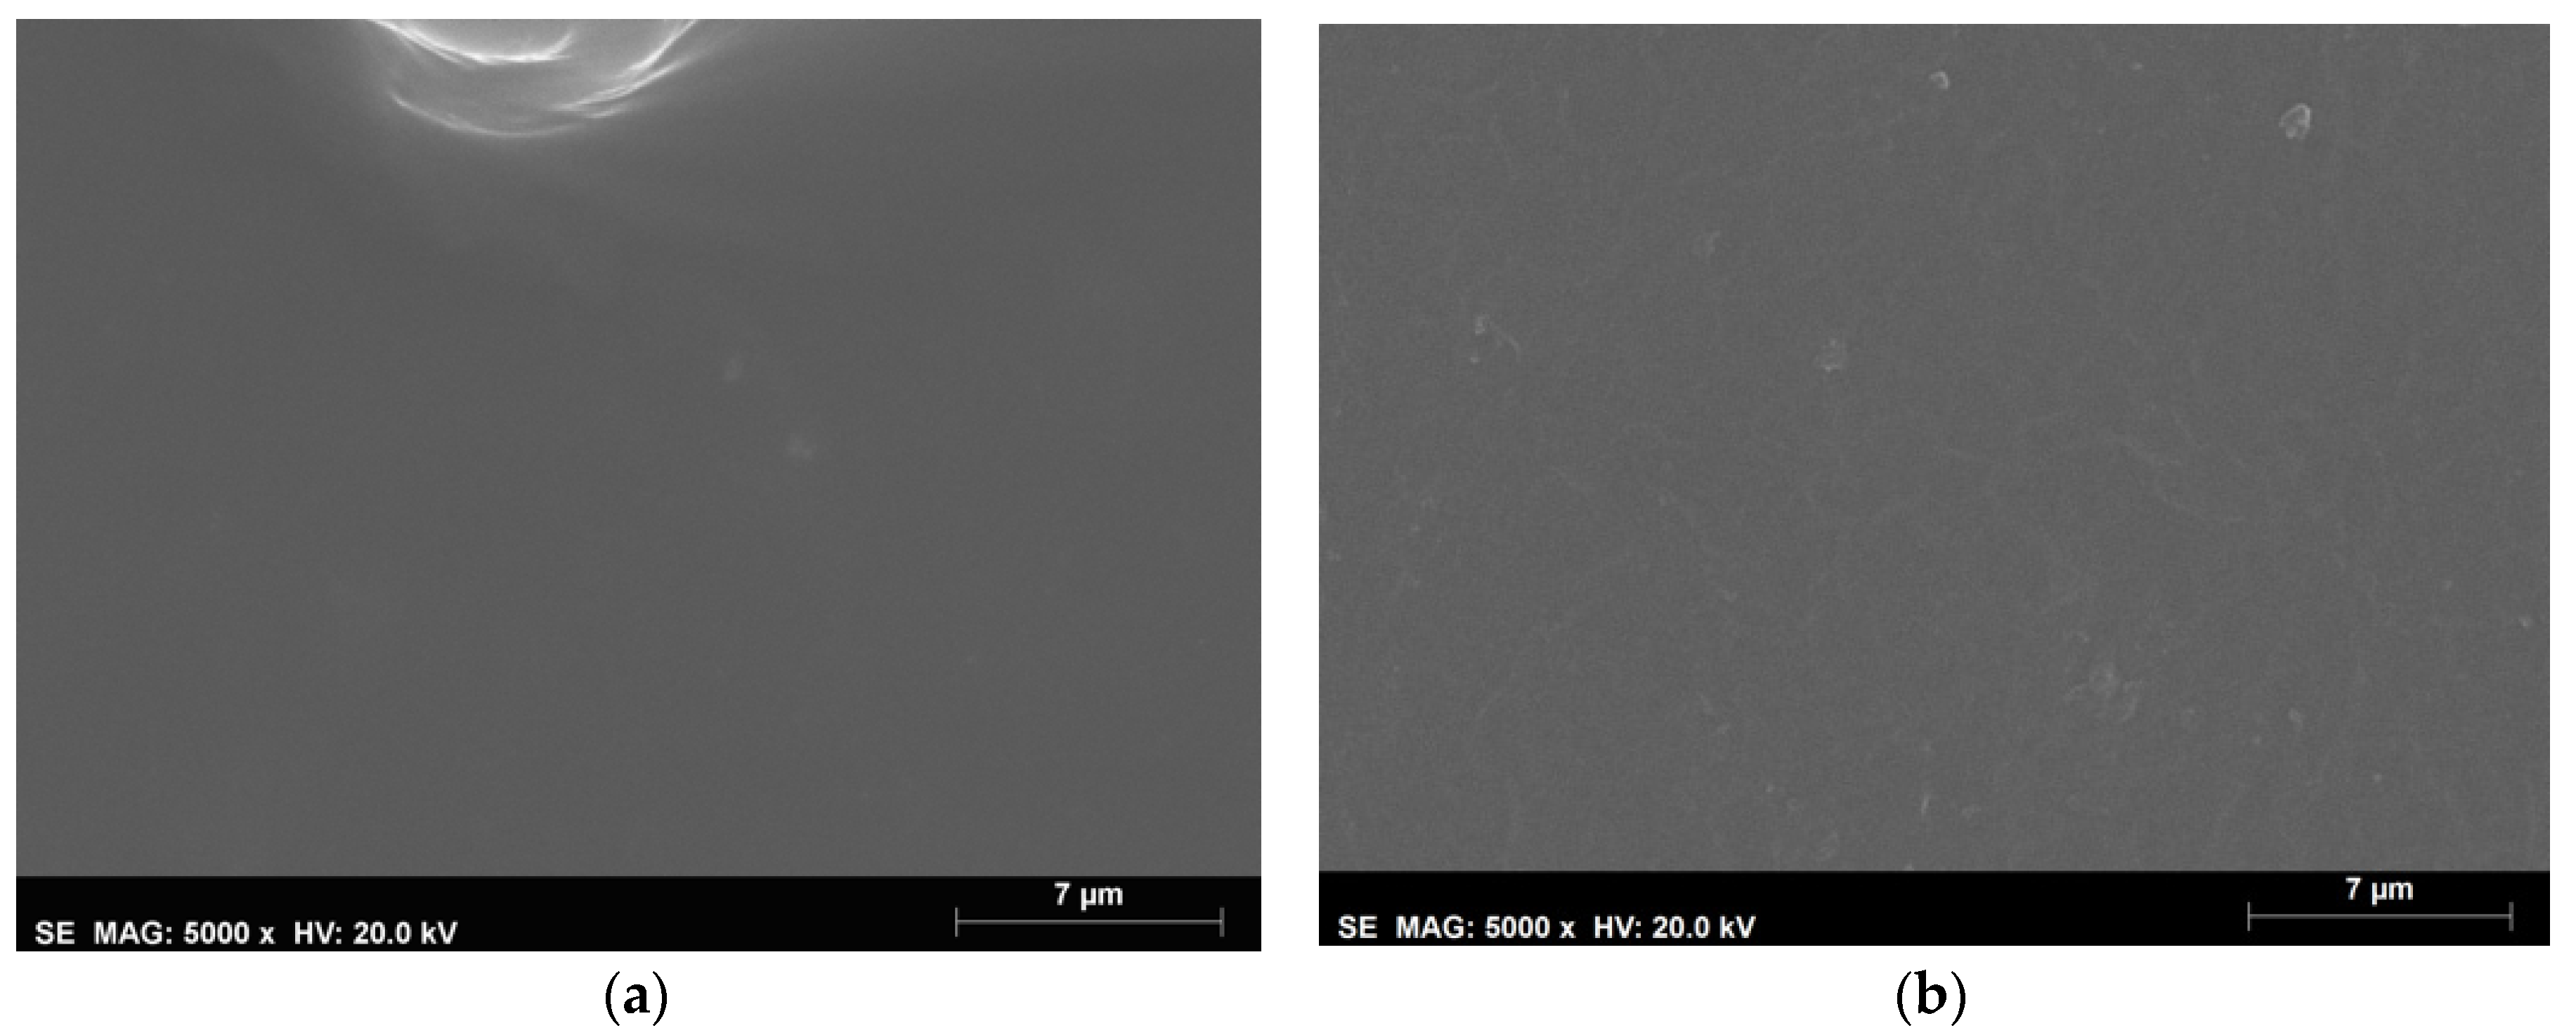
Films Morphology
Water Vapor Permeability
Tensile Tests
2.4.3. Antioxidant Activity by Ferric Reduction Antioxidant Power (FRAP)
2.5. Statistical Analysis
3. Results and Discussion
3.1. Viscosity of the Raw Material at Different Dilution Ratios
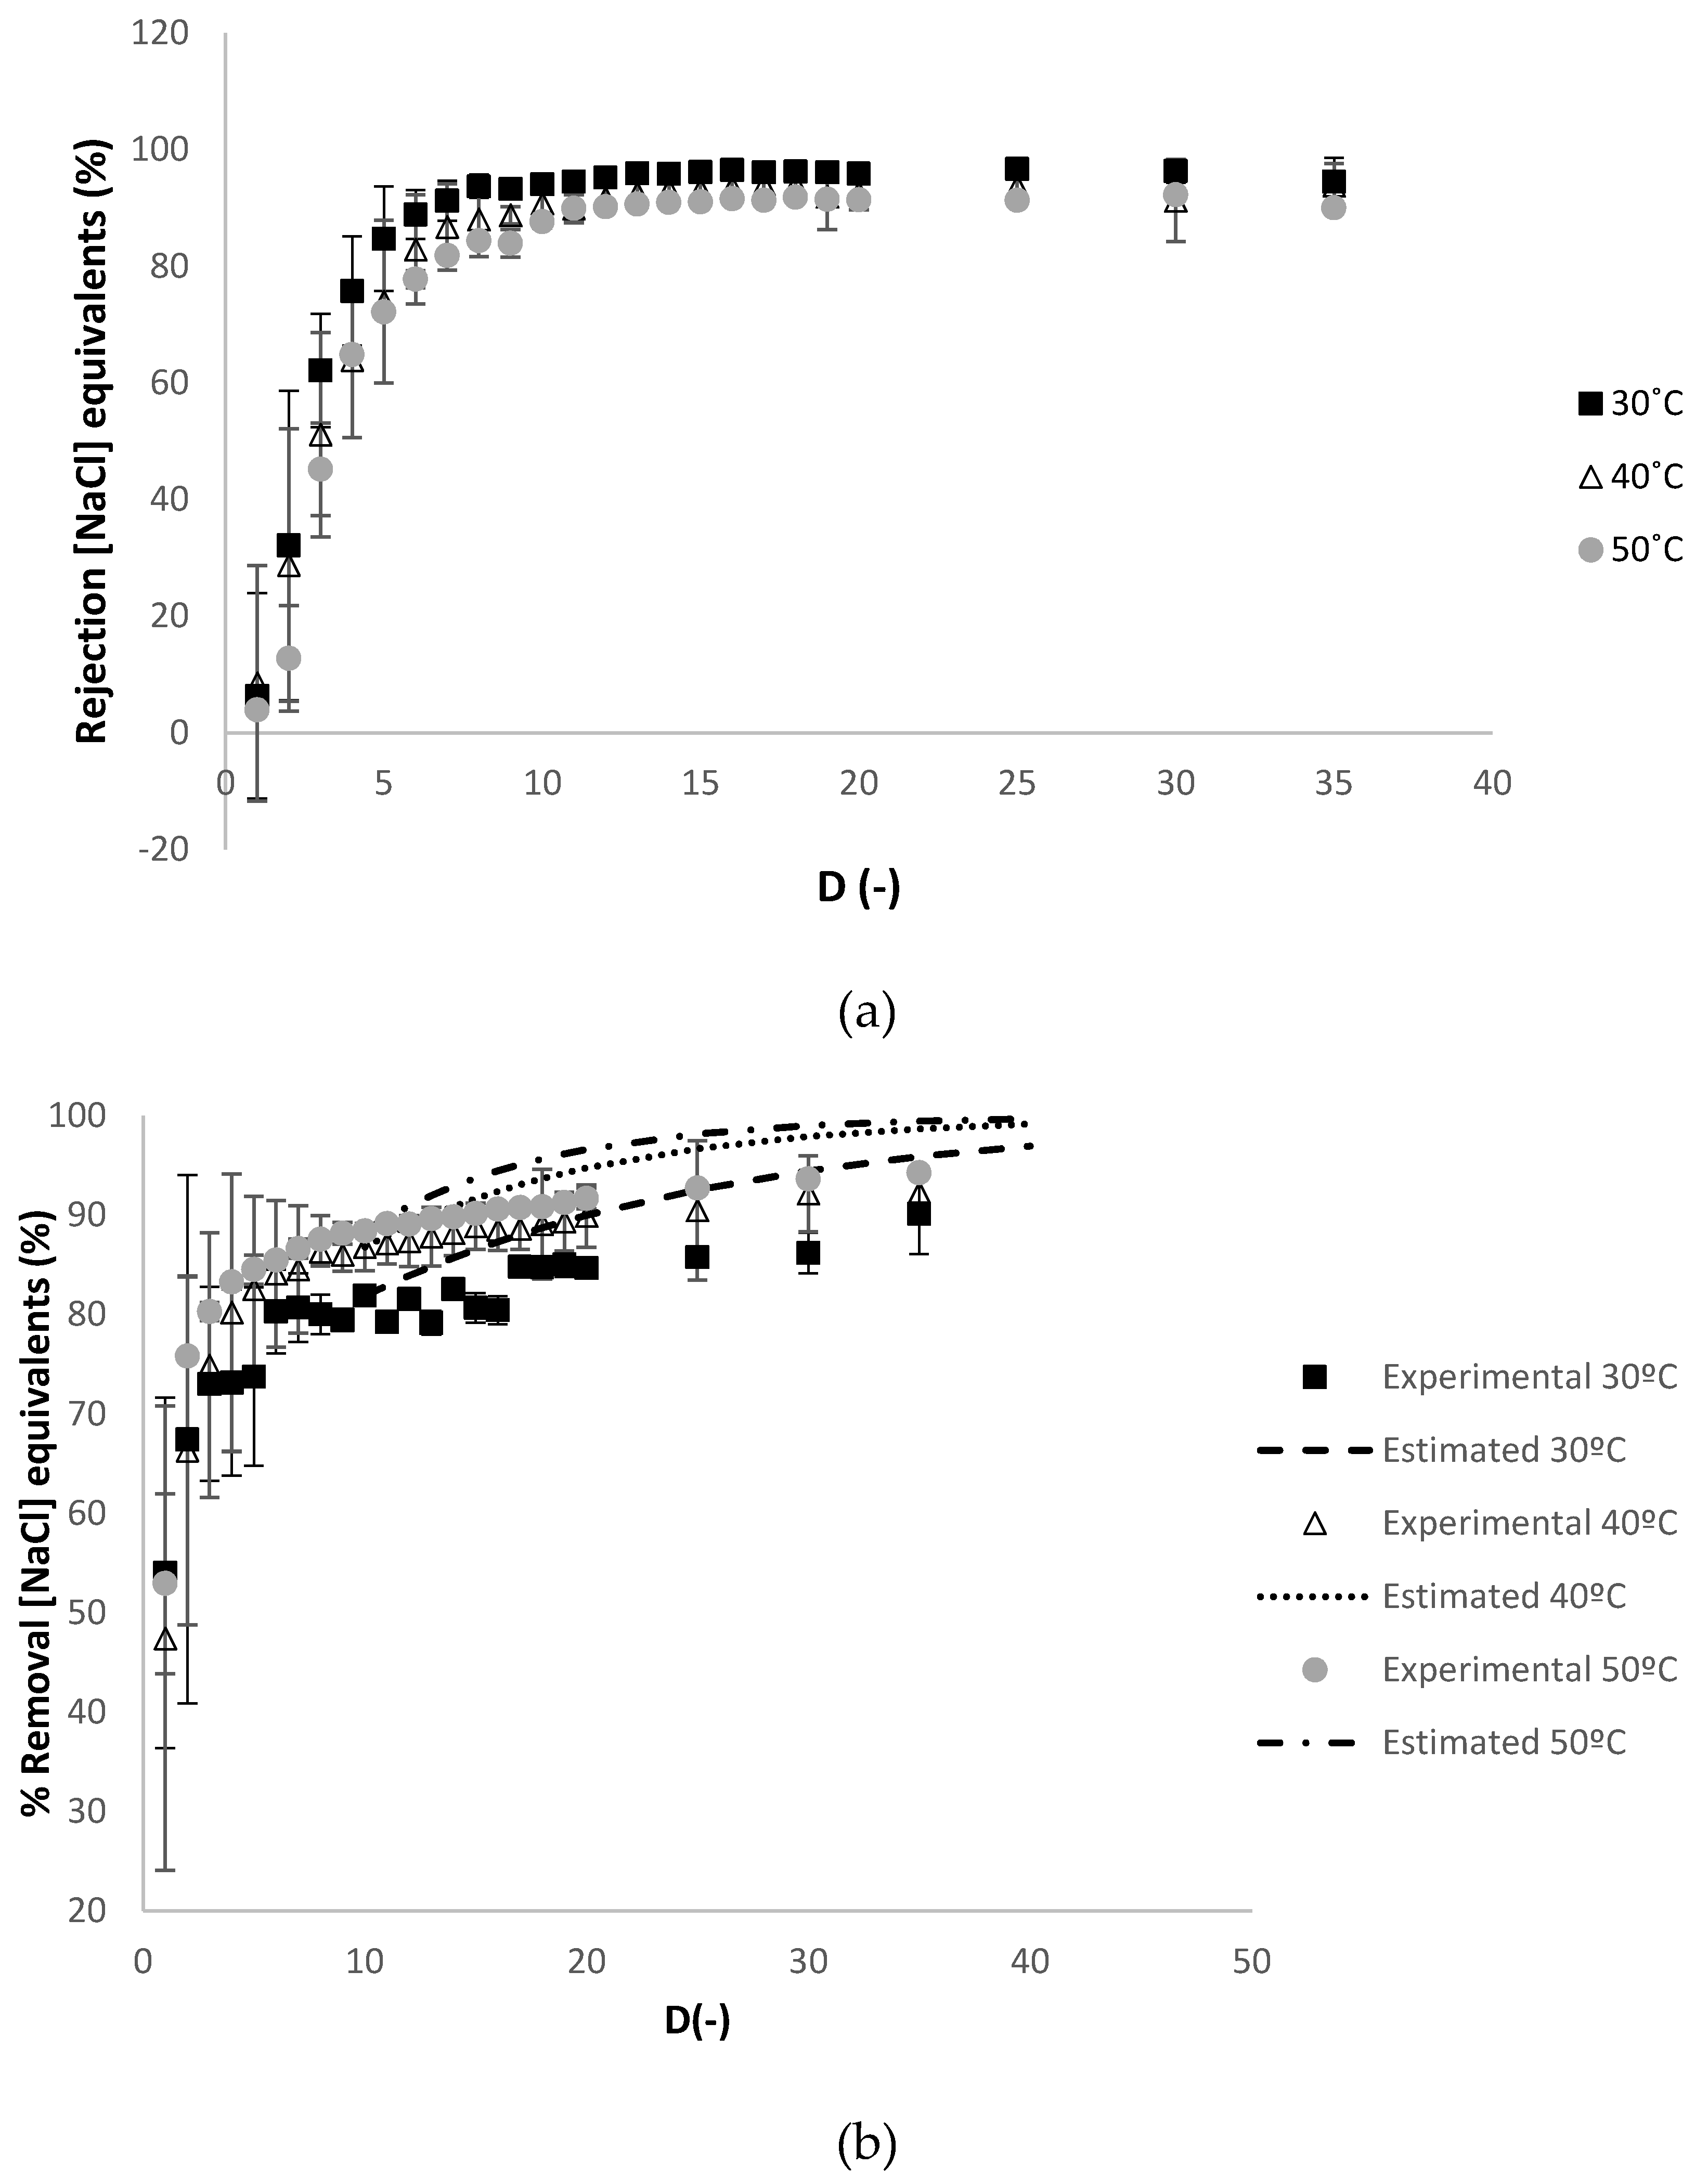
3.2. Optimization of the Purification of the (Diluted) Raw Material by Dia-Ultrafiltration
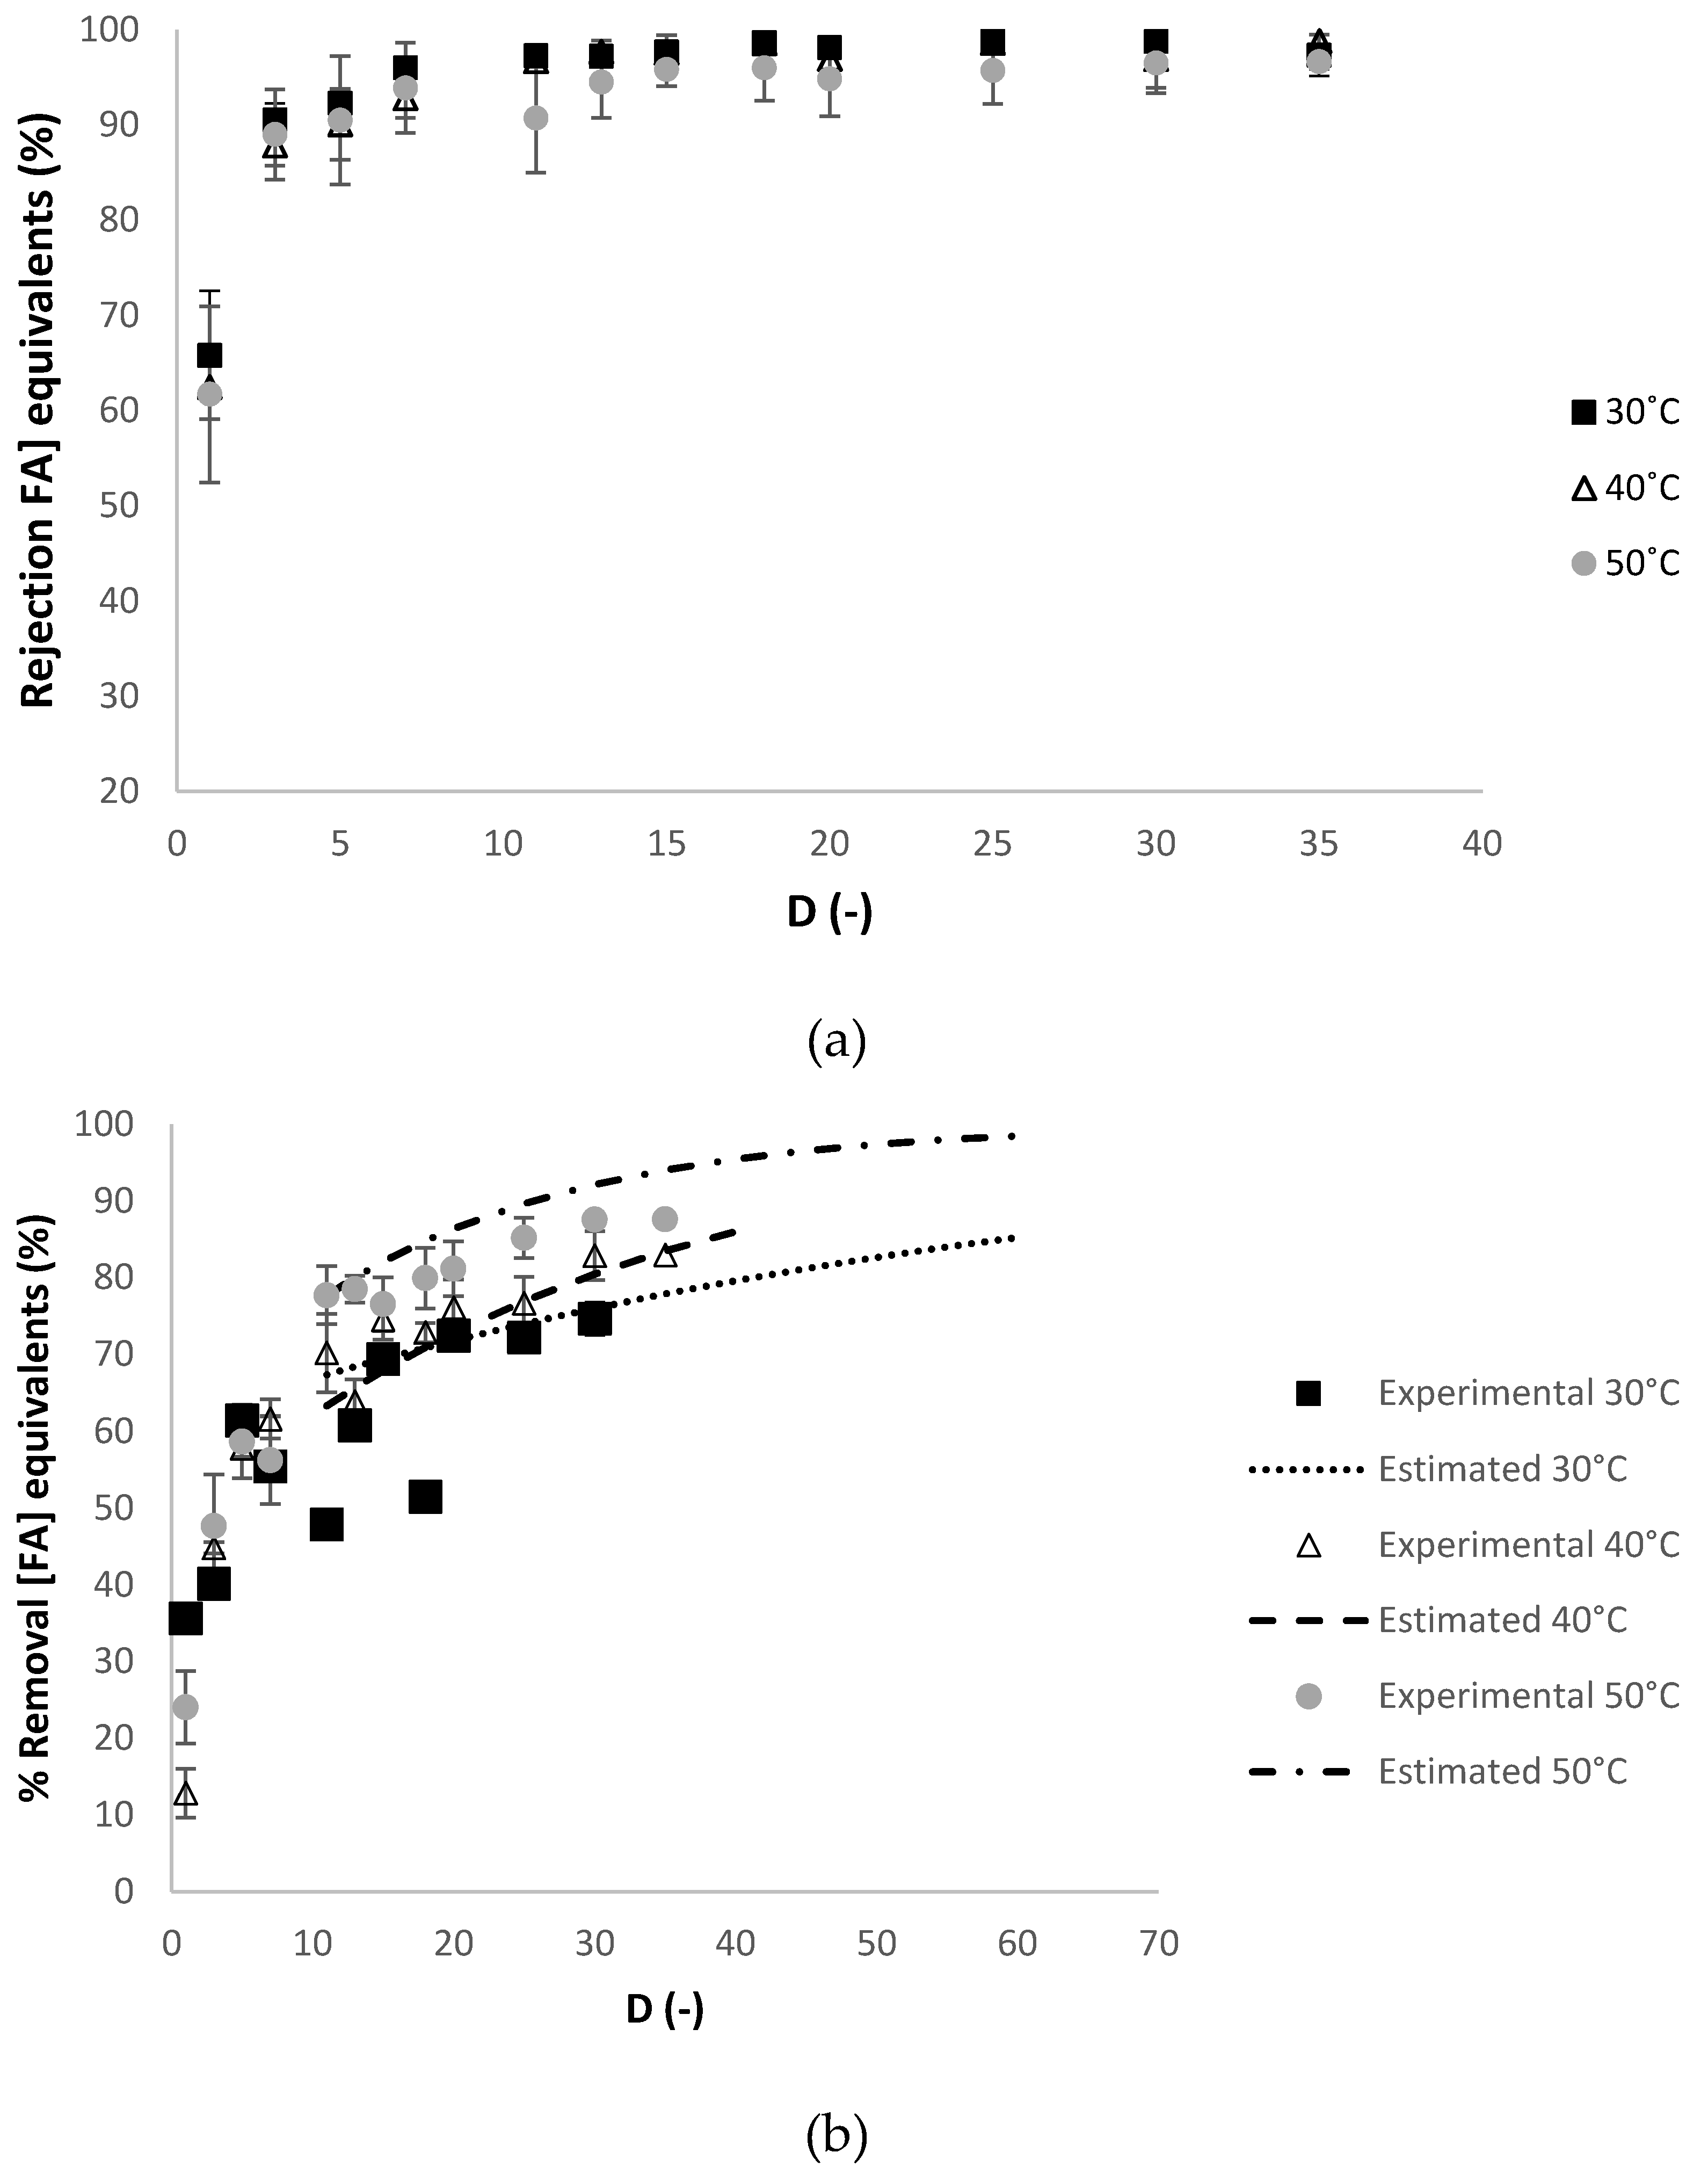
3.2.1. Effect of Temperature
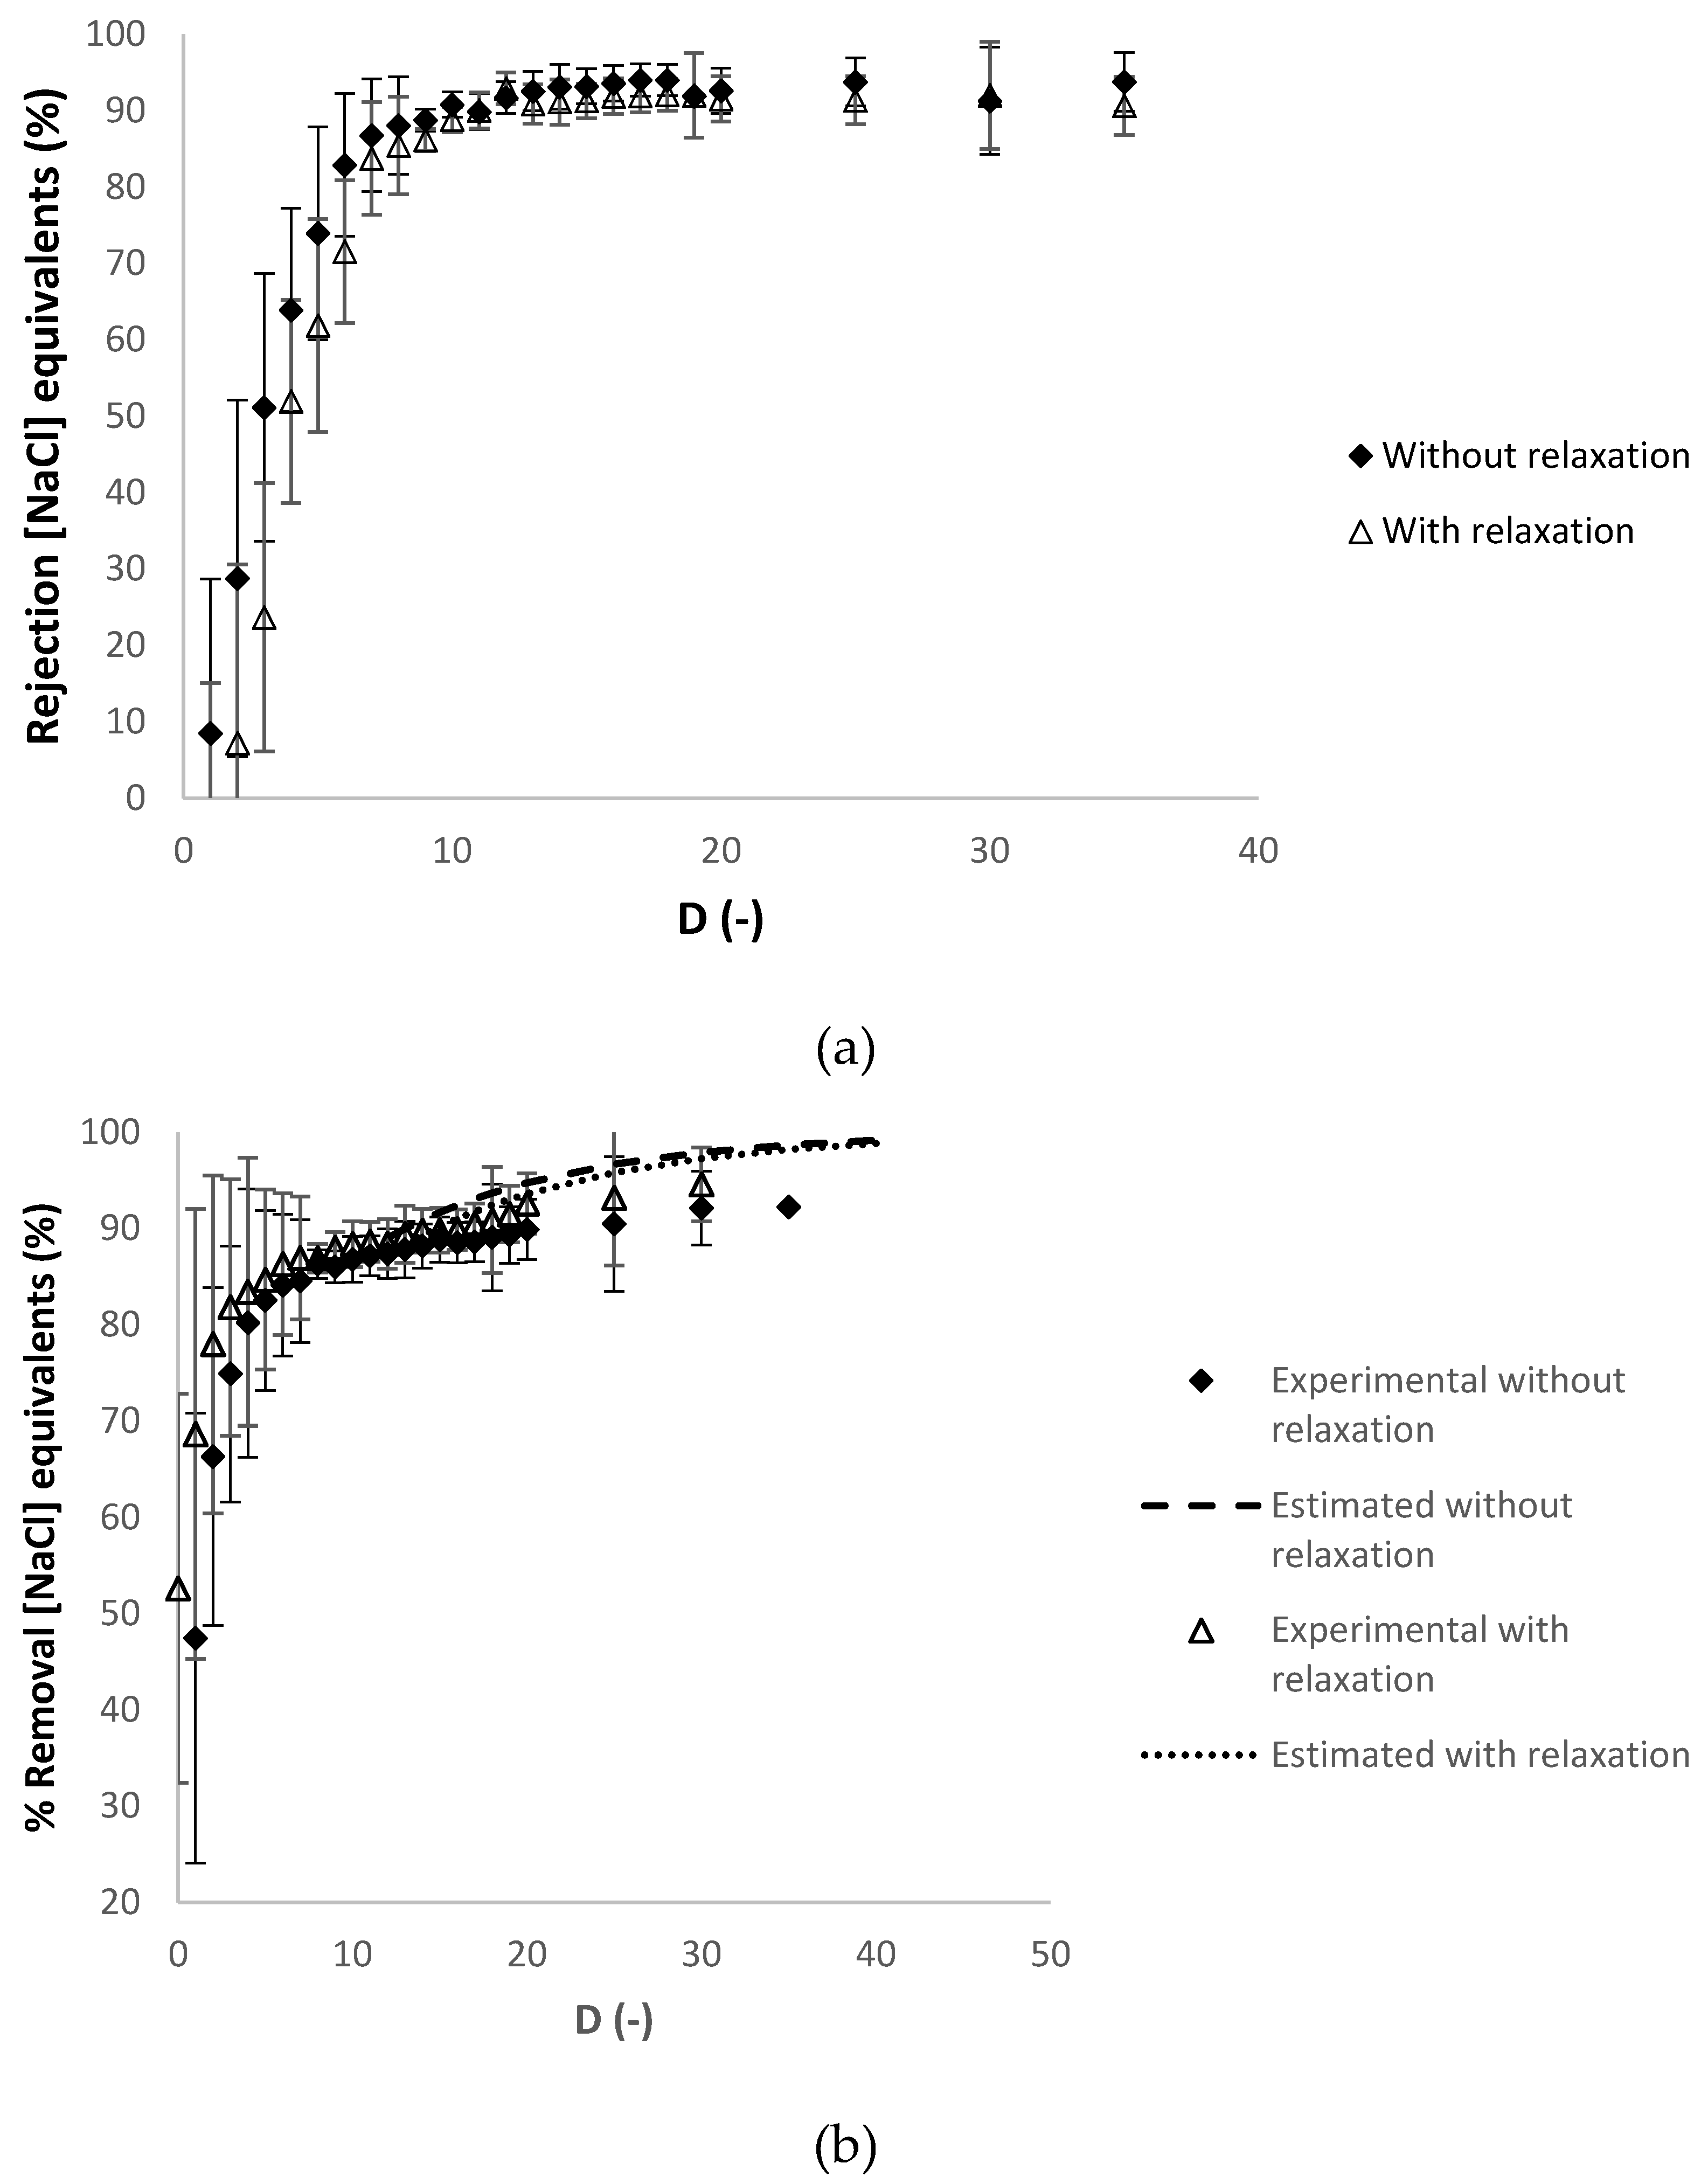
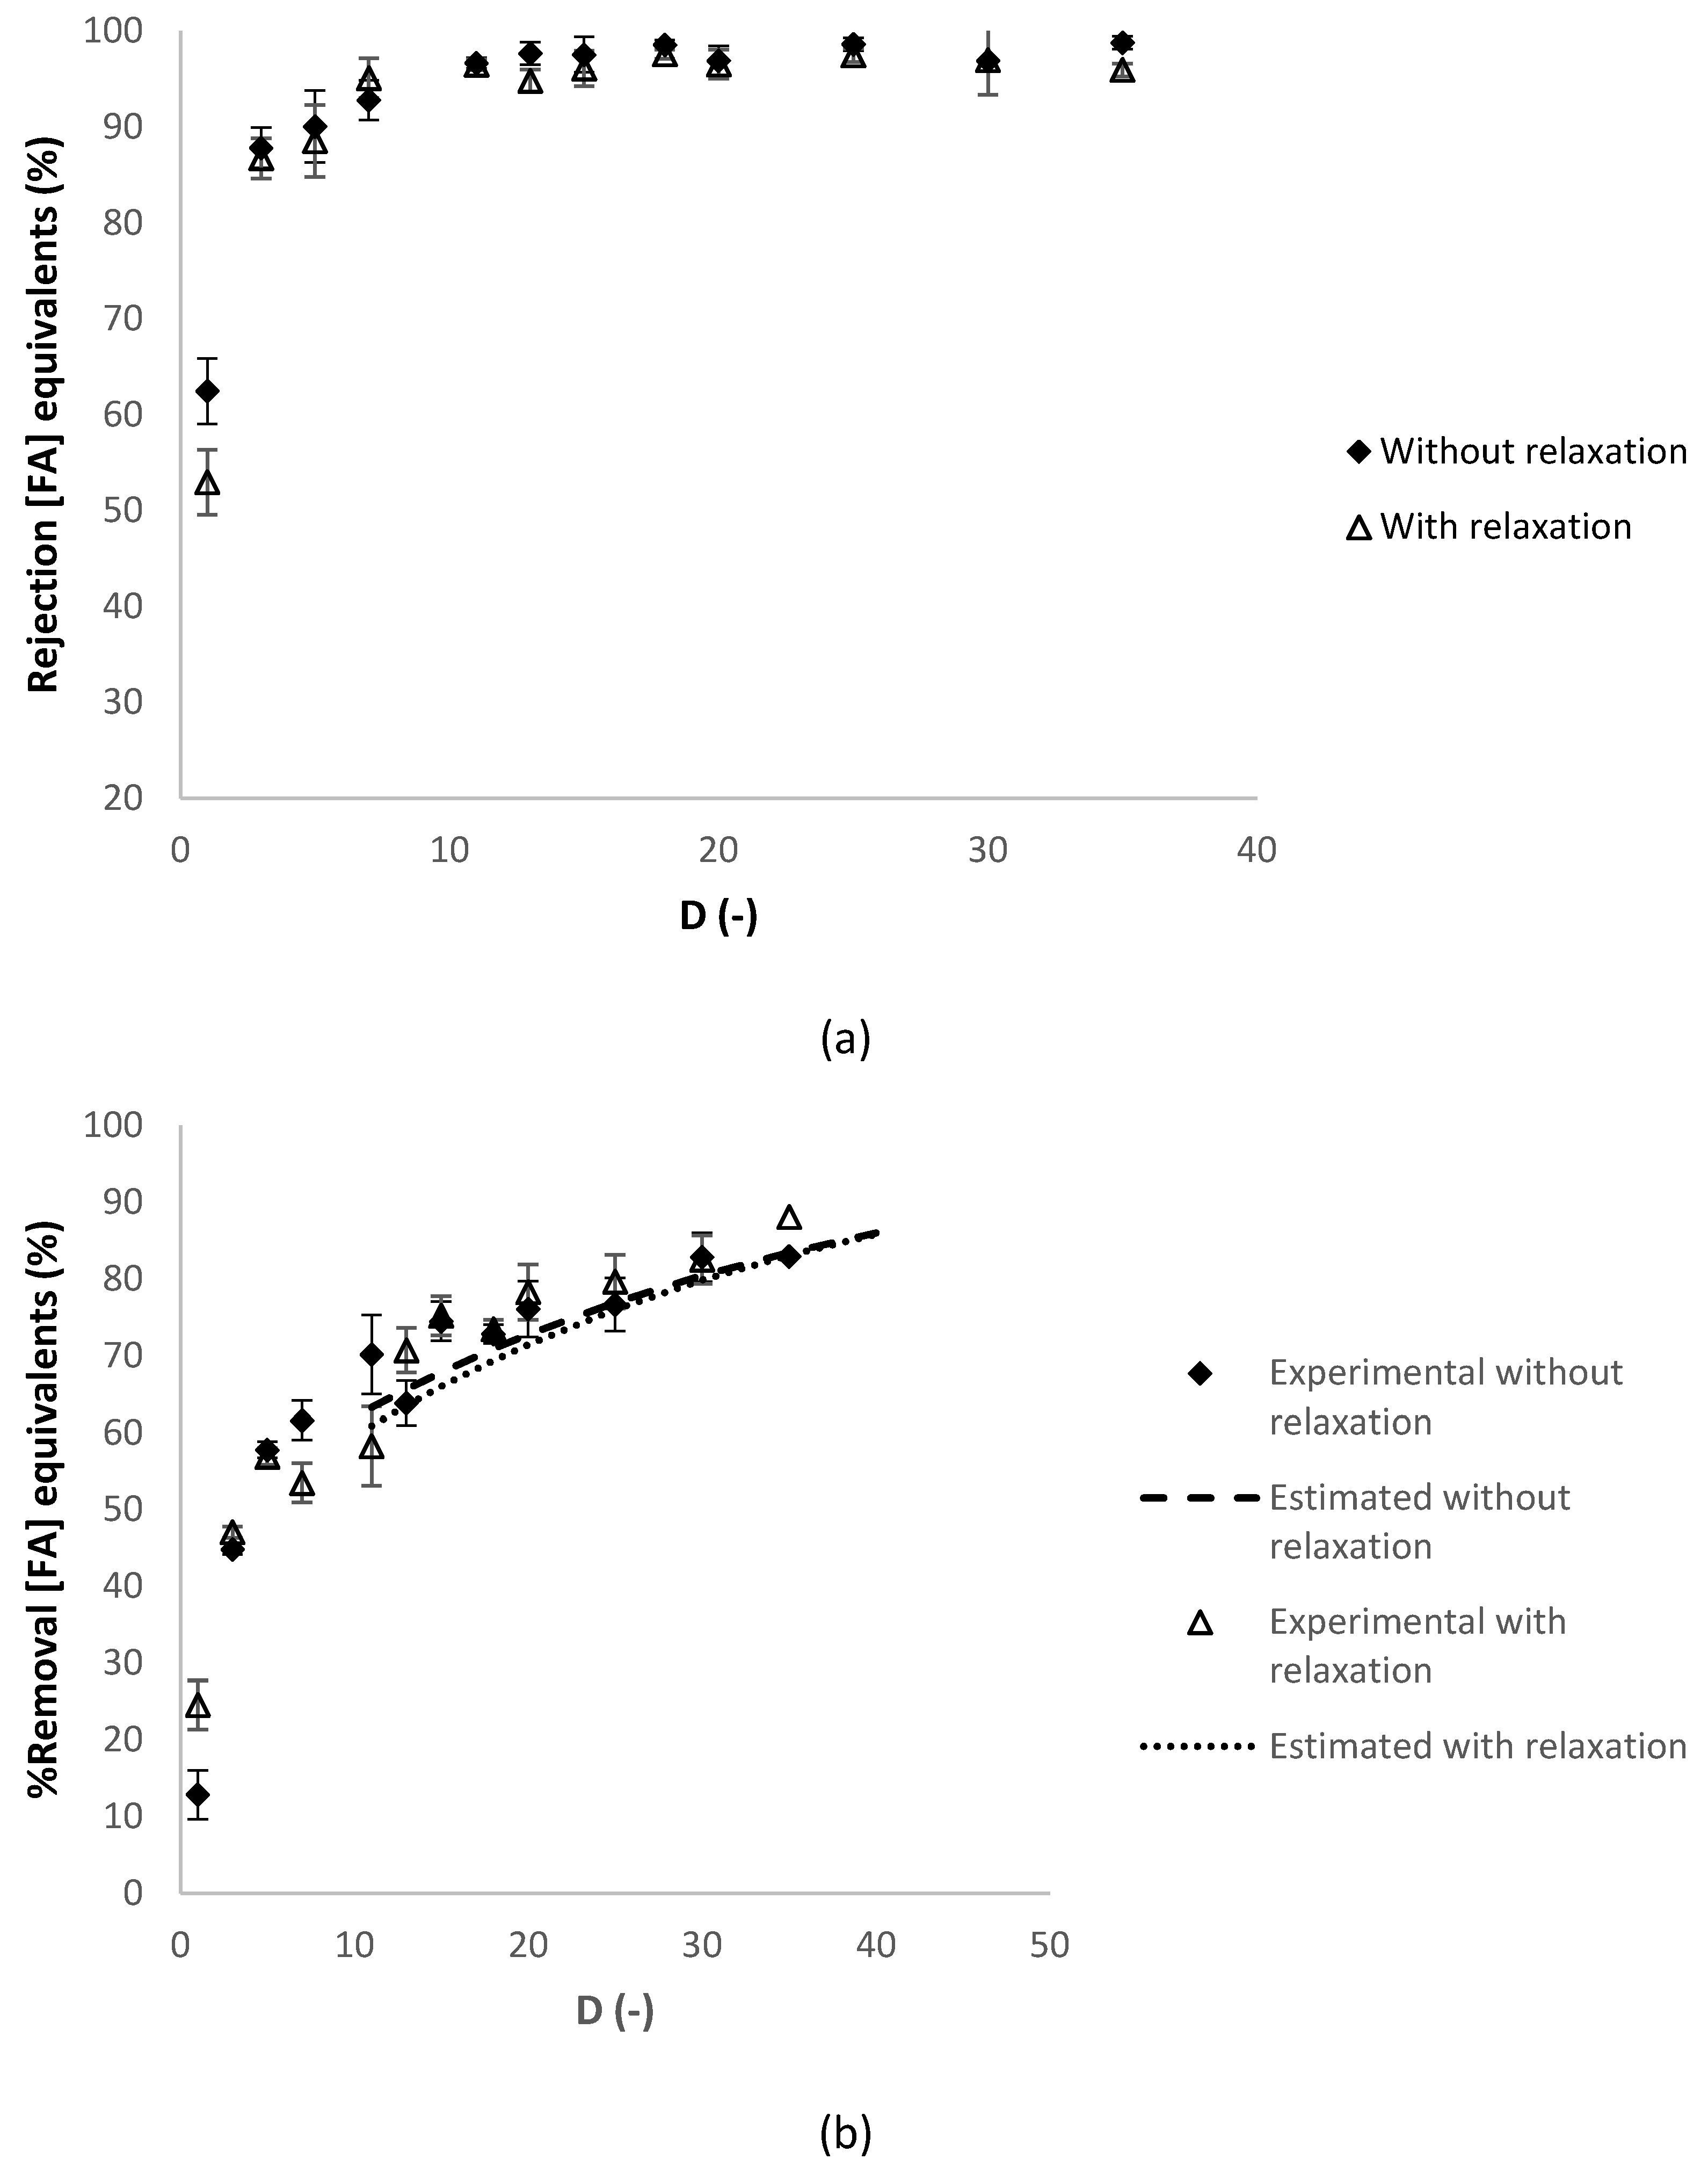
3.2.2. Effect of the Relaxation Procedure
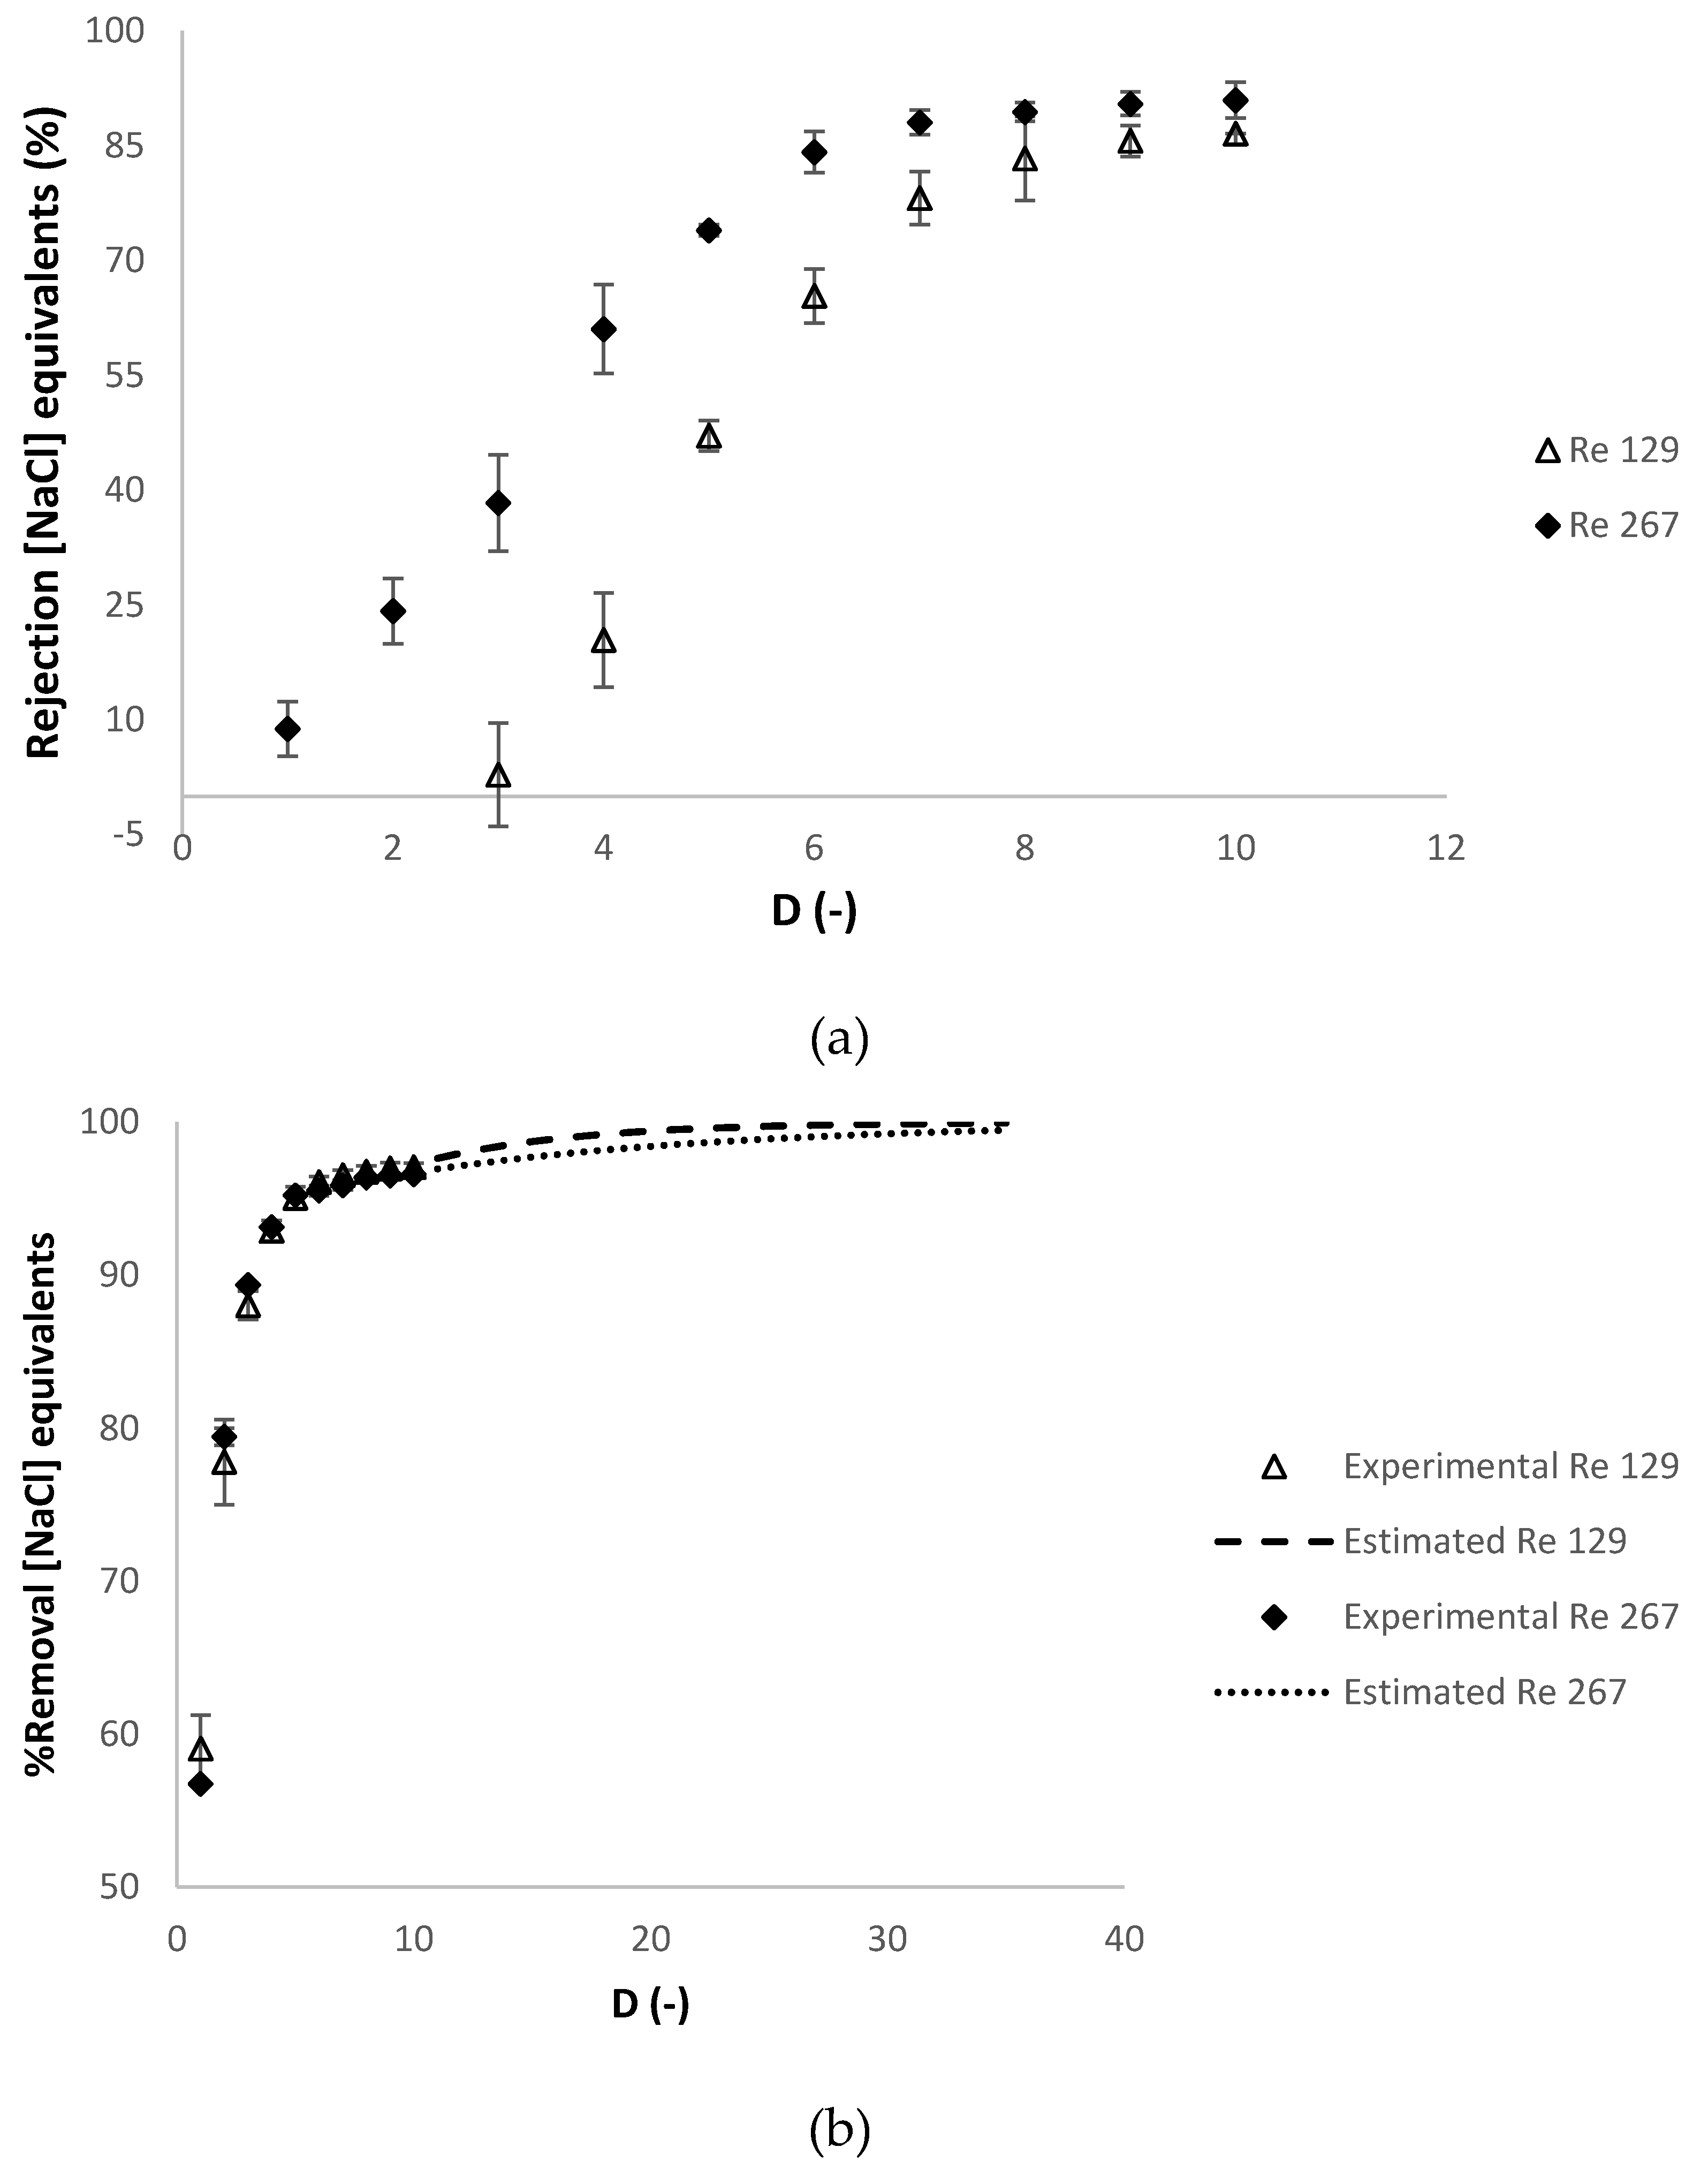
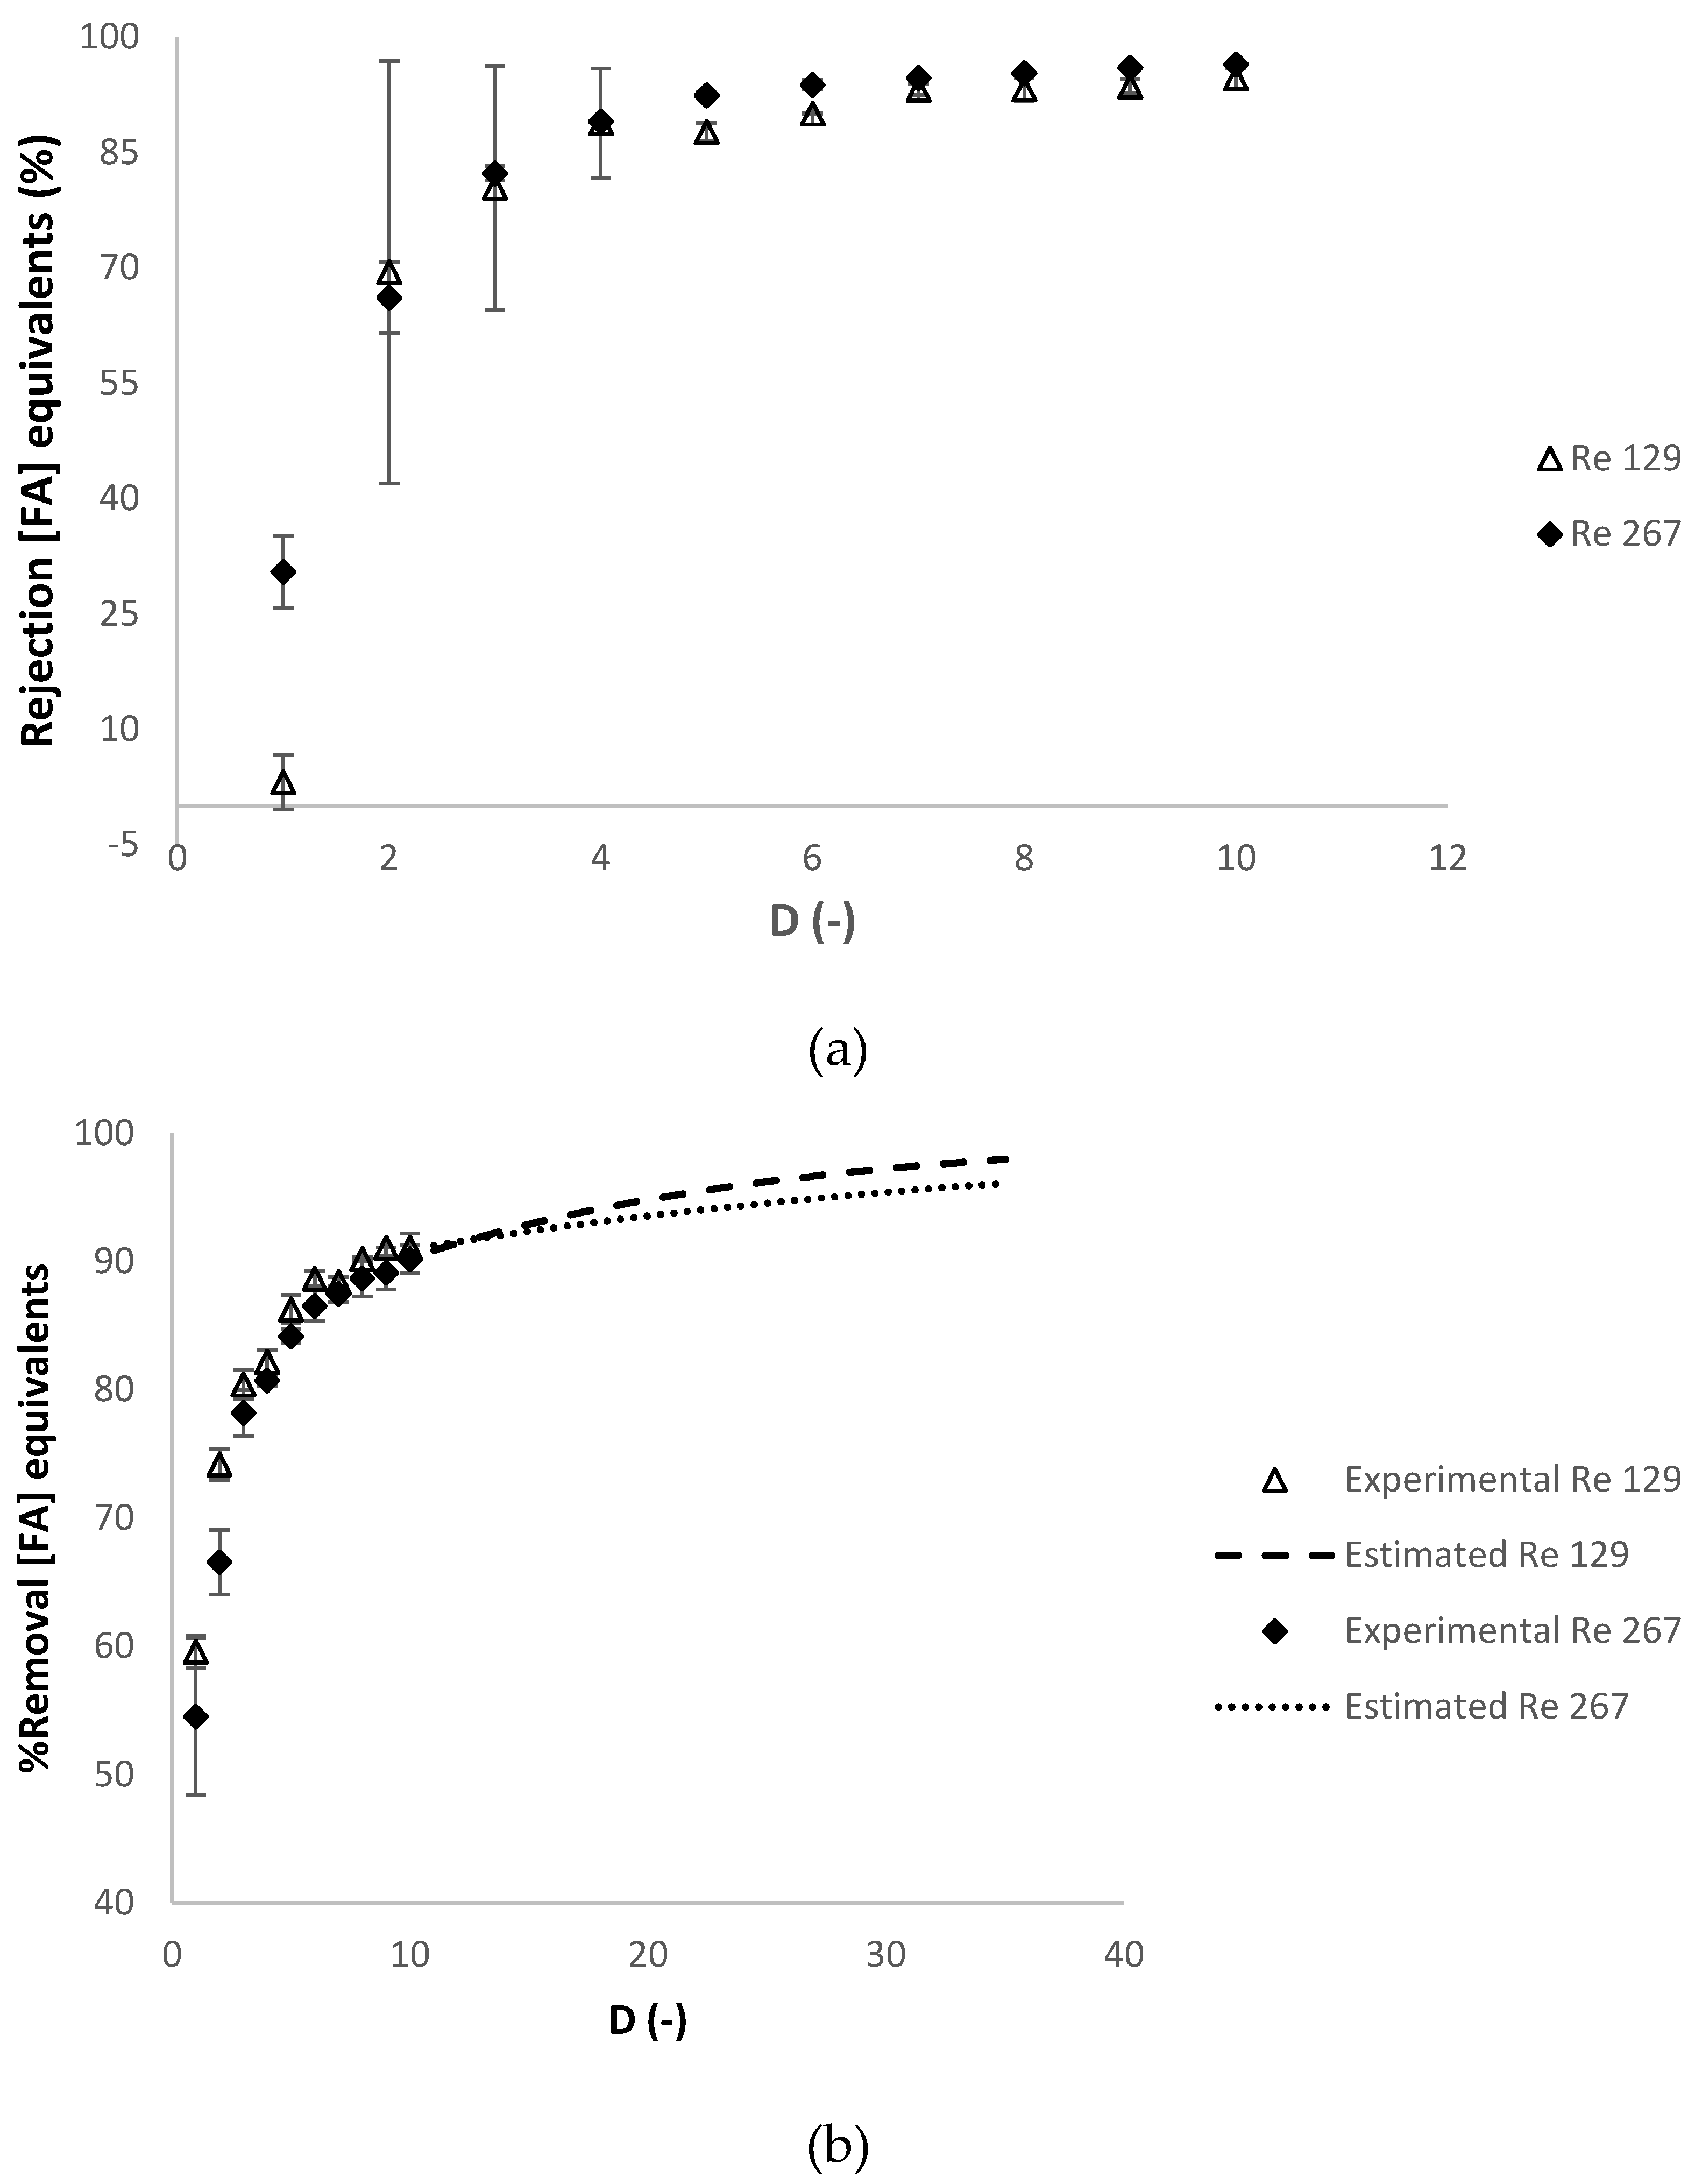
3.2.3. Effect of the Reynolds Number at the Feed Compartment Rfeed
3.3. Films Characterization
Thickness, Color and Morphology
3.4. Water Vapor Permeability
3.5. Mechanical Properties
Tensile Tests
3.6. Films’ Antioxidant Activity
4. Conclusions
Supplementary Materials
Author Contributions
Funding
Acknowledgments
Conflicts of Interest
References
- Yadav, A.; Mangaraj, S.; Singh, R.; Das, K.; Kumar, N.; Arora, S. Biopolymers as packaging material in food and allied industry. Int. J. Chem. Stud. 2018, 6, 2411–2418. [Google Scholar]
- Ferreira, A.R.V.; Alves, V.D.; Coelhoso, I.M. Polysaccharide-based membranes in food packaging applications. Membranes 2016, 6, 22. [Google Scholar] [CrossRef] [PubMed]
- Global Biopolymers Market Outlook, Trend and Opportunity Analysis, Competitive Insights, Actionable Segmentation & Forecast 2024. Available online: https://www.energiasmarketresearch.com/global-biopolymers-market-outlook/ (accessed on 2 April 2020).
- Edible Packaging Market by Material (Lipids, Polysaccharides, Proteins, Surfactants, and Composite Films), and End Users (Food & Beverages and Pharmaceuticals)—Global Opportunity Analysis and Industry Forecast, 2017–2023. Available online: https://www.alliedmarketresearch.com/edible-packaging-market (accessed on 2 April 2020).
- Persin, Z.; Stana-Kleinschek, K.; Foster, T.J.; Van Dam, J.E.G.; Boeriu, C.G.; Navard, P. Challenges and opportunities in polysaccharides research and technology: The EPNOE views for the next decade in the areas of materials, food and health care. Carbohydr. Polym. 2011, 84, 22–32. [Google Scholar] [CrossRef]
- Vartiainen, J.; Vähä-Nissi, M.; Harlin, A. Biopolymer Films and Coatings in Packaging Applications—A Review of Recent Developments. Mater. Sci. Appl. 2014, 5, 708–718. [Google Scholar] [CrossRef]
- Gouveia, T.I.A.; Biernacki, K.; Castro, M.C.R.; Gonçalves, M.P.; Souza, H.K.S. A new approach to develop biodegradable films based on thermoplastic pectin. Food Hydrocoll. 2019, 97, 105175. [Google Scholar] [CrossRef]
- Cheng, J.; Wang, H.; Kang, S.; Xia, L.; Jiang, S.; Chen, M.; Jiang, S. An active packaging film based on yam starch with eugenol and its application for pork preservation. Food Hydrocoll. 2019, 96, 546–554. [Google Scholar] [CrossRef]
- Ferreira, A.R.V.; Bandarra, N.M.; Moldão-Martins, M.; Coelhoso, I.M.; Alves, V.D. FucoPol and chitosan bilayer films for walnut kernels and oil preservation. LWT-Food Sci. Technol. 2018, 91, 34–39. [Google Scholar] [CrossRef]
- De Moraes Crizel, T.; de Oliveira Rios, A.; Alves, V.D.; Bandarra, N.; Moldão-Martins, M.; Hickmann Flôres, S. Active food packaging prepared with chitosan and olive pomace. Food Hydrocoll. 2018, 74, 139–150. [Google Scholar] [CrossRef]
- De Moraes Crizel, T.; de Oliveira Rios, A.; Alves, V.D.; Bandarra, N.; Moldão-Martins, M.; Hickmann Flôres, S. Biodegradable Films Based on Gelatin and Papaya Peel Microparticles with Antioxidant Properties. Food Bioprocess Technol. 2018, 11, 536–550. [Google Scholar] [CrossRef]
- Fundador, N.G.V.; Enomoto-Rogers, Y.; Takemura, A.; Iwata, T. Syntheses and characterization of xylan esters. Polym. (Guildf.) 2012, 53, 3885–3893. [Google Scholar] [CrossRef]
- Börjesson, M.; Westman, G.; Larsson, A.; Ström, A. Thermoplastic and Flexible Films from Arabinoxylan. ACS Appl. Polym. Mater. 2019, 1, 1443–1450. [Google Scholar] [CrossRef]
- Rose, D.J.; Inglett, G.E.; Liu, S.X. Utilisation of corn (Zea mays) bran and corn fiber in the production of food components. J. Sci. Food Agric. 2010, 90, 915–924. [Google Scholar] [CrossRef] [PubMed]
- Kale, M.S.; Yadav, M.P.; Chau, H.K.; Hotchkiss, A.T. Molecular and functional properties of a xylanase hydrolysate of corn bran arabinoxylan. Carbohydr. Polym. 2018, 181, 119–123. [Google Scholar] [CrossRef] [PubMed]
- Kale, M.S.; Hamaker, B.R.; Campanella, O.H. Alkaline extraction conditions determine gelling properties of corn bran arabinoxylans. Food Hydrocoll. 2013, 31, 121–126. [Google Scholar] [CrossRef]
- Yan, J.; Jia, X.; Feng, L.; Yadav, M.; Li, X.; Yin, L. Rheological and emulsifying properties of arabinoxylans from various cereal brans. J. Cereal Sci. 2019, 90, 102844. [Google Scholar] [CrossRef]
- Shi, L. Bioactivities, isolation and purification methods of polysaccharides from natural products: A review. Int. J. Biol. Macromol. 2016, 92, 37–48. [Google Scholar] [CrossRef]
- Ren, Y.; Bai, Y.; Zhang, Z.; Cai, W.; Del Rio Flores, A. The preparation and structure analysis methods of natural polysaccharides of plants and fungi: A review of recent development. Molecules 2019, 24, 3122. [Google Scholar] [CrossRef]
- Brou, A.; Jaffrin, M.Y.; Ding, L.H.; Courtois, J. Microfiltration and ultrafiltration of polysaccharides produced by fermentation using a rotating disk dynamic filtration system. Biotechnol. Bioeng. 2003, 82, 429–437. [Google Scholar] [CrossRef]
- Anderson, C.; Simsek, S. A novel combination of methods for the extraction and purification of arabinoxylan from byproducts of the cereal industry. J. Food Meas. Charact. 2019, 13, 1049–1057. [Google Scholar] [CrossRef]
- Cho, C.W.; Lee, D.Y.; Kim, C.W. Concentration and purification of soluble pectin from mandarin peels using crossflow microfiltration system. Carbohydr. Polym. 2003, 54, 21–26. [Google Scholar] [CrossRef]
- Resende, A.; Catarino, S.; Geraldes, V.; De Pinho, M. Separation and purification by ultrafiltration of white wine high molecular weight polysaccharides. Ind. Eng. Chem. Res. 2013, 52, 8875–8879. [Google Scholar] [CrossRef]
- Ferreira, A.R.V.; Torres, C.A.V.; Freitas, F.; Reis, M.A.M.; Vítor, D.; Coelhoso, I.M. Biodegradable films produced from the bacterial polysaccharide FucoPol. Int. J. Biol. Macromol. 2014, 71, 111–116. [Google Scholar] [CrossRef] [PubMed]
- Anderson, C.; Simsek, S. Mechanical profiles and topographical properties of films made from alkaline extracted arabinoxylans from wheat bran, maize bran, or dried distillers grain. Food Hydrocoll. 2019, 86, 78–86. [Google Scholar] [CrossRef]
- Stoklosa, R.J.; Latona, R.J.; Bonnaillie, L.M.; Yadav, M.P. Evaluation of arabinoxylan isolated from sorghum bran, biomass, and bagasse for film formation. Carbohydr. Polym. 2019, 213, 382–392. [Google Scholar] [CrossRef] [PubMed]
- Product Specifications of Laboratory and Pilot Scale Ultrafiltration Cartridge (UFP-100-C-6A). Available online: https://www.gelifesciences.com/en/us/shop/bioprocessing-filtration/tangential-flow-filtration/hollow-fiber-cartridges/laboratory-and-pilot-scale-ultrafiltration-hollow-fiber-cartridge-p-00452#tech-spec-table (accessed on 2 April 2020).
- Alves, V.D.; Costa, N.; Coelhoso, I.M. Barrier properties of biodegradable composite films based on kappa-carrageenan/pectin blends and mica flakes. Carbohydr. Polym. 2010, 79, 269–276. [Google Scholar] [CrossRef]
- Almanasrah, M.; Brazinha, C.; Kallioinen, M.; Duarte, L.C.; Roseiro, L.B.; Bogel-Lukasik, R.; Carvalheiro, F.; Mänttäri, M.; Crespo, J.G. Nanofiltration and reverse osmosis as a platform for production of natural botanic extracts: The case study of carob by-products. Sep. Purif. Technol. 2015, 149, 389–397. [Google Scholar] [CrossRef]
- Ferreira, A.R.V.; Torres, C.A.V.; Freitas, F.; Sevrin, C.; Grandfils, C.; Reis, M.A.M.; Alves, V.D.; Coelhoso, I.M. Development and characterization of bilayer films of FucoPol and chitosan. Carbohydr. Polym. 2016, 147, 8–15. [Google Scholar] [CrossRef]
- Péroval, C.; Debeaufort, F.; Despré, D.; Voilley, A. Edible Arabinoxylan-Based Films. 1. Effects of Lipid Type on Water Vapor Permeability, Film Structure, and Other Physical Characteristics. J. Agric. Food Chem. 2002, 50, 3977–3983. [Google Scholar] [CrossRef]
- Park, H.J.; Weller, C.L.; Vergano, P.J.; Testin, R.F. Permeability and Mechanical Properties of Cellulose-Based Edible Films. J. Food Sci. 1993, 58, 1361–1364. [Google Scholar] [CrossRef]


| Operating Conditions Involved | Temperature (°C) | Relaxation Procedure 1 | Refeed (-) |
|---|---|---|---|
| Temperature (°C) | 30; 40; 50 | 40 | 40 |
| Relaxation procedure | No relaxation | No relaxation, Relaxation cycles | No relaxation |
| Mode of operation | At Jperm of 18.8 L·h−1·m−2 | At Jperm of 18.8 L·h−1·m−2 | Under controlled Jperm of 19.0 and 27.0 L·h−1·m−2 |
| Refeed (-) | 154; 184; 217 | 184 | 129; 267 |
| Operating Conditions Imposed | Hydraulic Permeability Loss (%) 1 | TMP (bar) | Refeed (-) | Average Permeability (L·h−1·m−2·bar−1) |
|---|---|---|---|---|
| T: 30 ± 2 °C | 84 ± 1 | 0.44 ± 0.01 | 154 | 42.4 ± 0.2 |
| T: 40 ± 2 °C | 82 ± 2 | 0.46 ± 0.03 | 184 | 43.8 ± 0.1 |
| T: 50 ± 4 °C | 81 ± 5 | 0.41 ± 0.01 | 217 | 45.7 ± 0.4 |
| Operating Conditions Imposed | Hydraulic Permeability Loss (%) 1 | TMP (bar) | Average Permeability (L·h−1·m−2·bar) |
|---|---|---|---|
| Without relaxation | 82 ± 2 | 0.46 ± 0.03 | 43.8 ± 0.1 |
| With relaxation | 73 ± 2 | 0.40 ± 0.03 | 52.7 ± 0.1 |
| Operating Conditions Imposed | Hydraulic Permeability Loss (%) 1 | TMP (bar) | Jperm (L·h−1·m−2) | Average Permeability (L·h−1·m−2·bar) |
|---|---|---|---|---|
| Under controlled Jperm and Re = 129 | 59 ± 12 | 0.31 ± 0.03 | 19.0 | 62.2 ± 0.4 |
| Under controlled Jperm and Re = 267 | 91 ± 3 | 0.60 ± 0.04 | 27.0 | 43.9 ± 2.8 |
| Films | a * | b * | L * | h° |
|---|---|---|---|---|
| Arabinoxylans + 30% (w/w dry basis) glycerol | 2.5 ± 1.05 | 42.54 ± 3.35 | 73.55 ± 2.98 | 86.64 ± 1.28 |
| Arabinoxylan + 30% (w/w dry basis) glycerol + 10% (w/w solution) ferulic acid | 1.78 ± 0.04 | 37.83 ± 0.51 | 76.27 ± 0.31 | 87.28 ± 0.04 |
| Film | Thickness (μm) | WVP (×10−11 mol·m·m−2 s−1 Pa) |
|---|---|---|
| Arabinoxylans + 30% (w/w dry basis) glycerol | 90.0 ± 10.17 | 0.62 ± 0.02 |
| Arabinoxylans + 30% (w/w dry basis) glycerol + 10% (w/w dry basis) ferulic acid equivalents | 89.0 ± 35.81 | 2.06 ± 0.29 |
| Arabinoxylans + 15% (w/w dry basis) glycerol [31] | 90.8 ± 6.60 | 0.98 ± 0.03 |
| Cellophane [31] | 20 | 0.38 ± 0.04 |
| LDPE [31] | 25 | 0.01 ± 0.01 |
| Films | Thickness (μm) | Stress at Break (MPa) | Deformation at Break (%) | Young Modulus (MPa) |
|---|---|---|---|---|
| Arabinoxylans + 30% (w/w dry basis) glycerol | 90.0 ± 10.2 | 21.7 ± 2.8 | 10.0 ± 1.0 | 274.5 ± 32.1 |
| Arabinoxylans + 30% (w/w dry basis) glycerol + 10% (w/w dry basis) ferulic acid equivalents | 89.0 ± 35.8 | 25.8 ± 3.1 | 17.0 ± 4.0 | 246.1 ± 35.2 |
| Arabinoxylan + 15% (w/w dry basis) glycerol [31] | 90.8 ± 6.6 | 26.5 ± 4.1 | 7.4 ± 2.9 | 72.4 ± 35.2 |
| Cellophane [31] | 20 | 114 | 20 | - |
| LDPE [31,32] | 25 | 13.1–27.6 | 100–965 | - |
© 2020 by the authors. Licensee MDPI, Basel, Switzerland. This article is an open access article distributed under the terms and conditions of the Creative Commons Attribution (CC BY) license (http://creativecommons.org/licenses/by/4.0/).
Share and Cite
Serra, M.; Weng, V.; Coelhoso, I.M.; Alves, V.D.; Brazinha, C. Purification of Arabinoxylans from Corn Fiber and Preparation of Bioactive Films for Food Packaging. Membranes 2020, 10, 95. https://doi.org/10.3390/membranes10050095
Serra M, Weng V, Coelhoso IM, Alves VD, Brazinha C. Purification of Arabinoxylans from Corn Fiber and Preparation of Bioactive Films for Food Packaging. Membranes. 2020; 10(5):95. https://doi.org/10.3390/membranes10050095
Chicago/Turabian StyleSerra, Maria, Verónica Weng, Isabel M. Coelhoso, Vitor D. Alves, and Carla Brazinha. 2020. "Purification of Arabinoxylans from Corn Fiber and Preparation of Bioactive Films for Food Packaging" Membranes 10, no. 5: 95. https://doi.org/10.3390/membranes10050095
APA StyleSerra, M., Weng, V., Coelhoso, I. M., Alves, V. D., & Brazinha, C. (2020). Purification of Arabinoxylans from Corn Fiber and Preparation of Bioactive Films for Food Packaging. Membranes, 10(5), 95. https://doi.org/10.3390/membranes10050095