Influence of Ozone Treatment on Ultrafiltration Performance and Nutrient Flow in a Membrane Based Nutrient Recovery Process from Anaerobic Digestate


Abstract
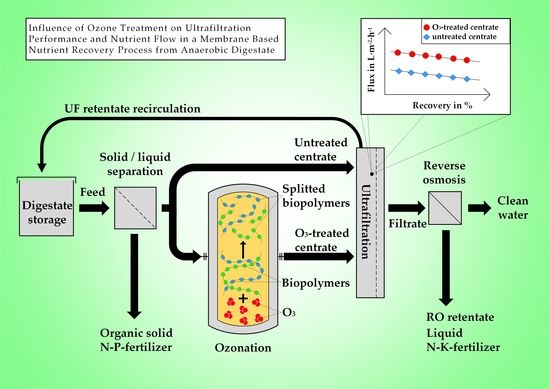
1. Introduction
2. Materials and Methods
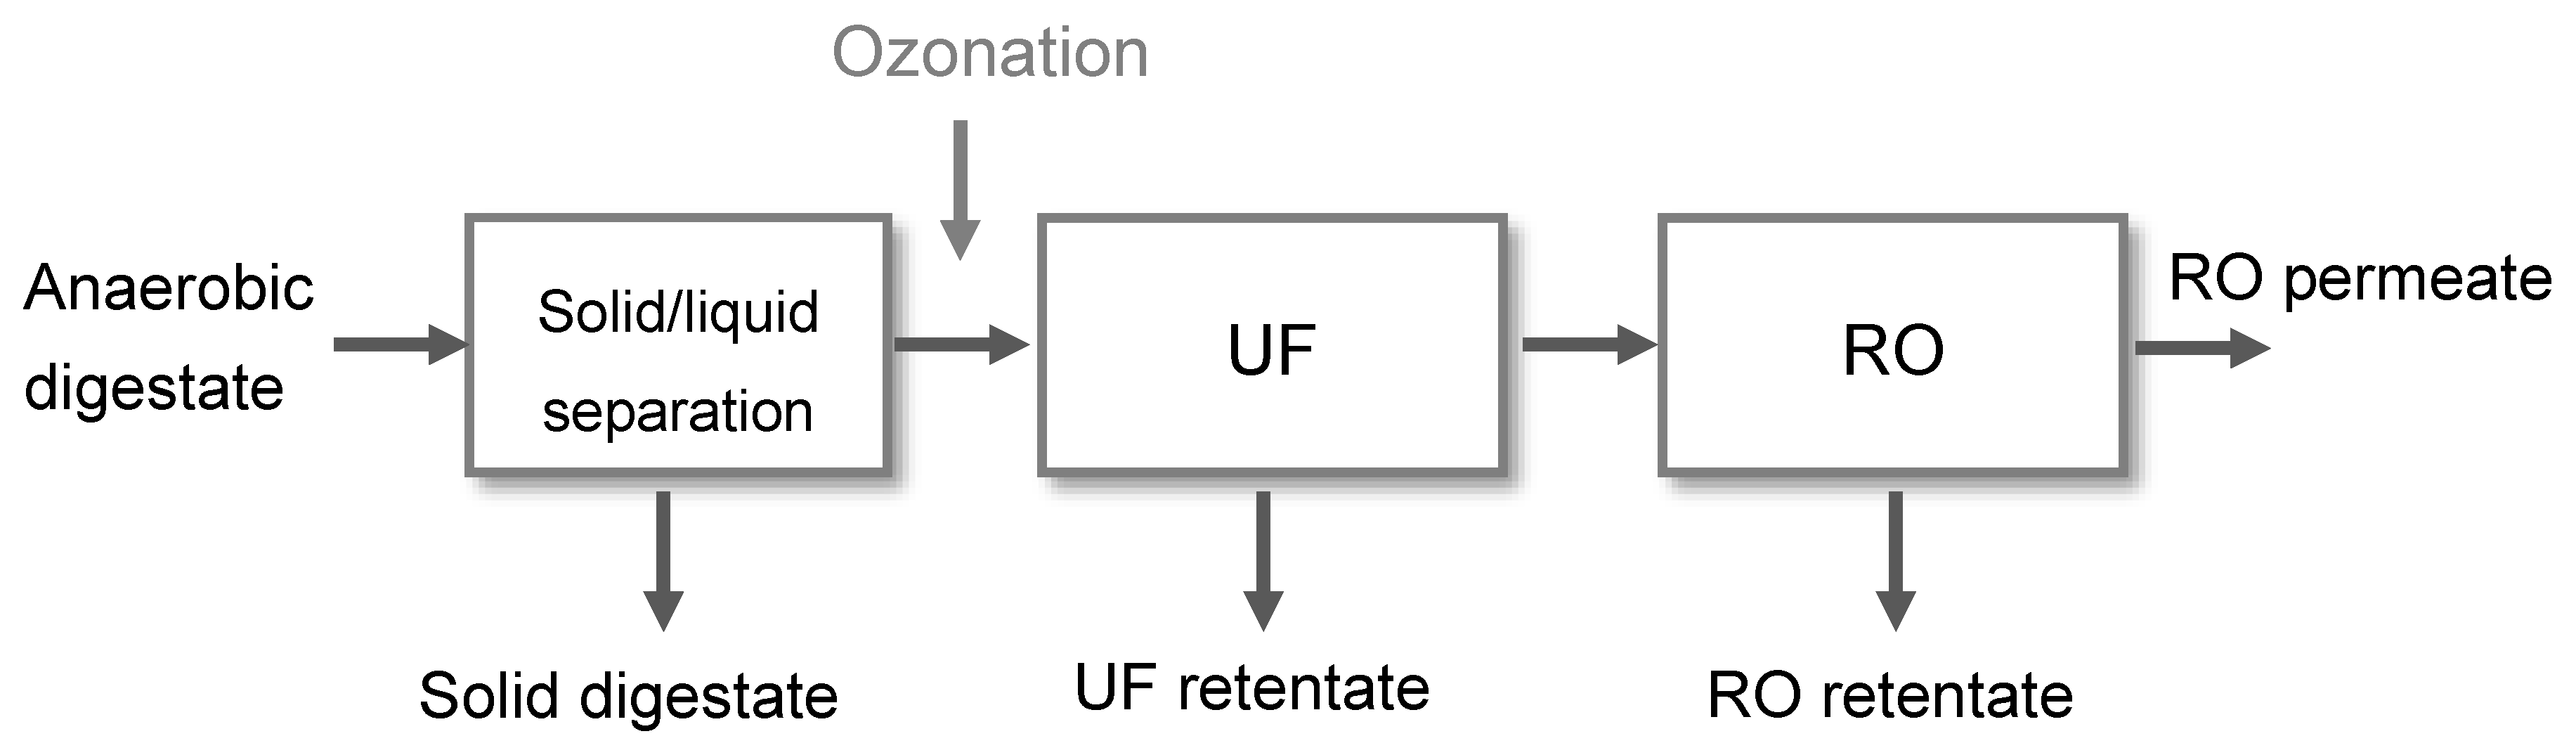
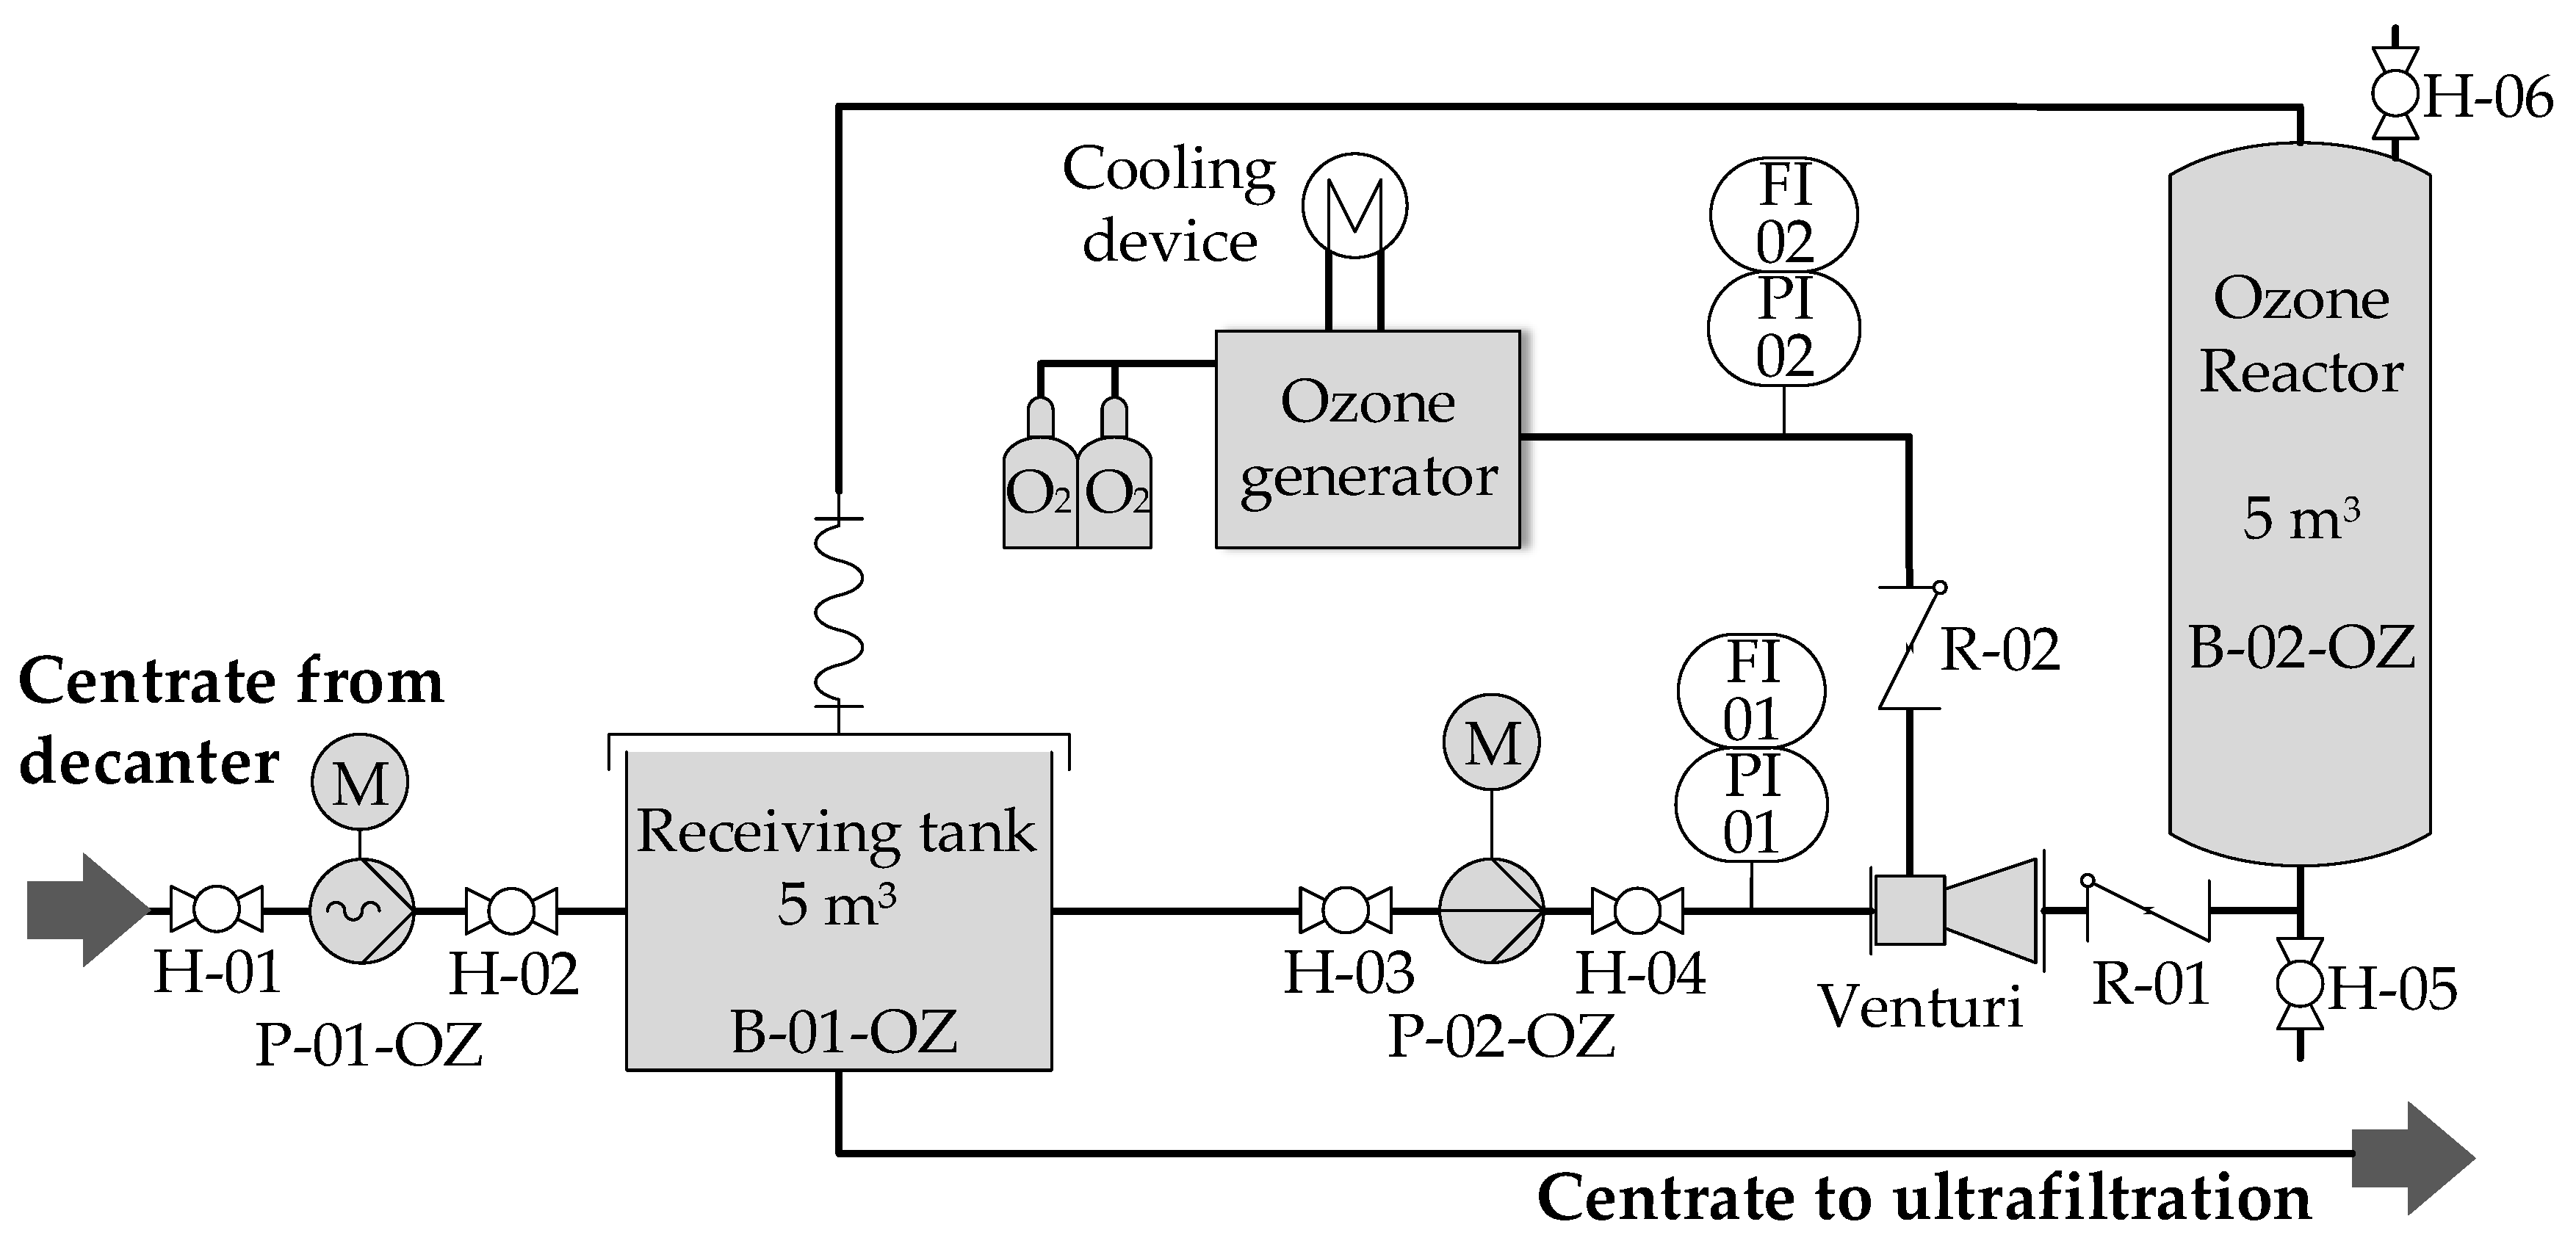
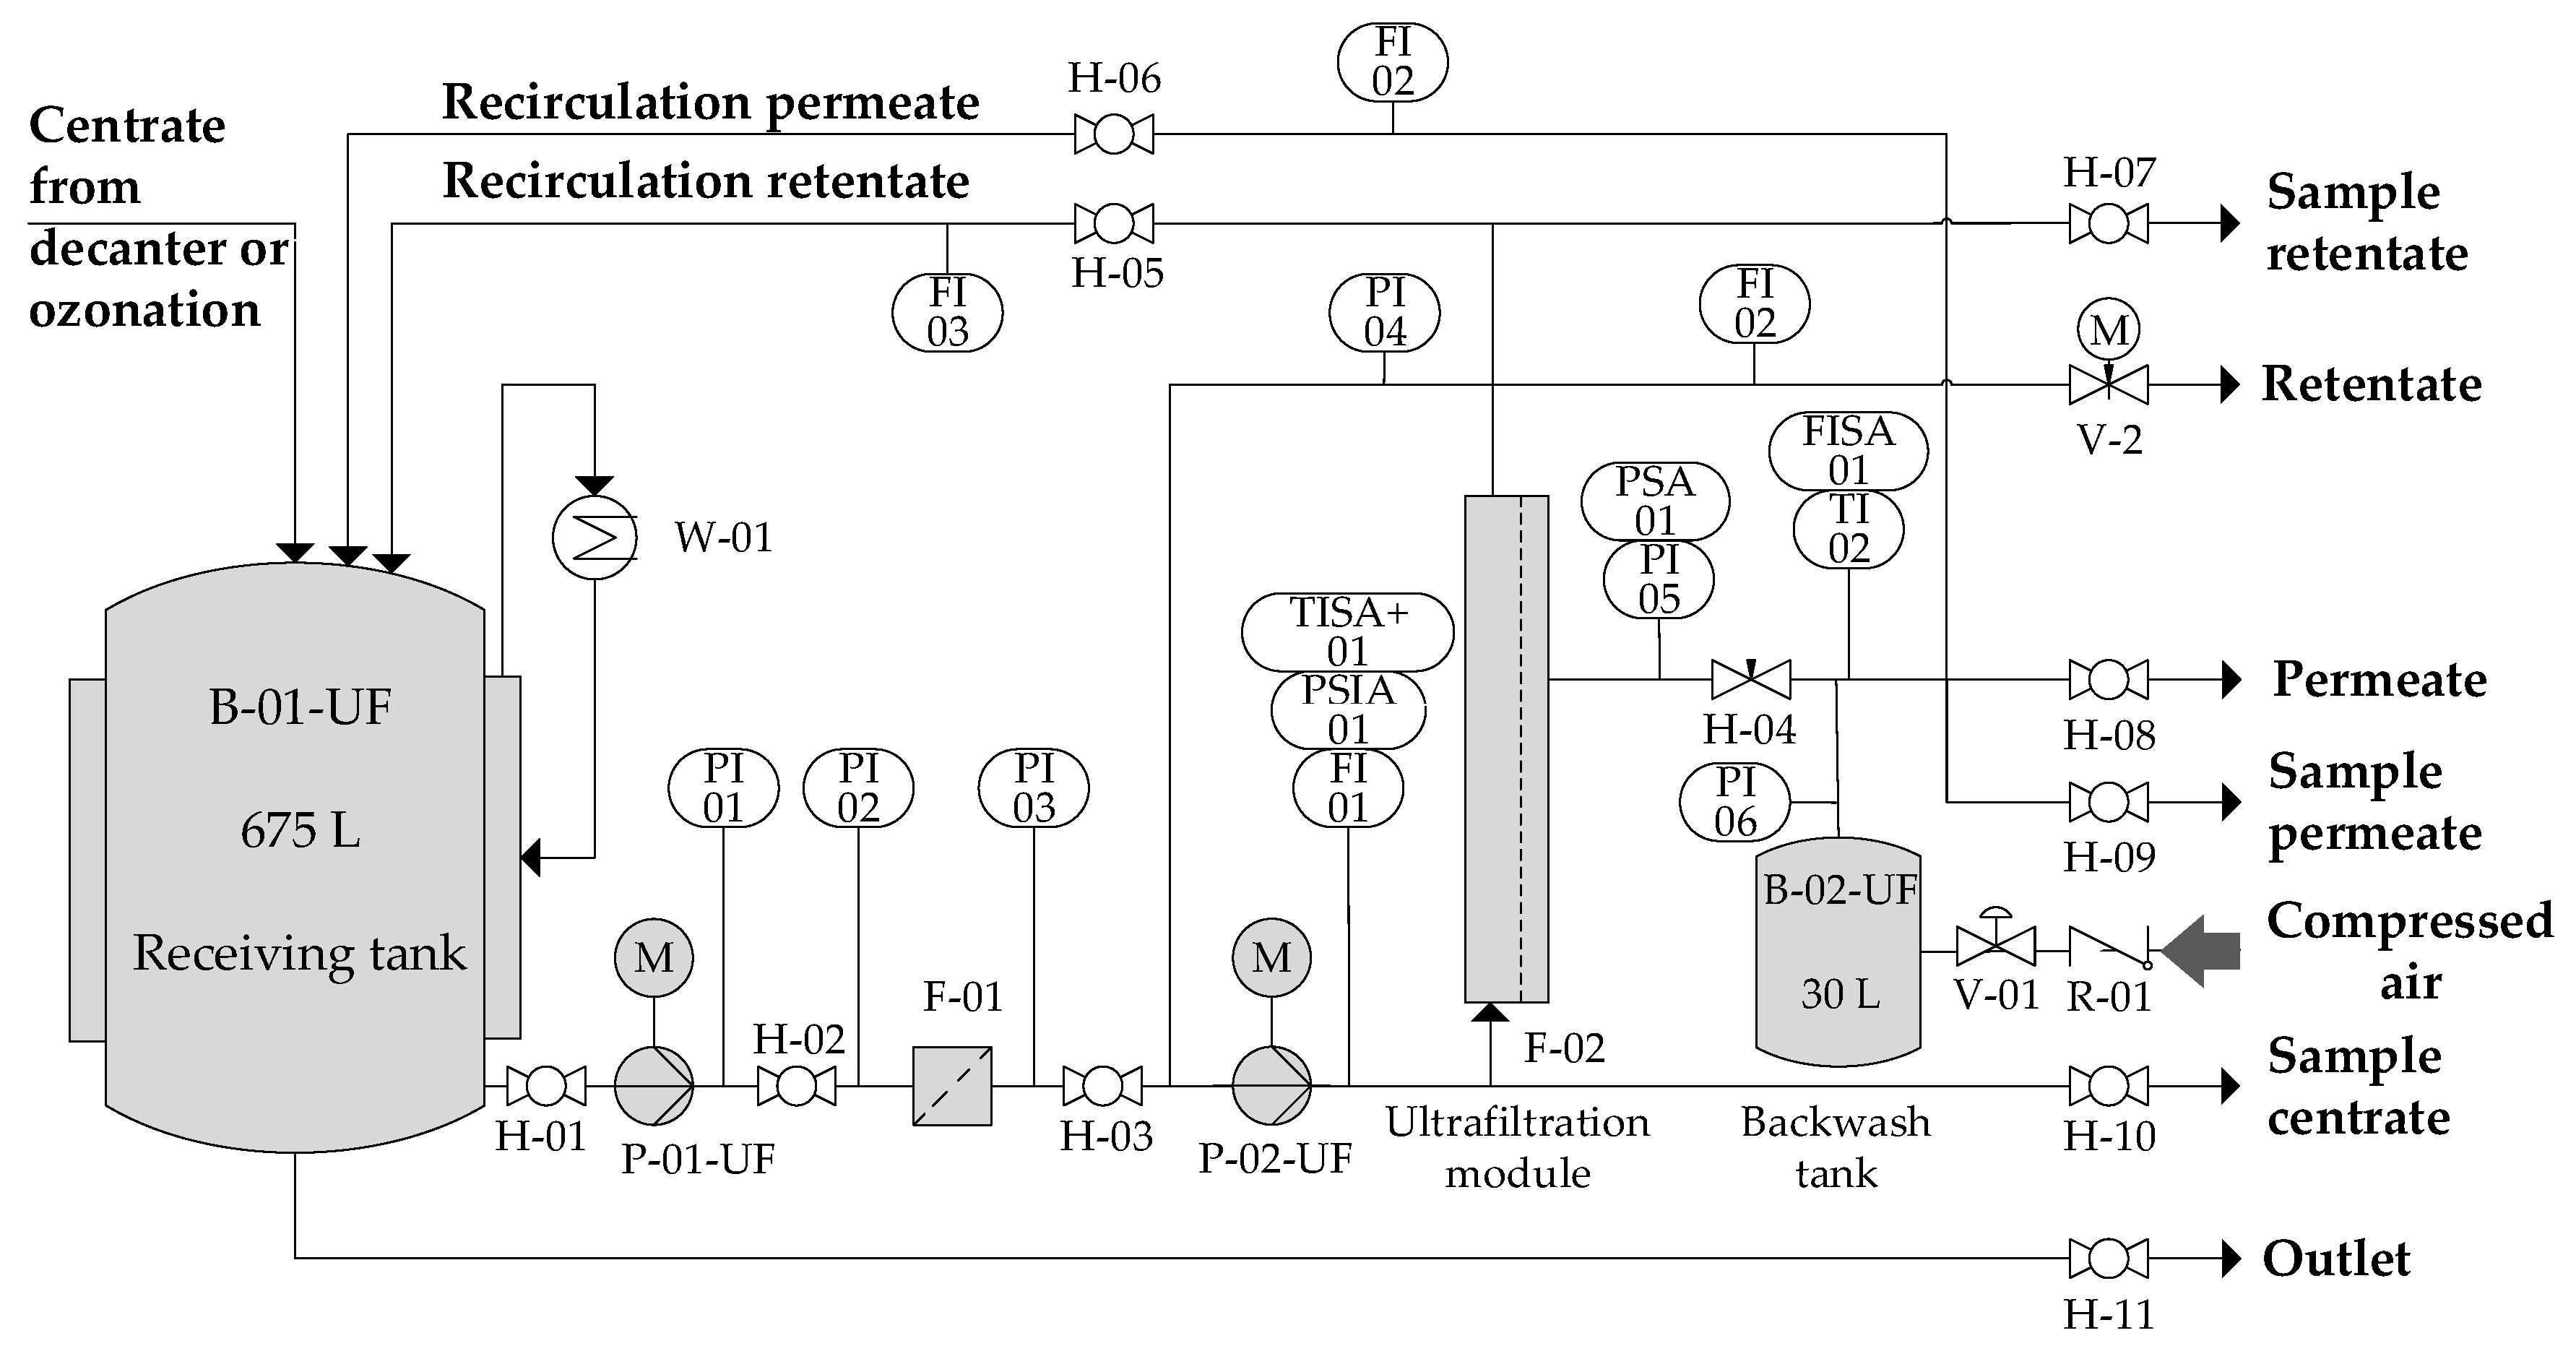
2.1. Experimental Set-Up
2.2. Analysis and Instrumentation
3. Results and Discussion
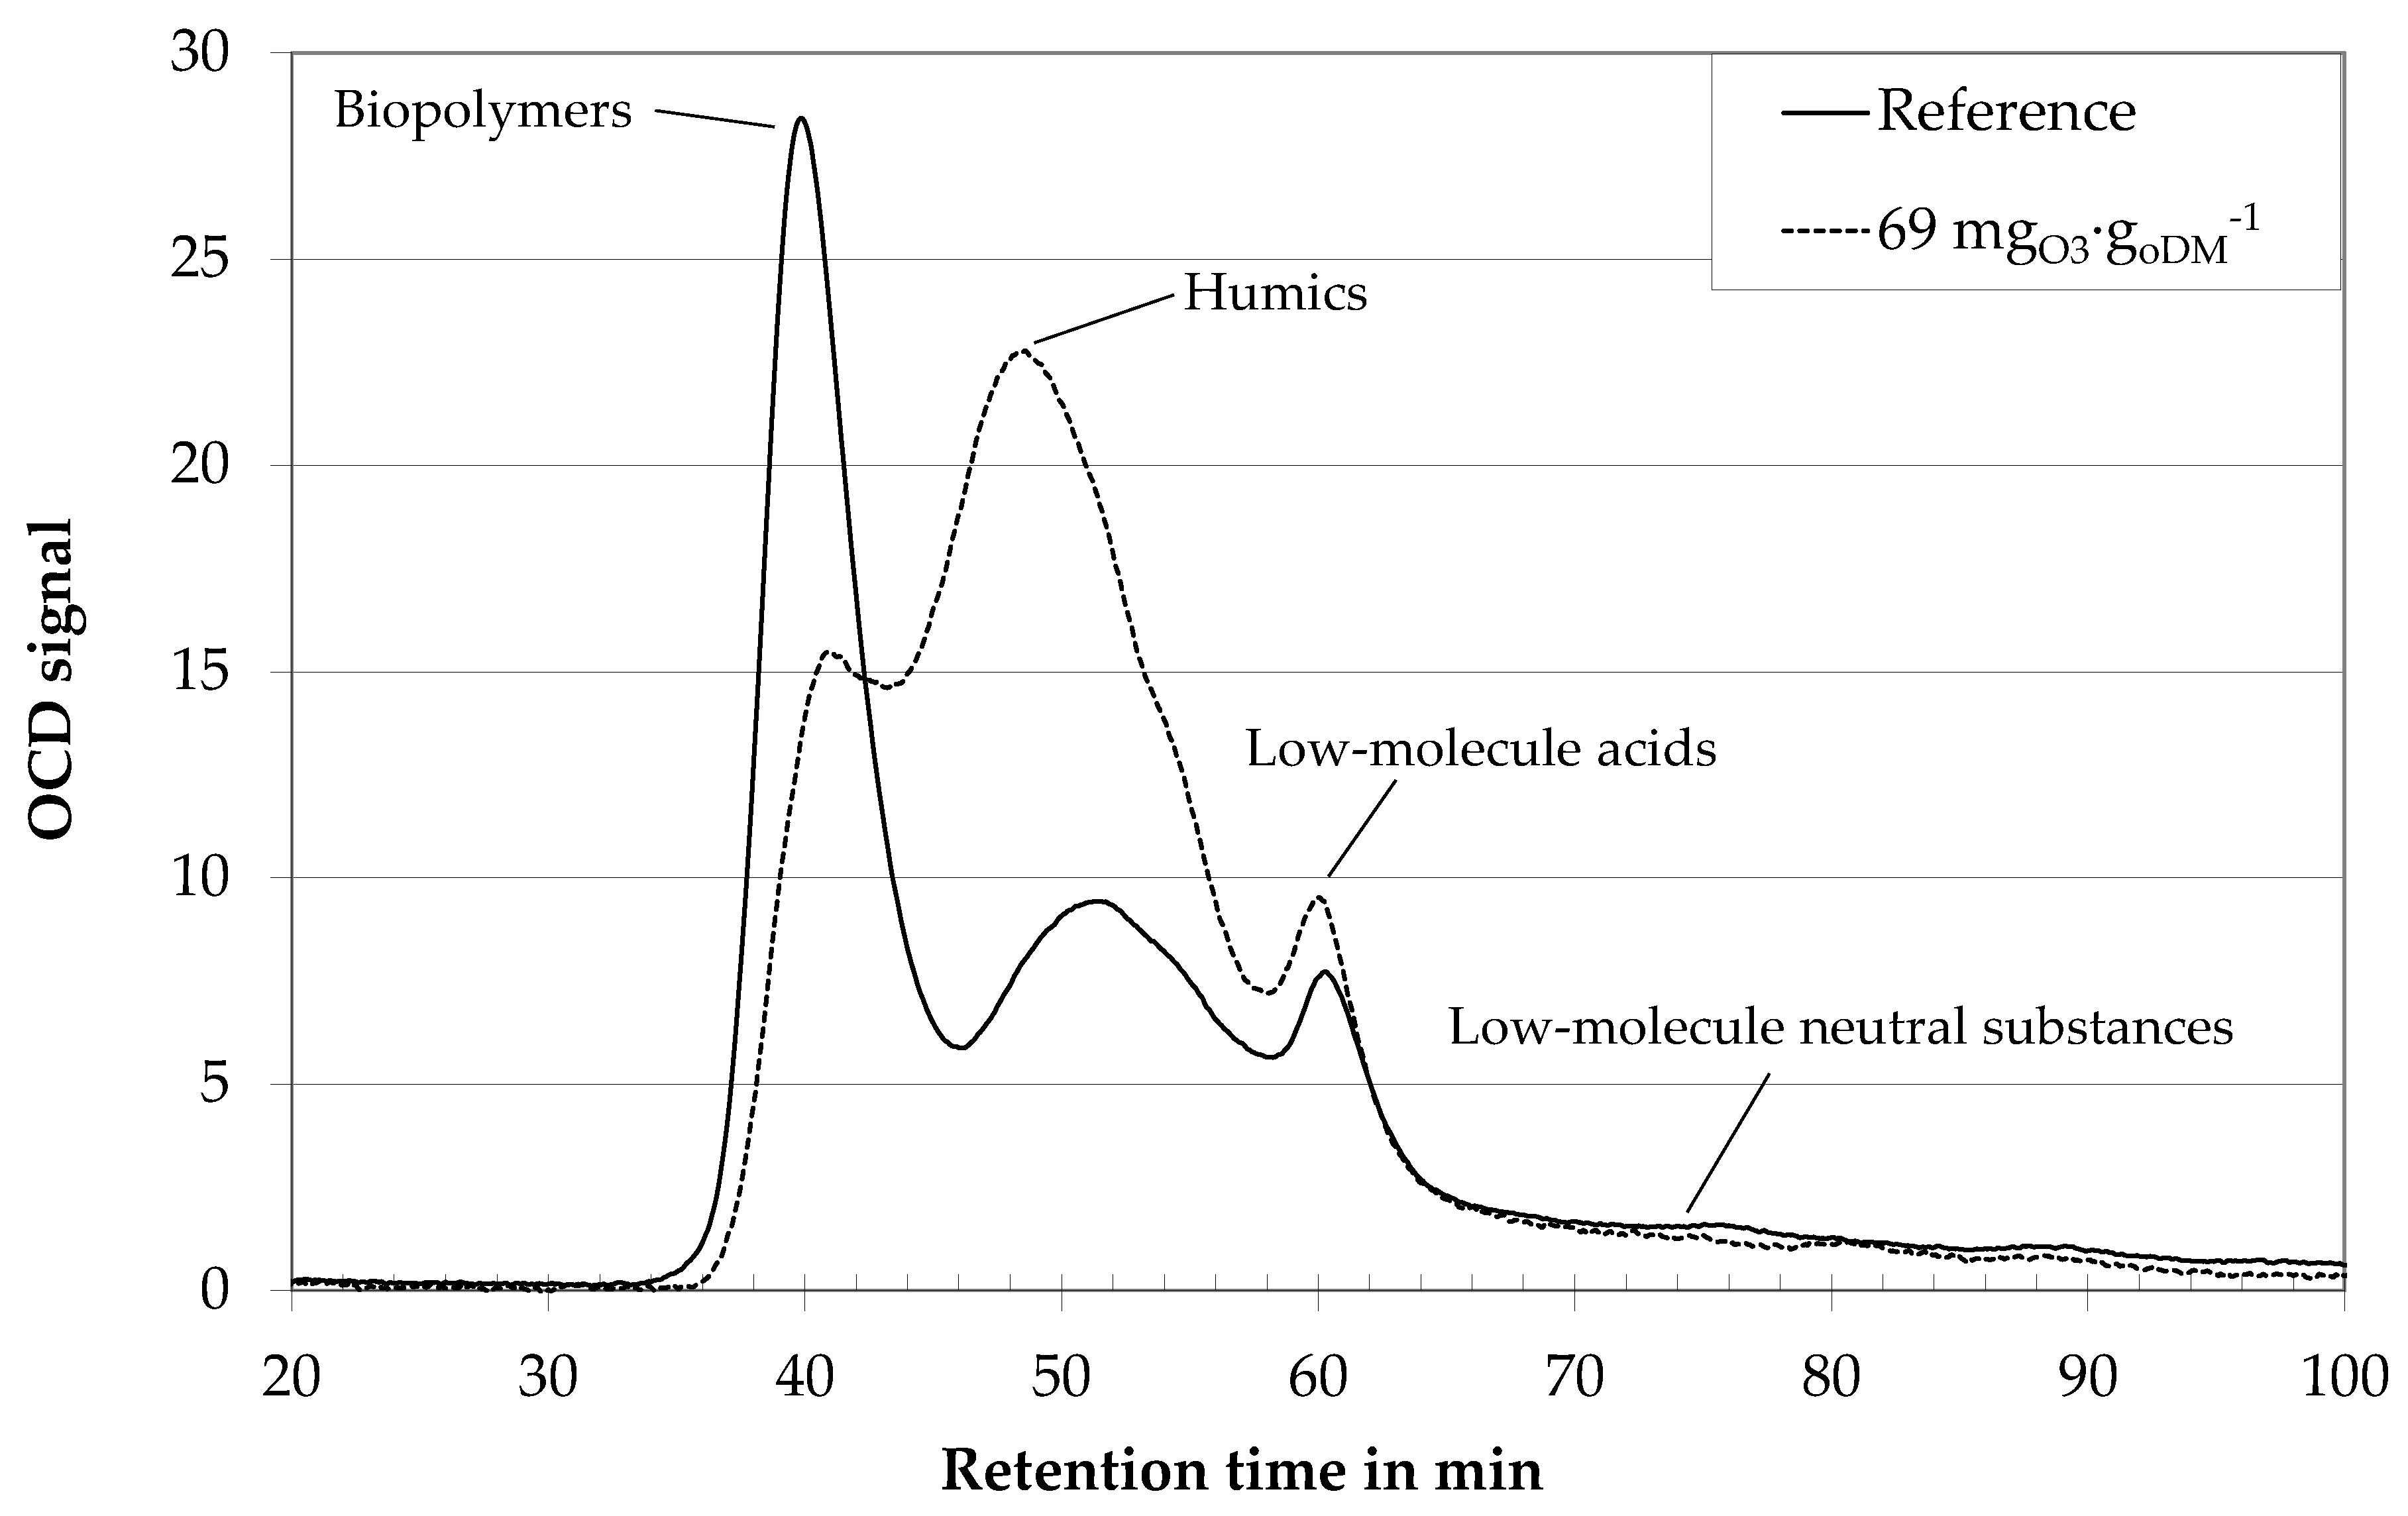
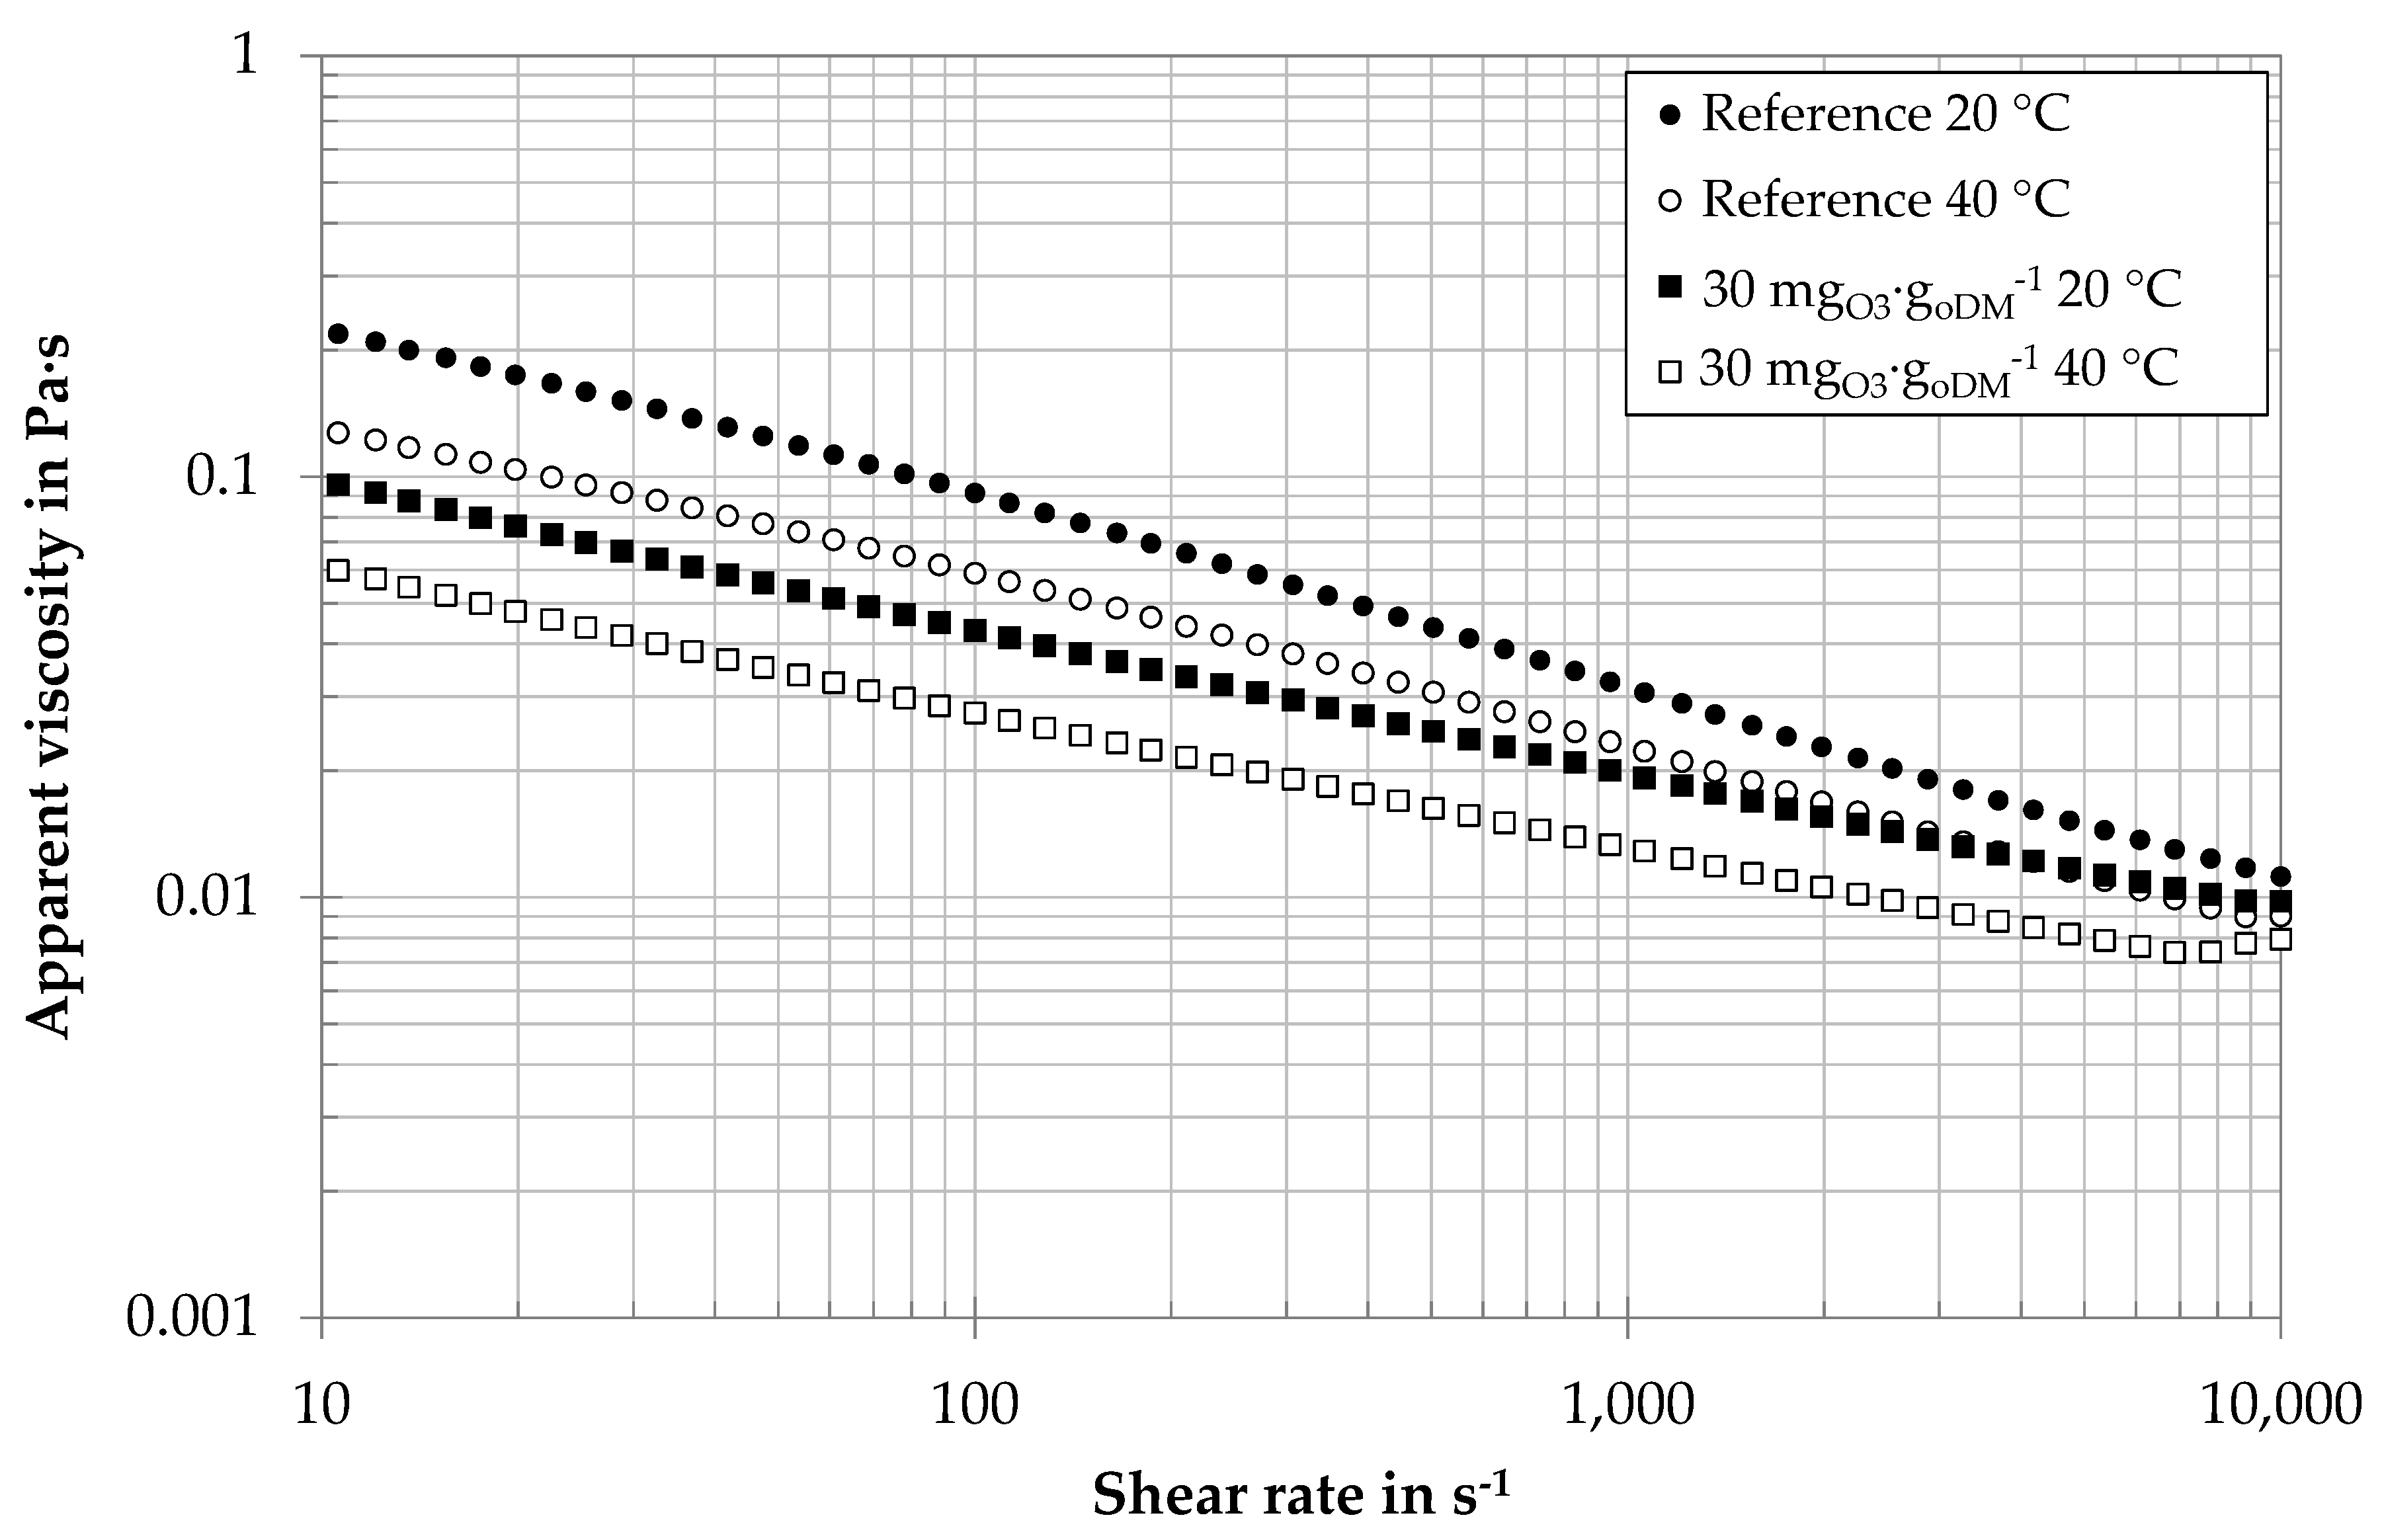
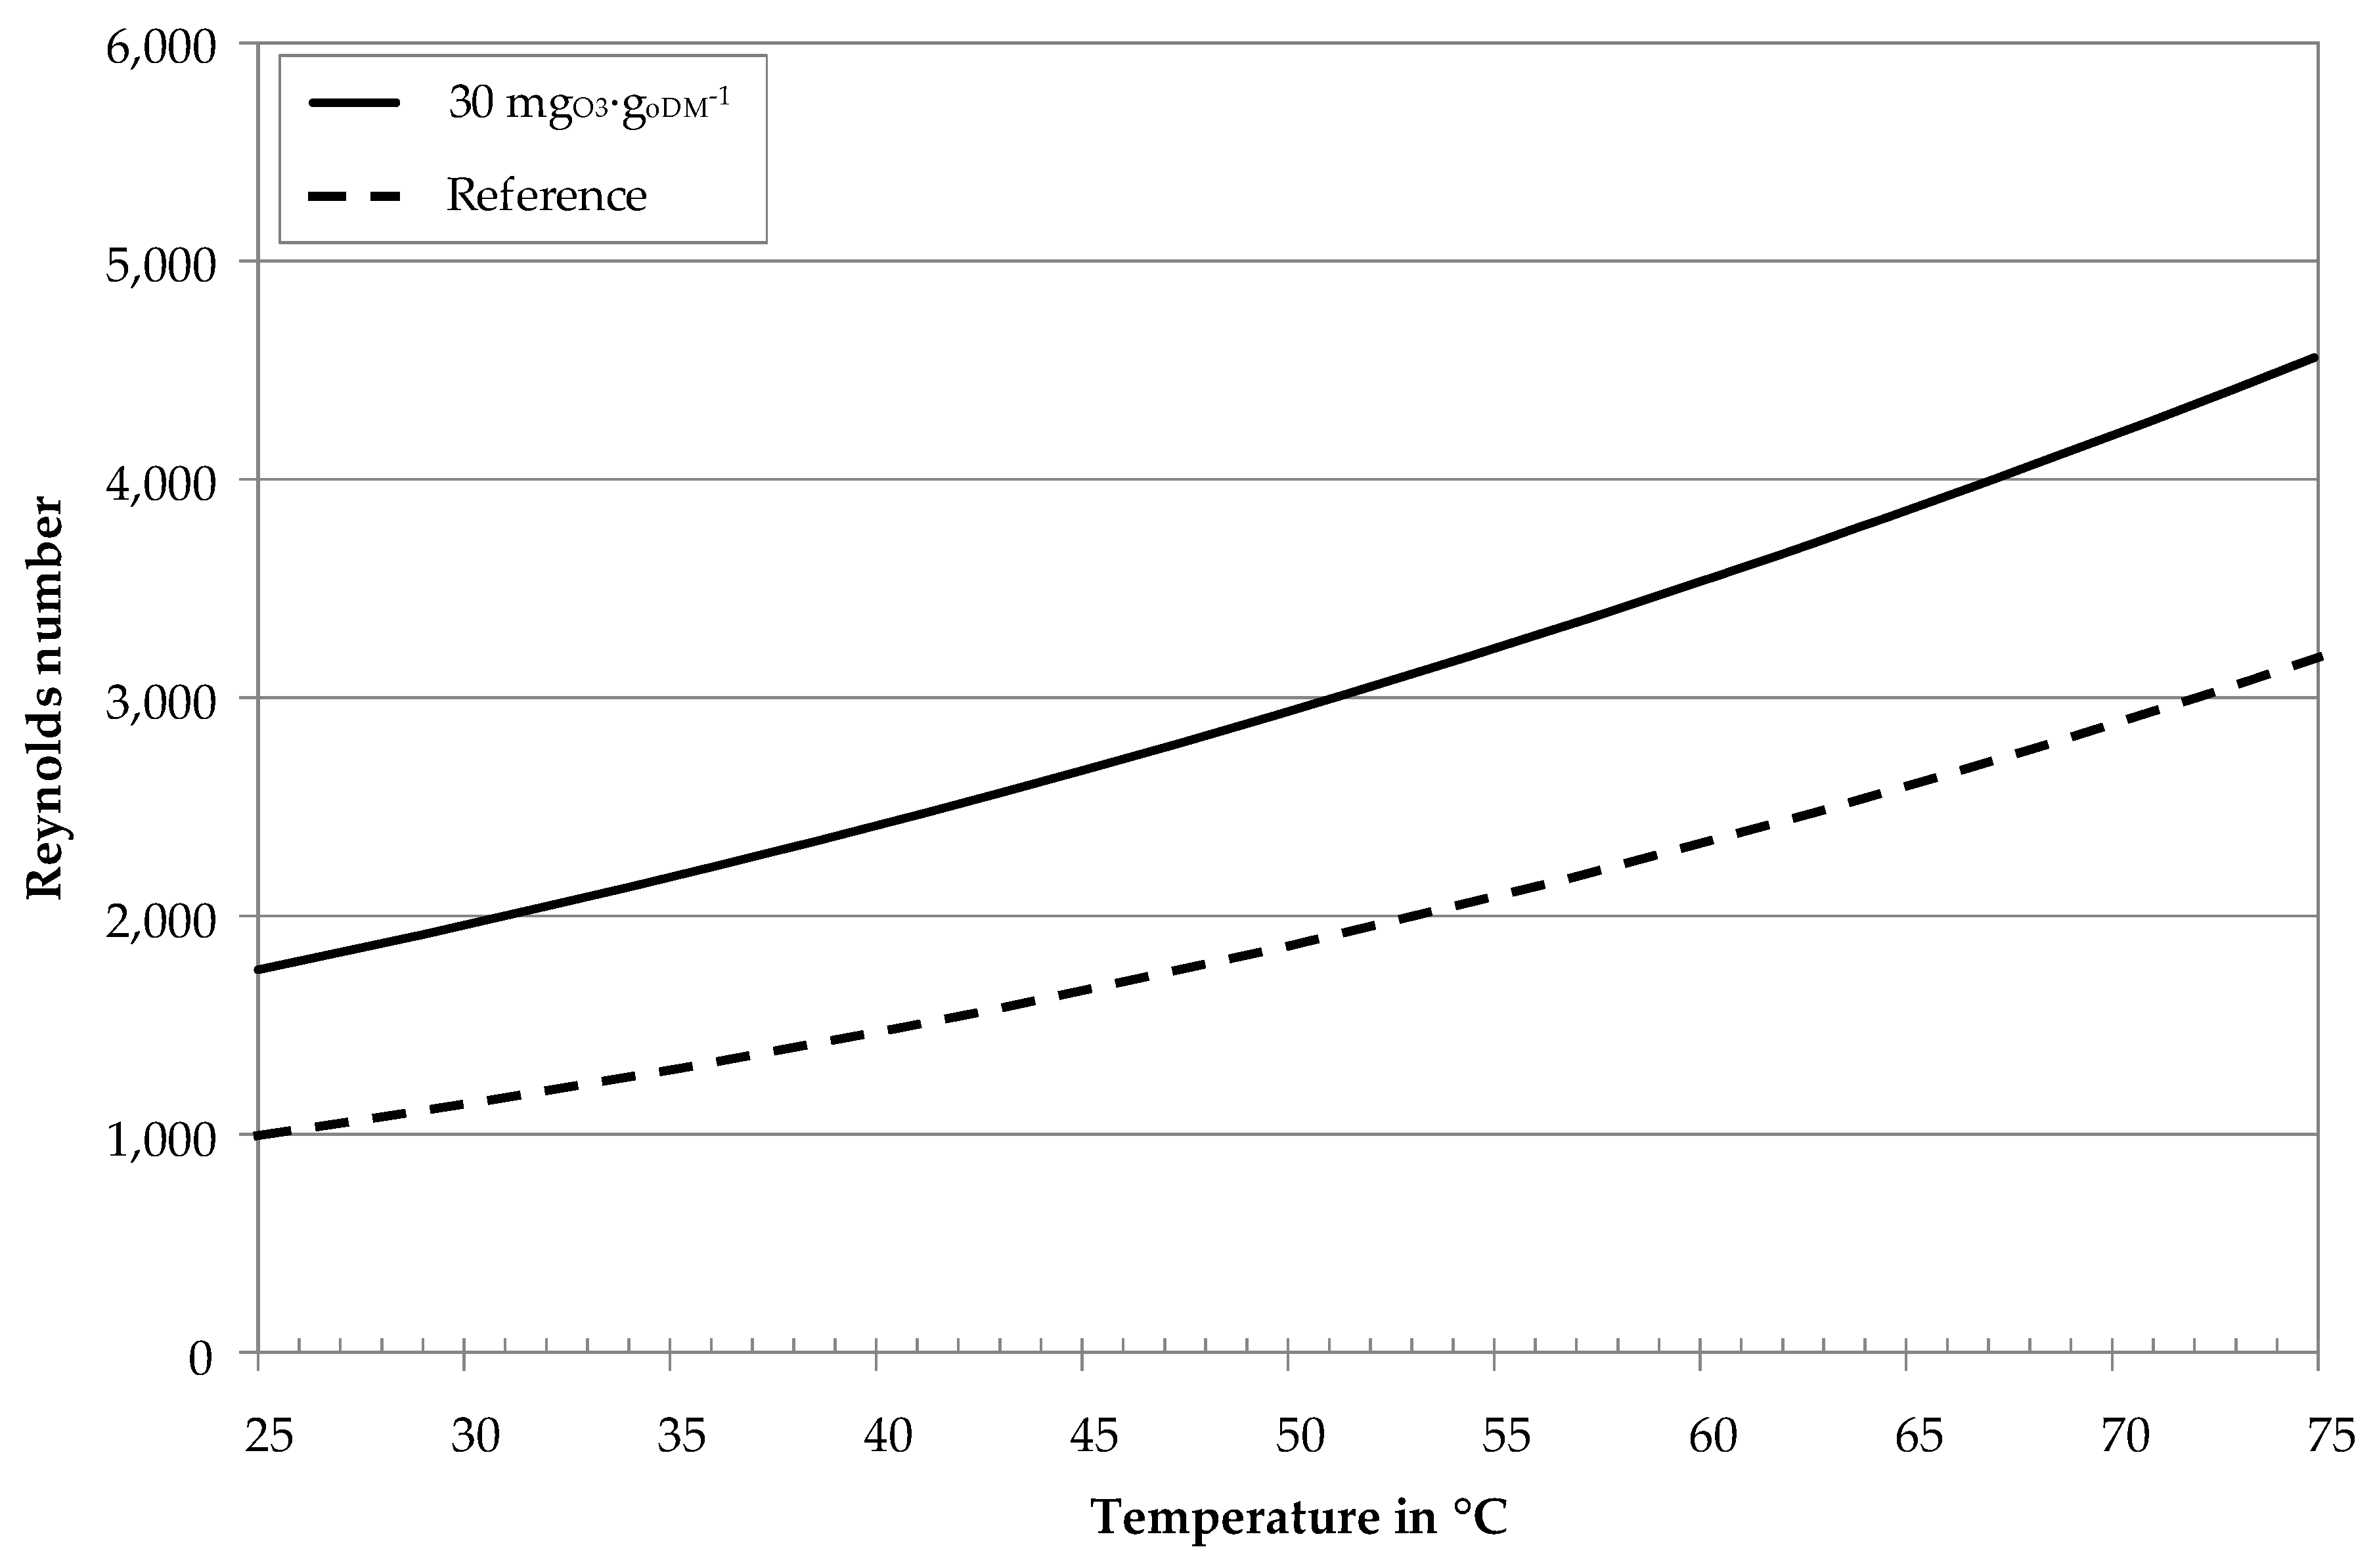
3.1. Influence of Ozone on Fluid Properties
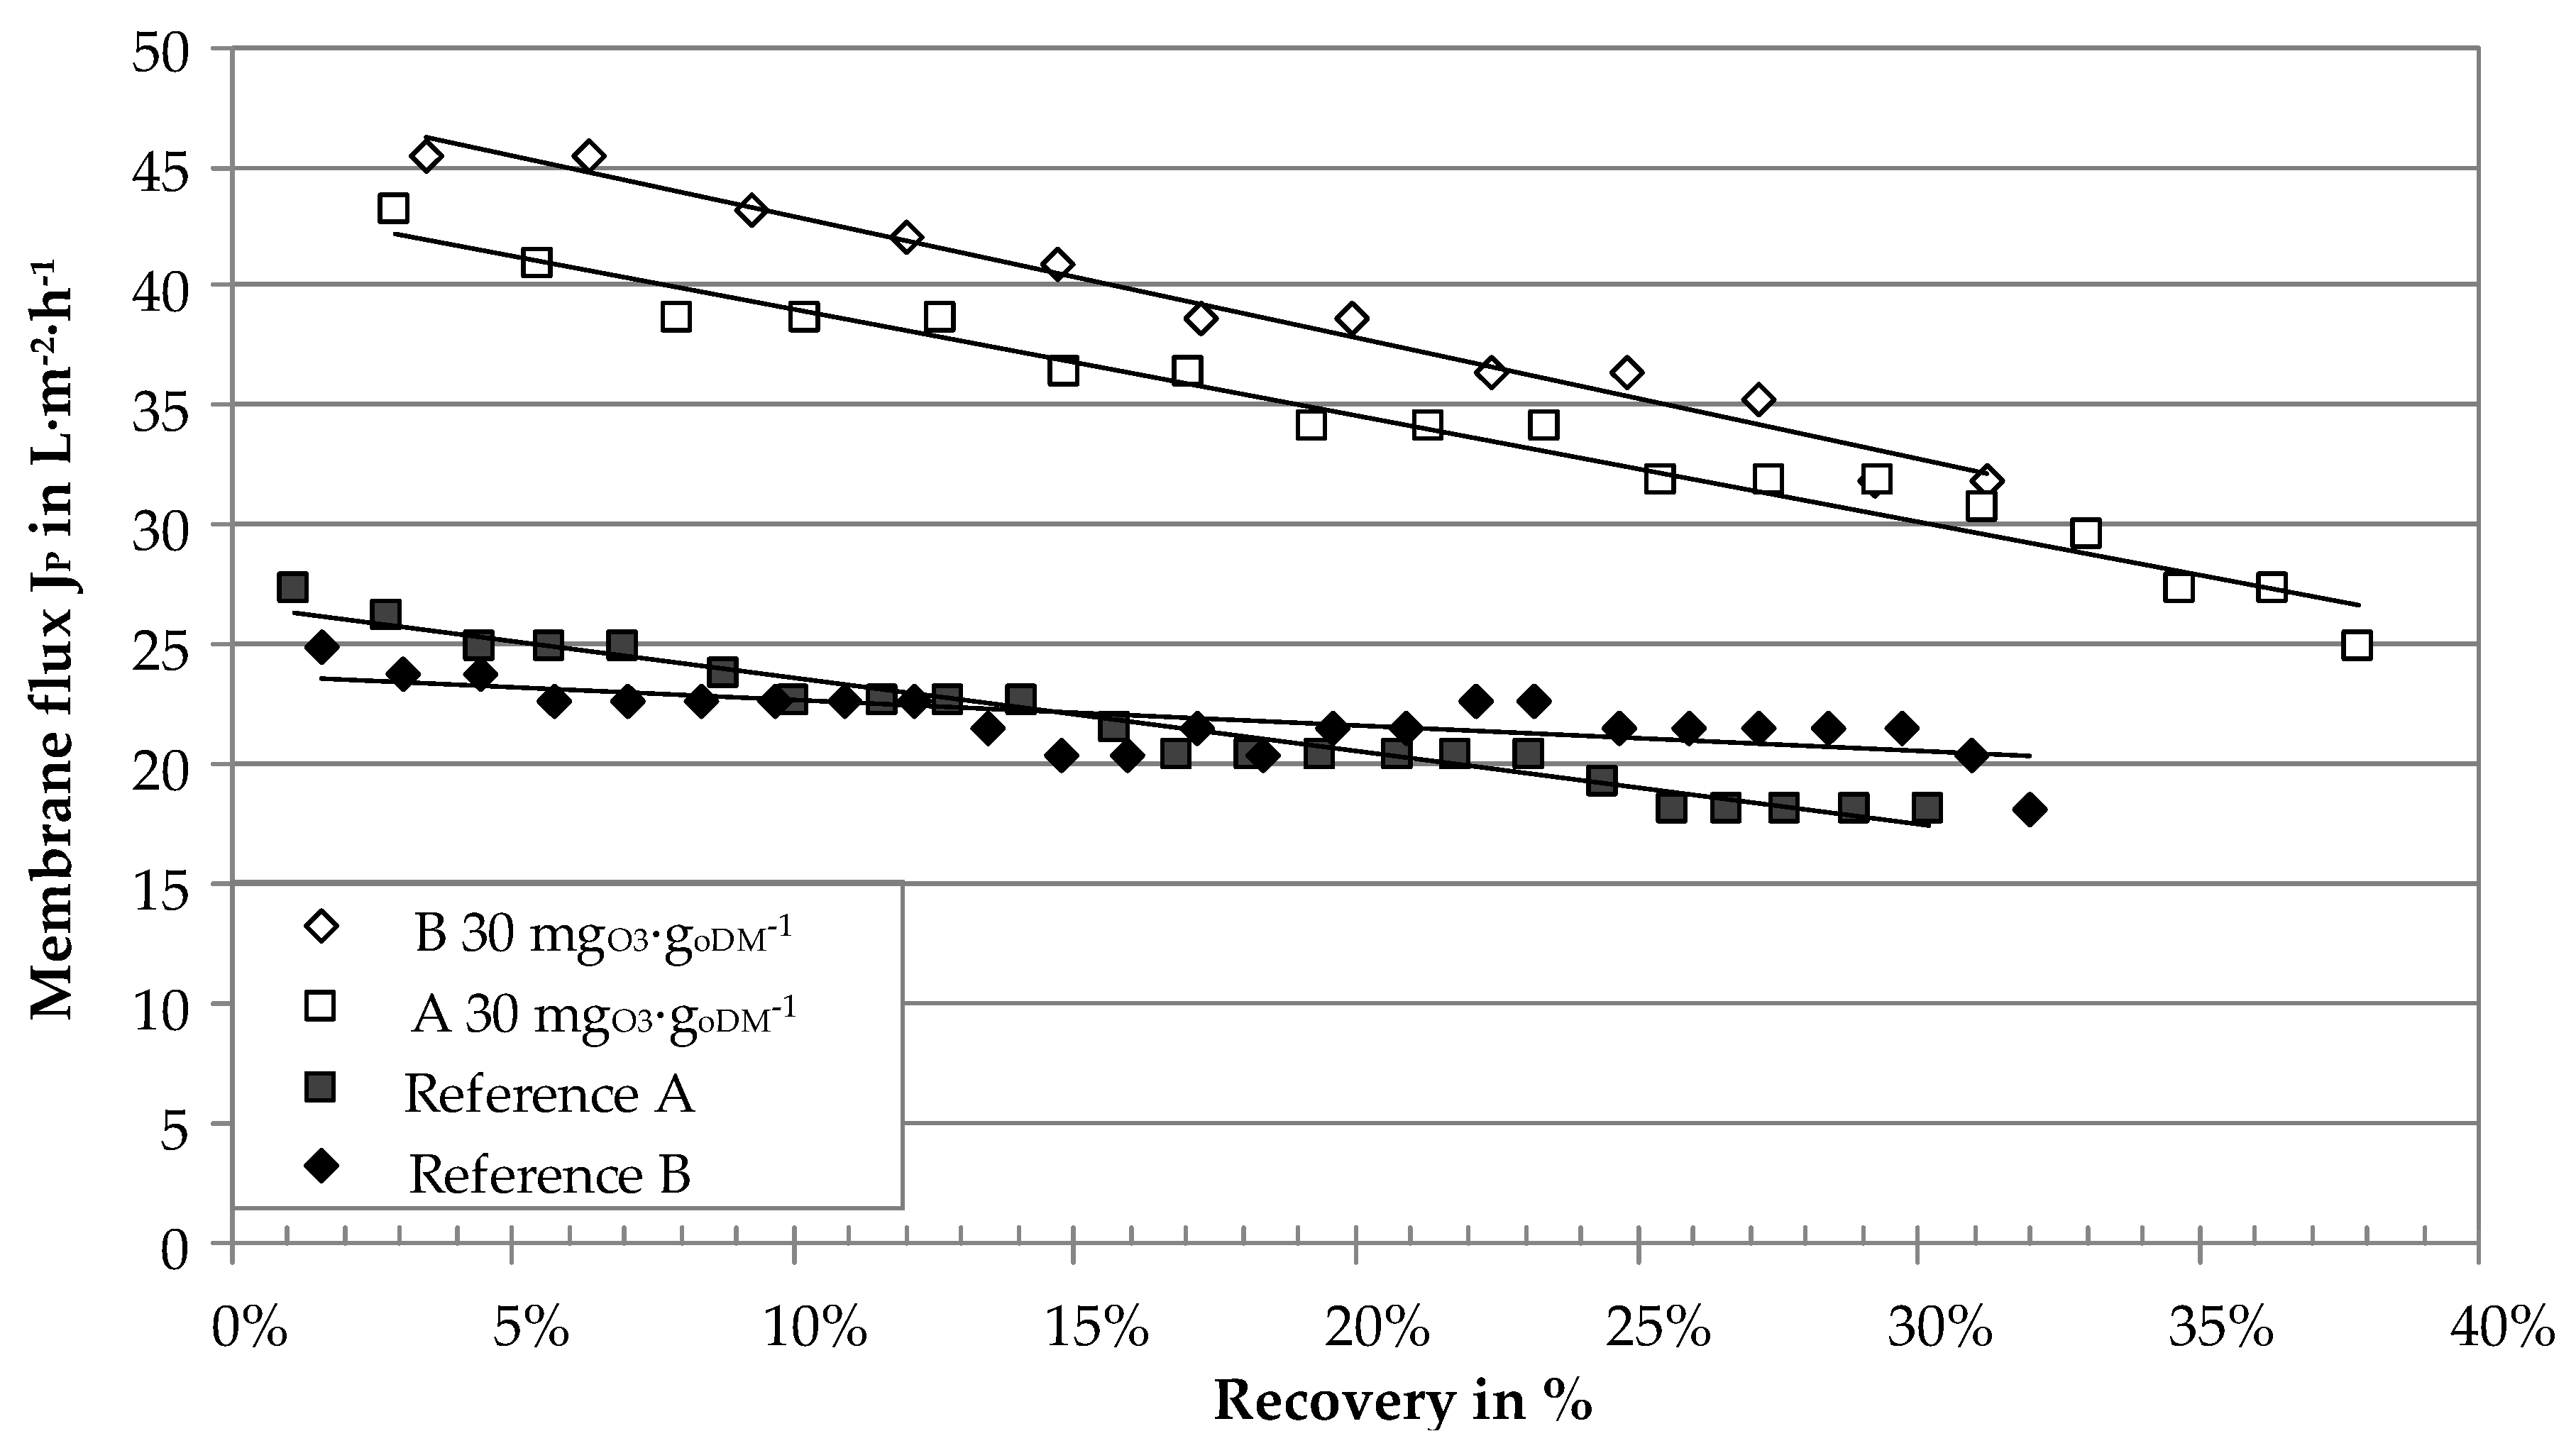
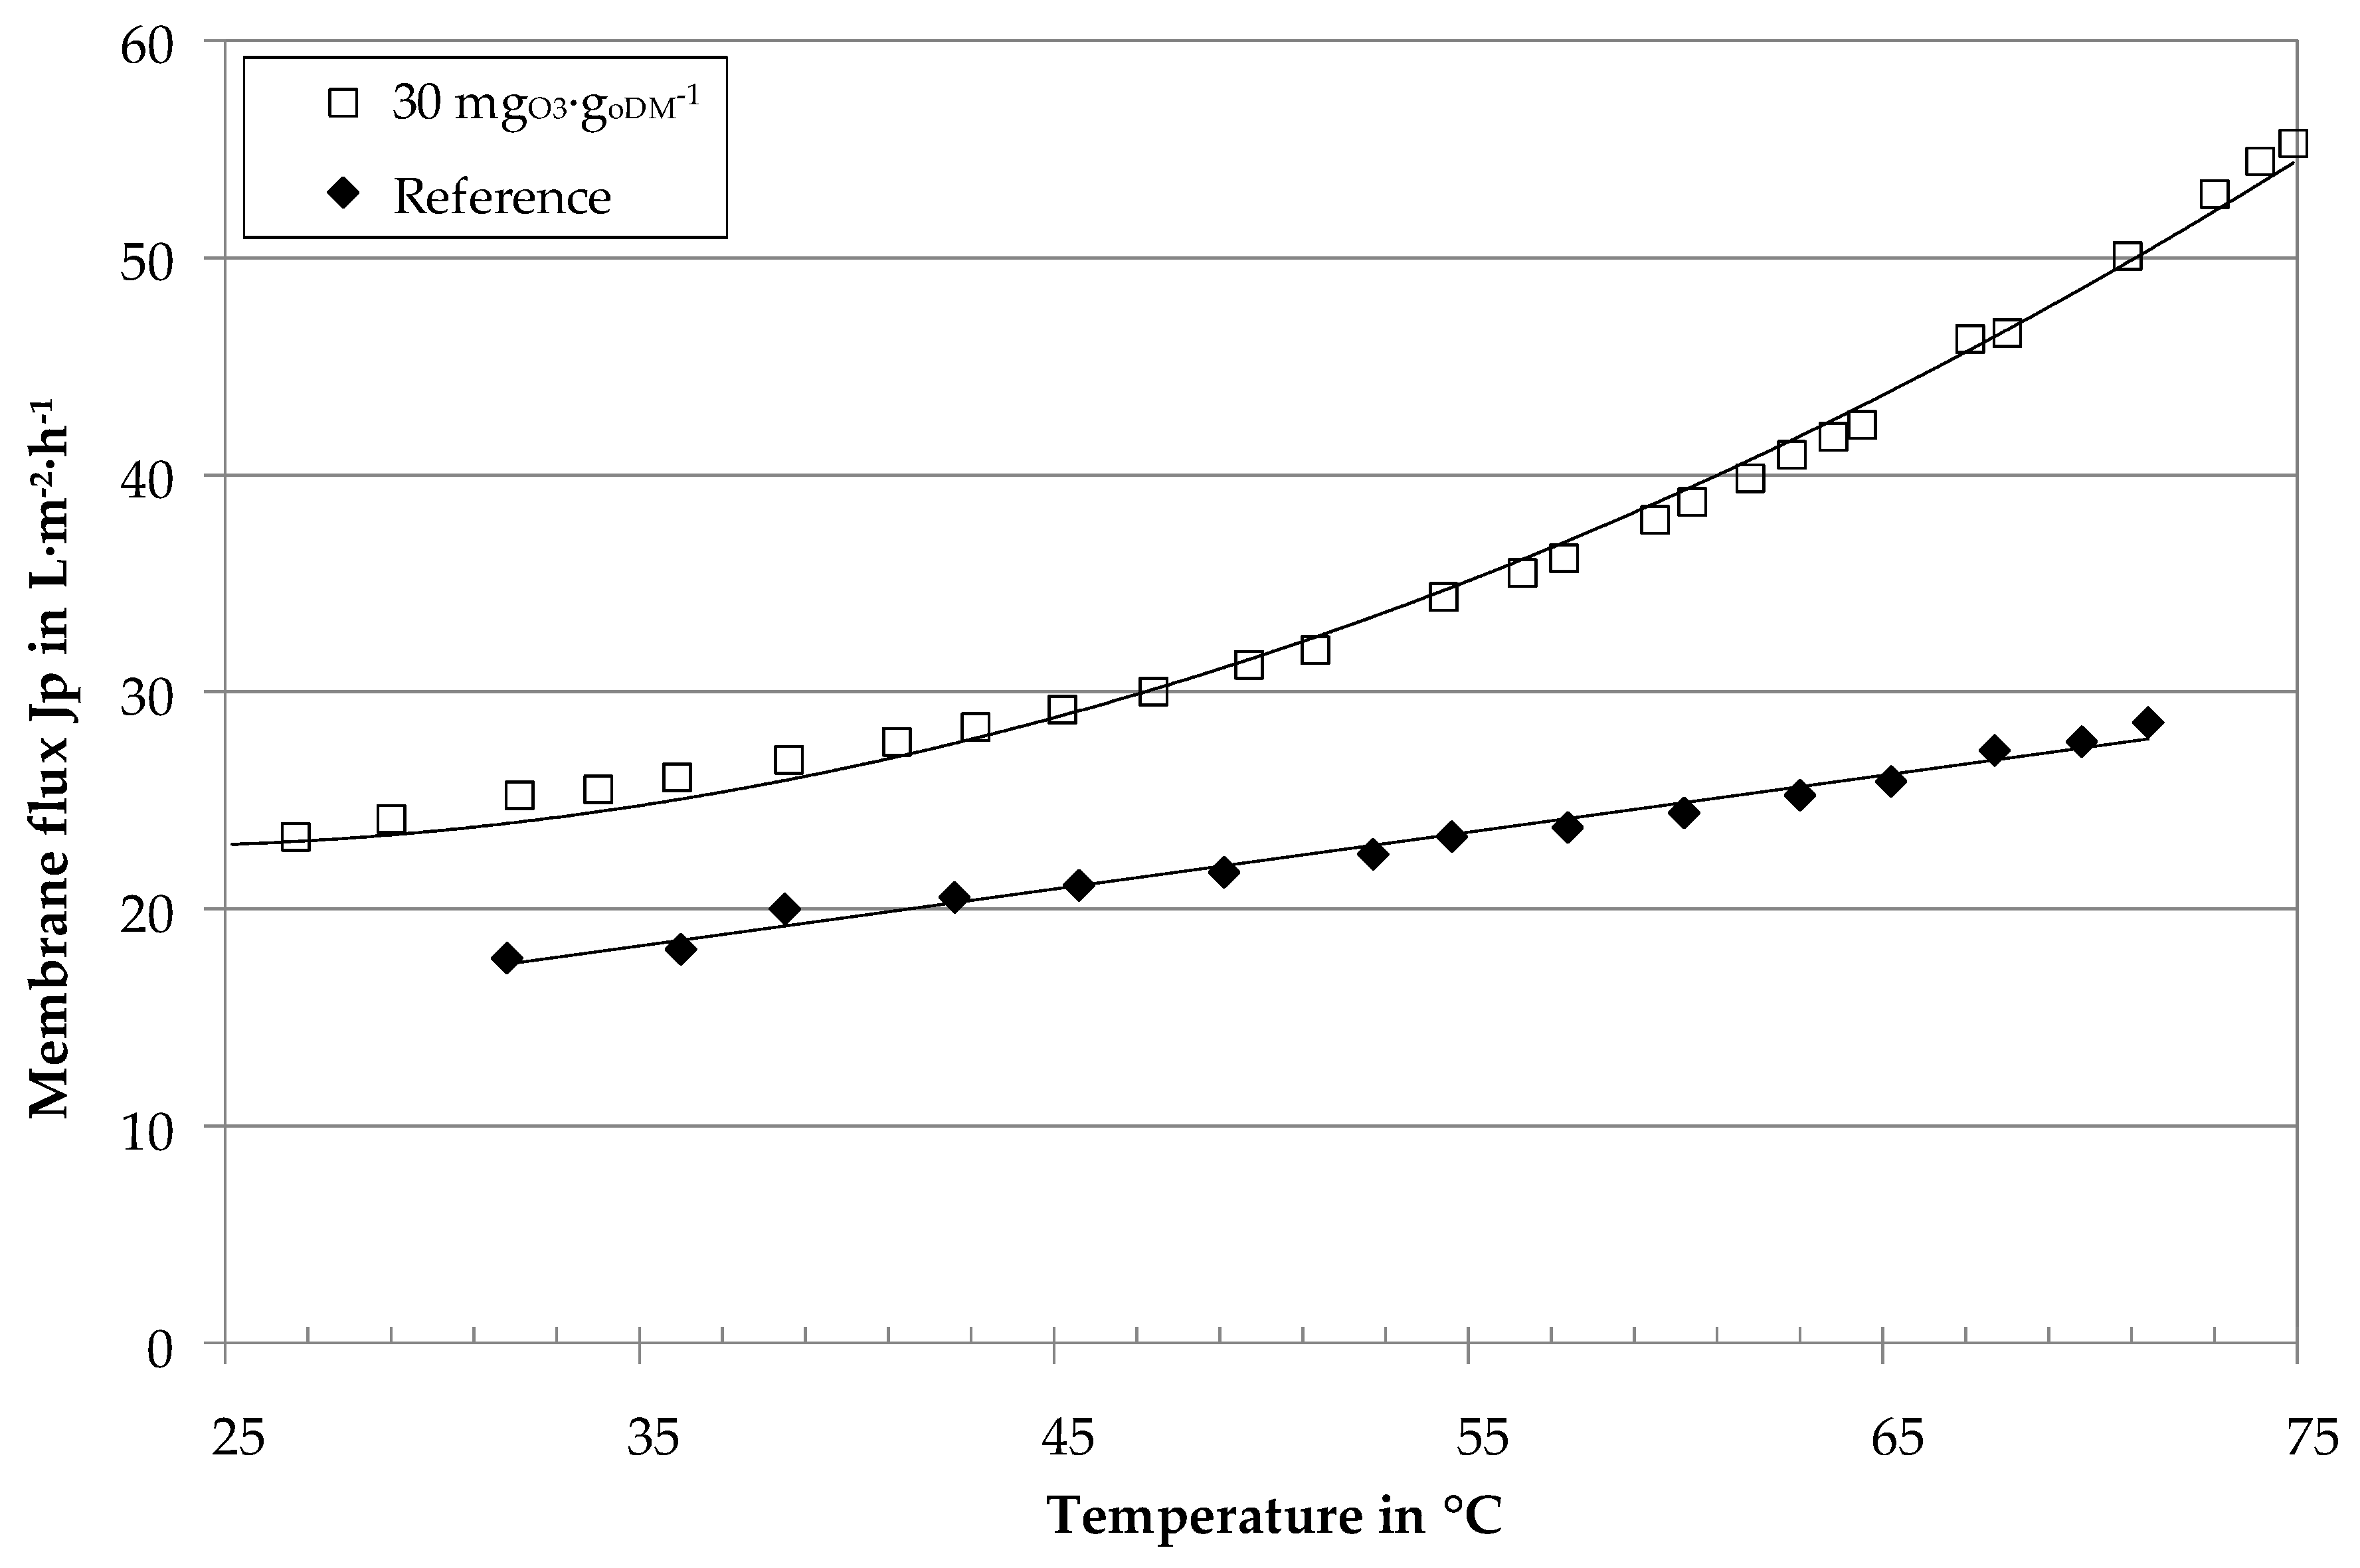
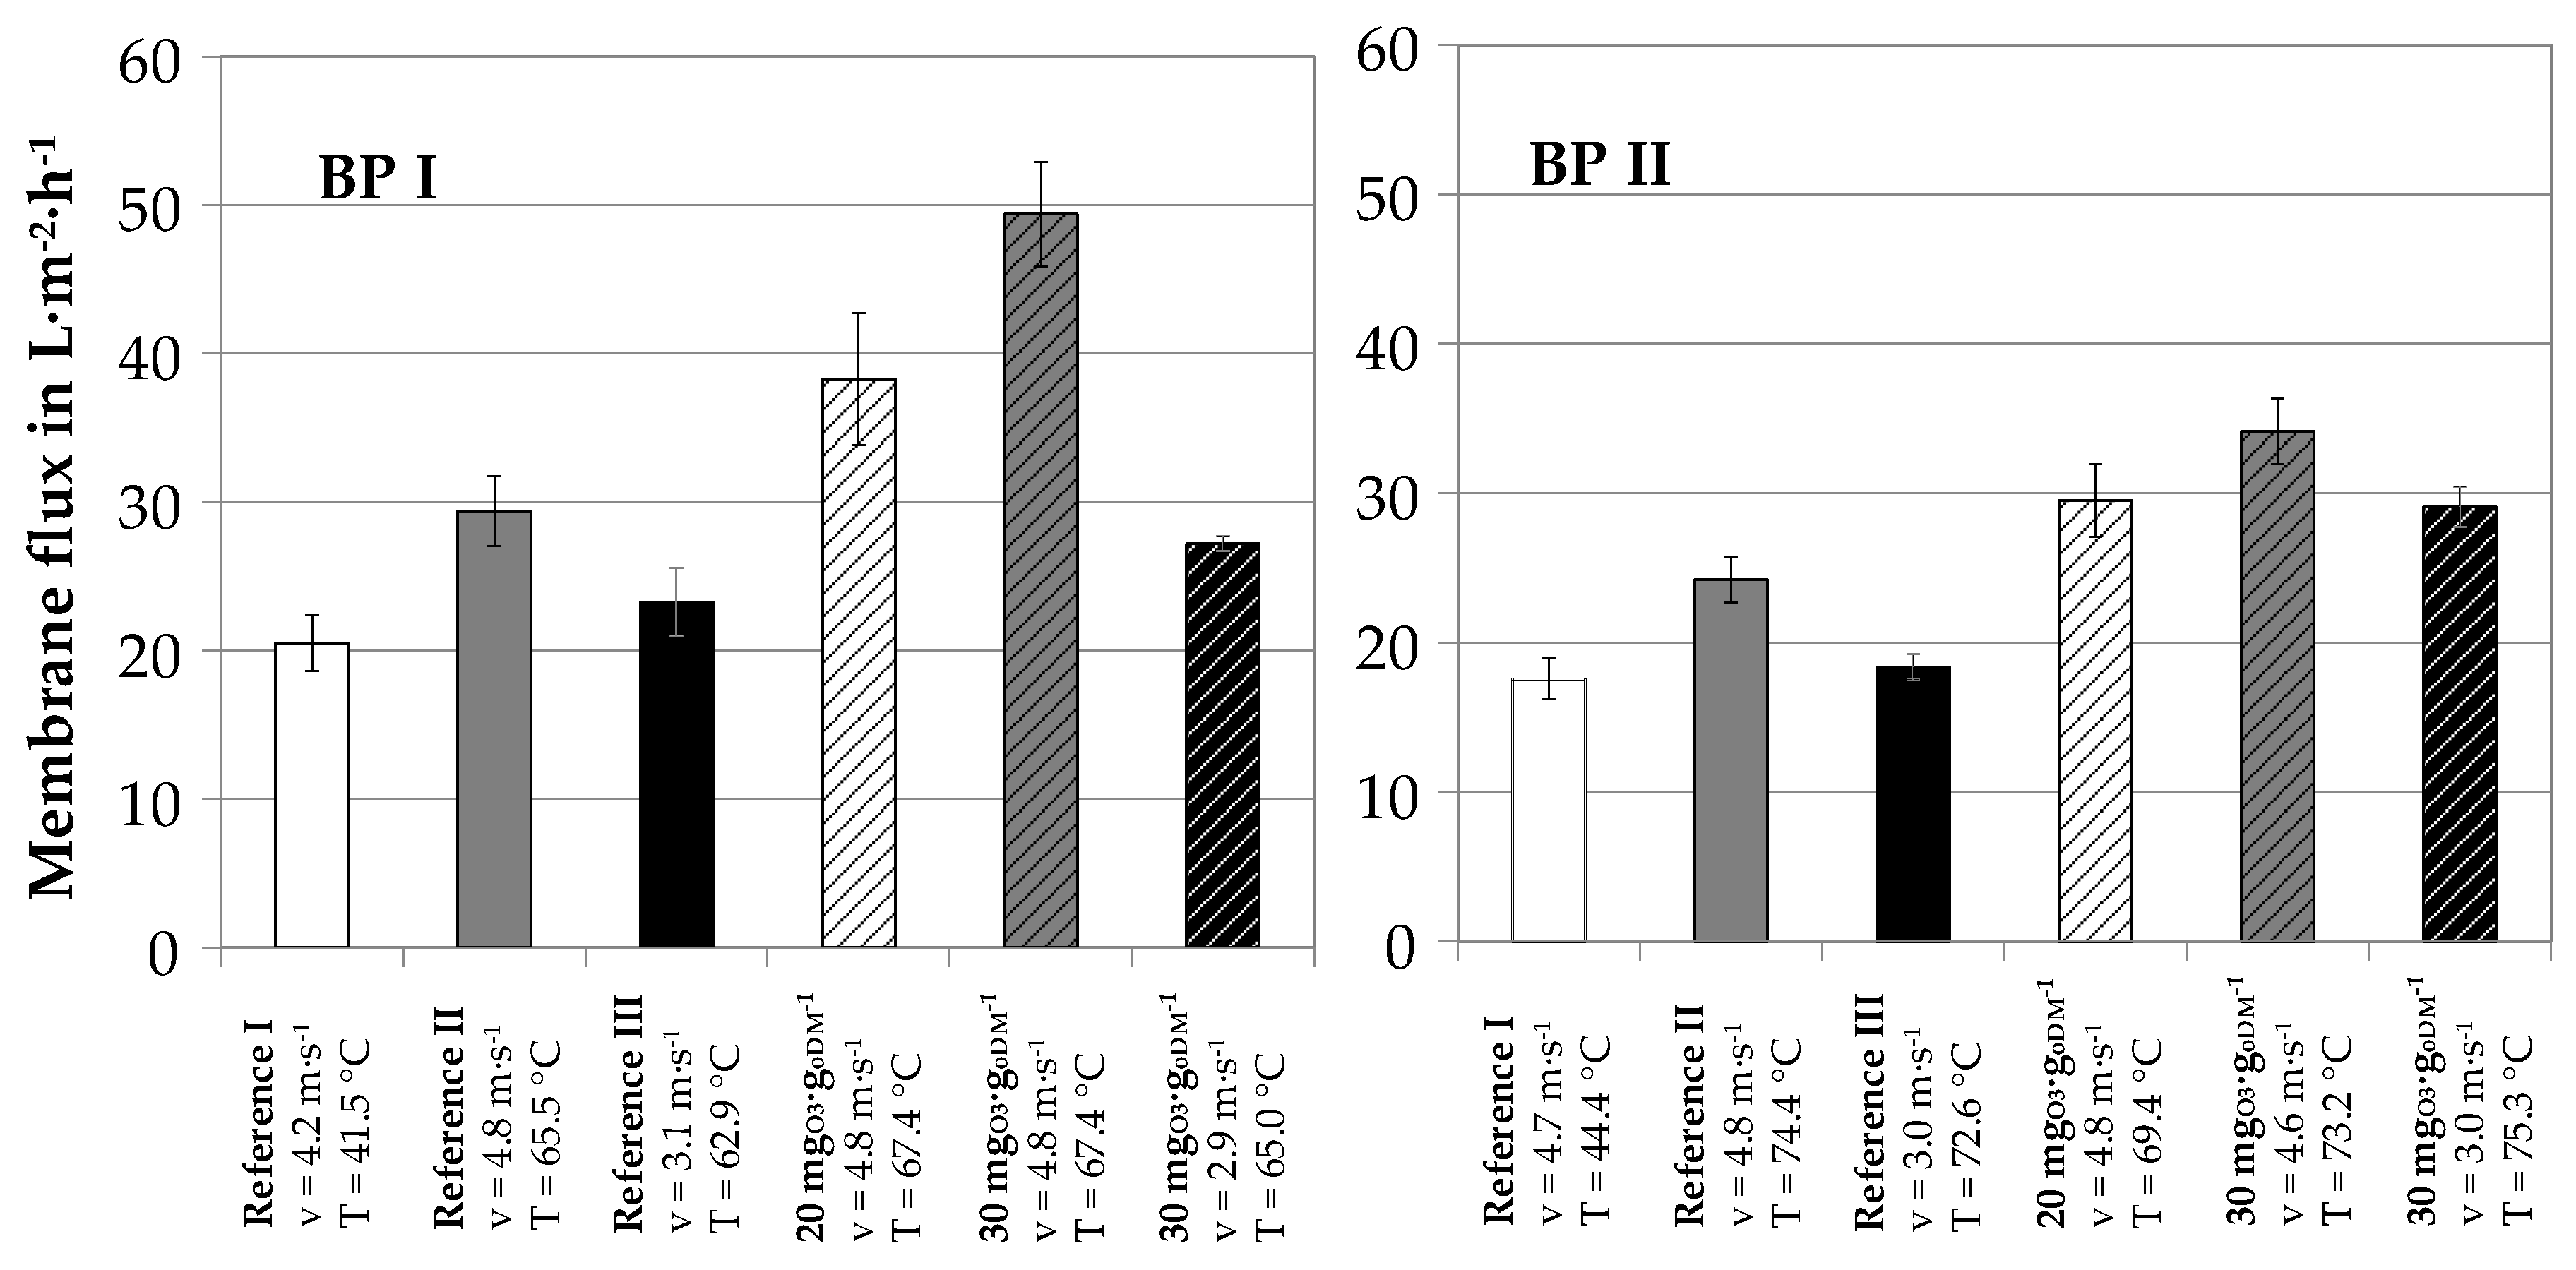
3.2. Influence of Ozone on Ultrafiltration Performance
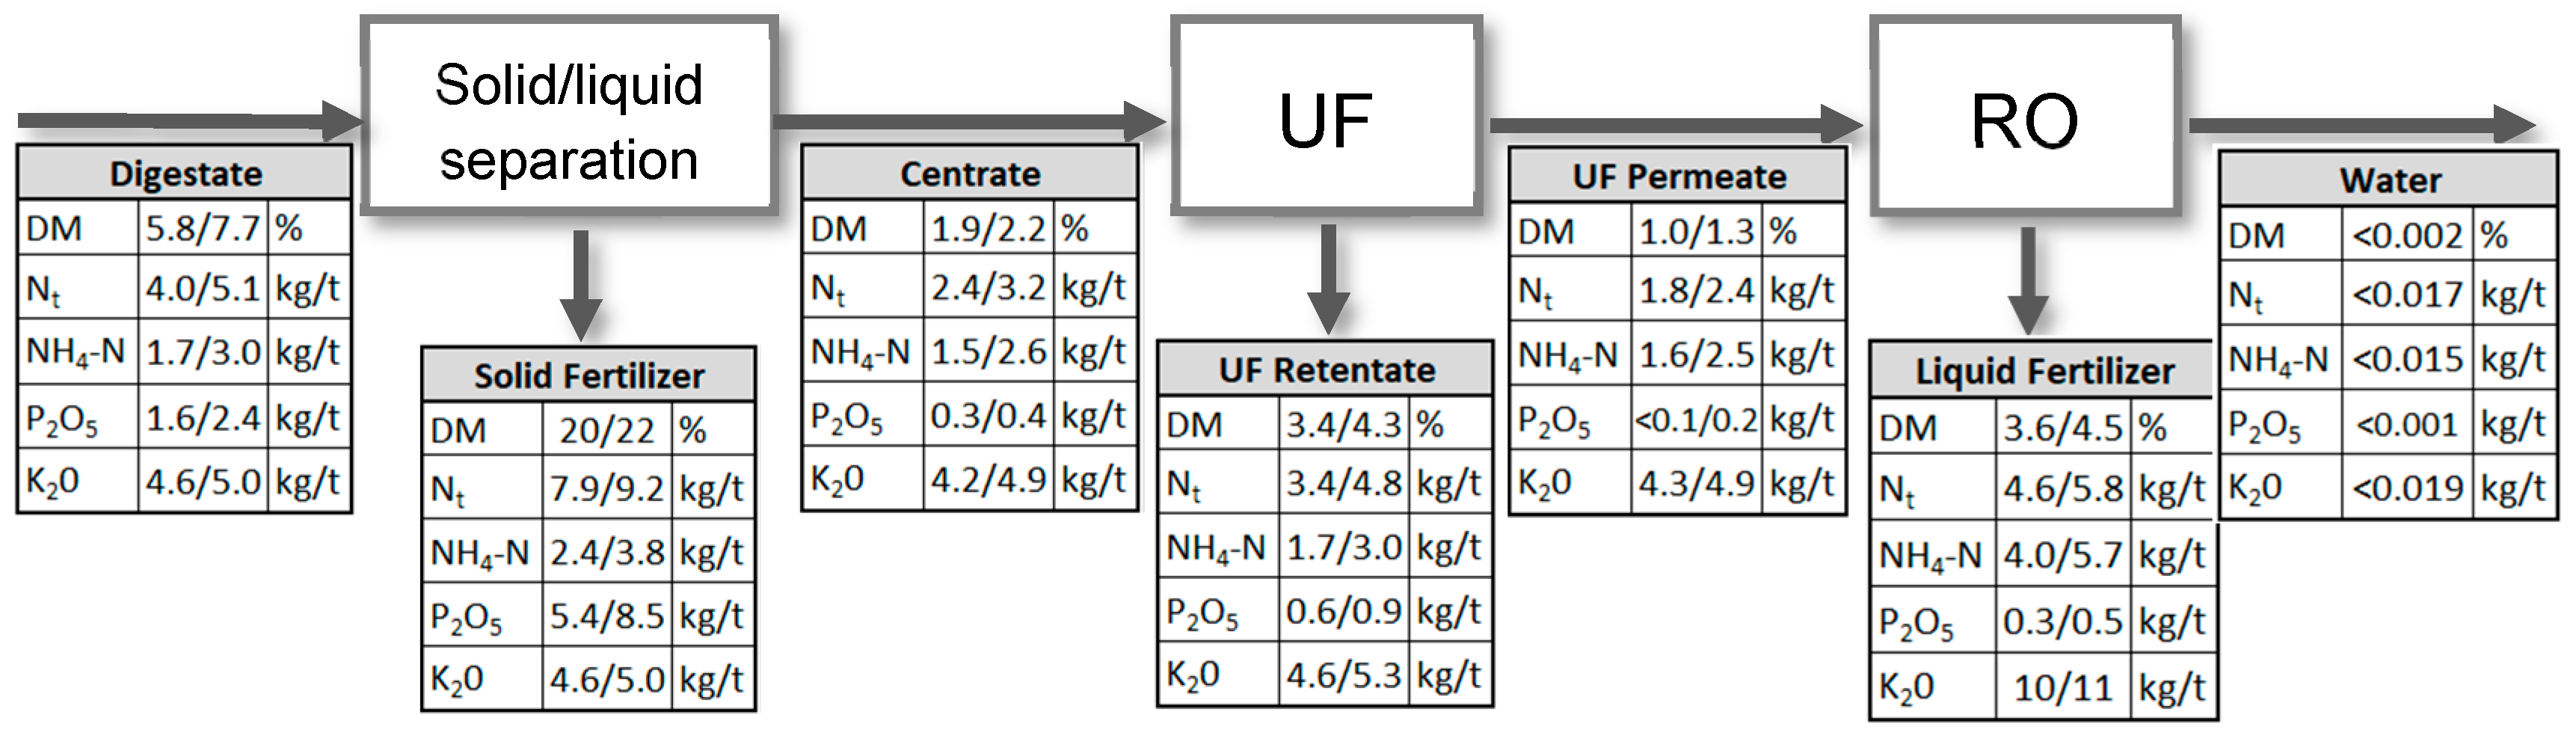
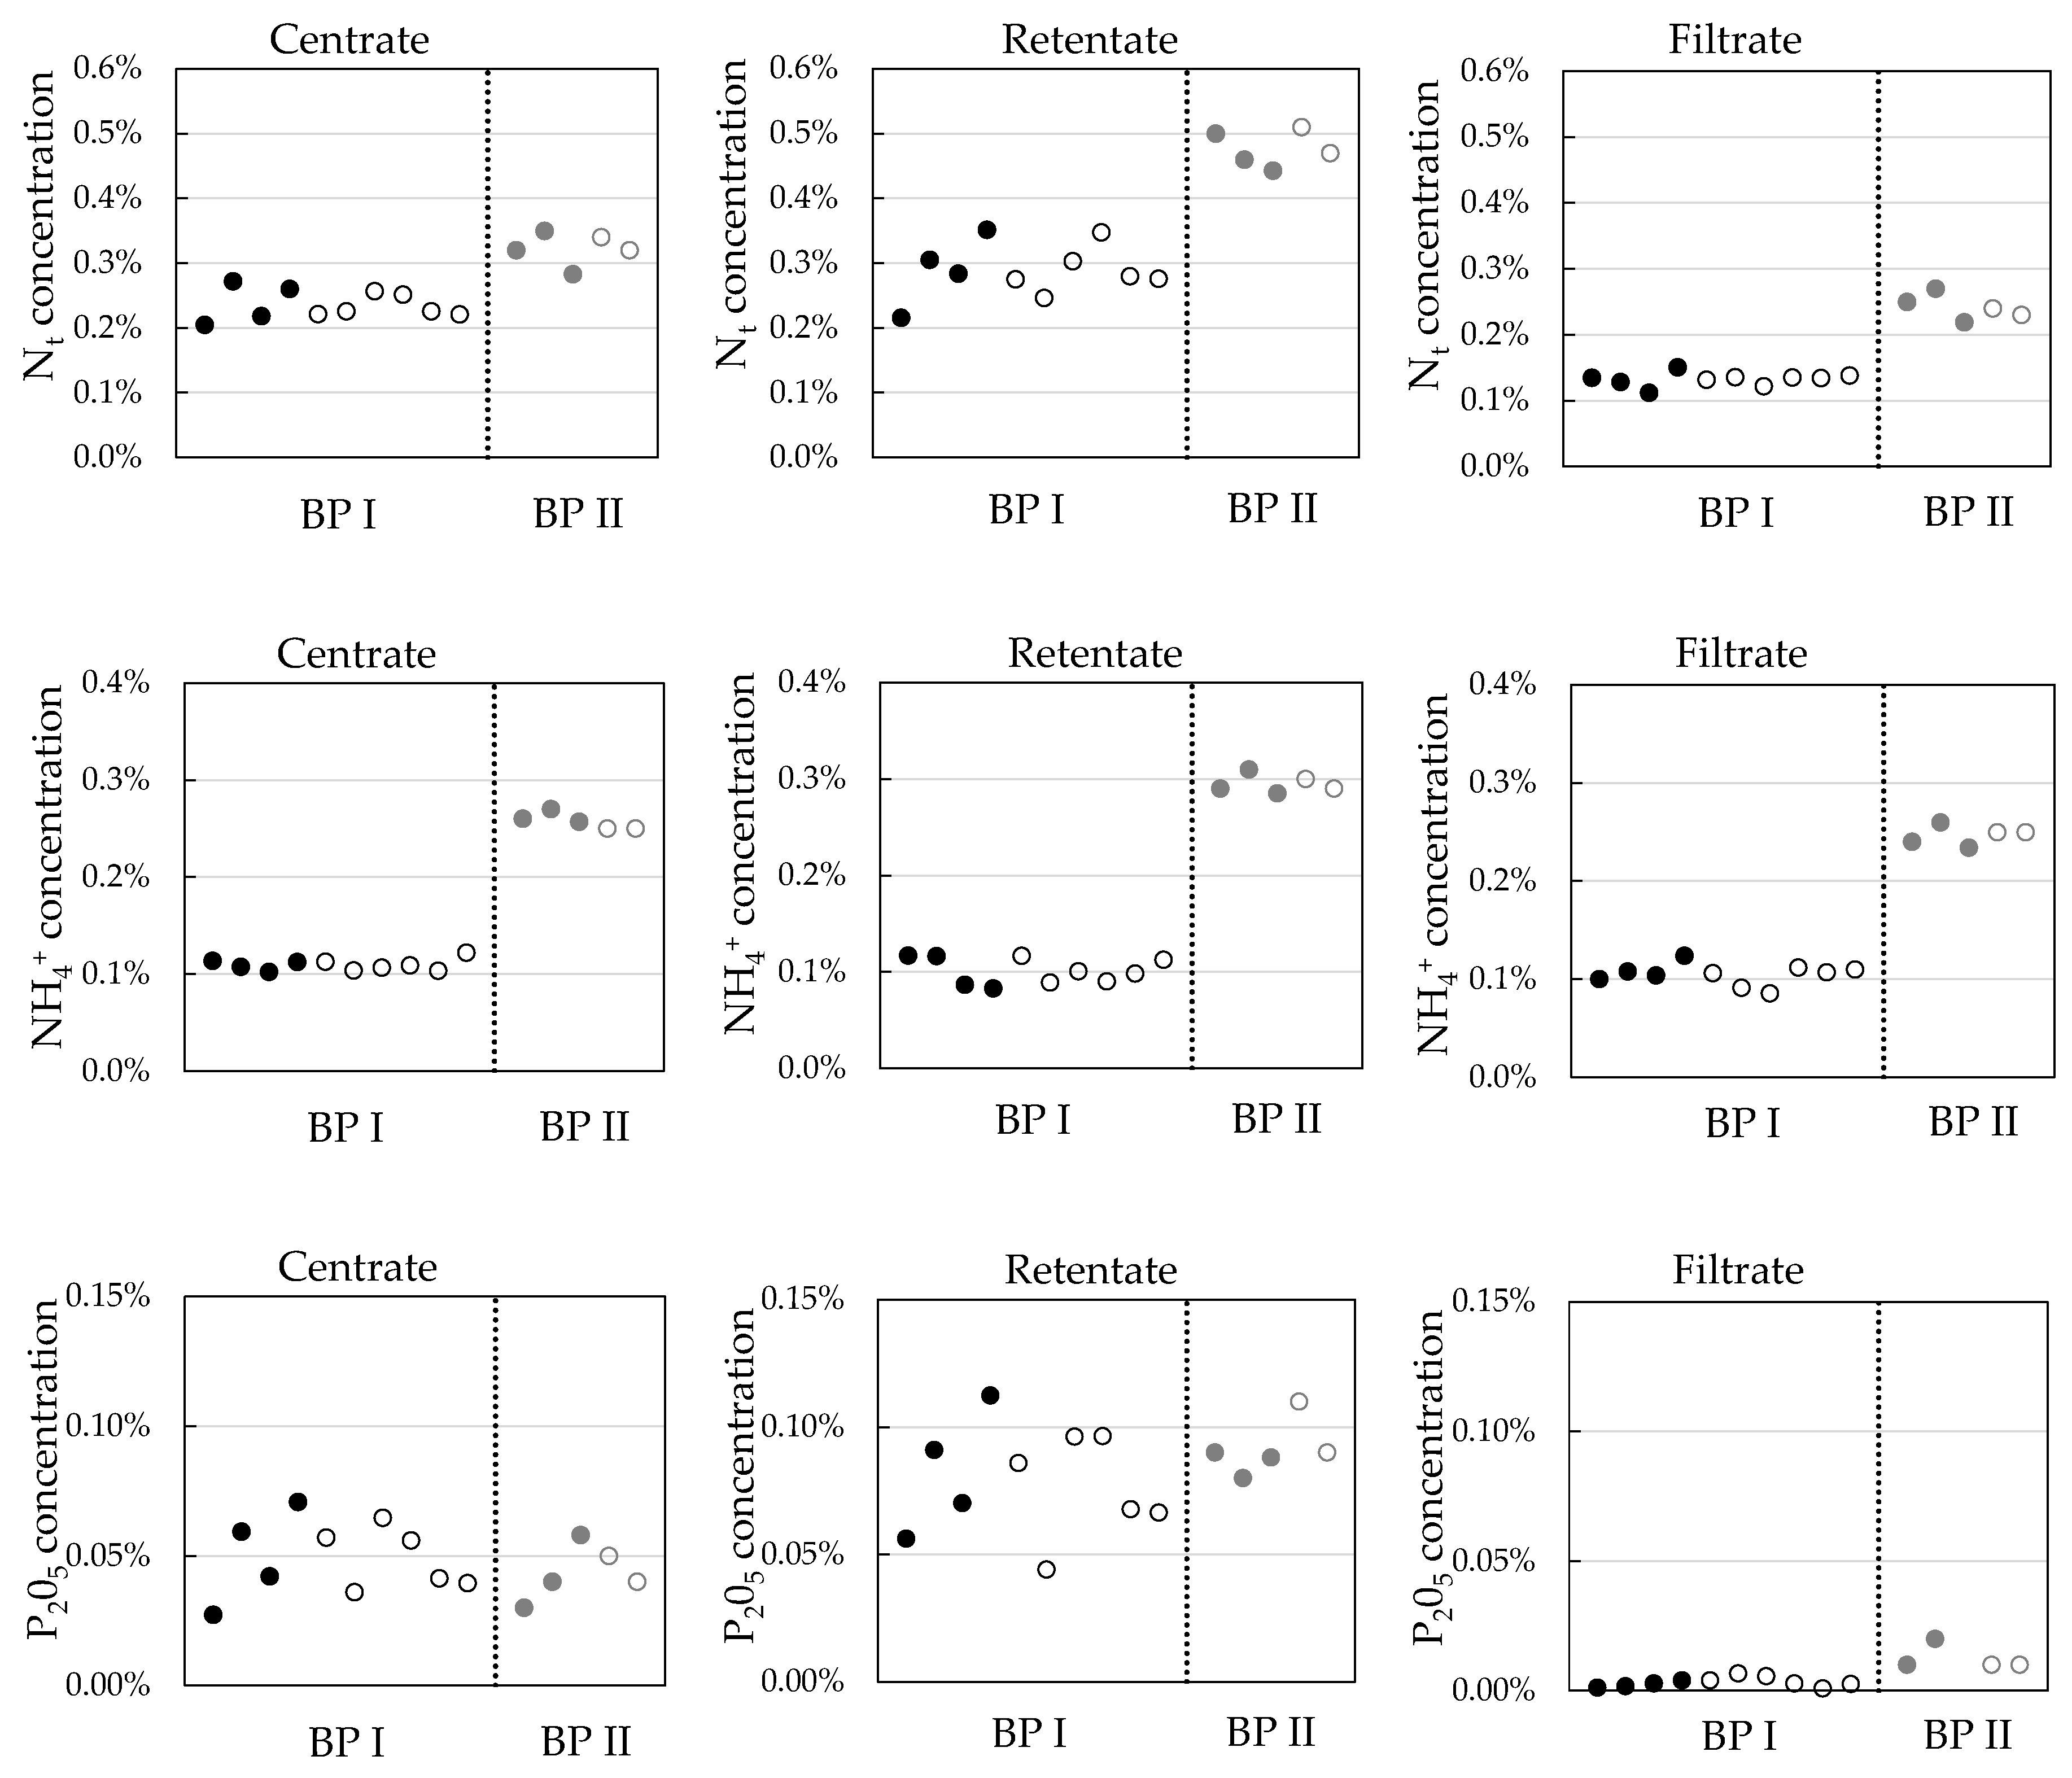
3.3. Influence of Ozone on Nutrient Recovery
4. Conclusions
5. Patents
Author Contributions
Funding
Acknowledgments
Conflicts of Interest
References
- Judd, S.; Judd, C. The MBR Book: Principles and Applications of Membrane Bioreactors for Water and Wastewater Treatment; Elsevier: Oxford, UK, 2011. [Google Scholar]
- di Bella, G.; di Trapani, D. A Brief Review on the Resistance-in-Series Model in Membrane Bioreactors (MBRs). Membranes 2019, 9, 24. [Google Scholar] [CrossRef] [PubMed]
- Meng, F.; Zhang, S.; Oh, Y.; Zhou, Z.; Shin, H.-S.; Chae, S.-R. Fouling in membrane bioreactors: An updated review. Water Res. 2017, 114, 151–180. [Google Scholar] [CrossRef] [PubMed]
- Gkotsis, P.K.; Banti, D.C.; Peleka, E.N.; Zouboulis, A.I.; Samaras, P.E. Fouling Issues in Membrane Bioreactors (MBRs) for Wastewater Treatment: Major Mechanisms, Prevention and Control Strategies. Processes 2014, 2, 795–866. [Google Scholar] [CrossRef]
- Rosenberger, S.; Laabs, C.; Lesjean, B.; Gnirss, R.; Amy, G.; Jekel, M.; Schrotter, J.C. Impact of colloidal and soluble organic material on membrane performance in membrane bioreactors for municipal wastewater treatment. Water Res. 2006, 40, 710–720. [Google Scholar] [CrossRef]
- Drews, A.; Lee, C.-H.; Kraume, M. Membrane fouling–a review on the role of EPS. Desalination 2006, 200, 186–188. [Google Scholar] [CrossRef]
- Aslam, M.; Yang, P.; Lee, P.-H.; Kim, J. Novel staged anaerobic fluidized bed ceramic membrane bioreactor: Energy reduction, fouling control and microbial characterization. J. Membr. Sci. 2018, 553, 200–208. [Google Scholar] [CrossRef]
- Zhou, Z.; Tan, Y.; Xiao, Y.; Stuckey, D.C. Characterization and Significance of Sub-Visible Particles and Colloids in a Submerged Anaerobic Membrane Bioreactor (SAnMBR). Environ. Sci. Technol. 2016, 50, 12750–12758. [Google Scholar] [CrossRef]
- Vaneeckhaute, C.; Lebuf, V.; Michels, E.; Belia, E.; Vanrolleghem, P.A.; Tack, F.M.G.; Meers, E. Nutrient Recovery from Digestate: Systematic Technology Review and Product Classification. Waste Biomass Valorization 2017, 8, 21–40. [Google Scholar] [CrossRef]
- Zacharof, M.-P.; Lovitt, R.W. The filtration characteristics of anaerobic digester effluents employing cross flow ceramic membrane microfiltration for nutrient recovery. Desalination 2014, 341, 27–37. [Google Scholar] [CrossRef]
- Gienau, T.; Ulrich, B.; Kraume, M.; Rosenberger, S. Nutrient recovery from anaerobic sludge by membrane filtration: Pilot tests at a 2.5 MWe biogas plant. Int. J. Recycl. Org. Waste Agric. 2018, 7, 325–334. [Google Scholar] [CrossRef]
- Möller, K.; Müller, T. Effects of anaerobic digestion on digestate nutrient availability and crop growth: A review. Eng. Life Sci. 2012, 12, 242–257. [Google Scholar] [CrossRef]
- Gienau, T.; Brüß, U.; Kraume, M.; Rosenberger, S. Nutrient Recovery from Biogas Digestate by Optimised Membrane Treatment. Waste Biomass Valorization 2018, 9, 2337–2347. [Google Scholar] [CrossRef]
- Chiument, A.; da Borso, F.; Teri, F.; Chiumente, R.; Piaia, B. Full-scale membrane filtration system for the treatment of digestate from a co-digestion plant. Appl. Eng. Agric. 2013, 29, 985–990. [Google Scholar]
- Rockström, J.; Steffen, W.; Noone, K.; Persson, Å.; Chapin, F.S., III; Lambin, E.; Lenton, T.M.; Scheffer, M.; Folke, C.; Schellnhuber, H.J.; et al. Planetary Boundaries: Exploring the Safe Operating Space for Humanity. Ecol. Soc. 2019, 14. Available online: http://www.ecologyandsociety.org/vol14/iss2/art32/ (accessed on 6 March 2020).
- Drosg, B.; Fuchs, W.; al Seadi, T.; Madsen, M.; Linke, B. Nutrient Recovery by Biogas Digestate Processing; IEA BIOENERGY: Dublin, Ireland, 2015. [Google Scholar]
- Meixner, K.; Fuchs, W.; Valkova, T.; Svardal, K.; Loderer, C.; Neureiter, M.; Bochmann, G.; Drosg, B. Effect of precipitating agents on centrifugation and ultrafiltration performance of thin stillage digestate. Sep. Purif. Technol. 2015, 145, 154–160. [Google Scholar] [CrossRef]
- Farno, E.; Baudez, J.C.; Parthasarathy, R.; Eshtiaghi, N. Rheological characterisation of thermally-treated anaerobic digested sludge: Impact of temperature and thermal history. Water Res. 2014, 56, 156–1614. [Google Scholar] [CrossRef]
- Gienau, T.; Kraume, M.; Rosenberger, S. Biopolymer interactions of anaerobic sludge and their influence on membrane performance. J. Membr. Sci. 2018, 564, 634–642. [Google Scholar] [CrossRef]
- Uzun, H.; Ibanoglu, E.; Catal, H.; Ibanoglu, S. Effects of ozone on functional properties of proteins. Food Chem. 2012, 134, 647–654. [Google Scholar] [CrossRef]
- Wei, D.; Tao, Y.; Zhang, Z.; Zhang, X. Effect of pre-ozonation on mitigation of ceramic UF membrane fouling caused by algal extracellular organic matters. Chem. Eng. J. 2016, 294, 157–166. [Google Scholar] [CrossRef]
- Sun, F.-Y.; Wang, X.-M.; Li, X.-Y. Effect of biopolymer cluster on the fouling property of sludge from a membrane bioreactor (MBR) and its control by ozonation. Process Biochem. 2011, 46, 162–167. [Google Scholar] [CrossRef]
- Hwang, B.-K.; Kim, J.-H.; Ahn, C.H.; Lee, C.-H.; Song, J.-Y.; Ra, Y.-H. Effect of disintegrated sludge recycling on membrane permeability in a membrane bioreactor combined with a turbulent jet flow ozone contactor. Water Res. 2010, 44, 1833–1840. [Google Scholar] [CrossRef] [PubMed]
- You, S.-H.; Tseng, D.-H.; Hsu, W.-C. Effect and mechanism of ultrafiltration membrane fouling removal by ozonation. Desalination 2007, 202, 224–230. [Google Scholar] [CrossRef]
- Bougrier, C.; Albasi, C.; Delgènes, J.P.; Carrère, H. Effect of ultrasonic, thermal and ozone pre-treatments on waste activated sludge solubilisation and anaerobic biodegradability. Chem. Eng. Process. Process Intensif. 2006, 4, 711–718. [Google Scholar] [CrossRef]
- Erden, G.; Filibeli, A. Ozone Oxidation of Biological Sludge: Effects on Disintegration, Anaerobic Biodegradability, and Filterability. Environ. Prog. Sustain. Energy 2011, 30, 377–383. [Google Scholar] [CrossRef]
- Gienau, T.; Kraume, M.; Rosenberger, S. Rheological characterization of anaerobic sludge from agricultural and bio-waste biogas plants. Chem. Ing. Tech. 2018, 90, 988–997. [Google Scholar] [CrossRef]


| Process Parameter | Unit | BP I | BP II |
|---|---|---|---|
| Electrical capacity | MWel | 2.5 | 1.27 |
| Operational temperature | °C | 40–42 | 39.5–40 |
| Retention time | d | 60–65 | 40–45 |
| Substrate | 36% cattle manure 36% maize silage 28% sugar beets | 37% slurry/manure 51% maize silage 12% oat/whole plant silage | |
| Digestate storage | m3 | 15,800 | 13,000 |
| Yearly digestate volume | m3∙a−1 | 35,000–55,000 | 30,000–35,000 |
| Dry matter content digestate | % | 5.8 ± 0.4 | 7.7 ± 0.5 |
| Organic percentage of DM digestate | % of DM | 72.8 ± 1.0 | 71.2 ± 0.3 |
| Dry matter content centrate | % | 1.9 ± 0.0 | 2.2 ± 0.1 |
| Organic percentage of DM centrate | % of DM | 59.5 ± 2.7 | 55.5 ± 2.5 |
| Parameter | Unit | Reference | 30 mgO3∙goDM−1 |
|---|---|---|---|
| k | Pa∙sn | ||
| n | - | 0.63 | 0.67 |
| EA | J∙mol−1 | 21,240 | 16,770 |
| R | J∙mol−1∙K−1 | 8.314 | 8.314 |
| ρ | kg∙m−3 | 1010 | 1010 |
© 2020 by the authors. Licensee MDPI, Basel, Switzerland. This article is an open access article distributed under the terms and conditions of the Creative Commons Attribution (CC BY) license (http://creativecommons.org/licenses/by/4.0/).
Share and Cite
Gienau, T.; Ehrmanntraut, A.; Kraume, M.; Rosenberger, S. Influence of Ozone Treatment on Ultrafiltration Performance and Nutrient Flow in a Membrane Based Nutrient Recovery Process from Anaerobic Digestate. Membranes 2020, 10, 64. https://doi.org/10.3390/membranes10040064
Gienau T, Ehrmanntraut A, Kraume M, Rosenberger S. Influence of Ozone Treatment on Ultrafiltration Performance and Nutrient Flow in a Membrane Based Nutrient Recovery Process from Anaerobic Digestate. Membranes. 2020; 10(4):64. https://doi.org/10.3390/membranes10040064
Chicago/Turabian StyleGienau, Tobias, Artjom Ehrmanntraut, Matthias Kraume, and Sandra Rosenberger. 2020. "Influence of Ozone Treatment on Ultrafiltration Performance and Nutrient Flow in a Membrane Based Nutrient Recovery Process from Anaerobic Digestate" Membranes 10, no. 4: 64. https://doi.org/10.3390/membranes10040064
APA StyleGienau, T., Ehrmanntraut, A., Kraume, M., & Rosenberger, S. (2020). Influence of Ozone Treatment on Ultrafiltration Performance and Nutrient Flow in a Membrane Based Nutrient Recovery Process from Anaerobic Digestate. Membranes, 10(4), 64. https://doi.org/10.3390/membranes10040064