Reducing the Impacts of Biofouling in RO Membrane Systems through In Situ Low Fluence Irradiation Employing UVC-LEDs


Abstract
1. Introduction
- Adaption of the equipment, design and operation, such as suitable pretreatment (e.g., ultrafiltration), optimizing hydrodynamic conditions, membrane surface modifications or feed flow reversal,
- Limitation of the biomass growth conditions by limiting essential resources, such as carbon or phosphorus,
2. Materials and Methods
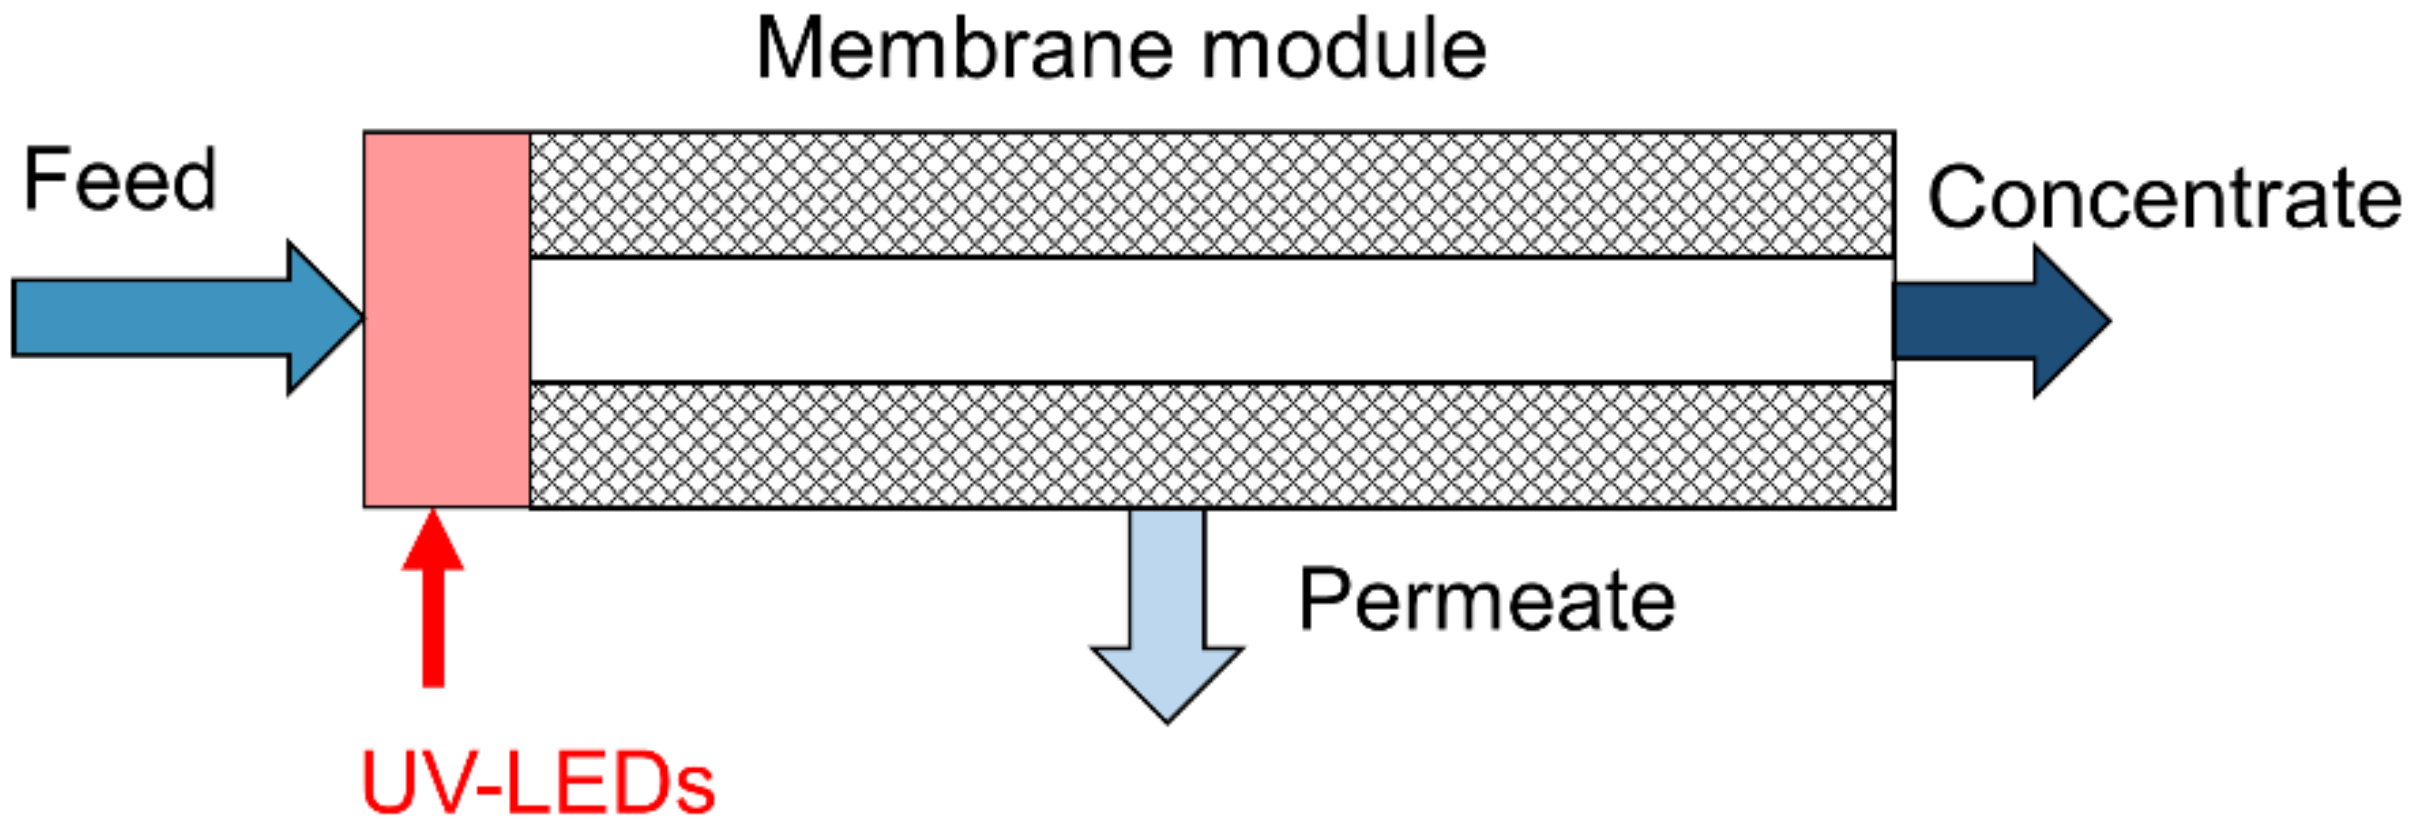
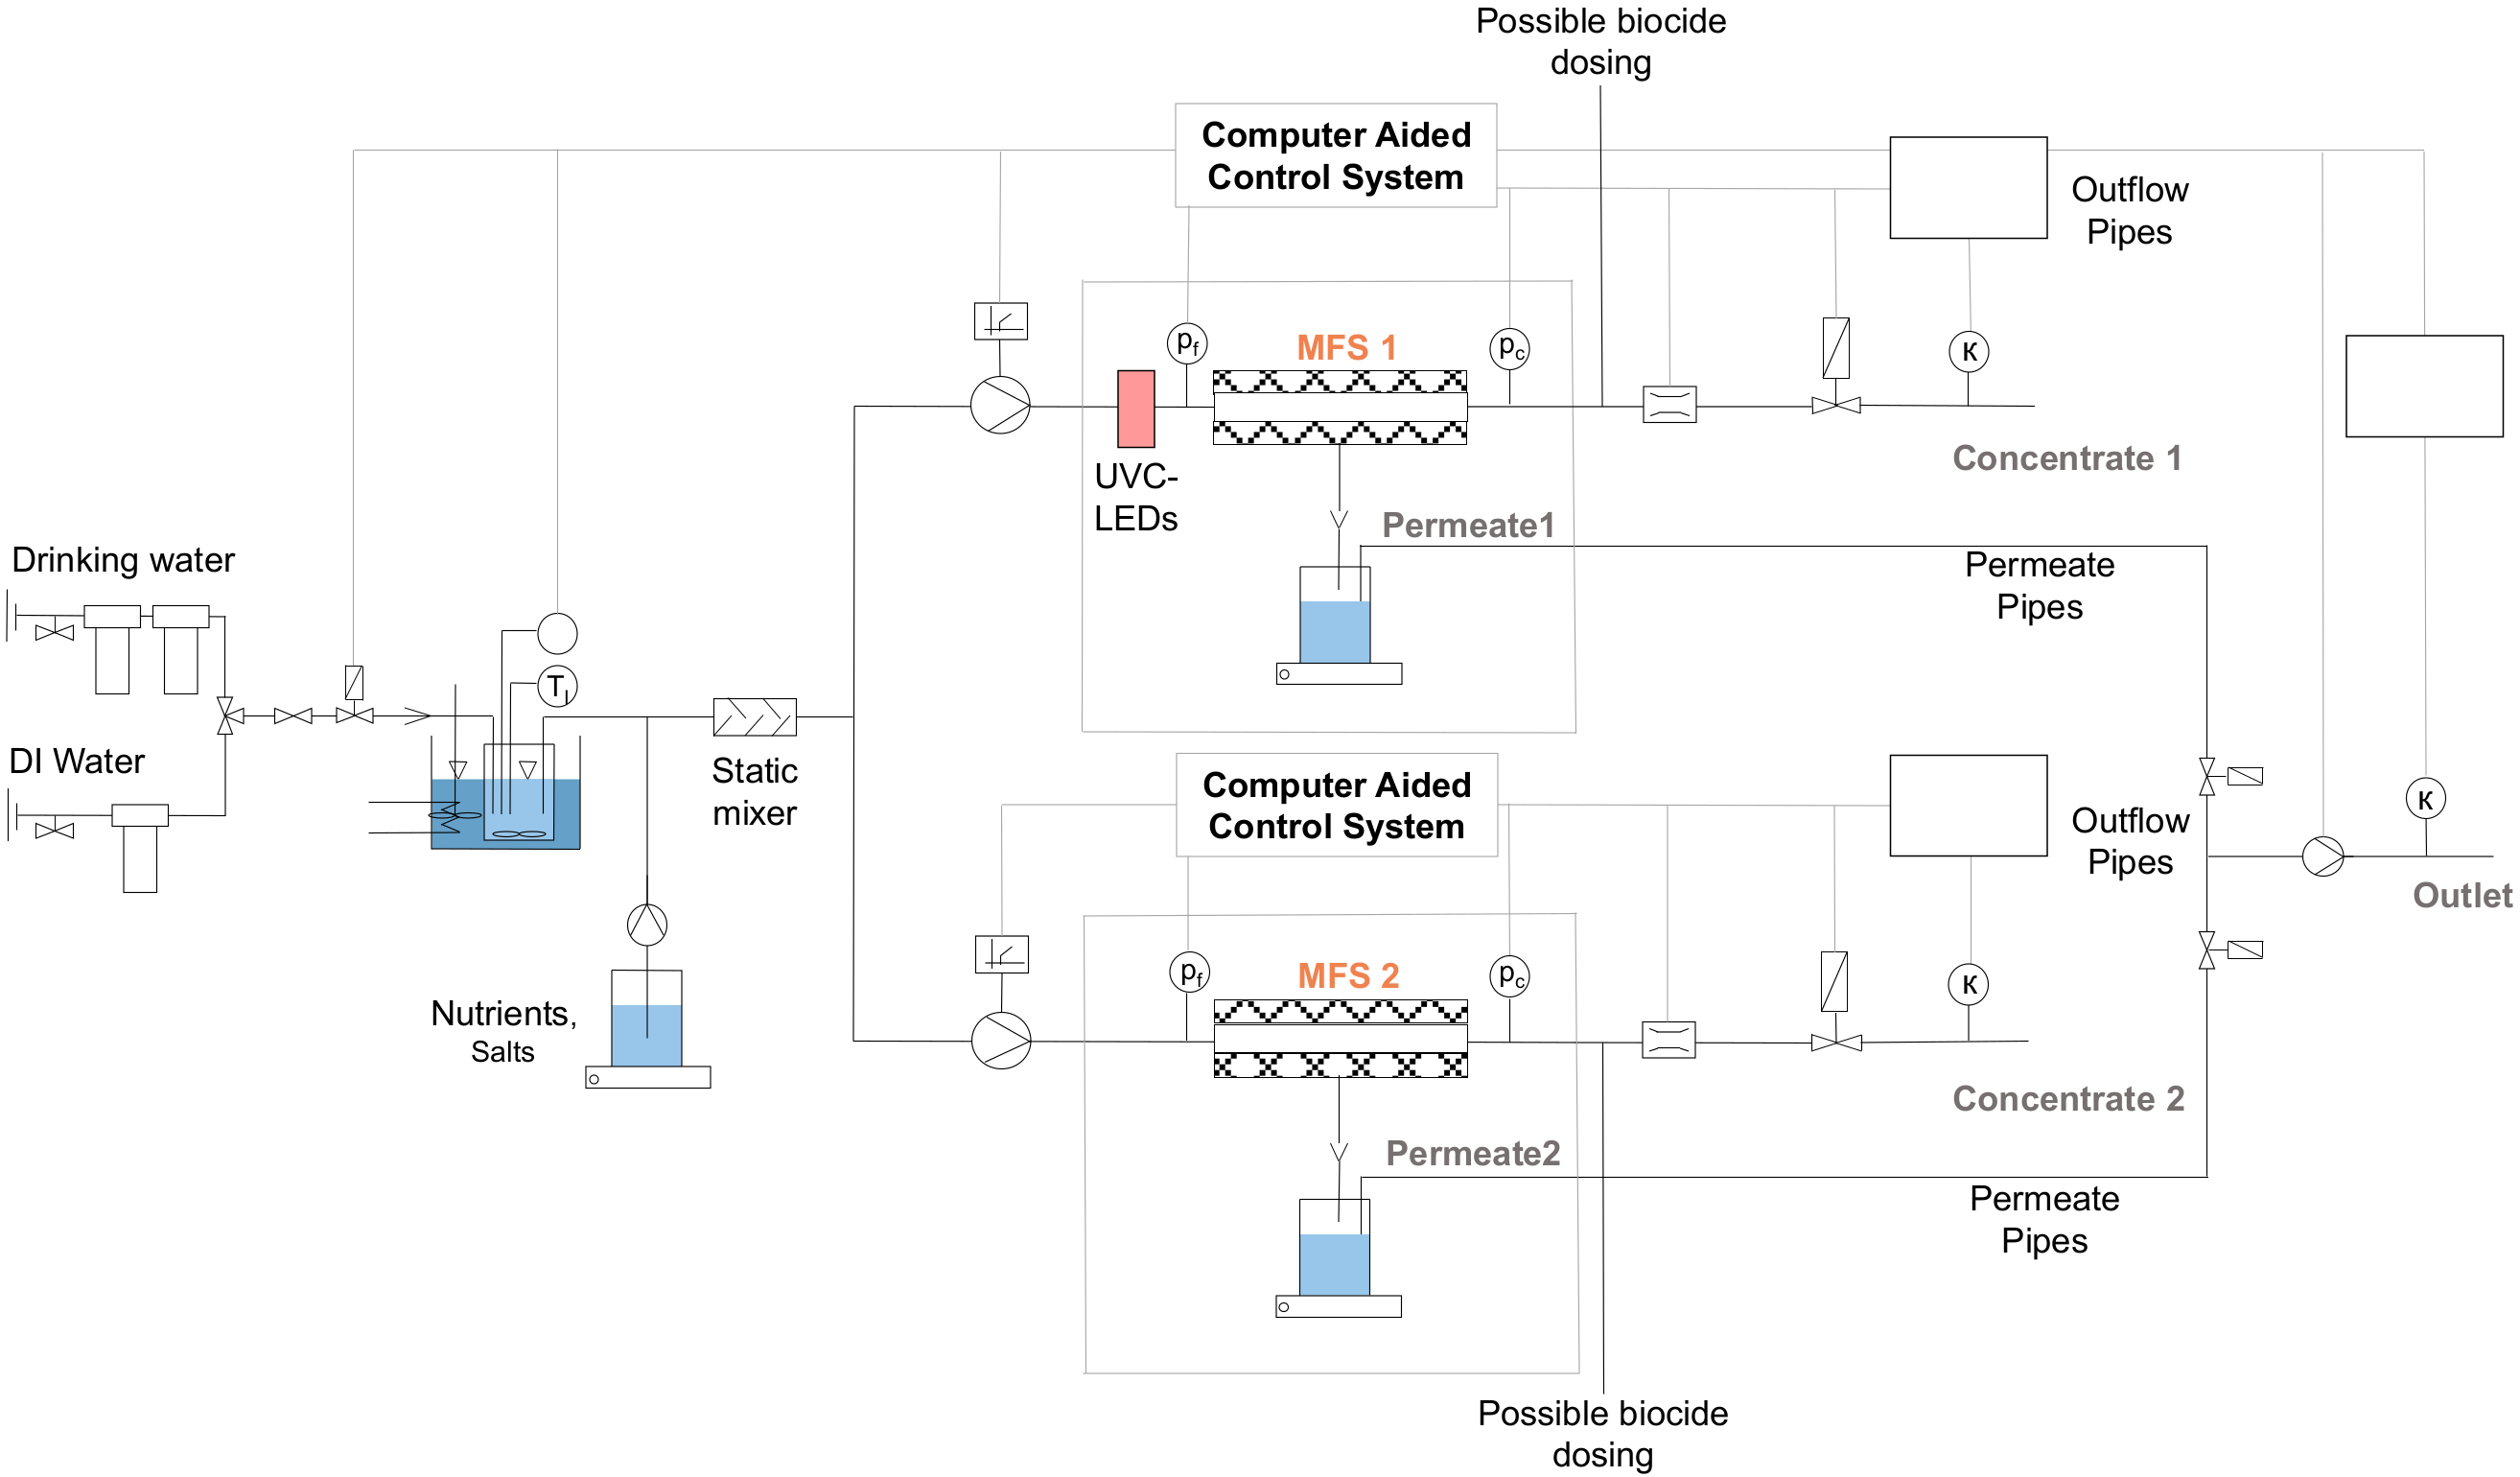
2.1. UV Reactor and Laboratory Skid for Biofouling Experiments
2.2. Accelerated Biofouling Experiments
- Cleaning and sterilization: Membranes were stored at 4 °C in 1% NaHSO3 (Acros Organics, Geel, Belgium) until used [71]. The cleaning of the system included flushing with 0.1% NaOH (Merck, Darmstadt, Germany) to remove organic matter [71]. Sterilization was done by autoclaving at 121 °C for 20 min or soaking in 0.25% H2O2 solution (Merck, Darmstadt, Germany), analogous to [71,72,73,74,75].
- Reassembling of the skid: After cleaning and sterilization, the skid was reassembled under sterile conditions.
- Compaction: Before starting each biofouling experiment, a 16-h compaction, using an NaCl solution (Appli Chem, Darmstadt, Germany), was performed and the flux was set to 20 L∙m−2∙h−1 (LMH). Depending on the initial membrane permeability, the feed pressure varied between 3.5 and 6 bar. The crossflow through the MFS is maintained at 4.25 L∙h−1 resulting in an empty channel velocity of 0.116 m∙s−1.
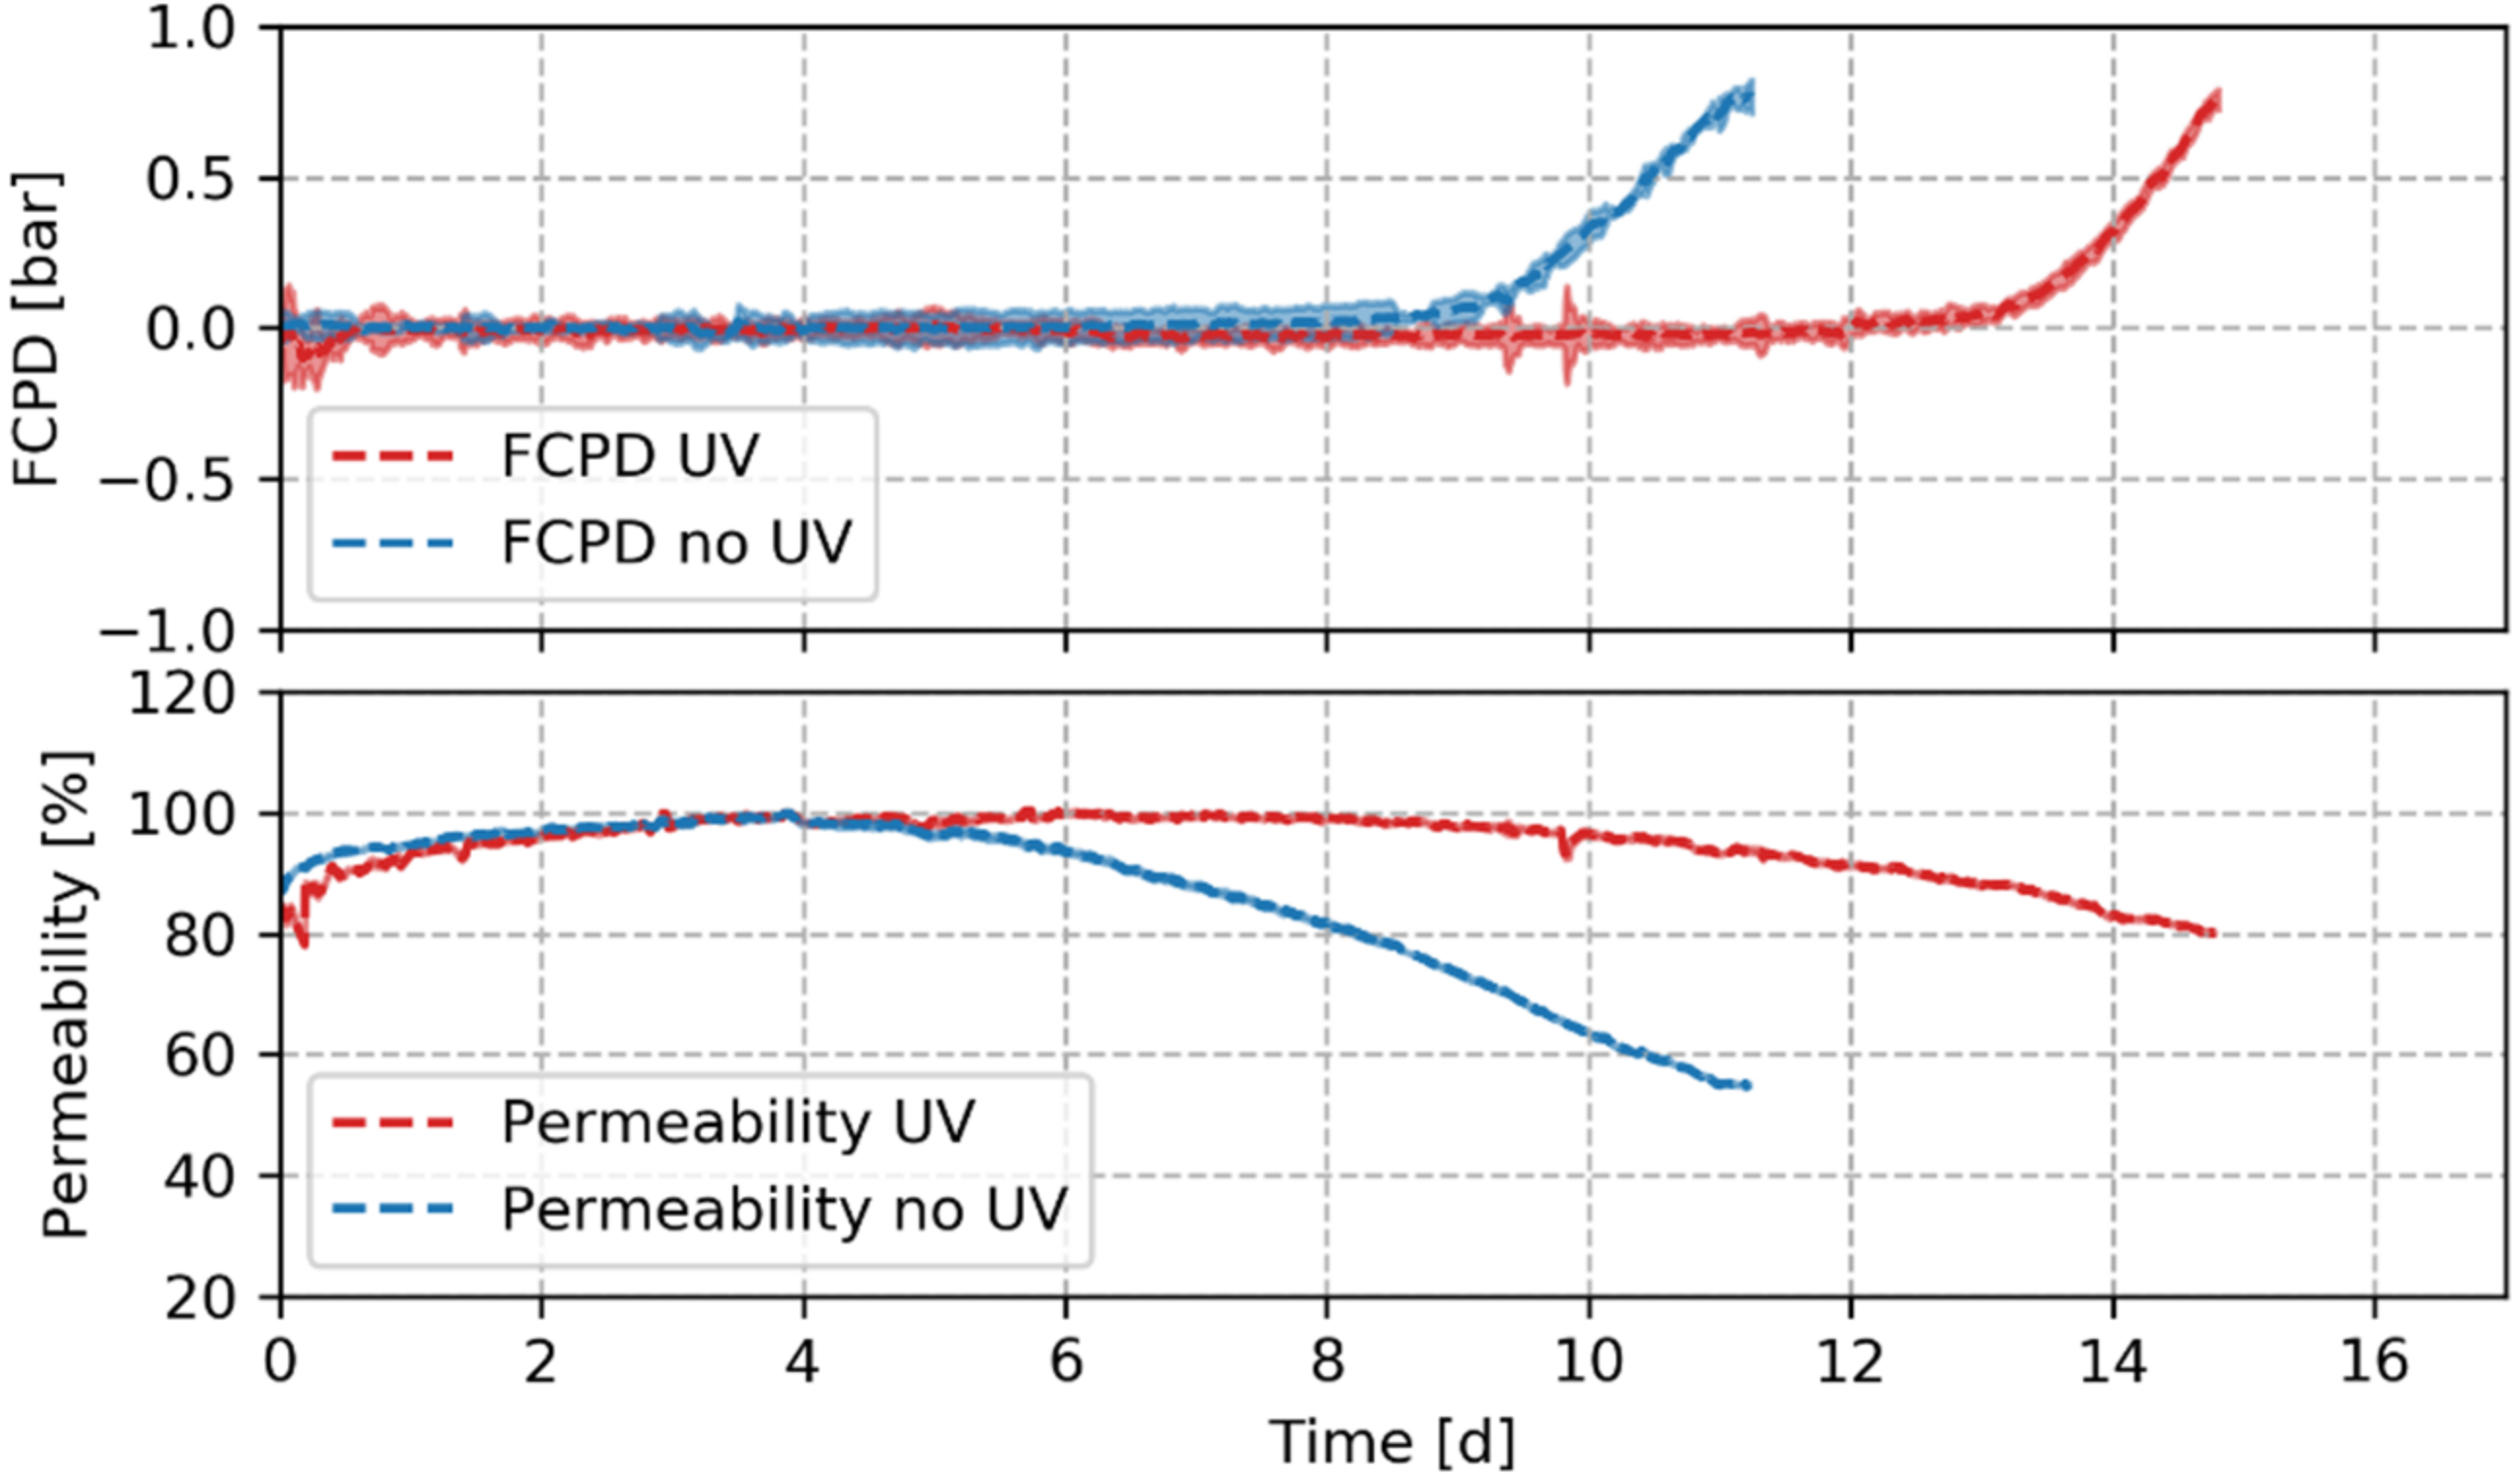
- Accelerated biofouling phase: Biofouling experiments were performed by using tap water as feed with nutrient dosing to reach a target concentration of 1000:200:100 μg∙L−1 of C:N:P [40]. Temperature was maintained at 15 °C and feed pressure (set in compaction) was kept constant. When an FCPD of 0.8 bar was reached, the experiments were terminated.
2.3. Biofilm Extraction and Analysis
2.4. Analytical Methods
- Total organic carbon (TOC) was analyzed as a non-purgeable organic carbon using the Vario TOC cube analyzer (Elementar Analysensyteme, Langenselbold, Germany) [79]. Biofilm samples were diluted 1:50 prior to analysis.
- ATP was measured using the BacTiter-Glow assay (Promega, Walldorf, Germany). The manufacturer’s guideline [80] was followed using flat white 96 multiwell plates (Thermo Scientific, Langenselbold, Germany) and the Tecan Infinite M Plex reader (Männedorf, Switzerland). ATP standards were prepared using adenosine 5′-triphosphat disodium salt (Sigma-Aldrich Chemie, Taufkirchen, Germany). As inner filter effects were observed during ATP analysis, each sample was diluted 1:5, 1:10 and 1:20. The luminescence signal was interpolated to an undiluted state and converted to ATP concentrations with the standard curve.
- Total direct cell counts (TDC) was performed following the procedure of Boulos et al. [81] using the LIVE/DEAD BacLight kit (Thermo Scientific, Langenselbold, Germany). For filtration, the 0.22 µm black polycarbonate filter manufactured by Piper Filter (Bad Zwischenahn, Germany) were utilized. With this kit, it is possible to differentiate cells with intact and damaged cell membrane [81]. Images were taken using the Axioplan 2 imaging employing the Axiocam 503 color camera (Zeiss, Oberkochen, Germany). Cell counting was performed using the Matlab Version (R2018b, Mathworks, Natick, MA, USA) of the CellC software v. 1.2 [79].
- Protein analysis was done using the modified Lowry protein assay kit (Thermo Scientific, Langenselbold, Germany). Transparent 96 well flat transparent microplates (Greiner Bio-One, Frickenhausen, Germany) were used with the Infinite M Plex reader (Tecan, Männedorf, Switzerland). The protein standard curve was prepared using bovine serum albumin (Thermo Scientific, Waltham, MA, USA).
- Polysaccharides were quantified using the method described by Masuko et al. [82]. Concentrated sulfuric acid was purchased from Merck (Darmstadt, Germany) and phenol from Sigma Aldrich (St. Louis, MO, USA). Standards were prepared using d-(+)-glucose (Alfa Aesar by Thermo Fisher Scientific, Kandel, Germany). The same multiwell plates and reader as for proteins were utilized.
- Fluorescence spectroscopy was performed using the Aqualog (HORIBA Jobin Yvon, Bensheim, Germany). Two different kinds of samples were analyzed: once the biofilm sample filtered by 0.45 µm (VWR, Radnor, PA, USA) and the EPS sample unfiltered. Both samples were diluted 1:20 to reduce inner filter effects. Instrument settings are summarized in the Supplementary Materials [68]. QS high precision cell made of quartz SUPRASIL by Hellma (Müllheim, Germany) was utilized as cuvette.
- For 16S rRNA amplicon sequencing, 1.5 mL of sample was freeze dried, resuspended in 50 µL nuclease-free water (Promega, Walldorf, Germany) and DNA was extracted using the DNeasy PowerSoil kit (Qiagen, Hilden, Germany). The rRNA sequencing was performed by ZIEL—Institute for Food & Health (Freising, Germany) using the primers 341F/806R and a MiSeq Reagent Kit v3 on an Illumina MiSeq benchtop sequencer (Illumina, San Diego, CA, USA). Raw reads were uploaded to the European Nucleotide Archive (ENA) database (PRJEB41202 (ERP124942)).
2.5. Summary of the Performed Biofouling Experiments
2.6. Actinometry
2.7. Data Analysis
3. Results and Discussion
3.1. Characterization of the UVC-LED Reactor
3.2. Impact of UVC Pretreatment on the Biofilm Formation and Hydraulic Resistance
- Reduction of viable bacteria in the feed: UV disinfection using UVC light is a process known for its capability to inactivate microorganisms [45,46,47,48]. Inactivation was observed in studies investigating the potential of UV pretreatment for biofouling control [58,60,61]. Li et al. [115] reported that during UV disinfection of Escherichia coli, irradiation using a 278 nm wavelength LED inhibited photoreactivation and dark repair, probably caused by impairment of protein activities.
- Changed adhesion properties: RO membranes are commonly negatively charged and rather hydrophobic at pH 7 and becoming more hydrophilic with increasing ion concentrations [116]. During UVA disinfection a depolarization of the cells’ membrane potential was observed [56]. Similar effects are assumed to happen while using 278 nm UV-LEDs, with potential effects on the proteins of the cells [115]. On the one hand, a reduction in cell membrane potential would lead to a lower electric repulsion with the membrane which could lead to better adhesion. On the other hand, according to Otto and Silhavy [117], the outer membrane lipoprotein NlpE is required for activation of the cpxR system and a successful attachment of cells to hydrophobic surfaces. In case the NlpE protein of the cell membrane is damaged due to the UV treatment, it could possibly lead to a reduced adhesion. However, the CpxRA system is complex and can be affected by multiple causes [118,119]. Whereas Kolappan and Satheesh [62] observed a reduced attachment of Alteromonas sp. cells to hard surfaces due to UV treatment, Friedman et al. [120] rather linked a reduced viable cell count to a reduced cell abundance on surfaces within their experiments.
3.3. Membrane Autopsy and Biofilm Analysis
3.4. Fluorescence Spectroscopy and PARAFAC Modeling
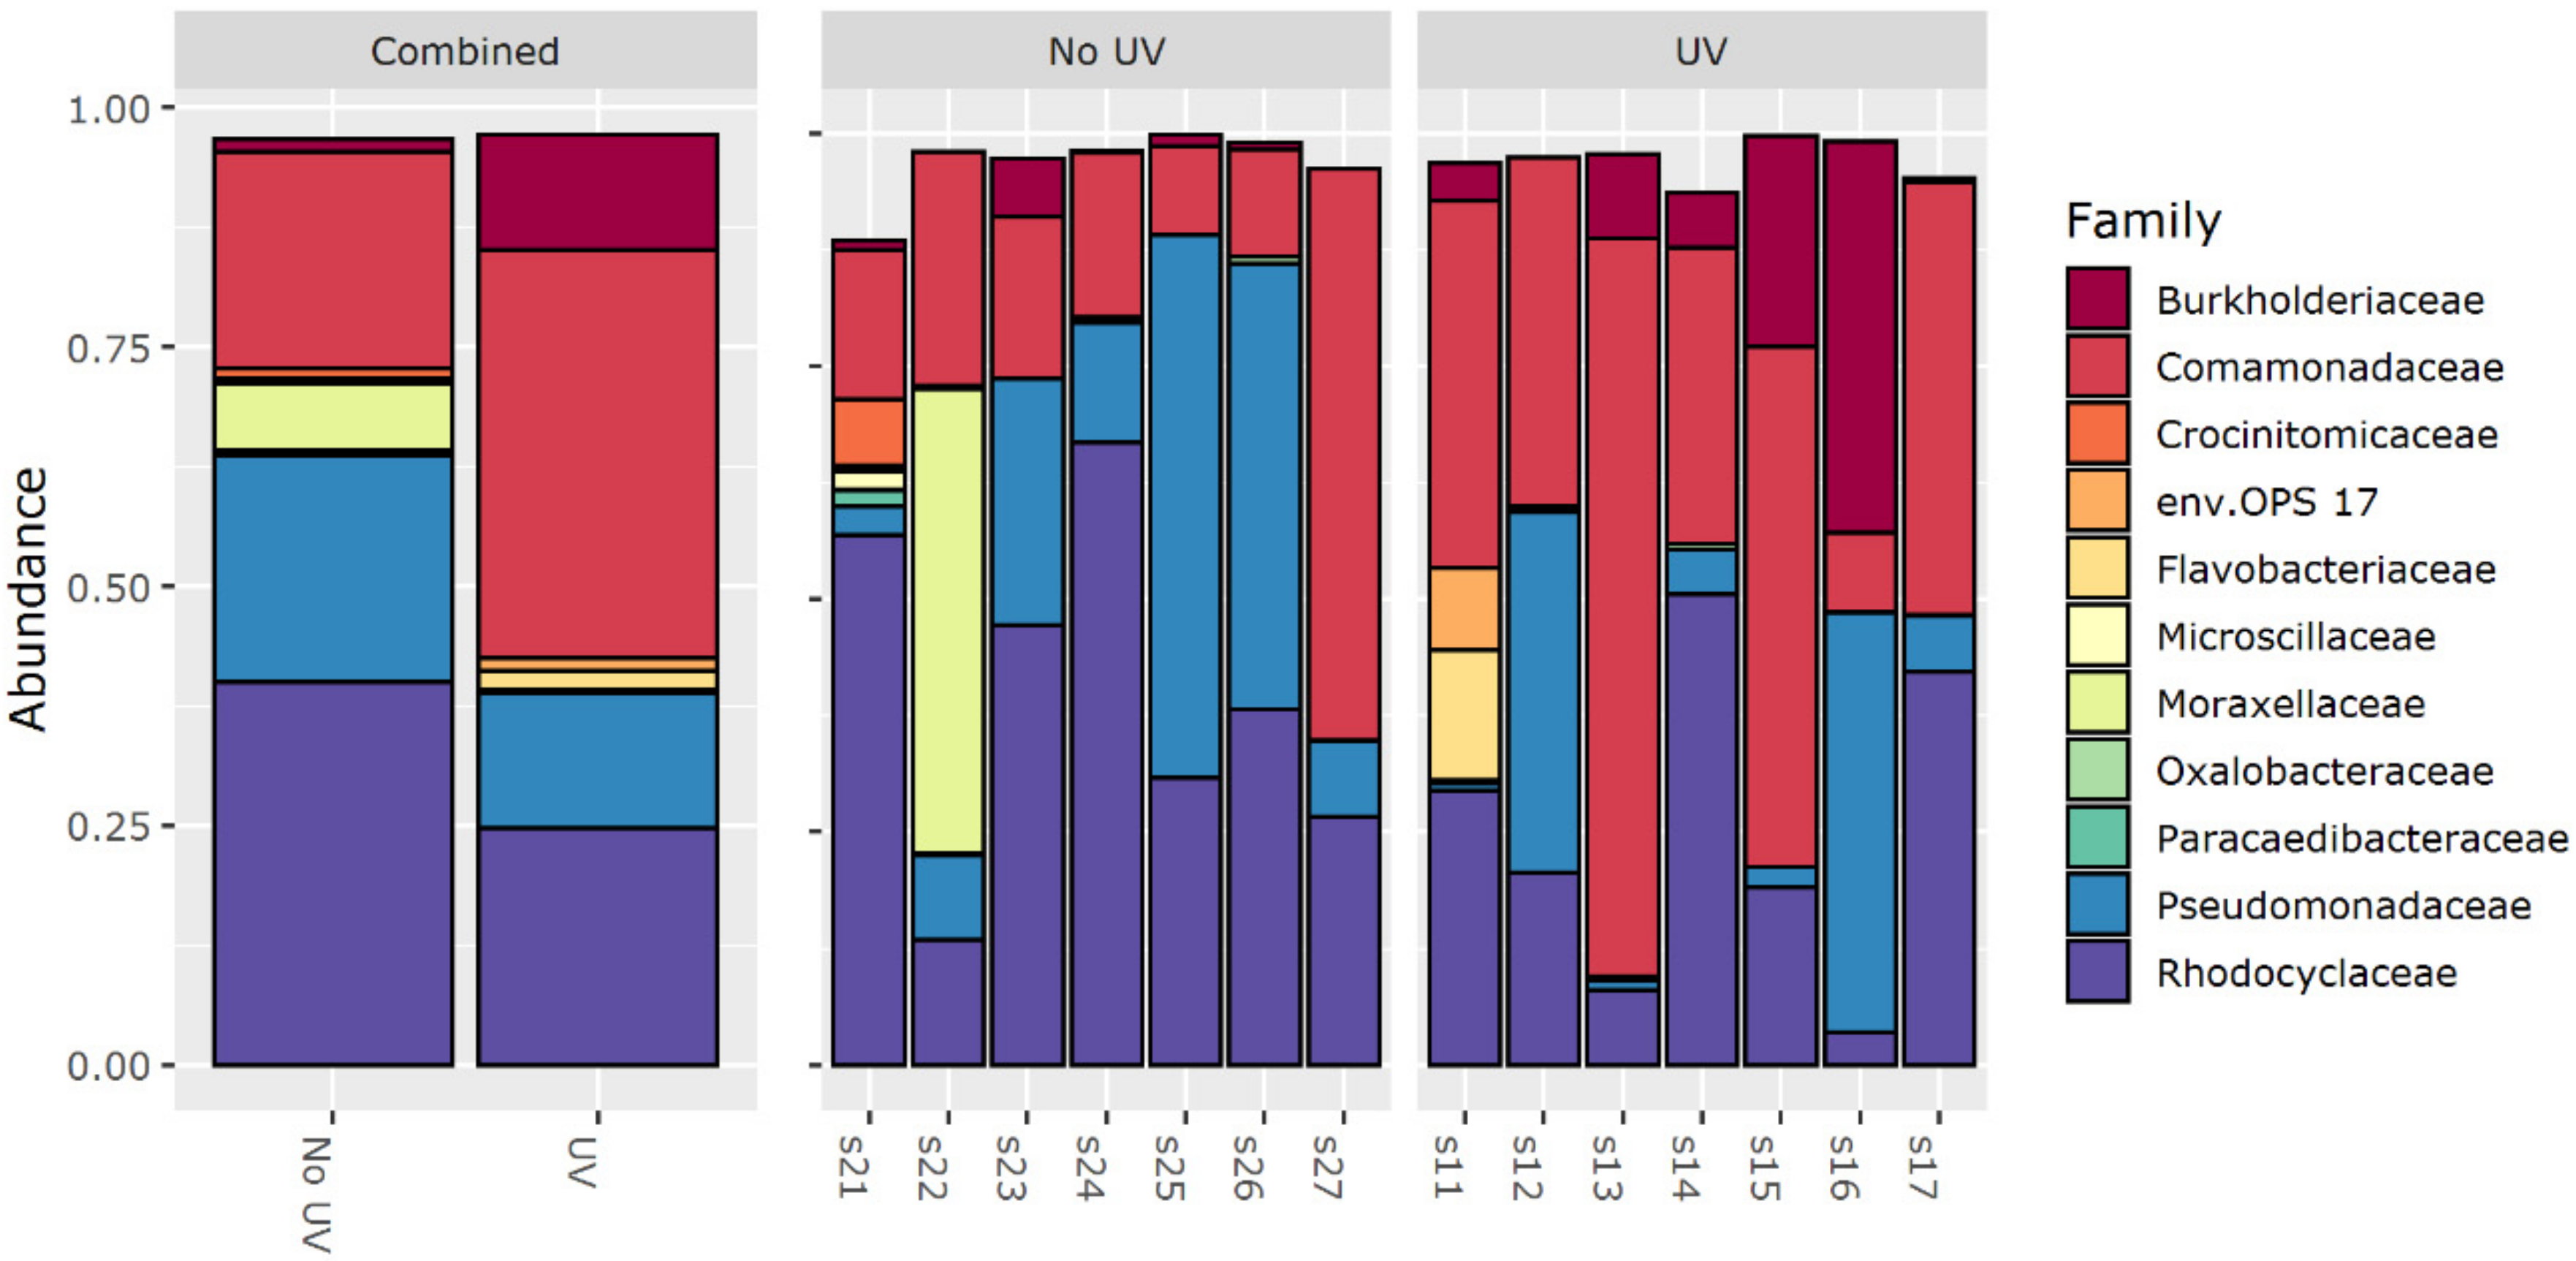
3.5. 16S rRNA Amplicon Sequencing
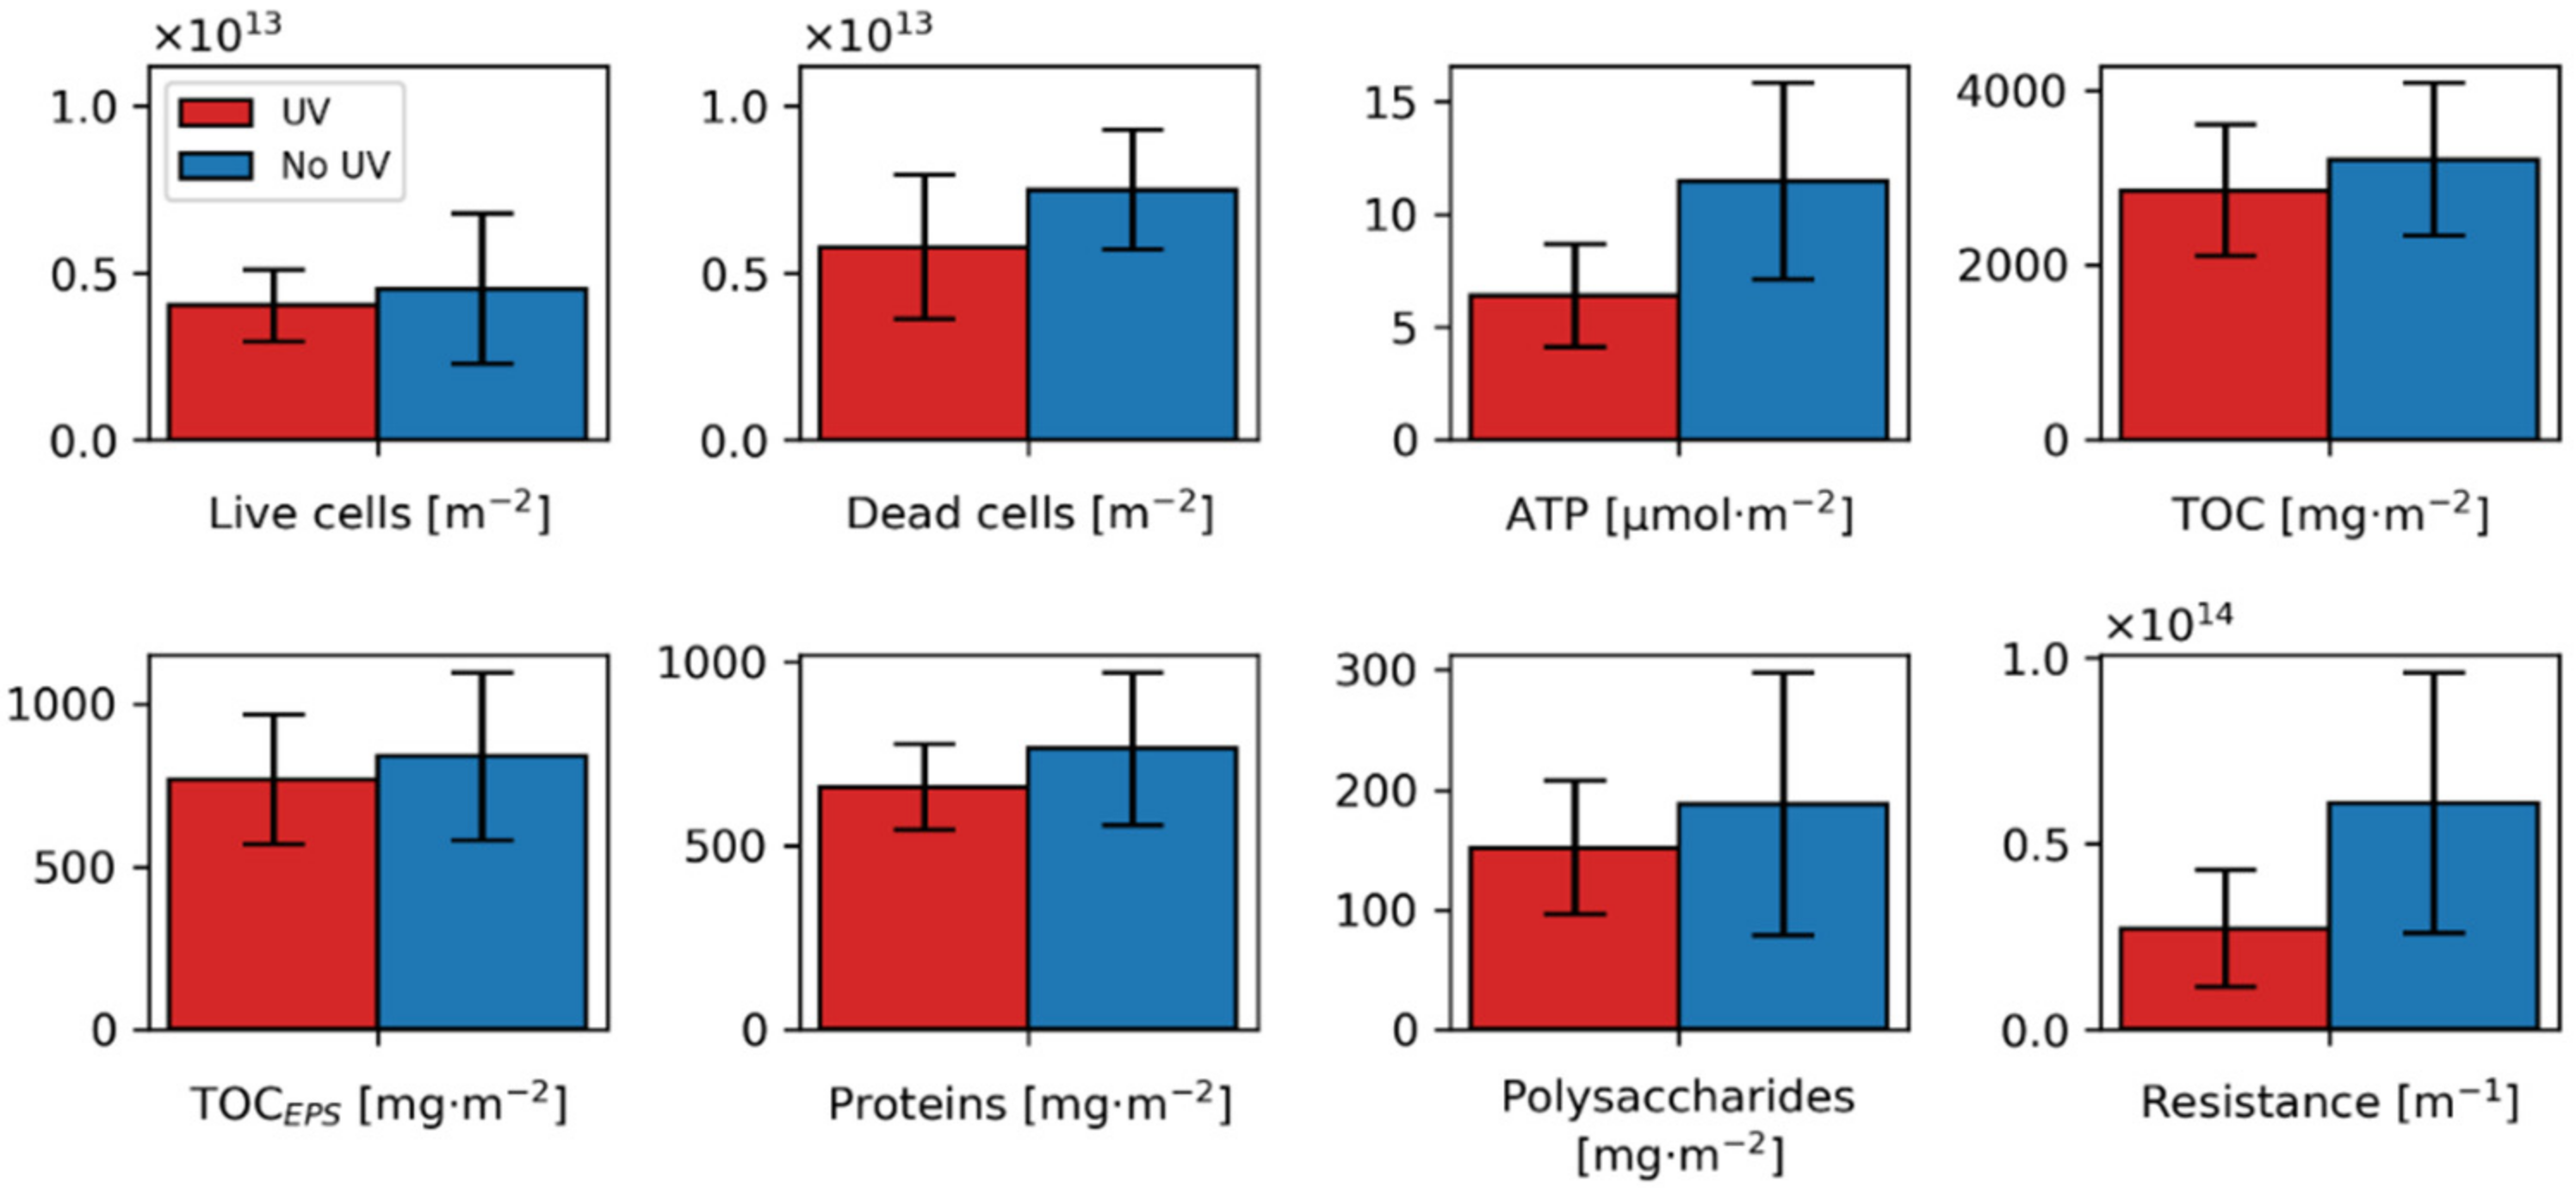
3.6. Correlation of Hydraulic Resistance to the Main Biofilm Attributes
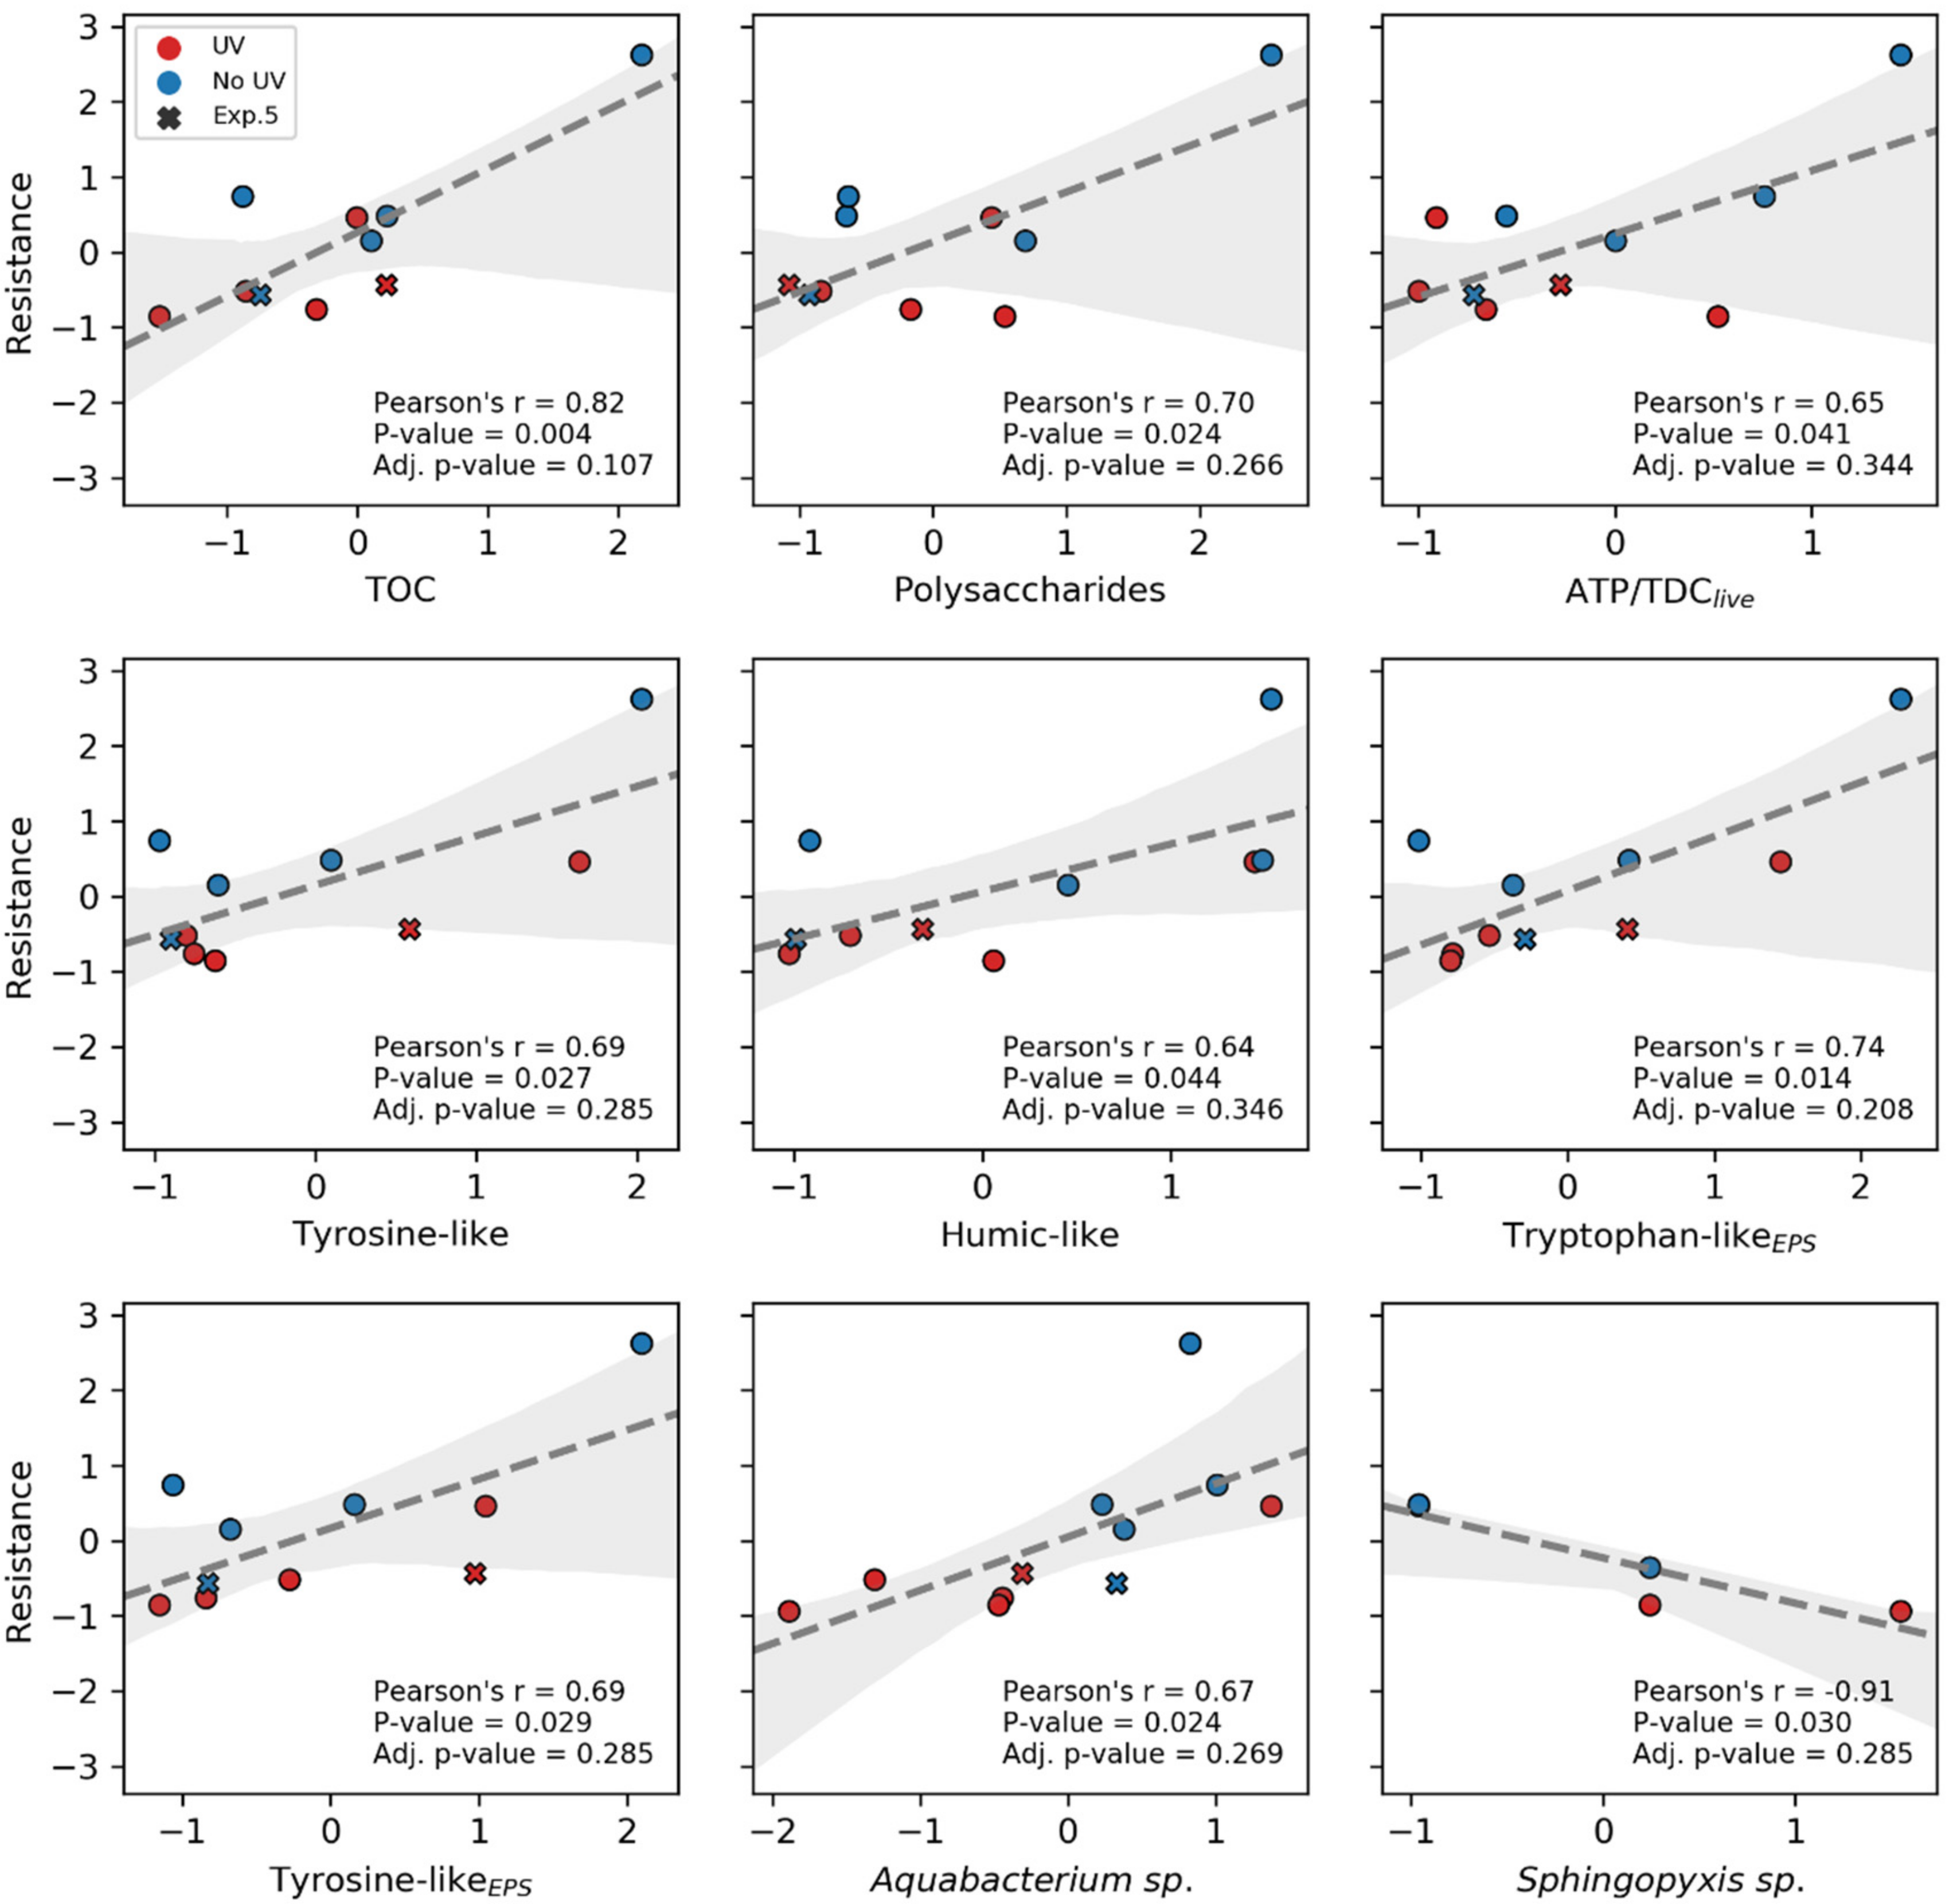
- Different quantity in EPS production: As reported in the literature [40,122], polysaccharides and proteins are linked to hydraulic resistance. Even though no significant change for EPS content of treated and untreated biofilms could be revealed, a consistent trend for a reduced average in EPS and TOC quantities for the UV pretreated biofilm could be seen (11, 8, 14 and 19% for TOC, TOCEPS, Proteins and Polysaccharides, respectively). A significant difference in EPS quantity could probably not be detected due to the low number of replicates (n = 6) or because there exists an interplay among those parameters, making a simple comparison difficult.
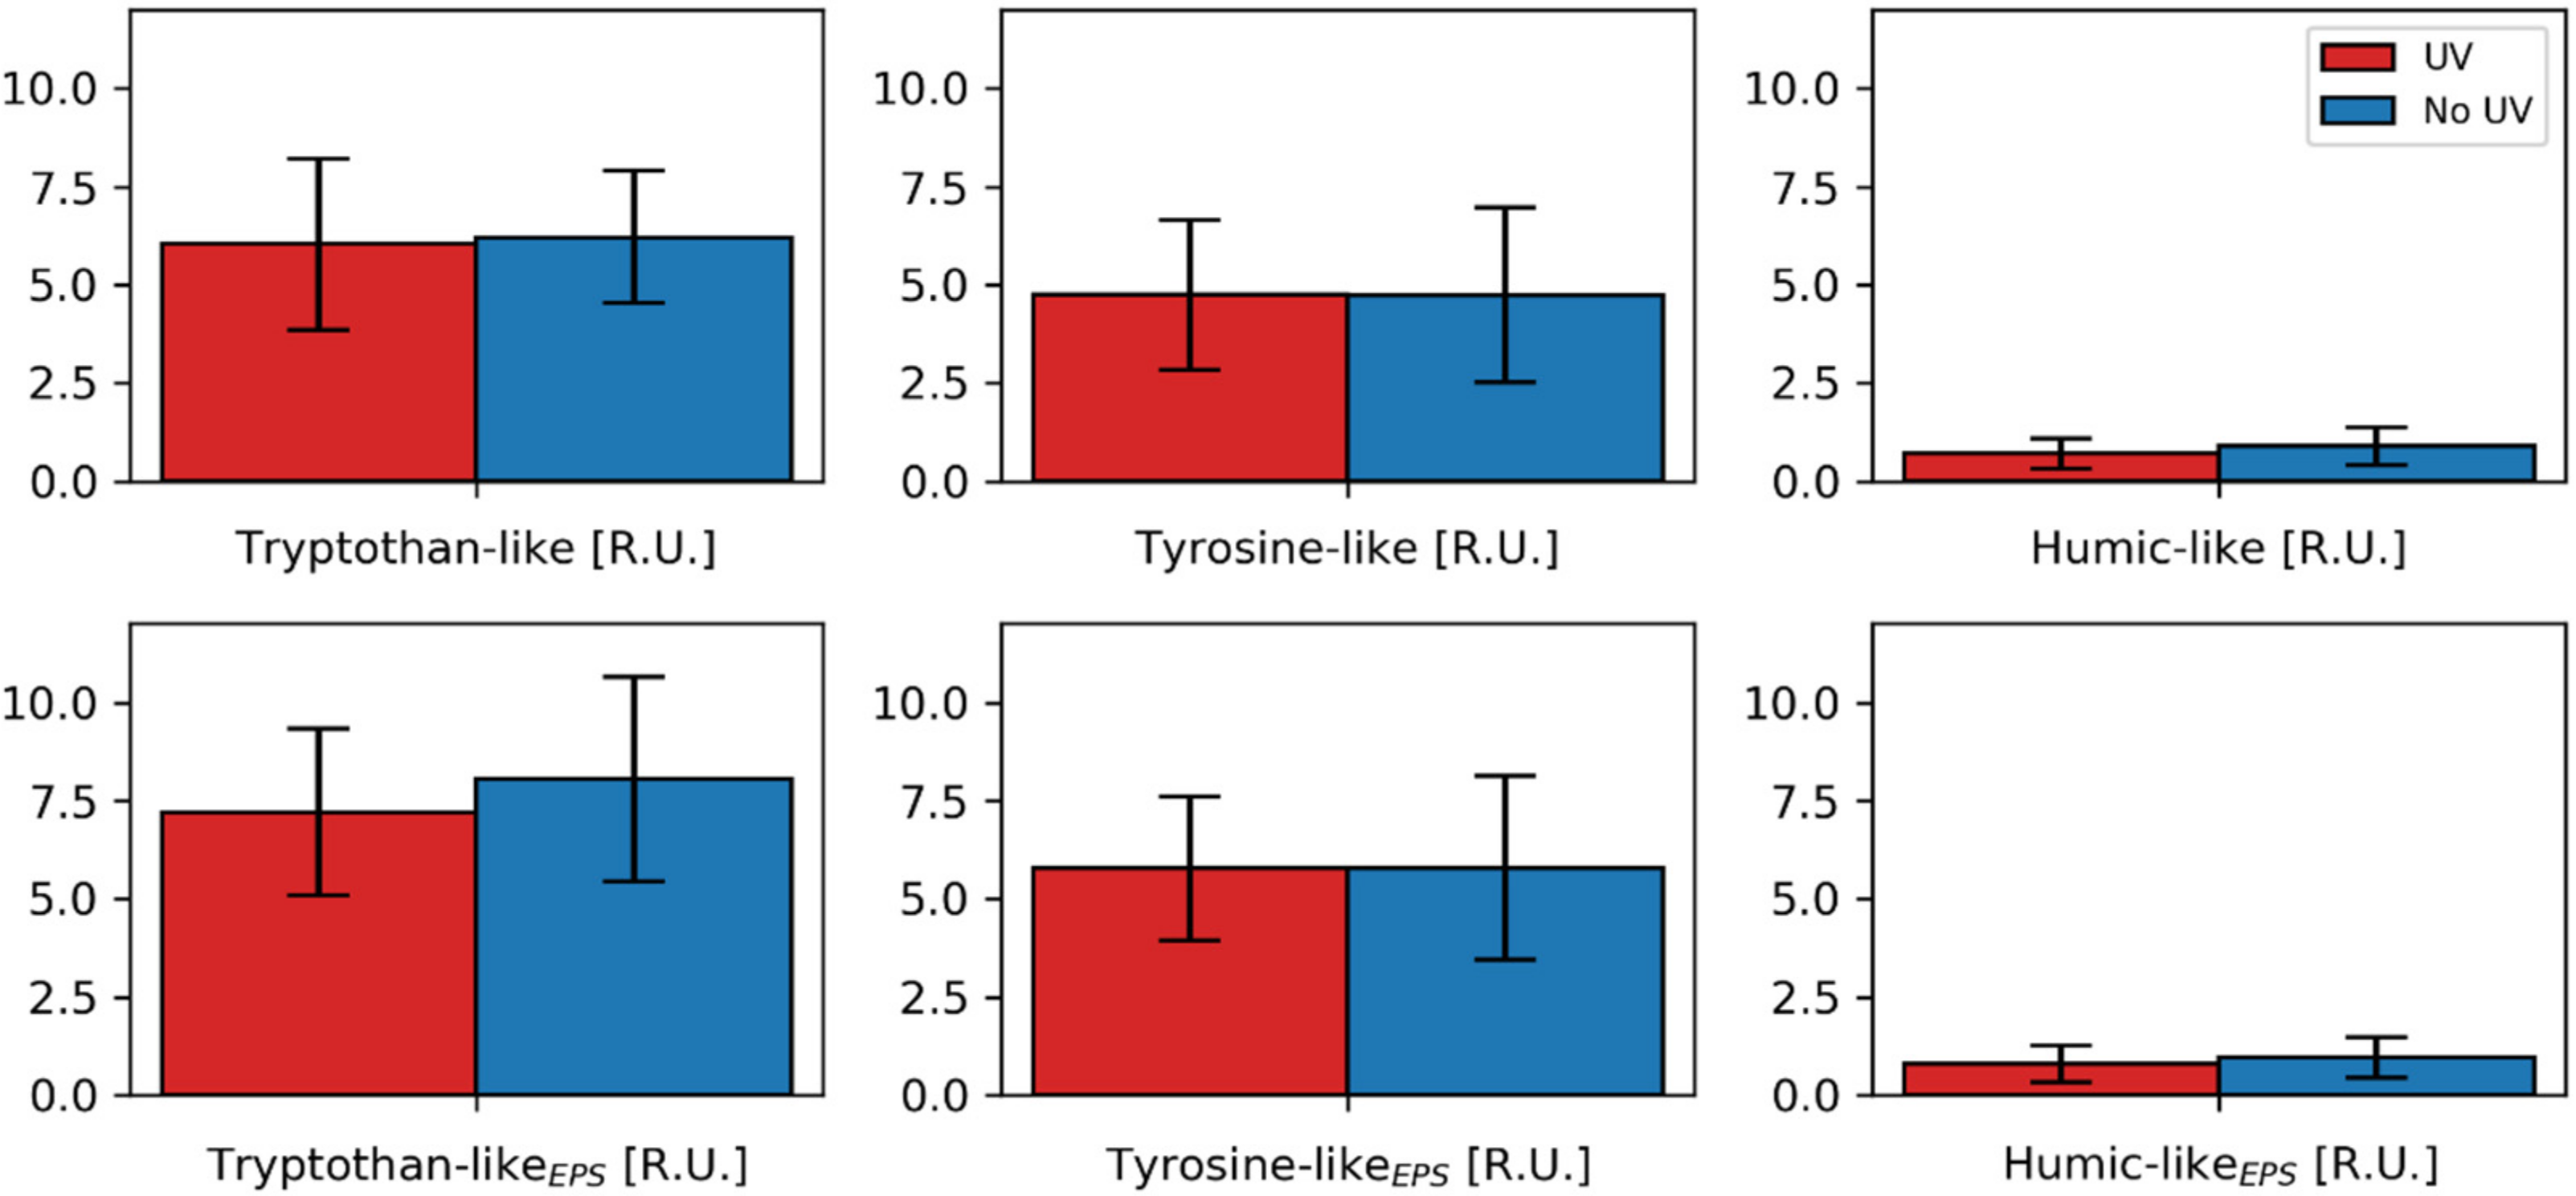
- Changed EPS composition/quality and biofilm morphology due to changed biodiversity: UV pretreatment seems to alter the microbial community present in biofilms. Interestingly, the genera that showed a significantly differential abundance did not correlate with the biofilm resistance. Furthermore, within the PARAFAC analysis, at least no differences for expression of tyrosine- or tryptophan-like proteins was found. Still, a change in the microbial community could lead to different EPS quality [20]. A difference in EPS composition could also be polysaccharide-related or not be detected with fluorescence measurements.
- Reduced ATP levels impact quorum sensing or vice versa: The ATP/TDClive ratio correlates with the hydraulic resistance and seems to be changed by the UV treatment. Still the cause for a reduced ATP level and the effects for the biofilm resistance are not clear. Yang et al. [135] observed an ATP reduction over time for UV-irradiated bacteria, especially for medium pressure UV lamps. Thus, cells irradiated and subsequently adhered to the biofilm could exhibit lower ATP levels. Furthermore, different kinds of microorganisms could show different levels of ATP [136]. Jiang and Liu [137] recognized that if ATP production is limited in aerobic granules, the amount of AHL messenger molecules and EPS is reduced. Vice versa, Zhang et al. [138] showed in their study that with increasing concentration of quorum sensing molecules (AHLs), ATP levels rose. The reduced ATP levels in the UV treated biofilms could, therefore, indicate less quorum sensing. Additionally, Zhang et al. [138] observed that ATP needs to be present in a sufficient amount for EPS production. A reduction of quorum sensing could also be caused by an altered microbial community [39,138,139]. Not only microorganisms showing increased AHL production could show a changed abundance, but also those quenching AHL signals. According to the review of Uroz et al. [39], Delftia acidovorans [140], Ralstonia sp.XJ12B [141] and Sphingomonas [142] could degrade or modify AHL signal molecules. Whereas a Delftia strain was found with reduced abundance in the UV treated biofilms, the Ralstonia and Sphingomonas strains were increased. Unfortunately, in this study, it was beyond the scope to directly elucidate how the AHL concentration affects the ATP levels. Nevertheless, AHL expression might not only impact the quantity of EPS but also correlate with the production of tightly and loosely bound EPS [139]. This could possibly affect the resistance of the formed biofilm.
- Introduction of prophage: Stress conditions, such as DNA damage, are known to lead to prophage induction to biofilms, which can further lead to biofilm dispersal or disruption [118,143]. Biofilm dispersal could not only lead to a delayed build-up but also create a more open structure, leading to lower resistance.
4. Conclusions
Supplementary Materials
Author Contributions
Funding
Acknowledgments
Conflicts of Interest
References
- Mekonnen, M.M.; Hoekstra, A.Y. Four billion people facing severe water scarcity. Sci. Adv. 2016, 2, e1500323. [Google Scholar] [CrossRef]
- Unesco. Wastewater. The Untapped Resource; UNESCO: Paris, French, 2017; ISBN 978-92-3-100201-4. [Google Scholar]
- Drewes, J.E.; Khan, S. Water Reuse for Drinking Water Augmentation. In Water Quality & Treatment: A Handbook on Drinking Water, 6th ed.; Edzwald, J.K., Ed.; McGraw-Hill: New York, NY, USA, 2011; pp. 16.1–16.48. ISBN 9780071630115. [Google Scholar]
- Drewes, J.E.; Horstmeyer, N.; Michel, P.; Khan, S. Producing high-quality recycled water. In Innovative Wastewater Treatment & Resource Recovery Technologies: Impacts on Energy, Economy and Environment; Lema, J.M., Suarez Martinez, S., Eds.; IWA Publishing: London, UK, 2017; pp. 285–295. ISBN 1780407866. [Google Scholar]
- Côté, P.; Siverns, S.; Monti, S. Comparison of Membrane-based Solutions for Water Reclamation and Desalination. Desalination 2005, 182, 251–257. [Google Scholar] [CrossRef]
- Dolnicar, S.; Schäfer, A.I. Desalinated versus recycled water: Public perceptions and profiles of the accepters. J. Environ. Manage. 2009, 90, 888–900. [Google Scholar] [CrossRef]
- Tomaszewska, M. Industrial wastewater treatment by means of membrane techniques. Polish J. Chem. Technol. 2007, 9, 149. [Google Scholar] [CrossRef]
- Howe, K.J.; Hand, D.W.; Crittenden, J.C.; Trussell, R.R.; Tchobanoglous, G. Principles of Water Treatment; Wiley: Hoboken, NJ, USA, 2012; ISBN 978-0-470-40538-3. [Google Scholar]
- Guo, W.; Ngo, H.-H.; Li, J. A mini-review on membrane fouling. Bioresour. Technol. 2012, 122, 27–34. [Google Scholar] [CrossRef]
- Koros, W.J.; Ma, Y.H.; Shimidzu, T. Terminology for membranes and membrane processes (IUPAC Recommendations 1996). Pure Appl. Chem. 1996, 68, 1479–1489. [Google Scholar] [CrossRef]
- Baker, J.S.; Dudley, L.Y. Biofouling in membrane systems—A review. Desalination 1998, 118, 81–89. [Google Scholar] [CrossRef]
- Flemming, H.-C.; Schaule, G.; Griebe, T.; Schmitt, J.; Tamachkiarowa, A. Biofouling—The Achilles heel of membrane processes. Desalination 1997, 113, 215–225. [Google Scholar] [CrossRef]
- Flemming, H.-C. Biofouling and me: My Stockholm syndrome with biofilms. Water Res. 2020, 173, 115576. [Google Scholar] [CrossRef]
- Flemming, H.-C. Microbial Biofouling: Unsolved Problems, Insufficient Approaches, and Possible Solutions. In Biofilm Highlights; Flemming, H.-C., Wingender, J., Szewzyk, U., Eds.; Springer: Berlin/Heidelberg, Germany, 2011; ISBN 978-3-642-19939-4. [Google Scholar]
- Vrouwenvelder, J.S.; Kruithof, J.; van Loosdrecht, M. Biofouling of Spiral Wound Membrane Systems; IWA Publishing: London, UK, 2009; ISBN 9781843393634. [Google Scholar]
- Characklis, W.G.; Marshall, K.C. (Eds.) Biofilms; John Wiley & Sons: New York, NY, USA, 1990; ISBN 978-0471826637. [Google Scholar]
- Flemming, H.-C.; Wingender, J.; Szewzyk, U. (Eds.) Biofilm Highlights; Springer: Berlin/Heidelberg, Germany, 2011; ISBN 978-3-642-19939-4. [Google Scholar]
- Nguyen, T.; Roddick, F.A.; Fan, L. Biofouling of water treatment membranes: A review of the underlying causes, monitoring techniques and control measures. Membranes 2012, 2, 804–840. [Google Scholar] [CrossRef]
- Wilbert, M.C. Enhancement of Membrane Fouling Resistance through Surface Modification. A Study Using the Principle of Membrane Fouling and Cleaning To Develop Ways to Enhance Membrane Fouling Resistance; Water Treatment Technology Program Report No. 22; US Department of the Interior, Bureau of Reclamation: Denver, CO, USA, 1997.
- Flemming, H.-C.; Wingender, J. The biofilm matrix. Nat. Rev. Microbiol. 2010, 8, 623–633. [Google Scholar] [CrossRef] [PubMed]
- Sánchez, O. Microbial diversity in biofilms from reverse osmosis membranes: A short review. J. Membr. Sci. 2018, 545, 240–249. [Google Scholar] [CrossRef]
- Khan, M.T.O.; de Manes, C.-L.; Aubry, C.; Gutierrez, L.; Croue, J.P. Kinetic study of seawater reverse osmosis membrane fouling. Environ. Sci. Technol. 2013, 47, 10884–10894. [Google Scholar] [CrossRef] [PubMed]
- Bereschenko, L.A.; Heilig, G.H.J.; Nederlof, M.M.; van Loosdrecht, M.C.M.; Stams, A.J.M.; Euverink, G.J.W. Molecular characterization of the bacterial communities in the different compartments of a full-scale reverse-osmosis water purification plant. Appl. Environ. Microbiol. 2008, 74, 5297–5304. [Google Scholar] [CrossRef]
- Bereschenko, L.A.; Stams, A.J.M.; Euverink, G.J.W.; van Loosdrecht, M.C.M. Biofilm formation on reverse osmosis membranes is initiated and dominated by Sphingomonas spp. Appl. Environ. Microbiol. 2010, 76, 2623–2632. [Google Scholar] [CrossRef]
- Gutman, J.; Herzberg, M.; Walker, S.L. Biofouling of reverse osmosis membranes: Positively contributing factors of Sphingomonas. Environ. Sci. Technol. 2014, 48, 13941–13950. [Google Scholar] [CrossRef]
- Huang, L.-N.; de Wever, H.; Diels, L. Diverse and distinct bacterial communities induced biofilm fouling in membrane bioreactors operated under different conditions. Environ. Sci. Technol. 2008, 42, 8360–8366. [Google Scholar] [CrossRef]
- Pang, C.M.; Liu, W.-T. Community structure analysis of reverse osmosis membrane biofilms and the significance of Rhizobiales bacteria in biofouling. Environ. Sci. Technol. 2007, 41, 4728–4734. [Google Scholar] [CrossRef]
- De Vries, H.J.; Stams, A.J.M.; Plugge, C.M. Biodiversity and ecology of microorganisms in high pressure membrane filtration systems. Water Res. 2020, 172, 115511. [Google Scholar] [CrossRef]
- Herzberg, M.; Elimelech, M. Physiology and genetic traits of reverse osmosis membrane biofilms: A case study with Pseudomonas aeruginosa. ISME J. 2008, 2, 180–194. [Google Scholar] [CrossRef]
- Ridgway, H.F.; Kelly, A.; Justice, C.; Olson, B.H. Microbial fouling of reverse-osmosis membranes used in advanced wastewater treatment technology: Chemical, bacteriological, and ultrastructural analyses. Appl. Environ. Microbiol. 1983, 45, 1066–1084. [Google Scholar] [CrossRef] [PubMed]
- Bereschenko, L.A.; Prummel, H.; Euverink, G.J.W.; Stams, A.J.M.; van Loosdrecht, M.C.M. Effect of conventional chemical treatment on the microbial population in a biofouling layer of reverse osmosis systems. Water Res. 2011, 45, 405–416. [Google Scholar] [CrossRef] [PubMed]
- Ayache, C.; Manes, C.; Pidou, M.; Croué, J.P.; Gernjak, W. Microbial community analysis of fouled reverse osmosis membranes used in water recycling. Water Res. 2013, 47, 3291–3299. [Google Scholar] [CrossRef] [PubMed]
- Kim, I.S.; Lee, J.; Kima, S.-J.; Yu, H.-W.; Jang, A. Comparative pyrosequencing analysis of bacterial community change in biofilm formed on seawater reverse osmosis membrane. Environ. Technol. 2014, 35, 125–136. [Google Scholar] [CrossRef] [PubMed]
- Zodrow, K.R.; Bar-Zeev, E.; Giannetto, M.J.; Elimelech, M. Biofouling and microbial communities in membrane distillation and reverse osmosis. Environ. Sci. Technol. 2014, 48, 13155–13164. [Google Scholar] [CrossRef] [PubMed]
- Ferrera, I.; Mas, J.; Taberna, E.; Sanz, J.; Sánchez, O. Biological support media influence the bacterial biofouling community in reverse osmosis water reclamation demonstration plants. Biofouling 2015, 31, 173–180. [Google Scholar] [CrossRef] [PubMed]
- Khan, M.T.; Hong, P.-Y.; Nada, N.; Croue, J.P. Does chlorination of seawater reverse osmosis membranes control biofouling? Water Res. 2015, 78, 84–97. [Google Scholar] [CrossRef]
- Tan, Y.-J.; Sun, L.-J.; Li, B.-T.; Zhao, X.-H.; Yu, T.; Ikuno, N.; Ishii, K.; Hu, H.-Y. Fouling characteristics and fouling control of reverse osmosis membranes for desalination of dyeing wastewater with high chemical oxygen demand. Desalination 2017, 419, 1–7. [Google Scholar] [CrossRef]
- Wingender, J.; Neu, T.R.; Flemming, H.-C. Microbial Extracellular Polymeric Substances; Springer: Berlin/Heidelberg, Germany, 1999; ISBN 978-3-642-64277-7. [Google Scholar]
- Uroz, S.; Dessaux, Y.; Oger, P. Quorum sensing and quorum quenching: The yin and yang of bacterial communication. ChemBioChem 2009, 10, 205–216. [Google Scholar] [CrossRef]
- Dreszer, C.; Vrouwenvelder, J.S.; Paulitsch-Fuchs, A.H.; Zwijnenburg, A.; Kruithof, J.C.; Flemming, H.-C. Hydraulic resistance of biofilms. J. Membr. Sci. 2013, 429, 436–447. [Google Scholar] [CrossRef]
- Herzberg, M.; Elimelech, M. Biofouling of reverse osmosis membranes: Role of biofilm-enhanced osmotic pressure. J. Membr. Sci. 2007, 295, 11–20. [Google Scholar] [CrossRef]
- Ridgway, H.F.; Safarik, J. Biofouling of reverse osmosis membranes. In Biofouling and Biocorrosion in Industrial Water Systems; Flemming, H.-C., Geesey, G.G., Eds.; Springer: Berlin/Heidelberg, Germany, 1991; pp. 81–111. ISBN 978-3-642-76545-2. [Google Scholar]
- Vrouwenvelder, J.S.; Kruithof, J.C.; van Loosdrecht, M.C.M. Integrated approach for biofouling control. Water Sci. Technol. 2010, 62, 2477–2490. [Google Scholar] [CrossRef] [PubMed]
- Saad, M.A. Biofouling prevention in RO polymeric membrane systems. Desalination 1992, 88, 85–105. [Google Scholar] [CrossRef]
- Hijnen, W.A.M.; Beerendonk, E.F.; Medema, G.J. Inactivation credit of UV radiation for viruses, bacteria and protozoan (oo)cysts in water: A review. Water Res. 2006, 40, 3–22. [Google Scholar] [CrossRef]
- Vilhunen, S.; Särkkä, H.; Sillanpää, M. Ultraviolet light-emitting diodes in water disinfection. Environ. Sci. Pollut. Res. Int. 2009, 16, 439–442. [Google Scholar] [CrossRef]
- Harm, W. Biological Effects of Ultraviolet Radiation, 1. publ; Cambridge Univ. Press: Cambridge, UK, 1980; ISBN 0521293626. [Google Scholar]
- Soloshenko, I.A.; Bazhenov, V.Y.; Khomich, V.A.; Tsiolko, V.V.; Potapchenko, N.G. Comparative Research of Efficiency of Water Decontamination by UV Radiation of Cold Hollow Cathode Discharge Plasma Versus That of Low- and Medium-Pressure Mercury Lamps. IEEE Trans. Plasma Sci. 2006, 34, 1365–1369. [Google Scholar] [CrossRef]
- Reed, R.H. The Inactivation of Microbes by Sunlight: Solar Disinfection as a Water Treatment Process. Adv. Appl. Microbiol. 2004, 54, 333–365. [Google Scholar] [CrossRef]
- Pullerits, K.; Ahlinder, J.; Holmer, L.; Salomonsson, E.; Öhrman, C.; Jacobsson, K.; Dryselius, R.; Forsman, M.; Paul, C.J.; Rådström, P. Impact of UV irradiation at full scale on bacterial communities in drinking water. NPJ Clean Water 2020, 3, 3. [Google Scholar] [CrossRef]
- Reichenberger, E.R.; Rosen, G.; Hershberg, U.; Hershberg, R. Prokaryotic nucleotide composition is shaped by both phylogeny and the environment. Genome Biol. Evol. 2015, 7, 1380–1389. [Google Scholar] [CrossRef]
- Warnecke, F.; Sommaruga, R.; Sekar, R.; Hofer, J.S.; Pernthaler, J. Abundances, identity, and growth state of actinobacteria in mountain lakes of different UV transparency. Appl. Environ. Microbiol. 2005, 71, 5551–5559. [Google Scholar] [CrossRef]
- McKinney, C.W.; Pruden, A. Ultraviolet disinfection of antibiotic resistant bacteria and their antibiotic resistance genes in water and wastewater. Environ. Sci. Technol. 2012, 46, 13393–13400. [Google Scholar] [CrossRef] [PubMed]
- Riesenman, P.J.; Nicholson, W.L. Role of the spore coat layers in Bacillus subtilis spore resistance to hydrogen peroxide, artificial UV-C, UV-B, and solar UV radiation. Appl. Environ. Microbiol. 2000, 66, 620–626. [Google Scholar] [CrossRef]
- Mason, J.M.; Setlow, P. Essential role of small, acid-soluble spore proteins in resistance of Bacillus subtilis spores to UV light. J. Bacteriol. 1986, 167, 174–178. [Google Scholar] [CrossRef] [PubMed]
- Berney, M.; Weilenmann, H.-U.; Egli, T. Flow-cytometric study of vital cellular functions in Escherichia coli during solar disinfection (SODIS). Microbiology 2006, 152, 1719–1729. [Google Scholar] [CrossRef] [PubMed]
- Matallana-Surget, S.; Wattiez, R. Impact of Solar Radiation on Gene Expression in Bacteria. Proteomes 2013, 1, 70–86. [Google Scholar] [CrossRef] [PubMed]
- Harif, T.; Elifantz, H.; Margalit, E.; Herzberg, M.; Lichi, T.; Minz, D. The effect of UV pre-treatment on biofouling of BWRO membranes: A field study. Desalin. Water Treat. 2011, 31, 151–163. [Google Scholar] [CrossRef]
- Martino, D.; Ahmed, H.; Veronique, H.; Cyril, M. Assessment of UV Pre-Treatment to Reduce Fouling of NF Membranes. In Expanding Issues in Desalination; Ning, R.Y., Ed.; InTechOpen: London, UK, 2011. [Google Scholar] [CrossRef]
- Marconnet, C.; Houari, A.; Seyer, D.; Djafer, M.; Coriton, G.; Heim, V.; Di Martino, P. Membrane biofouling control by UV irradiation. Desalination 2011, 276, 75–81. [Google Scholar] [CrossRef]
- Otaki, M.; Takizawa, S.; Ohgaki, S. Control and modeling of membrane fouling due to microorganism growth by UV pretreatment. Water Sci. Technol. 1998, 38, S0273–S1223. [Google Scholar] [CrossRef]
- Kolappan, A.; Satheesh, S. Efficacy of UV Treatment in the Management of Bacterial Adhesion on Hard Surfaces. Pol. J. Microbiol. 2011, 119–123. [Google Scholar] [CrossRef]
- Lakretz, A.; Mamane, H.; Asa, E.; Harif, T.; Herzberg, M. Biofouling control by UV/H2O2 pretreatment for brackish water reverse osmosis process. Environ. Sci. Water Res. Technol. 2018, 4, 1331–1344. [Google Scholar] [CrossRef]
- Matin, A.; Khan, Z.; Zaidi, S.M.J.; Boyce, M.C. Biofouling in reverse osmosis membranes for seawater desalination: Phenomena and prevention. Desalination 2011, 281, 1–16. [Google Scholar] [CrossRef]
- Song, K.; Mohseni, M.; Taghipour, F. Application of ultraviolet light-emitting diodes (UV-LEDs) for water disinfection: A review. Water Res. 2016, 94, 341–349. [Google Scholar] [CrossRef] [PubMed]
- Würtele, M.A.; Kolbe, T.; Lipsz, M.; Külberg, A.; Weyers, M.; Kneissl, M.; Jekel, M. Application of GaN-based ultraviolet-C light emitting diodes--UV LEDs--for water disinfection. Water Res. 2011, 45, 1481–1489. [Google Scholar] [CrossRef]
- Laser Components GmbH. 278 nm 100 mW 6060 1in1 Flat LED PKG. 2018. Available online: https://www.google.com/url?sa=t&rct=j&q=&esrc=s&source=web&cd=1&ved=2ahUKEwj7toXy_tPoAhXusaQKHbluDOsQFjAAegQIBhAB&url=https%3A%2F%2Fwww.lasercomponents.com%2Ffileadmin%2Fuser_upload%2Fhome%2FDatasheets%2Flg%2Fleuva66h70hf00_278nm_high_power.pdf&usg=AOvVaw0lro6w8EigE-S1HTUS-UCV (accessed on 6 April 2020).
- Sperle, P.; Wurzbacher, C.; Drewes, J.E.; Skibinski, B. Supplementary Materials: Reducing the Impacts of Biofouling in RO Membrane Systems through in-situ Low Fluence Irradiation Employing UVC-LEDs [Dataset], Mendeley Data, V1. 2020. Available online: https://data.mendeley (accessed on 9 December 2020). [CrossRef]
- Vrouwenvelder, J.S.; von der Graf Schulenburg, D.A.; Kruithof, J.C.; Johns, M.L.; van Loosdrecht, M.C.M. Biofouling of spiral-wound nanofiltration and reverse osmosis membranes: A feed spacer problem. Water Res. 2009, 43, 583–594. [Google Scholar] [CrossRef] [PubMed]
- Radu, A.I.; Vrouwenvelder, J.S.; van Loosdrecht, M.C.M.; Picioreanu, C. Modeling the effect of biofilm formation on reverse osmosis performance: Flux, feed channel pressure drop and solute passage. J. Membr. Sci. 2010, 365, 1–15. [Google Scholar] [CrossRef]
- DuPont. FilmTec™ Reverse Osmosis Membranes. TechnicalManual. Form No. 45-D01504-en, Rev. 2. 2020. Available online: https://www.dupont.com/content/dam/dupont/amer/us/en/water-solutions/public/documents/en/45-D01504-en.pdf (accessed on 3 April 2020).
- Li, K.; Li, S.; Huang, T.; Dong, C.; Li, J.; Zhao, B.; Zhang, S. Chemical Cleaning of Ultrafiltration Membrane Fouled by Humic Substances: Comparison between Hydrogen Peroxide and Sodium Hypochlorite. Int. J. Environ. Res. Public Health 2019, 16. [Google Scholar] [CrossRef]
- Ling, R.; Yu, L.; Pham, T.P.T.; Shao, J.; Chen, J.P.; Reinhard, M. The tolerance of a thin-film composite polyamide reverse osmosis membrane to hydrogen peroxide exposure. J. Membr. Sci. 2017, 524, 529–536. [Google Scholar] [CrossRef]
- Kucera, J. Biofouling of Polyamide Membranes: Fouling Mechanisms, Current Mitigation and Cleaning Strategies, and Future Prospects. Membranes 2019, 9, 111. [Google Scholar] [CrossRef]
- Dow. FILMTEC™ Reverse Osmosis Membranes. Technical Manual Form. No. 609-00071-0416, n.d. 2020. Available online: https://www.rainmandesal.com/wp-content/uploads/2018/09/dow-filmtec-sw30-manual.pdf (accessed on 9 December 2020).
- Matar, G.; Gonzalez-Gil, G.; Maab, H.; Nunes, S.; Le-Clech, P.; Vrouwenvelder, J.; Saikaly, P.E. Temporal changes in extracellular polymeric substances on hydrophobic and hydrophilic membrane surfaces in a submerged membrane bioreactor. Water Res. 2016, 95, 27–38. [Google Scholar] [CrossRef]
- Han, X.; Wang, Z.; Zhu, C.; Wu, Z. Effect of ultrasonic power density on extracting loosely bound and tightly bound extracellular polymeric substances. Desalination 2013, 329, 35–40. [Google Scholar] [CrossRef]
- Holm-Hansen, O.; Booth, C.R. The measurement of adenosine triphosphate in the ocean and its ecological significance1. Limnol. Oceanogr. 1966, 11, 510–519. [Google Scholar] [CrossRef]
- DIN EN 1484:2019-04, Wasseranalytik_- Anleitungen zur Bestimmung des Gesamten Organischen Kohlenstoffs_(TOC) und des Gelösten Organischen Kohlenstoffs_(DOC); Deutsche Fassung EN_1484:1997; Beuth Verlag GmbH: Berlin, Germany, 2019.
- Promega Corporation. BacTiter-Glo™ Microbial Cell Viability Assay; Promega Corporation: Madison, WI, USA, 2016. [Google Scholar]
- Boulos, L.; Prévost, M.; Barbeau, B.; Coallier, J.; Desjardins, R. LIVE/DEAD® BacLight™: Application of a new rapid staining method for direct enumeration of viable and total bacteria in drinking water. J. Microbiol. Methods 1999, 37, 77–86. [Google Scholar] [CrossRef]
- Masuko, T.; Minami, A.; Iwasaki, N.; Majima, T.; Nishimura, S.-I.; Lee, Y.C. Carbohydrate analysis by a phenol-sulfuric acid method in microplate format. Anal. Biochem. 2005, 339, 69–72. [Google Scholar] [CrossRef] [PubMed]
- DIN EN ISO 10304-1:2009-07, Wasserbeschaffenheit_- Bestimmung von Gelösten Anionen Mittels Flüssigkeits-Ionenchromatographie_- Teil_1: Bestimmung von Bromid, Chlorid, Fluorid, Nitrat, Nitrit, Phosphat und Sulfat (ISO_10304-1:2007); Deutsche Fassung EN_ISO_10304-1:2009; ; Beuth Verlag GmbH: Berlin, Germany, 2009.
- DIN EN ISO 7980:2000-07, Wasserbeschaffenheit_- Bestimmung von Calcium und Magnesium_- Verfahren mittels Atomabsorptionsspektrometrie (ISO_7980:1986); Deutsche Fassung EN_ISO_7980:2000; Beuth Verlag GmbH: Berlin, Germany, 2000.
- DIN 38406-6:1998-07, Deutsche Einheitsverfahren zur Wasser-, Abwasser- und Schlammuntersuchung_- Kationen (Gruppe_E)_- Teil_6: Bestimmung von Blei mittels Atomabsorptionsspektrometrie (AAS) (E_6); Beuth Verlag GmbH: Berlin, Germany, 1998.
- DIN 38405-9:2011-09, Deutsche Einheitsverfahren zur Wasser-, Abwasser- und Schlammuntersuchung_- Anionen (Gruppe_D)_- Teil_9: Photometrische Bestimmung von Nitrat_(D_9); Beuth Verlag GmbH: Berlin, Germany, 2011.
- DIN EN ISO 6878:2004-09, Wasserbeschaffenheit_- Bestimmung von Phosphor_- Photometrisches Verfahren Mittels Ammoniummolybdat (ISO_6878:2004); Deutsche Fassung EN_ISO_6878:2004; Beuth Verlag GmbH: Berlin, Germany, 2004.
- Rahn, R.O. Potassium Iodide as a Chemical Actinometer for 254 nm Radiation: Use of lodate as an Electron Scavenger. Photochem. Photobiol. 1997, 66, 450–455. [Google Scholar] [CrossRef]
- Rahn, R.O.; Stefan, M.I.; Bolton, J.R.; Goren, E.; Shaw, P.-S.; Lykke, K.R. Quantum Yield of the Iodide–Iodate Chemical Actinometer: Dependence on Wavelength and Concentration. Pure Appl. Chem. 2003, 78, 146. [Google Scholar] [CrossRef]
- Zou, X.-Y.; Lin, Y.-L.; Xu, B.; Cao, T.-C.; Tang, Y.-L.; Pan, Y.; Gao, Z.-C.; Gao, N.-Y. Enhanced inactivation of E. coli by pulsed UV-LED irradiation during water disinfection. Sci. Total Environ. 2019, 650, 210–215. [Google Scholar] [CrossRef]
- Wang, W.-L.; Wu, Q.-Y.; Li, Z.-M.; Lu, Y.; Du, Y.; Wang, T.; Huang, N.; Hu, H.-Y. Light-emitting diodes as an emerging UV source for UV/chlorine oxidation: Carbamazepine degradation and toxicity changes. Chem. Eng. J. 2017, 310, 148–156. [Google Scholar] [CrossRef]
- Ranga Suri, N.N.R.; Murty, M.N.; Athithan, G. Outlier Detection. In Outlier Detection: Techniques and Applications; Ranga Suri, N.N.R., Murty, M.N., Athithan, G., Eds.; Springer International Publishing: Cham, Switzerland, 2019; pp. 13–27. ISBN 978-3-030-05125-9. [Google Scholar]
- Murphy, K.R.; Stedmon, C.A.; Graeber, D.; Bro, R. Fluorescence spectroscopy and multi-way techniques. PARAFAC. Anal. Methods 2013, 5, 6557. [Google Scholar] [CrossRef]
- Murphy, K.R.; Stedmon, C.A.; Wenig, P.; Bro, R. OpenFluor—An online spectral library of auto-fluorescence by organic compounds in the environment. Anal. Methods 2014, 6, 658–661. [Google Scholar] [CrossRef]
- Bro, R.; Kiers, H.A.L. A new efficient method for determining the number of components in PARAFAC models. J. Chemom. 2003, 17, 274–286. [Google Scholar] [CrossRef]
- Stedmon, C.A.; Bro, R. Characterizing dissolved organic matter fluorescence with parallel factor analysis: A tutorial. Limnol. Oceanogr. Methods 2008, 6, 572–579. [Google Scholar] [CrossRef]
- Callahan, B.J.; McMurdie, P.J.; Rosen, M.J.; Han, A.W.; Johnson, A.J.A.; Holmes, S.P. DADA2: High-resolution sample inference from Illumina amplicon data. Nat. Methods 2016, 13, 581–583. [Google Scholar] [CrossRef] [PubMed]
- Wright, E.S. Using DECIPHER v2.0 to Analyze Big Biological Sequence Data in R. R J. 2016, 352–359. [Google Scholar] [CrossRef]
- Zhang, Z.; Schwartz, S.; Wagner, L.; Miller, W. A greedy algorithm for aligning DNA sequences. J. Comput. Biol. 2000, 7, 203–214. [Google Scholar] [CrossRef]
- Altschul, S.F.; Gish, W.; Miller, W.; Myers, E.W.; Lipman, D.J. Basic local alignment search tool. J. Mol. Biol. 1990, 215, 403–410. [Google Scholar] [CrossRef]
- Karsch-Mizrachi, I.; Takagi, T.; Cochrane, G. The international nucleotide sequence database collaboration. Nucleic Acids Res. 2018, 46, D48–D51. [Google Scholar] [CrossRef]
- Heck, K.L.; van Belle, G.; Simberloff, D. Explicit Calculation of the Rarefaction Diversity Measurement and the Determination of Sufficient Sample Size. Ecology 1975, 56, 1459–1461. [Google Scholar] [CrossRef]
- Hurlbert, S.H. The Nonconcept of Species Diversity: A Critique and Alternative Parameters. Ecology 1971, 52, 577–586. [Google Scholar] [CrossRef]
- Legendre, P.; Anderson, M.J. Distance-Based Redundancy Analysis: Testing Multispecies Responses in Multifactorial Ecological Experiments. Ecol. Monogr. 1999, 69, 1–24. [Google Scholar] [CrossRef]
- McArdle, B.H.; Anderson, M.J. Fitting Multivariate Models to Community Data: A Comment on Distance-Based Redundancy Analysis. Ecology 2001, 82, 290–297. [Google Scholar] [CrossRef]
- Oksanen, J.; Blanchet, F.G.; Friendly, M.; Kindt, R.; Legendre, P.; McGlinn, D.; Minchin, P.R.; O’Hara, R.B.; Simpson, G.L.; Solymos, P.; et al. Vegan: Community Ecology Package. R Package Version 2.5-6. 2019. Available online: https://CRAN.R-project.org/package=vegan (accessed on 25 September 2020).
- Anderson, M.J. A new method for non-parametric multivariate analysis of variance. Austral. Ecol. 2001, 26, 32–46. [Google Scholar] [CrossRef]
- Love, M.I.; Huber, W.; Anders, S. Moderated estimation of fold change and dispersion for RNA-seq data with DESeq2. Genome Biol. 2014, 15, 550. [Google Scholar] [CrossRef] [PubMed]
- Stephens, M. False discovery rates: A new deal. Biostatistics 2017, 18, 275–294. [Google Scholar] [CrossRef] [PubMed]
- Benjamini, Y.; Hochberg, Y. Controlling the False Discovery Rate: A Practical and Powerful Approach to Multiple Testing. J. R. Stat. Soc. Series B 1995, 57, 289–300. [Google Scholar] [CrossRef]
- Lagkouvardos, I.; Fischer, S.; Kumar, N.; Clavel, T. Rhea: A transparent and modular R pipeline for microbial profiling based on 16S rRNA gene amplicons. PeerJ 2017, 5, e2836. [Google Scholar] [CrossRef] [PubMed]
- Jarvis, A.; Goslan, H. Application of Ultraviolet Light-Emitting Diodes (UV-LED) to Full-Scale Drinking-Water Disinfection. Water 2019, 11, 1894. [Google Scholar] [CrossRef]
- Farhat, N.M.; Vrouwenvelder, J.S.; van Loosdrecht, M.C.M.; Bucs, S.S.; Staal, M. Effect of water temperature on biofouling development in reverse osmosis membrane systems. Water Res. 2016, 103, 149–159. [Google Scholar] [CrossRef]
- Subramani, A.; Hoek, E.M.V. Biofilm formation, cleaning, re-formation on polyamide composite membranes. Desalination 2010, 257, 73–79. [Google Scholar] [CrossRef]
- Li, G.-Q.; Wang, W.-L.; Huo, Z.-Y.; Lu, Y.; Hu, H.-Y. Comparison of UV-LED and low pressure UV for water disinfection: Photoreactivation and dark repair of Escherichia coli. Water Res. 2017, 126, 134–143. [Google Scholar] [CrossRef]
- Hurwitz, G.; Guillen, G.R.; Hoek, E.M.V. Probing polyamide membrane surface charge, zeta potential, wettability, and hydrophilicity with contact angle measurements. J. Membr. Sci. 2010, 349, 349–357. [Google Scholar] [CrossRef]
- Otto, K.; Silhavy, T.J. Surface sensing and adhesion of Escherichia coli controlled by the Cpx-signaling pathway. Proc. Natl. Acad. Sci. USA. 2002, 99, 2287–2292. [Google Scholar] [CrossRef] [PubMed]
- Landini, P. Cross-talk mechanisms in biofilm formation and responses to environmental and physiological stress in Escherichia coli. Res. Microbiol. 2009, 160, 259–266. [Google Scholar] [CrossRef] [PubMed]
- Dorel, C.; Lejeune, P.; Rodrigue, A. The Cpx system of Escherichia coli, a strategic signaling pathway for confronting adverse conditions and for settling biofilm communities? Res. Microbiol. 2006, 157, 306–314. [Google Scholar] [CrossRef] [PubMed]
- Friedman, L.; Harif, T.; Herzberg, M.; Mamane, H. Mitigation of Biofilm Colonization on Various Surfaces in a Model Water Flow System by Use of UV Treatment. Water Air Soil Pollut. 2016, 227, 597. [Google Scholar] [CrossRef]
- Friedberg, E.C. DNA damage and repair. Nature 2003, 421, 436–440. [Google Scholar] [CrossRef] [PubMed]
- Desmond, P.; Best, J.P.; Morgenroth, E.; Derlon, N. Linking composition of extracellular polymeric substances (EPS) to the physical structure and hydraulic resistance of membrane biofilms. Water Res. 2018, 132, 211–221. [Google Scholar] [CrossRef] [PubMed]
- Elhadidy, A.M.; van Dyke, M.I.; Chen, F.; Peldszus, S.; Huck, P.M. Development and application of an improved protocol to characterize biofilms in biologically active drinking water filters. Environ. Sci. Water Res. Technol. 2017, 3, 249–261. [Google Scholar] [CrossRef]
- Velten, S.; Hammes, F.; Boller, M.; Egli, T. Rapid and direct estimation of active biomass on granular activated carbon through adenosine tri-phosphate (ATP) determination. Water Res. 2007, 41, 1973–1983. [Google Scholar] [CrossRef]
- Yamashita, Y.; Panton, A.; Mahaffey, C.; Jaffé, R. Assessing the spatial and temporal variability of dissolved organic matter in Liverpool Bay using excitation–emission matrix fluorescence and parallel factor analysis. Ocean Dyn. 2011, 61, 569–579. [Google Scholar] [CrossRef]
- Coble, P.G. Characterization of marine and terrestrial DOM in seawater using excitation-emission matrix spectroscopy. Mar. Chem. 1996, 51, 325–346. [Google Scholar] [CrossRef]
- Yamashita, Y.; Boyer, J.N.; Jaffé, R. Evaluating the distribution of terrestrial dissolved organic matter in a complex coastal ecosystem using fluorescence spectroscopy. Cont. Shelf Res. 2013, 66, 136–144. [Google Scholar] [CrossRef]
- Yamashita, Y.; Tanoue, E. Chemical characteristics of amino acid-containing dissolved organic matter in seawater. Org. Geochem. 2004, 35, 679–692. [Google Scholar] [CrossRef]
- Painter, S.C.; Lapworth, D.J.; Woodward, E.M.S.; Kroeger, S.; Evans, C.D.; Mayor, D.J.; Sanders, R.J. Terrestrial dissolved organic matter distribution in the North Sea. Sci. Total Environ. 2018, 630, 630–647. [Google Scholar] [CrossRef] [PubMed]
- Baghoth, S.A.; Sharma, S.K.; Amy, G.L. Tracking natural organic matter (NOM) in a drinking water treatment plant using fluorescence excitation-emission matrices and PARAFAC. Water Res. 2011, 45, 797–809. [Google Scholar] [CrossRef]
- Parks, D.H.; Chuvochina, M.; Waite, D.W.; Rinke, C.; Skarshewski, A.; Chaumeil, P.-A.; Hugenholtz, P. A standardized bacterial taxonomy based on genome phylogeny substantially revises the tree of life. Nat. Biotechnol. 2018, 36, 996–1004. [Google Scholar] [CrossRef]
- The SILVA Ribosomal RNA Database Project. The SILVA Taxonomy. Available online: https://www.arb-silva.de/documentation/silva-taxonomy/ (accessed on 13 October 2020).
- Kalmbach, S. In situ probing reveals Aquabacterium commune as a widespread and highly abundant bacterial species in drinking water biofilms. Water Res. 2000, 34, 575–581. [Google Scholar] [CrossRef]
- Gao, D.-W.; Wen, Z.-D.; Li, B.; Liang, H. Membrane fouling related to microbial community and extracellular polymeric substances at different temperatures. Bioresour. Technol. 2013, 143, 172–177. [Google Scholar] [CrossRef]
- Yang, C.; Sun, W.; Ao, X. Bacterial inactivation, DNA damage, and faster ATP degradation induced by ultraviolet disinfection. Front. Environ. Sci. Eng. 2020, 14, 135. [Google Scholar] [CrossRef]
- Ivanova, E.P.; Alexeeva, Y.V.; Pham, D.K.; Wright, J.P.; Nicolau, D.V. ATP level variations in heterotrophic bacteria during attachment on hydrophilic and hydrophobic surfaces. Int. Microbiol. Off. J. Span. Soc. Microbiol. 2006, 9, 37–46. [Google Scholar]
- Jiang, B.; Liu, Y. Dependence of structure stability and integrity of aerobic granules on ATP and cell communication. Appl. Microbiol. Biotechnol. 2013, 97, 5105–5112. [Google Scholar] [CrossRef]
- Zhang, Z.; Cao, R.; Jin, L.; Zhu, W.; Ji, Y.; Xu, X.; Zhu, L. The regulation of N-acyl-homoserine lactones (AHLs)-based quorum sensing on EPS secretion via ATP synthetic for the stability of aerobic granular sludge. Sci. Total Environ. 2019, 673, 83–91. [Google Scholar] [CrossRef] [PubMed]
- Ma, H.; Wang, X.; Zhang, Y.; Hu, H.; Ren, H.; Geng, J.; Ding, L. The diversity, distribution and function of N-acyl-homoserine lactone (AHL) in industrial anaerobic granular sludge. Bioresour. Technol. 2018, 247, 116–124. [Google Scholar] [CrossRef] [PubMed]
- Jafra, S.; Przysowa, J.; Czajkowski, R.; Michta, A.; Garbeva, P.; van der Wolf, J.M. Detection and characterization of bacteria from the potato rhizosphere degrading N-acyl-homoserine lactone. Can. J. Microbiol. 2006, 52, 1006–1015. [Google Scholar] [CrossRef]
- Lin, Y.-H.; Xu, J.-L.; Hu, J.; Wang, L.-H.; Ong, S.L.; Leadbetter, J.R.; Zhang, L.-H. Acyl-homoserine lactone acylase from Ralstonia strain XJ12B represents a novel and potent class of quorum-quenching enzymes. Mol. Microbiol. 2003, 47, 849–860. [Google Scholar] [CrossRef] [PubMed]
- D’Angelo-Picard, C.; Faure, D.; Penot, I.; Dessaux, Y. Diversity of N-acyl homoserine lactone-producing and -degrading bacteria in soil and tobacco rhizosphere. Environ. Microbiol. 2005, 7, 1796–1808. [Google Scholar] [CrossRef]
- Webb, J.S.; Thompson, L.S.; James, S.; Charlton, T.; Tolker-Nielsen, T.; Koch, B.; Givskov, M.; Kjelleberg, S. Cell death in Pseudomonas aeruginosa biofilm development. J. Bacteriol. 2003, 185, 4585–4592. [Google Scholar] [CrossRef]


| Parameter | Biofilm Property |
|---|---|
| TOC/TOCEPS | Total organic mass/Total EPS |
| ATP | Active biomass [78] [15] (p. 26) |
| Total direct cell counts (TDC) | Dead and living cells |
| Proteins and polysaccharides | EPS composition |
| Excitation emission matrix (EEM) using fluorescence spectroscopy | Differentiation tyrosine- and tryptophan-like proteins |
| 16S rRNA amplicon sequencing | Microbial community composition |
| Experiment No. | Line with UV Treatment | UV Dummy 1 | LED Current [mA] | Membrane Performance Data | Biofilm Analysis |
|---|---|---|---|---|---|
| 1 | 1 | Yes | 360 | Yes | 16S |
| 2 | 1 | Yes | 360 | Yes | All |
| 3 | 2 | Yes | 360 | No | All |
| 4 | 1 | No | 360 | Yes | All |
| 5 | 2 | No | 360 | Yes | All |
| 6 | 2 | No | 360 | Yes | All |
| 7 | 1 | No | 360 | Yes, intermittent permeate production | All |
| 8 | 1 | No | 180 | Yes | No |
| FCPD Delay | FCPD Delay | Difference Hydraulic Resistance | Difference Hydraulic Resistance | |
|---|---|---|---|---|
| Mean | 2.0 d | 16.5% | 3.4 1013 m−1 | 48.8% |
| 95% confidence-t interval | 1.0 d | 10.0% | 2.7 1013 m-1 | 34.9% |
| p-value one sided Wilcoxon signed-rank test | 0.016 *1 | 0.016 *1 | 0.031 *2 | 0.031 *2 |
| Wilcoxon test statistic W | 21 *1 | 21 *1 | 1 *2 | 1 *2 |
| ASV | Family | Genus | Base Mean | Log 2 Fold Change | p Adjusted | Abundance |
|---|---|---|---|---|---|---|
| 45 | Sphingomonadaceae | Novosphingobium | 139 | 25.8 | 8 × 10⁻¹⁷ | ↑ |
| 46 | Comamonadaceae | Delftia | 101 | −24.8 | 7 × 10⁻¹⁶ | ↓ |
| 2 | Comamonadaceae | Acidovorax * | 21,435 | 4.0 | 0.01 | ↑ |
| 60 | Sphingomonadaceae | Sphingomonas | 80 | 4.5 | 0.03 | ↑ |
| 4 | Burkholderiaceae | Ralstonia | 5957 | 3.5 | 0.03 | ↑ |
Publisher’s Note: MDPI stays neutral with regard to jurisdictional claims in published maps and institutional affiliations. |
© 2020 by the authors. Licensee MDPI, Basel, Switzerland. This article is an open access article distributed under the terms and conditions of the Creative Commons Attribution (CC BY) license (http://creativecommons.org/licenses/by/4.0/).
Share and Cite
Sperle, P.; Wurzbacher, C.; Drewes, J.E.; Skibinski, B. Reducing the Impacts of Biofouling in RO Membrane Systems through In Situ Low Fluence Irradiation Employing UVC-LEDs. Membranes 2020, 10, 415. https://doi.org/10.3390/membranes10120415
Sperle P, Wurzbacher C, Drewes JE, Skibinski B. Reducing the Impacts of Biofouling in RO Membrane Systems through In Situ Low Fluence Irradiation Employing UVC-LEDs. Membranes. 2020; 10(12):415. https://doi.org/10.3390/membranes10120415
Chicago/Turabian StyleSperle, Philipp, Christian Wurzbacher, Jörg E. Drewes, and Bertram Skibinski. 2020. "Reducing the Impacts of Biofouling in RO Membrane Systems through In Situ Low Fluence Irradiation Employing UVC-LEDs" Membranes 10, no. 12: 415. https://doi.org/10.3390/membranes10120415
APA StyleSperle, P., Wurzbacher, C., Drewes, J. E., & Skibinski, B. (2020). Reducing the Impacts of Biofouling in RO Membrane Systems through In Situ Low Fluence Irradiation Employing UVC-LEDs. Membranes, 10(12), 415. https://doi.org/10.3390/membranes10120415