Article

Flux-Reducing Tendency of Pd-Based Membranes Employed in Butane Dehydrogenation Processes

SINTEF Industry, P.O. Box 124 Blindern, N-0314 Oslo, Norway
*
Author to whom correspondence should be addressed.
Membranes 2020, 10(10), 291; https://doi.org/10.3390/membranes10100291
Submission received: 29 September 2020 / Revised: 12 October 2020 / Accepted: 14 October 2020 / Published: 16 October 2020

Abstract

:
We report on the effect of butane and butylene on hydrogen permeation through thin state-of-the-art Pd–Ag alloy membranes. A wide range of operating conditions, such as temperature (200–450 °C) and H2/butylene (or butane) ratio (0.5–3), on the flux-reducing tendency were investigated. In addition, the behavior of membrane performance during prolonged exposure to butylene was evaluated. In the presence of butane, the flux-reducing tendency was found to be limited up to the maximum temperature investigated, 450 °C. Compared to butane, the flux-reducing tendency in the presence of butylene was severe. At 400 °C and 20% butylene, the flux decreases by ~85% after 3 h of exposure but depends on temperature and the H2/butylene ratio. In terms of operating temperature, an optimal performance was found at 250–300 °C with respect to obtaining the highest absolute hydrogen flux in the presence of butylene. At lower temperatures, the competitive adsorption of butylene over hydrogen accounts for a large initial flux penalty.

Graphical Abstract

1. Introduction

Alkene production by the catalytic dehydrogenation (DH) of light alkanes is an alternative to conventional heavy hydrocarbon cracking [1,2]. Dehydrogenation is an endothermic equilibrium-limited reaction and is typically performed at elevated temperatures at close to atmospheric pressure. Even at 500 °C, the thermodynamic equilibrium conversion for propane dehydrogenation is less than 20%. Further, the high operating temperature results in large amounts of carbon deposition on the catalyst, which implies the need for a periodic regeneration of the catalytic bed, leading to a complex plant design with multiple reactors, up to 5–8, in parallel, operating at temperatures between 500 and 600 °C [2], which is only feasible at large scale [3,4]. Due to the removal of hydrogen from the reaction, membrane reactors have the potential to provide the same conversion and yield of a conventional process while operating at milder conditions [5,6,7,8,9,10,11,12,13,14,15,16,17,18,19,20,21,22,23,24]. This would potentially reduce the level of catalyst deactivation observed in the conventional dehydrogenation of light alkanes. Additionally, downstream separations are simplified, as most of the hydrogen is separated in situ. It should be noted though that appropriate geometrical designs and operating conditions of a packed-bed membrane reactor are key to use the effect of hydrogen permeable membranes on actually obtaining the intended shift of the equilibrium towards more alkylenes [25].
Among all H2-selective membrane types, Pd-based membranes show an optimum match with the operating conditions typically targeted in a membrane-enhanced dehydrogenation process that is potentially operated between 300 and 500 °C [26,27]. One of the most investigated challenges for Pd-based membranes is that they are, to various degrees, prone to poisoning by for example CO and other surface co-adsorbates, leading to a reduced H2 flux through coking [28,29,30,31,32,33,34,35,36,37]. Also in the case of dehydrogenation of light alkenes, it was observed that the obtained H2 flux decreases over time [6,13,15,38,39]. The most common explanation for the flux decrease is coke formation accumulating on the membrane surface, thereby suppressing the H2 permeation. In a recent study, the evolution of various surface and bulk carbon species derived from propylene and their influence on the hydrogen flux was investigated. Results indicate that there are at least four different carbon species that are deposited onto the Pd foil during C3H6 exposure [40]. Primarily, the surface-adsorbed CxHy species are responsible for the H2 flux inhibition, but it is shown that their structure evolves to become subsurface or even bulk carbon species with increasing exposure time, concentration, and temperature. At temperatures below 300–400 °C, bulk C species are not formed due to the large activation barrier for C diffusion in the bulk of Pd. The results presented in [40] agree well with our previous work investigating the effect of propylene on hydrogen permeation through thin state-of-the-art Pd–Ag and Pd–Cu alloy membranes [39]. In that work, with the specific aim to investigate operating conditions that result in a negligible flux reduction, a wide range of operating conditions, such as temperature and H2/propylene ratio, were investigated. It was shown that coking could be limited at lower operating temperature, and a decrease to at least 300 °C or, preferably, to 250 °C is required to achieve sufficiently stable membrane operation in the conditions observed in a non-integrated sequential reactor-membrane process design [41]. In the sequential reactor-membrane process, a stable membrane performance was obtained at 200 °C at hydrogen recover factor (HRF) values varying from 38 to 50% [39].
In the present work, we report a thorough investigation of the effect of butane and butylene on hydrogen permeation through thin Pd–Ag alloy membranes. The effects of a wide range of operating conditions, such as temperature and H2/butylene/butane ratio, on the flux-reducing tendency were investigated. In addition, the behavior of membrane performance during prolonged exposure to butylene was evaluated. Finally, the long-term stability of the membrane itself was investigated and characterized through a post-process characterization of applied membranes. As in previous works, experiments were conducted using thin state-of-the-art self-standing Pd–Ag foils integrated in a microchannel-configured module. This configuration is very well suited for the investigation of surface inhibition effects caused by co-existing species in the gaseous feed under different operating conditions in the absence of any flux-limiting factors such as concentration polarization [42,43].

2. Materials and Methods

2.1. Pd Alloy Module Preparation

Pd alloy films were prepared by magnetron sputtering from a Pd77Ag23 target onto a silicon substrate, and subsequently integrated in a microchannel configuration to allow for hydrogen permeation measurements. Membrane films with a nominal thickness of 10 micron were applied in the current work. The microchannel system applied in this work consisted of a stainless steel feed channel section with thirteen parallel channels machined with dimensions 0.2 × 0.2 × 13 mm3, and is similar to the module applied in our previous work on propylene [39,44]. On the permeate side of the membrane, a perforated steel support plate was mounted. In total, the thirteen channels provided for a 0.449 cm2 active membrane area. The Pd77Ag23 film-loaded membrane module was then connected to the gas system to allow for flux measurements. Two membrane modules were applied during the investigation.

2.2. Gas Permeation Measurements

2.2.1. H2 Permeation Experiments

The H2 permeation system reported previously in [39,45,46] was used for the permeation and exposure experiments. When heating up the module, the membrane was flushed with N2 (99.999%) and Ar (99.999%) on the feed and permeate side, respectively, until 300 °C was reached. Then H2 (99.995%) was introduced at the feed side. H2 flux measurements were performed in the temperature range 450–300 °C. The total feed flow rate applied for all measurements equals 500 NmL·min−1. Based on previous experience, this feed flow rate is sufficient to suppress the effect of H2 depletion along the microchannel system. A sweep flow of 250 or 500 NmL·min−1 of Ar (99.999%) was applied at the permeate side. The H2 flux was calculated from the measured hydrogen concentration in the permeate using the calibrated flow of Ar sweep gas. For this, the permeate composition was measured by means of a micro GC (µGC, Agilent 490, Santa Clara, CA, USA). The hydrogen permeance was calculated by dividing the hydrogen flux by the hydrogen partial pressure difference ( P H 2 r e t 0.5 P H 2 p e r m 0.5 ) over the membrane. The nominal membrane thickness of 10 micron was used in the calculation of the H2 permeability.

2.2.2. H2 Permeation Experiments

The effect of butane and butylene on the H2 flux was investigated applying feed mixtures originally consisting of H2 in N2. Butane or butylene were then introduced by simply exchanging a part of N2. In this way, the feed H2 concentration was kept constant. In between different exposure studies, the membrane was regenerated applying a heat treatment in air (HTA). The HTA of the membrane surface recovers the H2 flux to its original value [38,40]. The HTA treatment was carried out by opening the module connections after flushing with nitrogen and argon, allowing air to enter the module at 400 °C for 1 h. Afterwards, the connections were re-connected followed by sufficient flushing with nitrogen and argon prior to H2 introduction.

2.2.3. Post-Process Characterization

The plan-view and cross-section microstructure of the employed membrane film were characterized after the permeation experiments by scanning electron microscopy (SEM) using secondary electrons (SE) or backscattered electrons (BSE), with an FEI 650 NOVA NanoSEM instrument (FEI Company, Hillsboro, OR, USA) combined with energy dispersive spectroscopy (EDS) (X-MAX50, Oxford Instruments, Abingdon, Oxfordshire, UK).

3. Results and Discussion

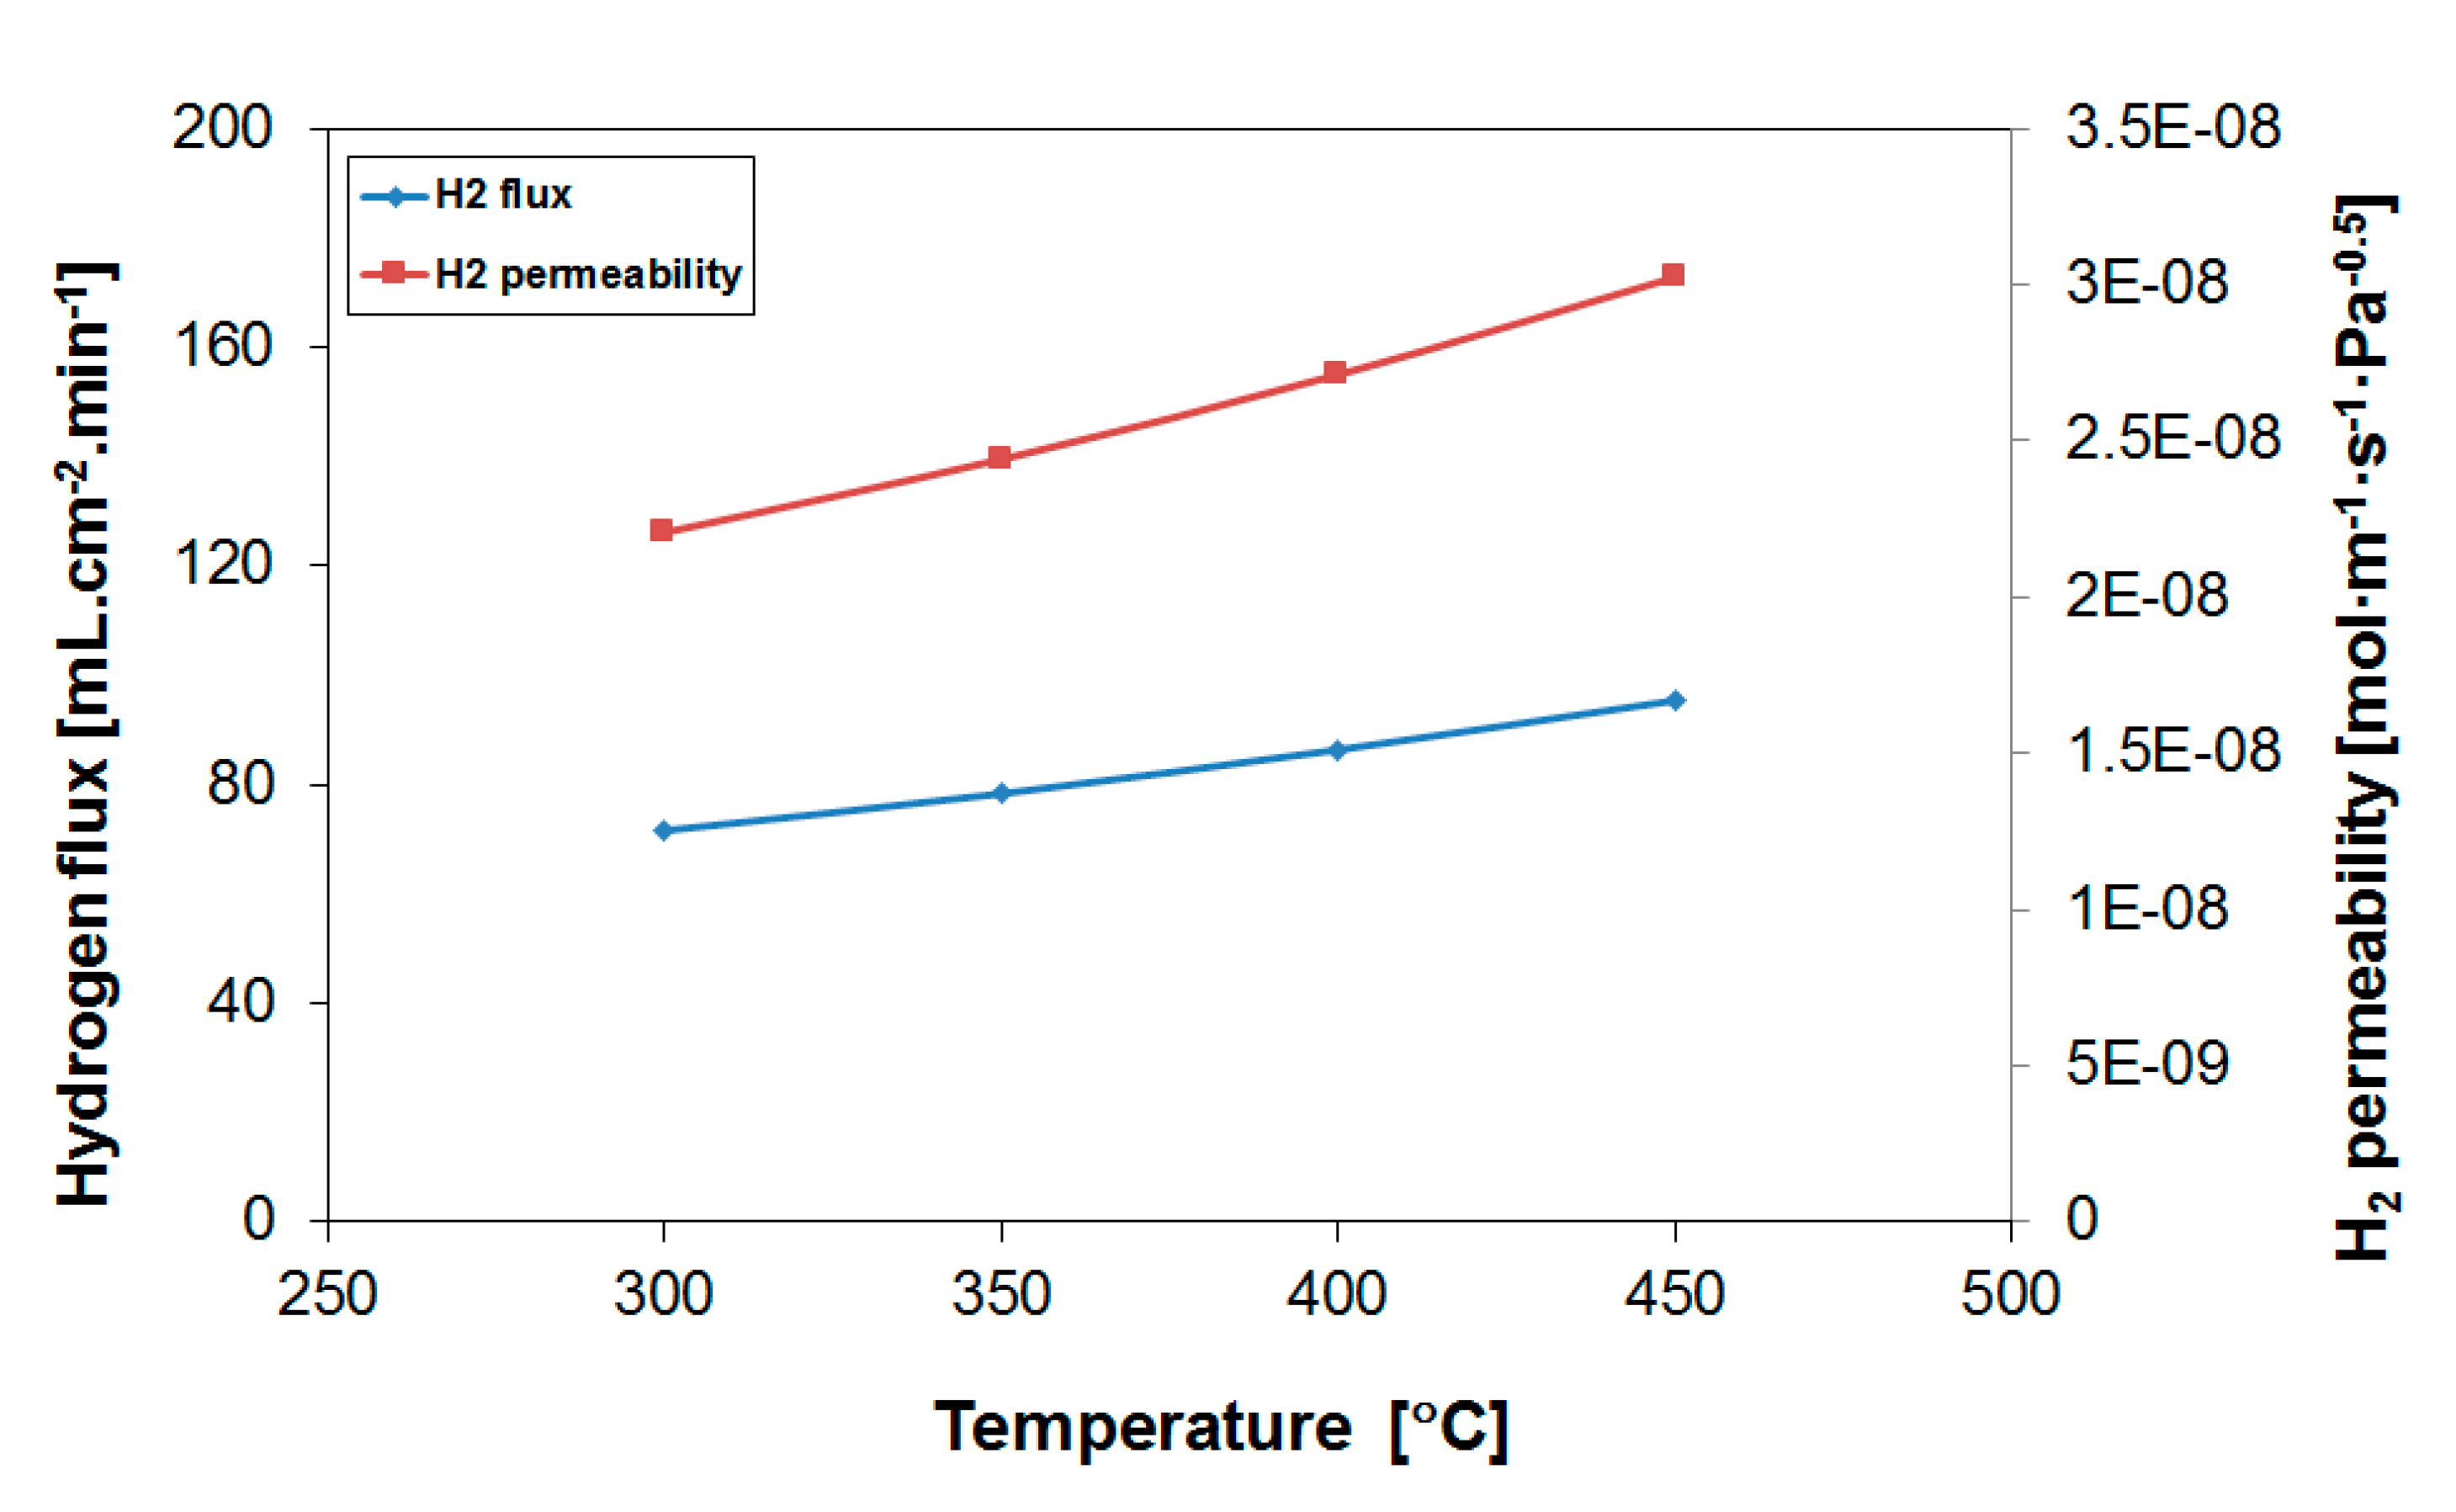
3.1. H2 Permeation Properties of Employed Pd-Based Membranes

H2 permeation measurements through the 10 micron-thick Pd77Ag23 membranes were performed between 300 and 450 °C applying a feed mixture of H2:N2 = 80:20 at atmospheric pressure. The results for the H2 flux and calculated permeability can be seen in Figure 1 for the first module employed in the experiments.
A hydrogen flux of 95.4 mL·cm−2·min−1 was obtained at a temperature of 450 °C. Given the experimental conditions, this corresponds to a hydrogen permeability of 3.0 × 10⁻⁸ mol·m−1·s−1·Pa−0.5. The flux and permeability values obtained are shown in Table 1 as a function of the operation temperature. In the calculation of the permeability, the n-value was forced to 0.5. The activation energy of the permeation equals 7.2 kJ·mol−1, close to reported values for Pd77Ag23 membranes [47]. Previous reported values for Pd77Ag23 membranes prepared by the same method are in the range of 8 × 10⁻⁹–3.2 × 10⁻⁸ mol·m−1·s−1·Pa−0.5 (400 °C) for membranes with a thickness between 1.4 and 10 µm [45,46,47,48], agreeing well with current results.

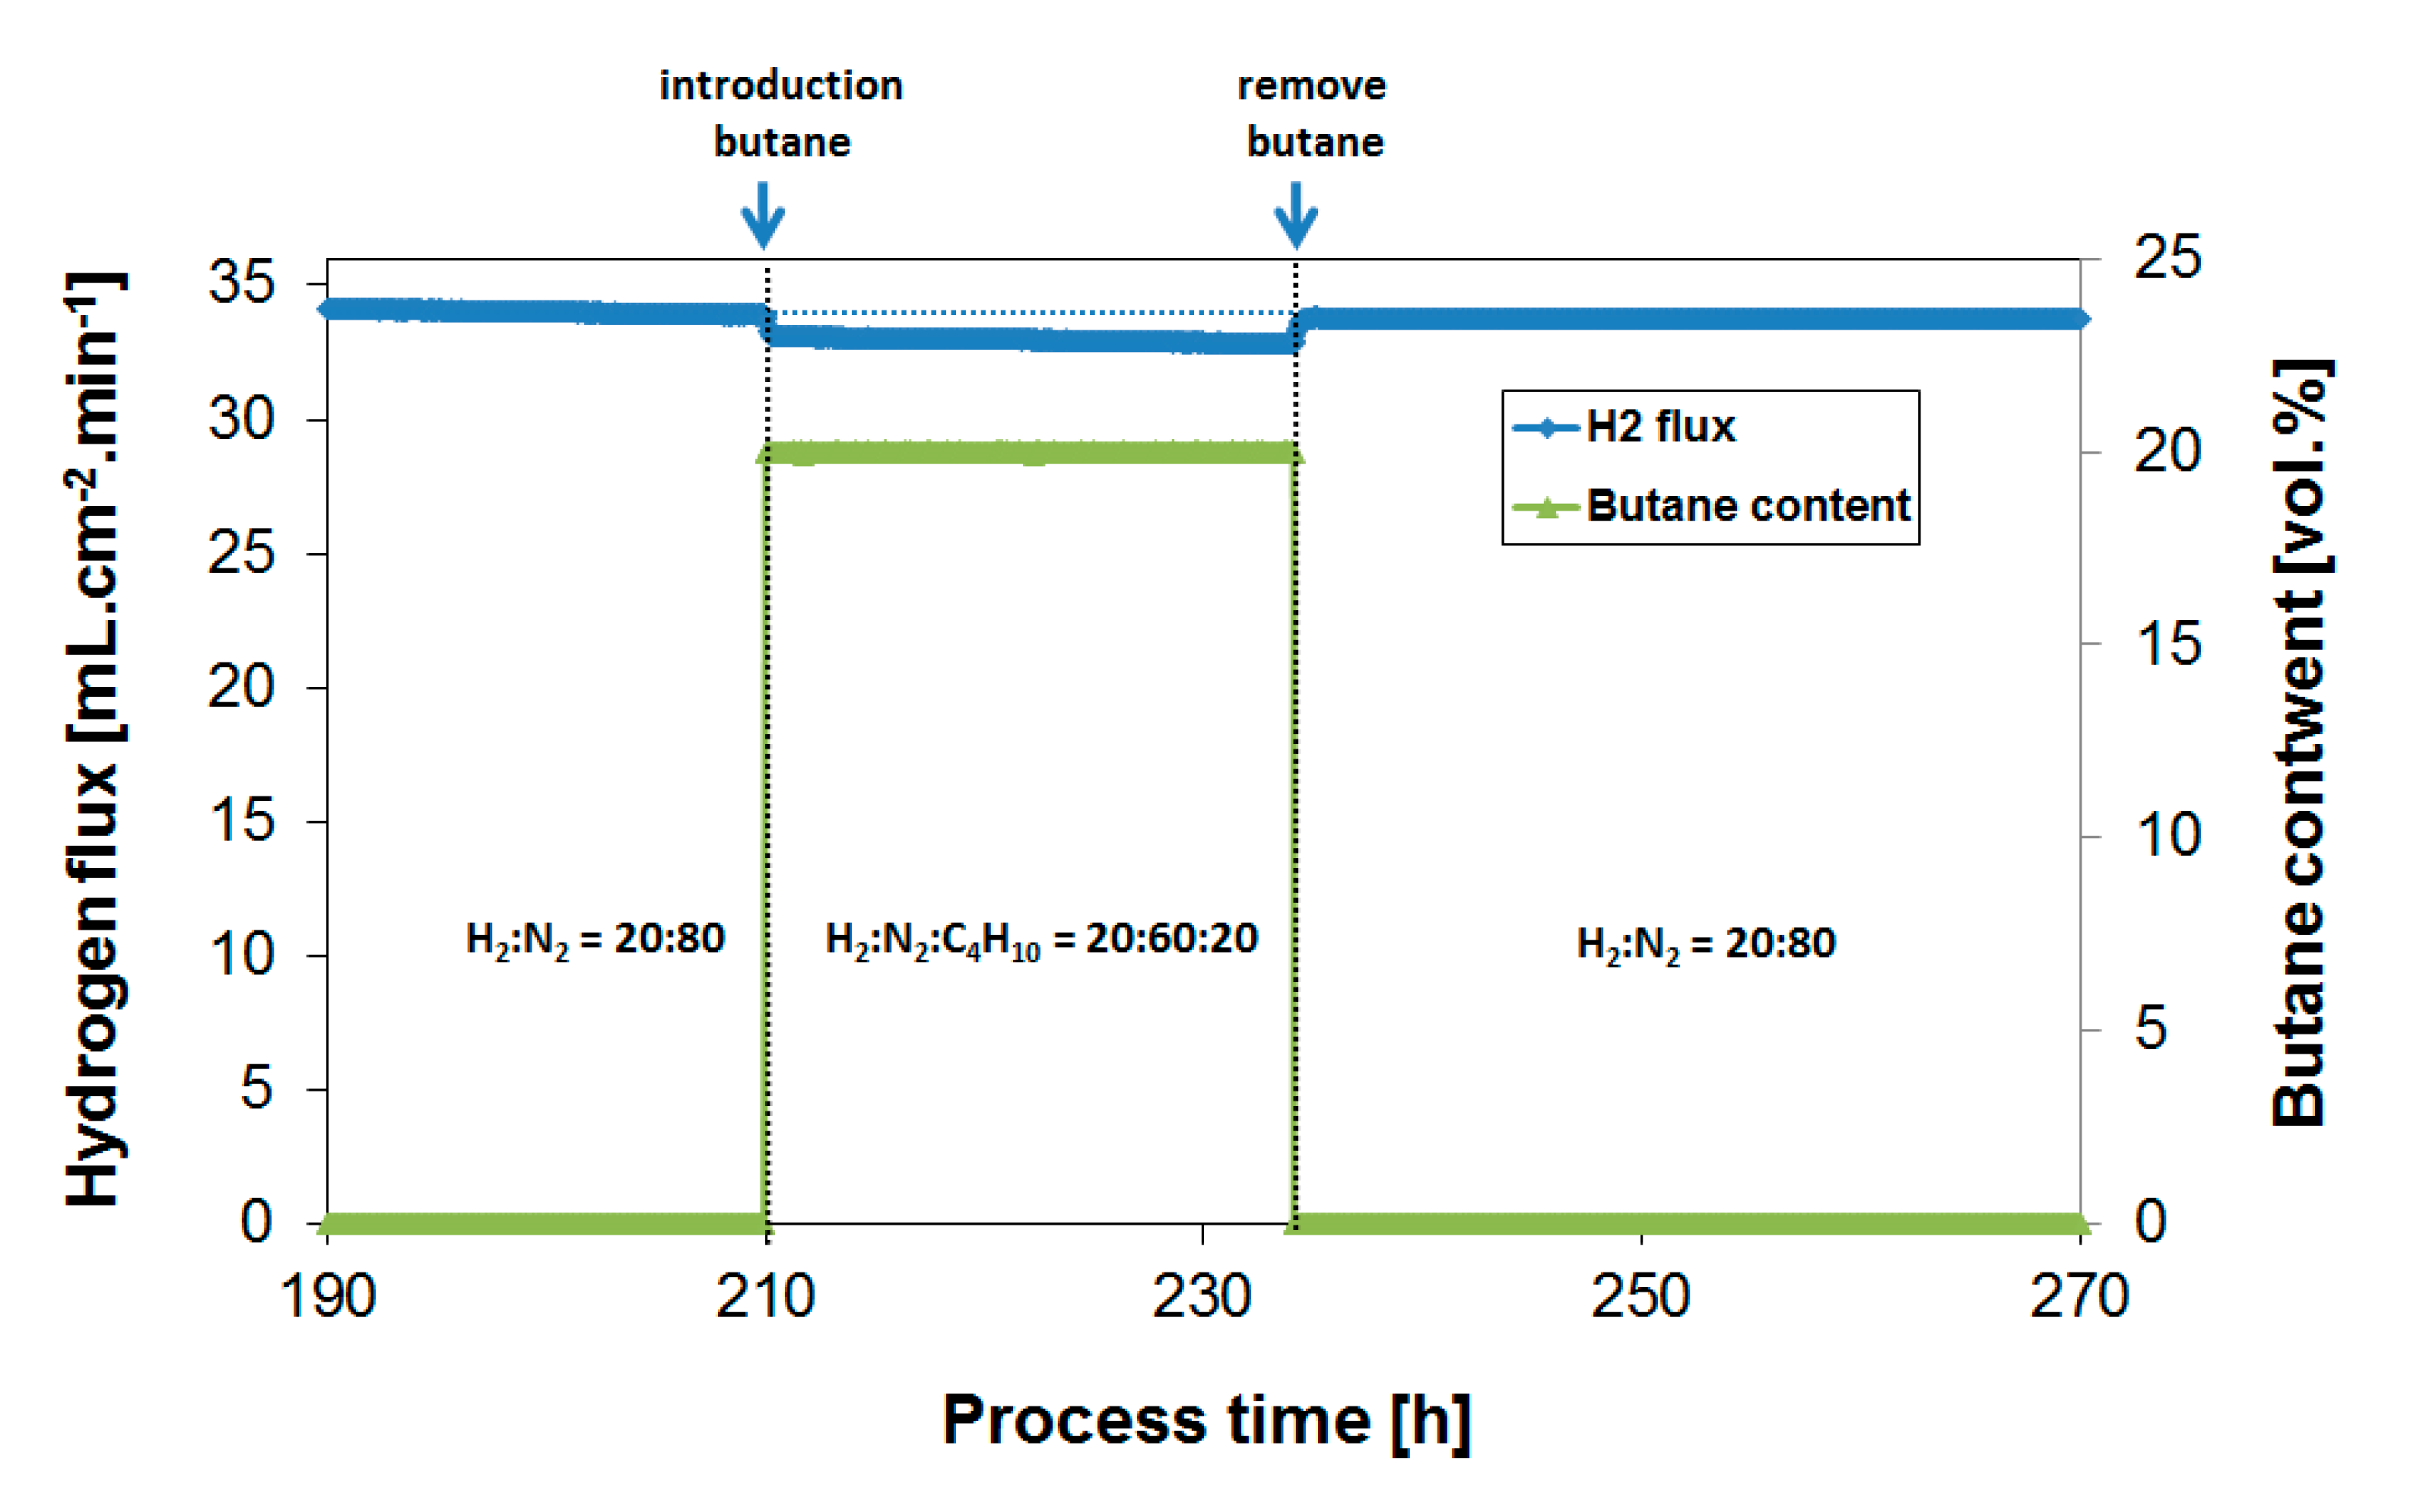
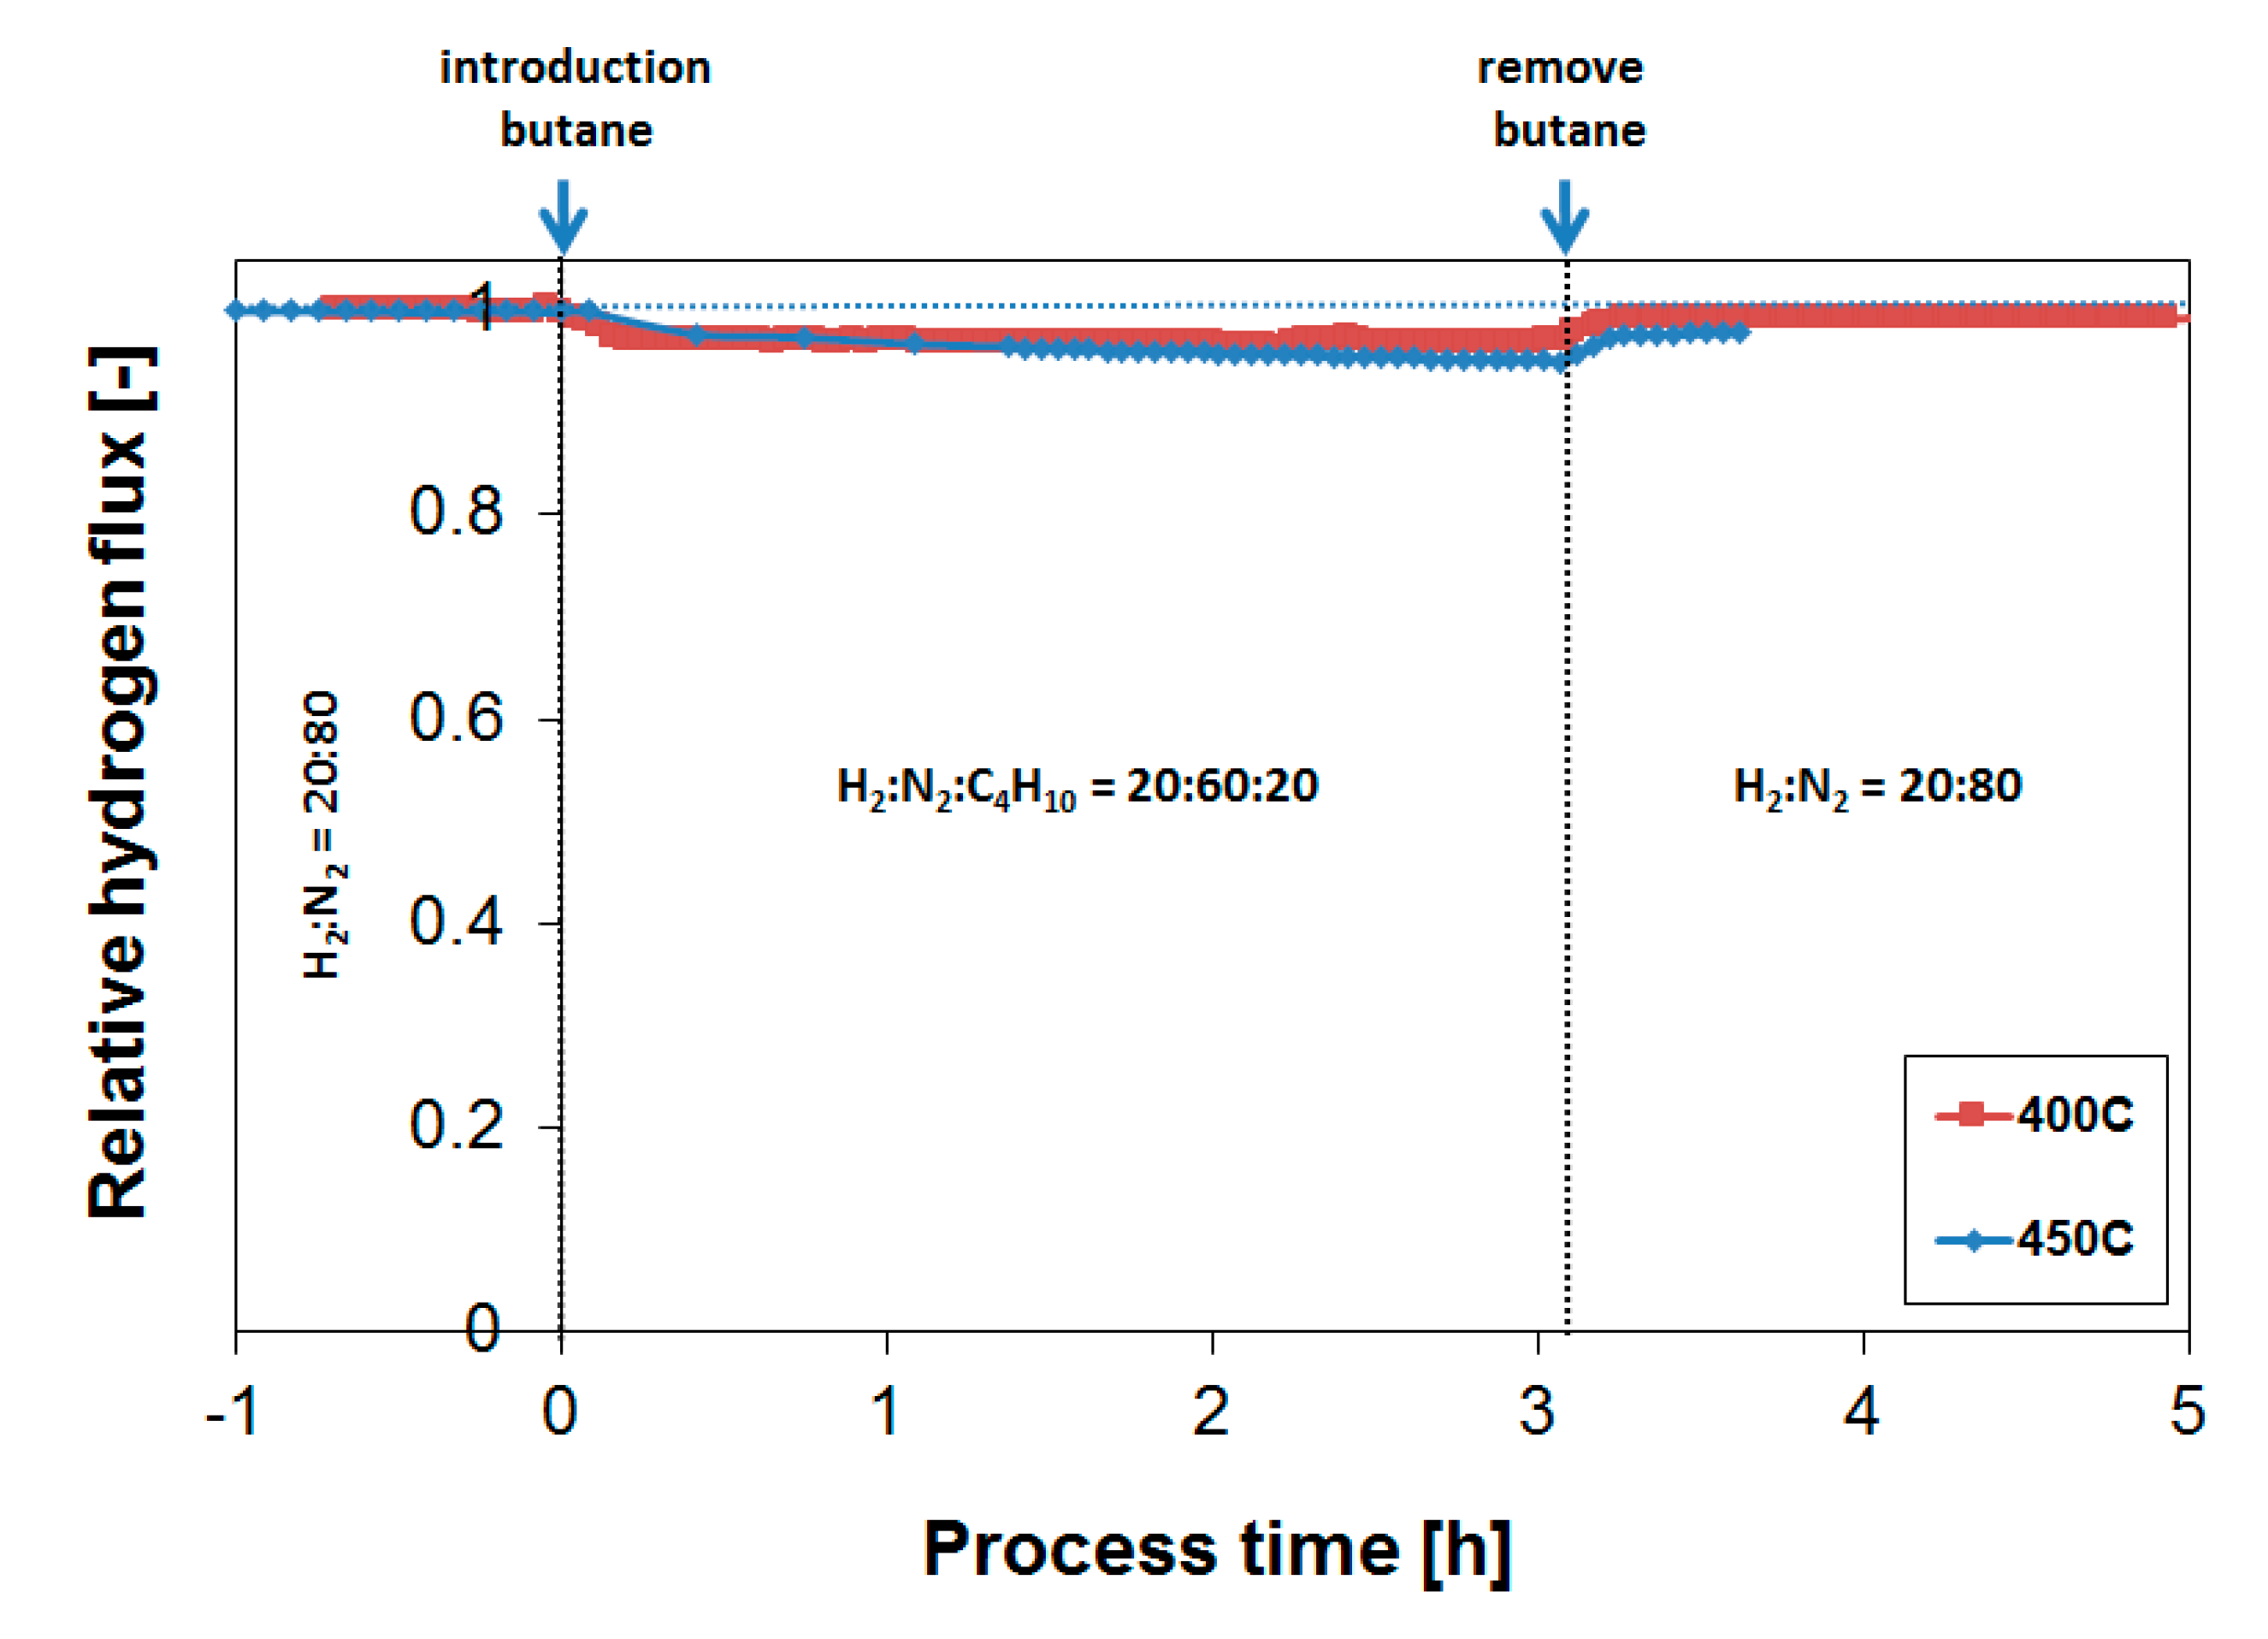
3.2. Exposure to Butane

The effect of butane on the H2 flux performance was investigated applying a feed mixture of H2:C4H10:N2 = 20:20:60 in order to simulate the butane dehydrogenation process. As in previous experiments with respect to propane [39], initial experiments were performed at 400 °C. Due to the low butane vapor pressure at room temperature, 1.6 bar, the exposure was performed at atmospheric pressure. Figure 2 shows the H2 flux during the introduction (process time of 210 h) and in presence of 20% butane, respectively. Note that the obtained H2 flux value is lower compared to the initial results presented in Figure 1 because of the lower H2 feed content.
The butane introduction resulted in a H2 flux decline of approximately 2–3%. The slight decrease in flux is presumably explained by a small mismatch in the applied flows, resulting in a minor decrease in H2 feed content upon butane introduction. Most importantly, the continuous exposure for 24 h to a feed of H2:N2:C4H10 = 20:60:20 resulted in a relatively constant H2 flux, showing that the tendency for coke formation in the presence of butane is minimal. The removal of butane (process time of 234 h) resulted as well in a complete flux recovery, suggesting that the observed inhibition was governed by a reversible adsorption process, and not by irreversible coke formation that was expected to be removed much slower from the surface. Subsequently, the butane effect was investigated at 450 °C. Figure 3 summarizes obtained H2 flux inhibition curves as a function of temperature plotted as relative H2 flux values at 400 and 450 °C. The relative H2 flux corresponds to the measured H2 flux in the presence of butane normalized by the H2 flux obtained before the butane introduction under otherwise equal conditions of temperature, absolute feed pressure, hydrogen partial pressure and total feed flow rate.
Even though the flux decline was slightly accelerated at higher temperatures, the flux reducing coke formation tendency was still relatively limited at 450 °C. Comparing this limited flux decrease in the presence of butane with previous results for propane [39] shows that the H2 flux reducing tendency for butane was less compared to propane. A similar membrane operated at 450 °C in a mixture of H2:N2:C3H8 = 30:20:50 shows a gradual H2 flux decrease to a value of approximately 65% of the original H2 flux after 18 h. It should be noted that the ratio between H2 and the hydrocarbon determines the extent of coke formation. In that respect, a direct comparison is not directly possible, as [39] applied a H2 to propane ratio of 0.6. It should also be noted that the operating pressure is not the same either—1 bar versus 4 bar—even though this seemingly does not affect coke formation tendency.

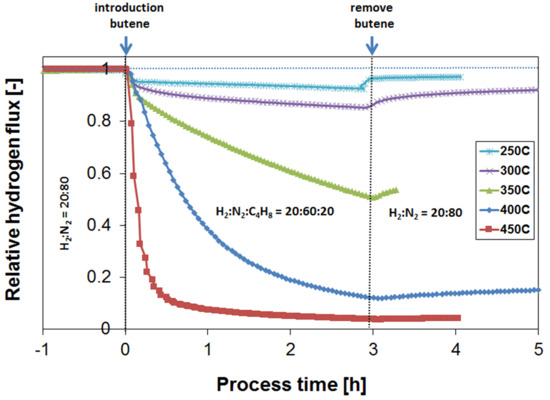
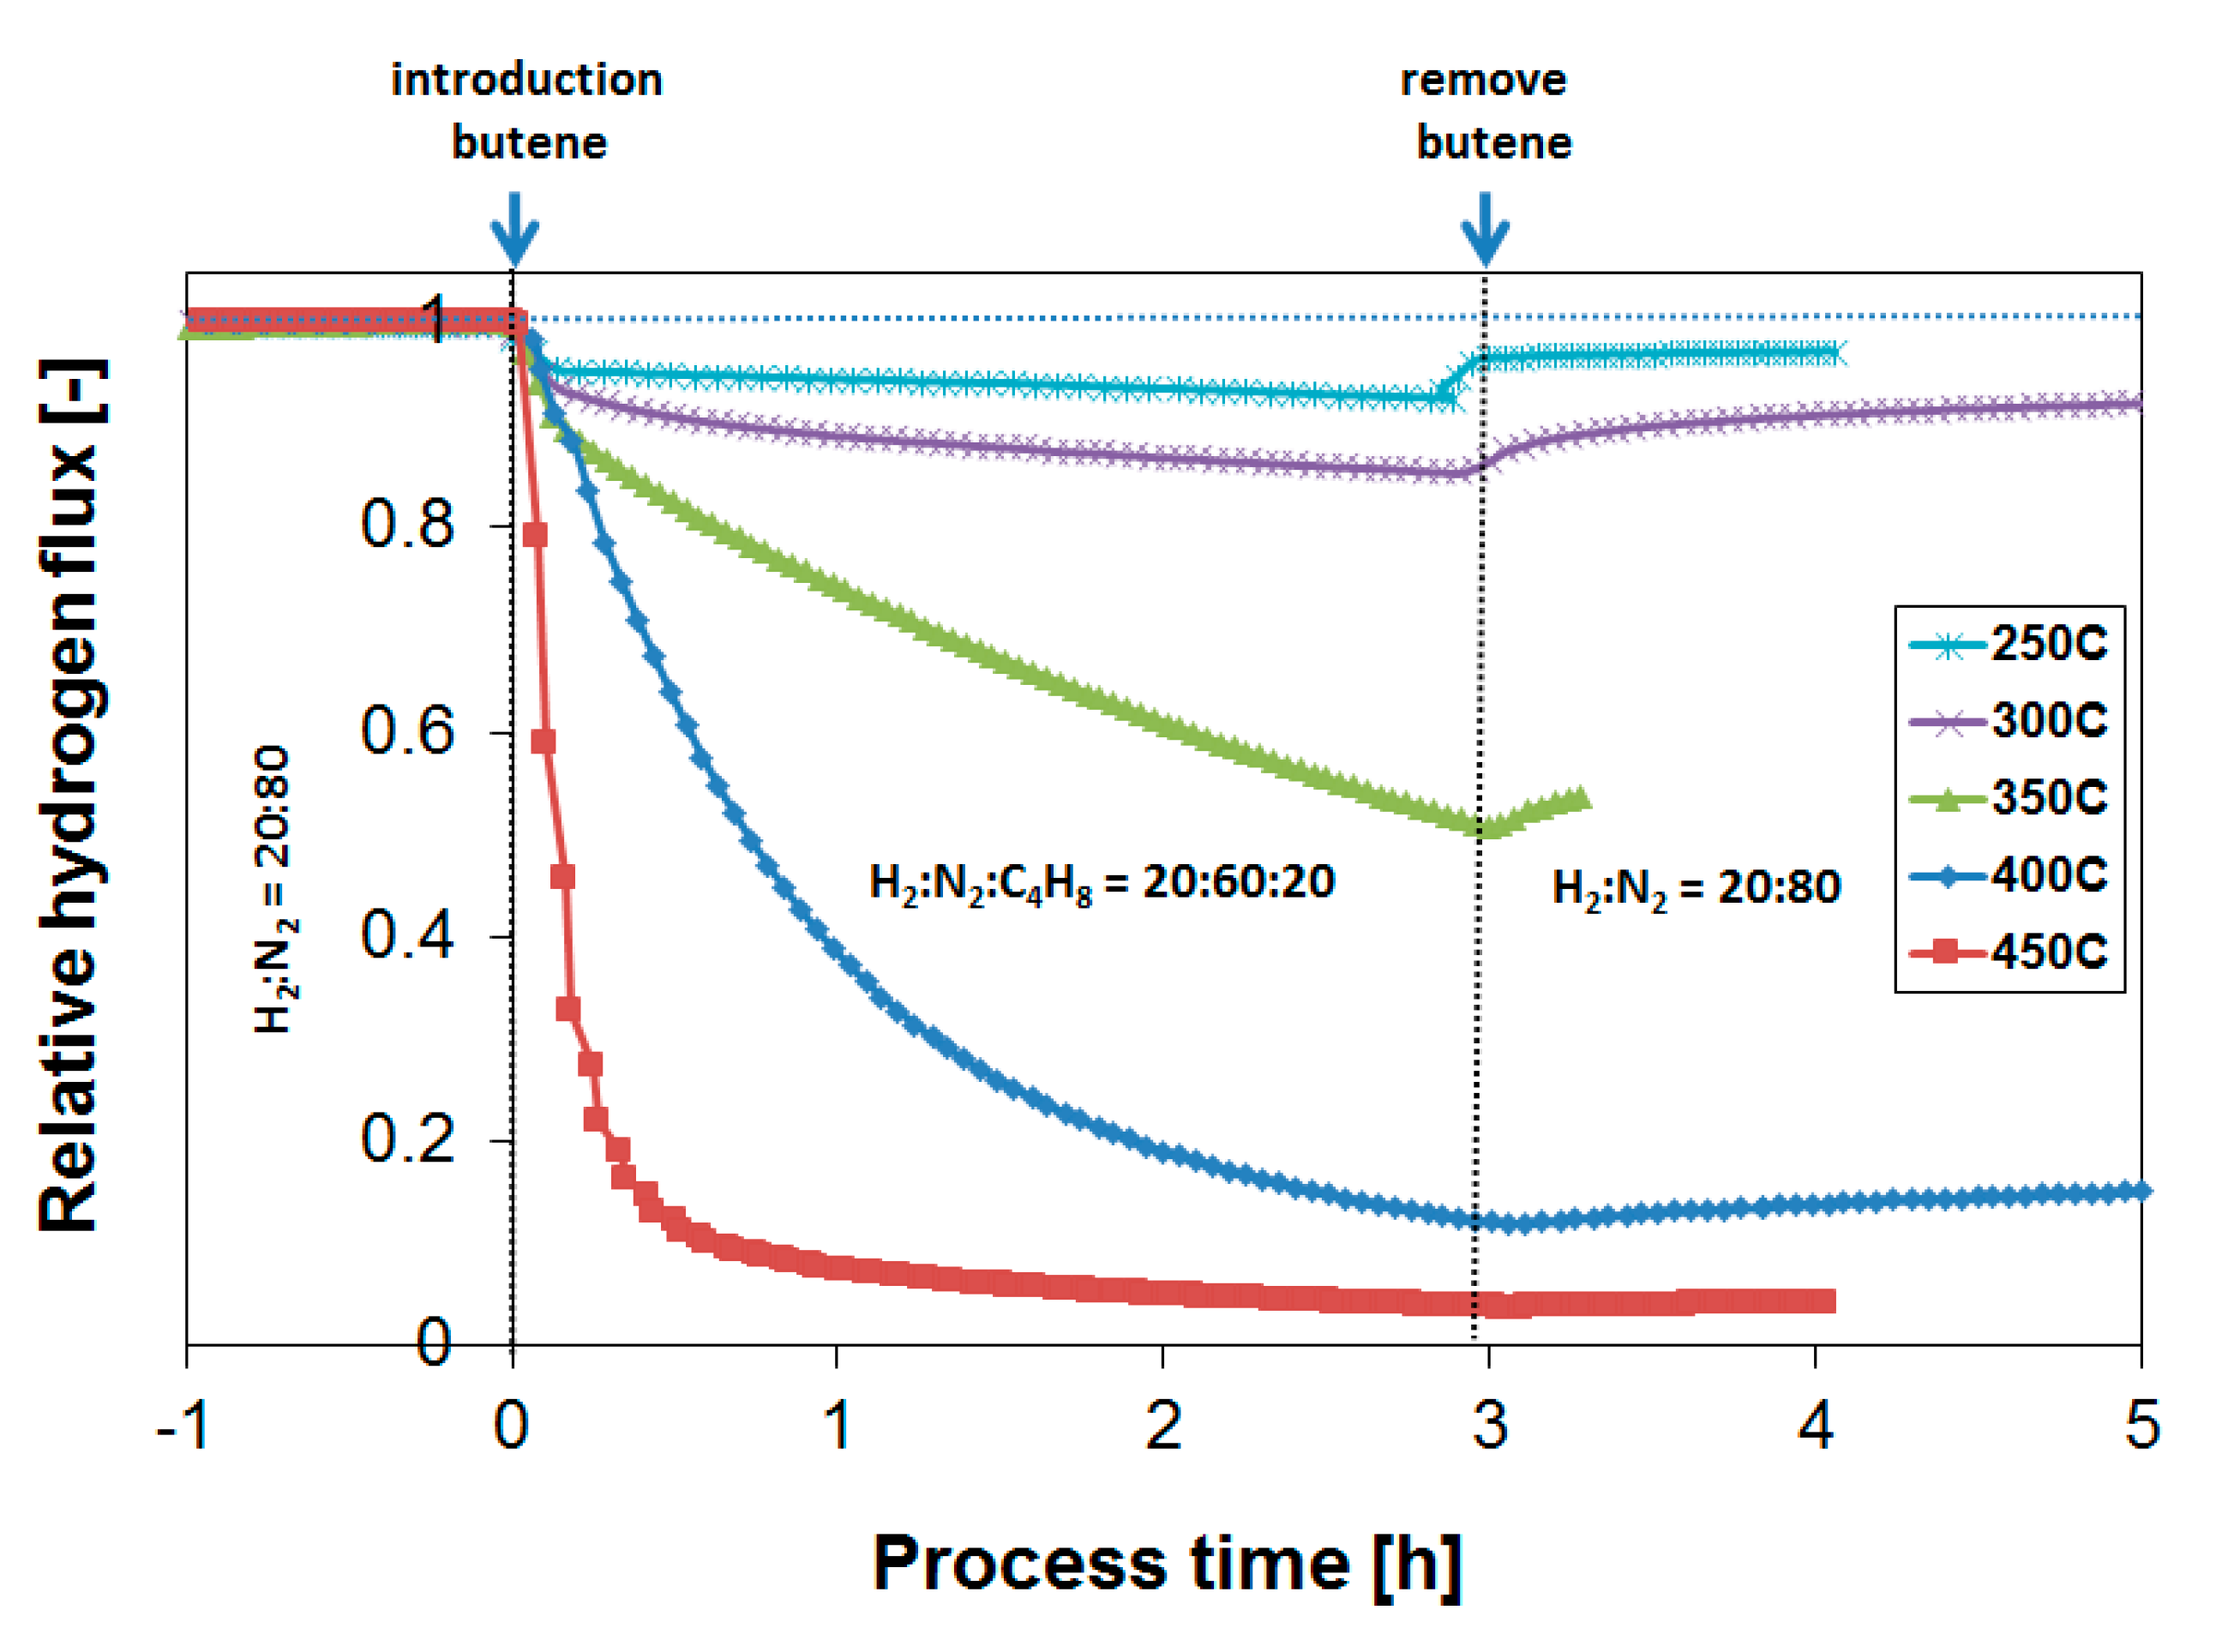
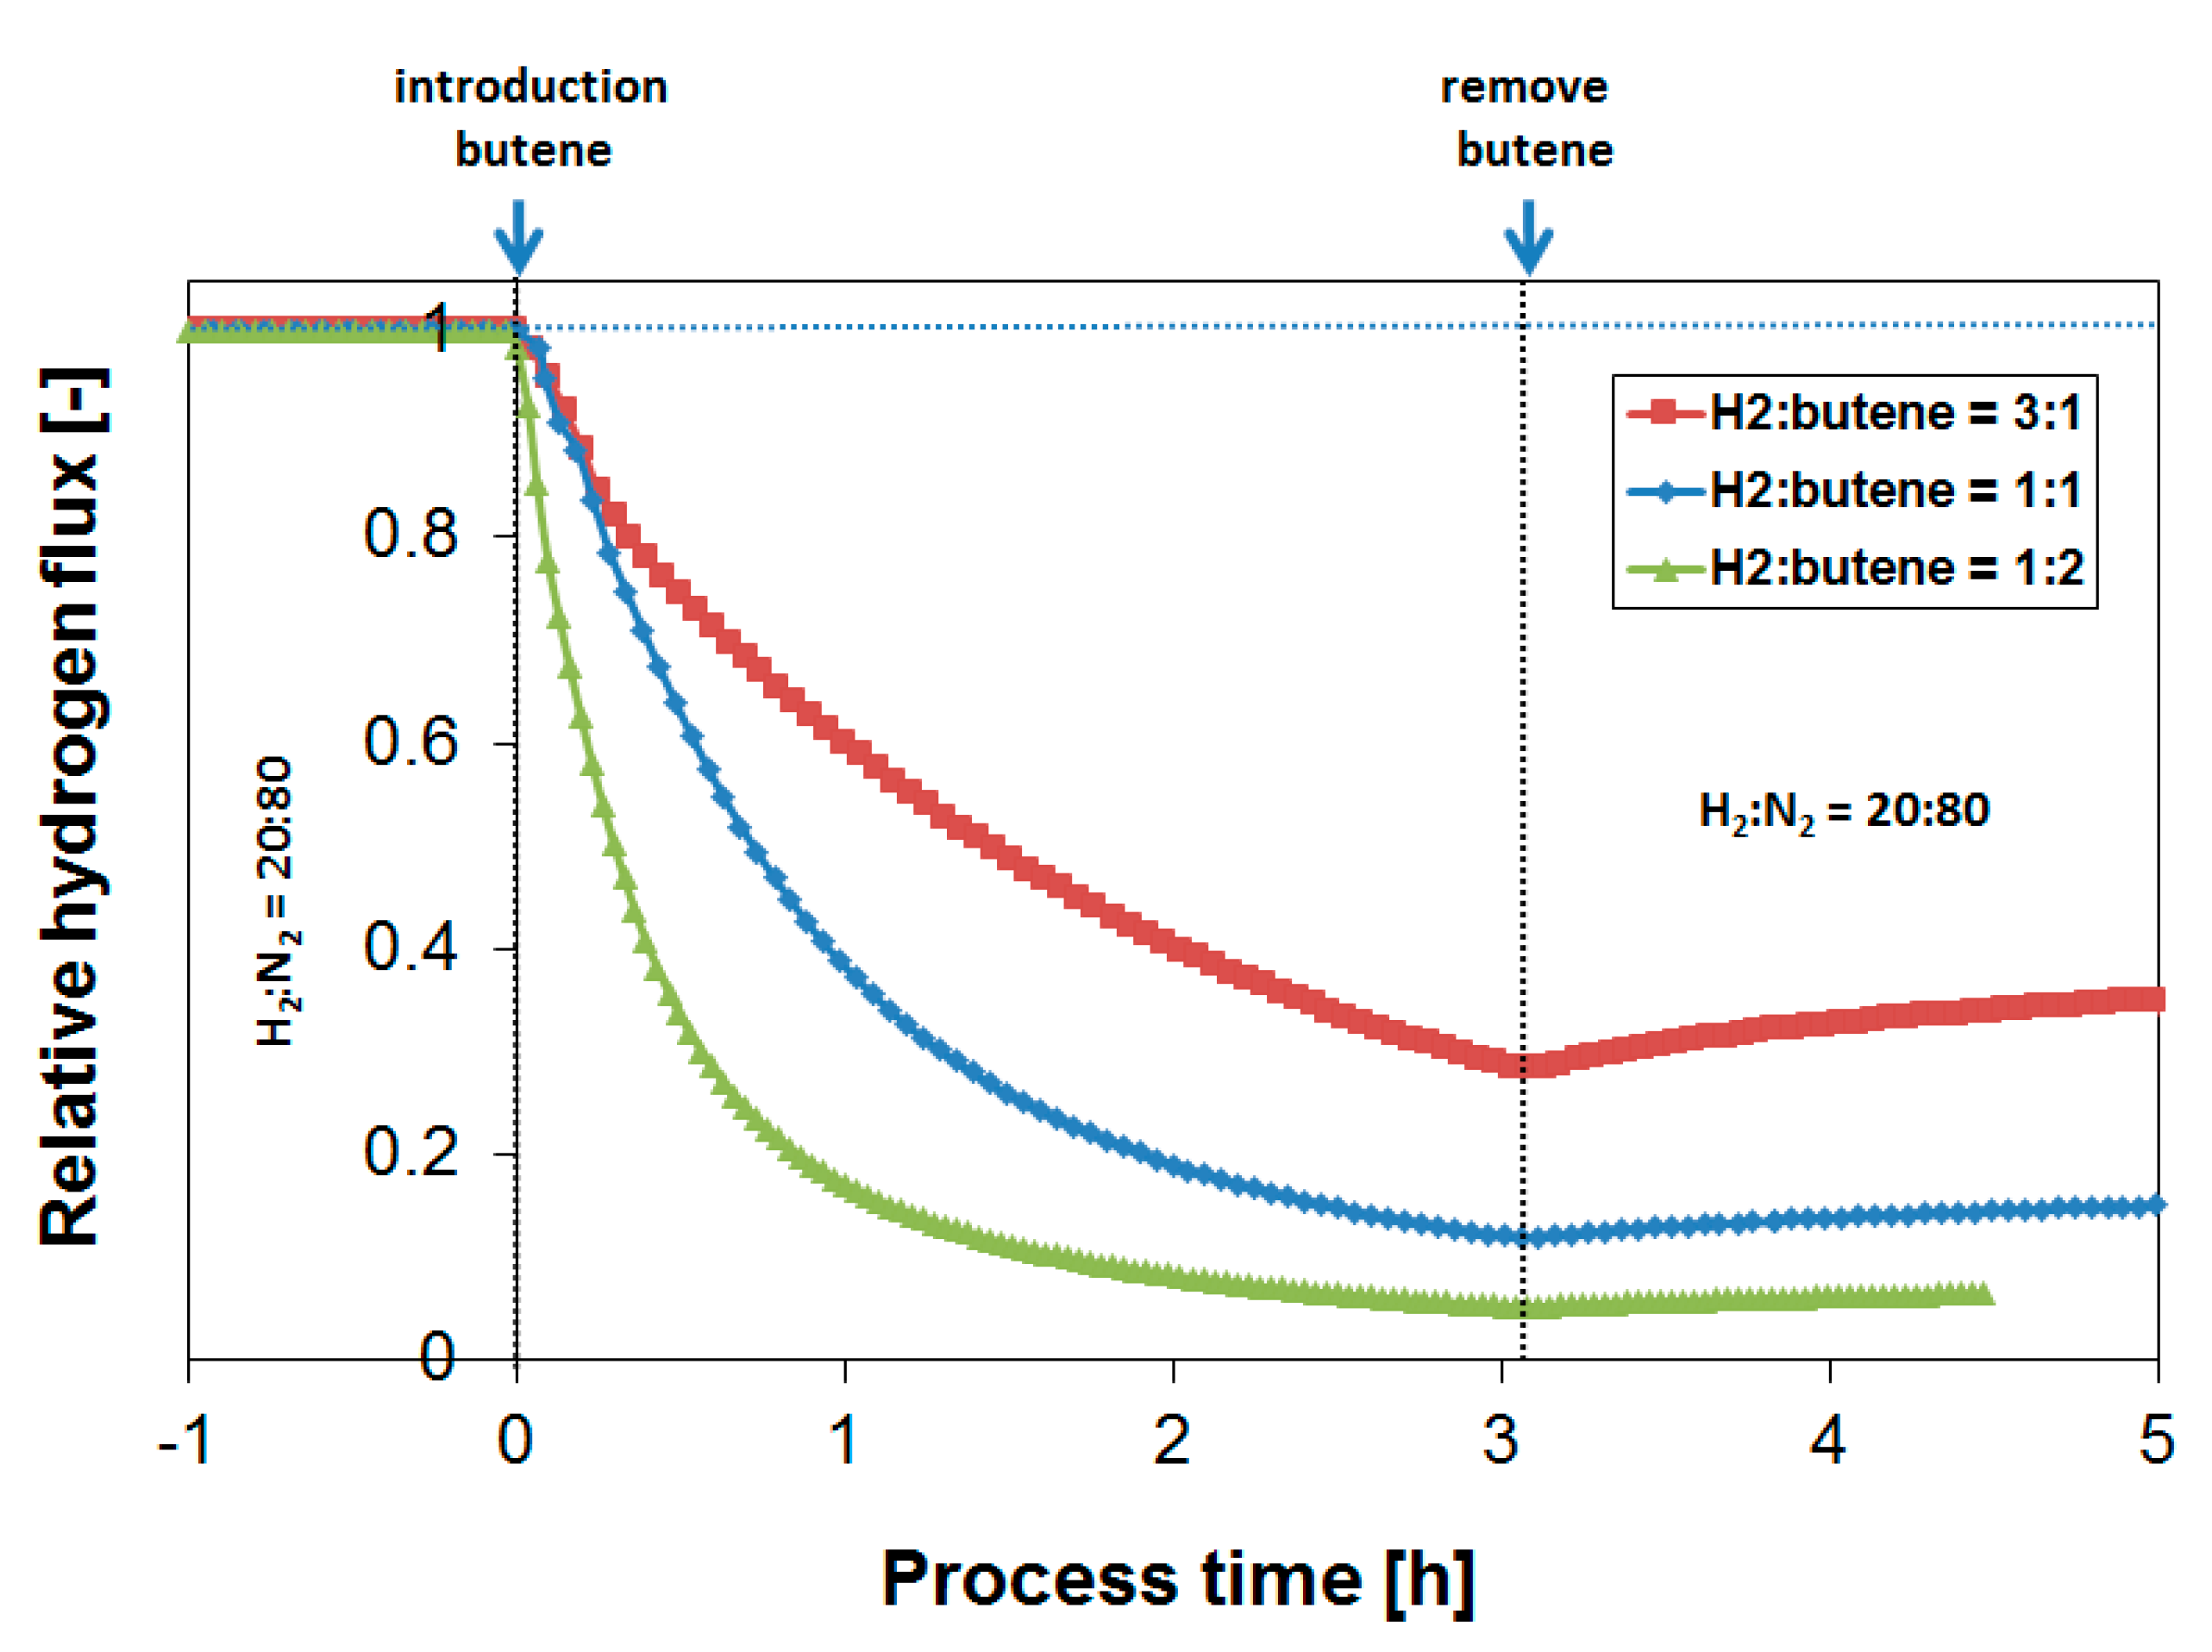
3.3. Parametric Study of H2 Flux Inhibition During Butylene Exposure

The effect of butylene on the H2 flux performance was investigated at varying H2/butylene ratios. For the initial experiments, a temperature of 400 °C was chosen, similar to the butane experiments described in Section 3.2. Figure 4 and Figure 5 show the H2 flux during exposure to a feed containing 20 or 40% butylene, respectively, at a H2 content of 20%. It was previously shown that the extent of coke formation is not determined by the absolute propylene concentration, but by the ratio between H2 and propylene [39,40].
Upon butylene exposure, the H2 flux rapidly decreases; in the case of 20% butylene, the flux dropped by ~85% after 3 h of exposure compared to the H2 flux prior to the butylene exposure. This is directly related to the gradual generation of surface-adsorbed CxHy species or coke formation on the membrane leading to a deactivation of the membrane surface. The large difference in coking tendency between alkanes and alkylenes was reported in an early study by Collins et al. [15] and in our previous work applying the same methodology [39]. This difference is explained by the much larger alkylene adsorption on palladium compared to alkanes, resulting in a higher propylene surface coverage under the same conditions [49,50]. Unsaturated species also have a higher tendency to form oligomers and ring structures compared to alkanes. The removal of butylene from the feed stream results in a gradual flux recovery, but, as seen before, a full recovery would not be reached within a reasonable time scale, e.g., several hours. Even a continuous exposure to a H2-containing feed in the absence of butylene over a period of >200 h at 350 °C did not result in a substantial recovery of the H2 flux, see Figure 7. Prior to the next exposure, an oxidative treatment was therefore consistently performed in order to recover the initial H2 flux. The oxidative treatment at the membrane operating temperature removes surface contaminants from the membrane, and thereby reverses the flux decrease [29,40,51]. In the case of severe coke formation, multiple and/or longer treatments in air were found to be required (as shown in, e.g., Figure 5 after coke formation exposing the membrane to a feed gas at a low H2 to butylene ratio). Figure 6 summarizes obtained H2 flux inhibition curves as a function of the H2/butylene ratio at 400 °C. The results were plotted as a relative flux to allow for a direct comparison of the propene inhibition and coke formation effect obtained at the different ratios.
It is shown that the poisoning effect of butylene generally increases with a decreasing H2/butylene ratio. It should also be noted that the rate of flux recovery in the absence of butylene is increasing with the H2/butylene ratio of the performed exposure, which is probably related to the amount of carbon formed during the experiment. This agrees with previous results on propylene [39,40]. In a membrane-enhanced dehydrogenation process, however, at realistic conditions of hydrogen recovery, H2/butylene ratios of 0.33–0.5 are typically encountered [6,23,41]. From Figure 6 it can be seen that at the H2/butylene ratio of 0.5, the H2 flux decreases by approximately 95% after three hours of exposure, which would not be acceptable from a process point of view. It would thus be required to decrease the membrane temperature in order to prevent coke formation in the presence of butylene. Alternatively, a protective coating can be applied on top of the Pd-based membrane surface to prevent the detrimental gaseous components that are responsible for the flux decrease from reaching the Pd membrane surface [52,53], but this was not part of the current study.
Subsequently, coke formation kinetics were investigated as a function of temperature between 250 and 450 °C at a fixed H2/butylene ratio of 1. Figure 7 shows the H2 flux during butylene exposure to a feed composition of H2:N2:C4H8 = 20:60:20 at 350 °C, while Figure 8 summarizes the obtained H2 flux inhibition curves as a function of temperature, again plotted in relative flux numbers.
Figure 8 shows that the extent of coking decreases rapidly with temperature, and coke formation is rather limited already at 250 °C under the conditions investigated, leading to stable membrane operation. This is as expected from similar studies with respect to the development of dehydrogenation catalysts [54]. It is thus potentially possible, in a non-integrated sequential reactor/separator process scheme, to operate the membrane module at a lower temperature than the dehydrogenation reactor, thereby allowing for stable membrane operation. In terms of the absolute attainable H2 flux, the negative effect of this temperature decrease is very limited due to the low activation energy of permeation. Moreover, the produced H2 might even be applied to heat the incoming feed stream to the next dehydrogenation reactor. However, to investigate whether these operating conditions allow for sufficiently stable membrane operation, which preferably matches the lifetime of the catalyst system, long-term exposures were investigated.

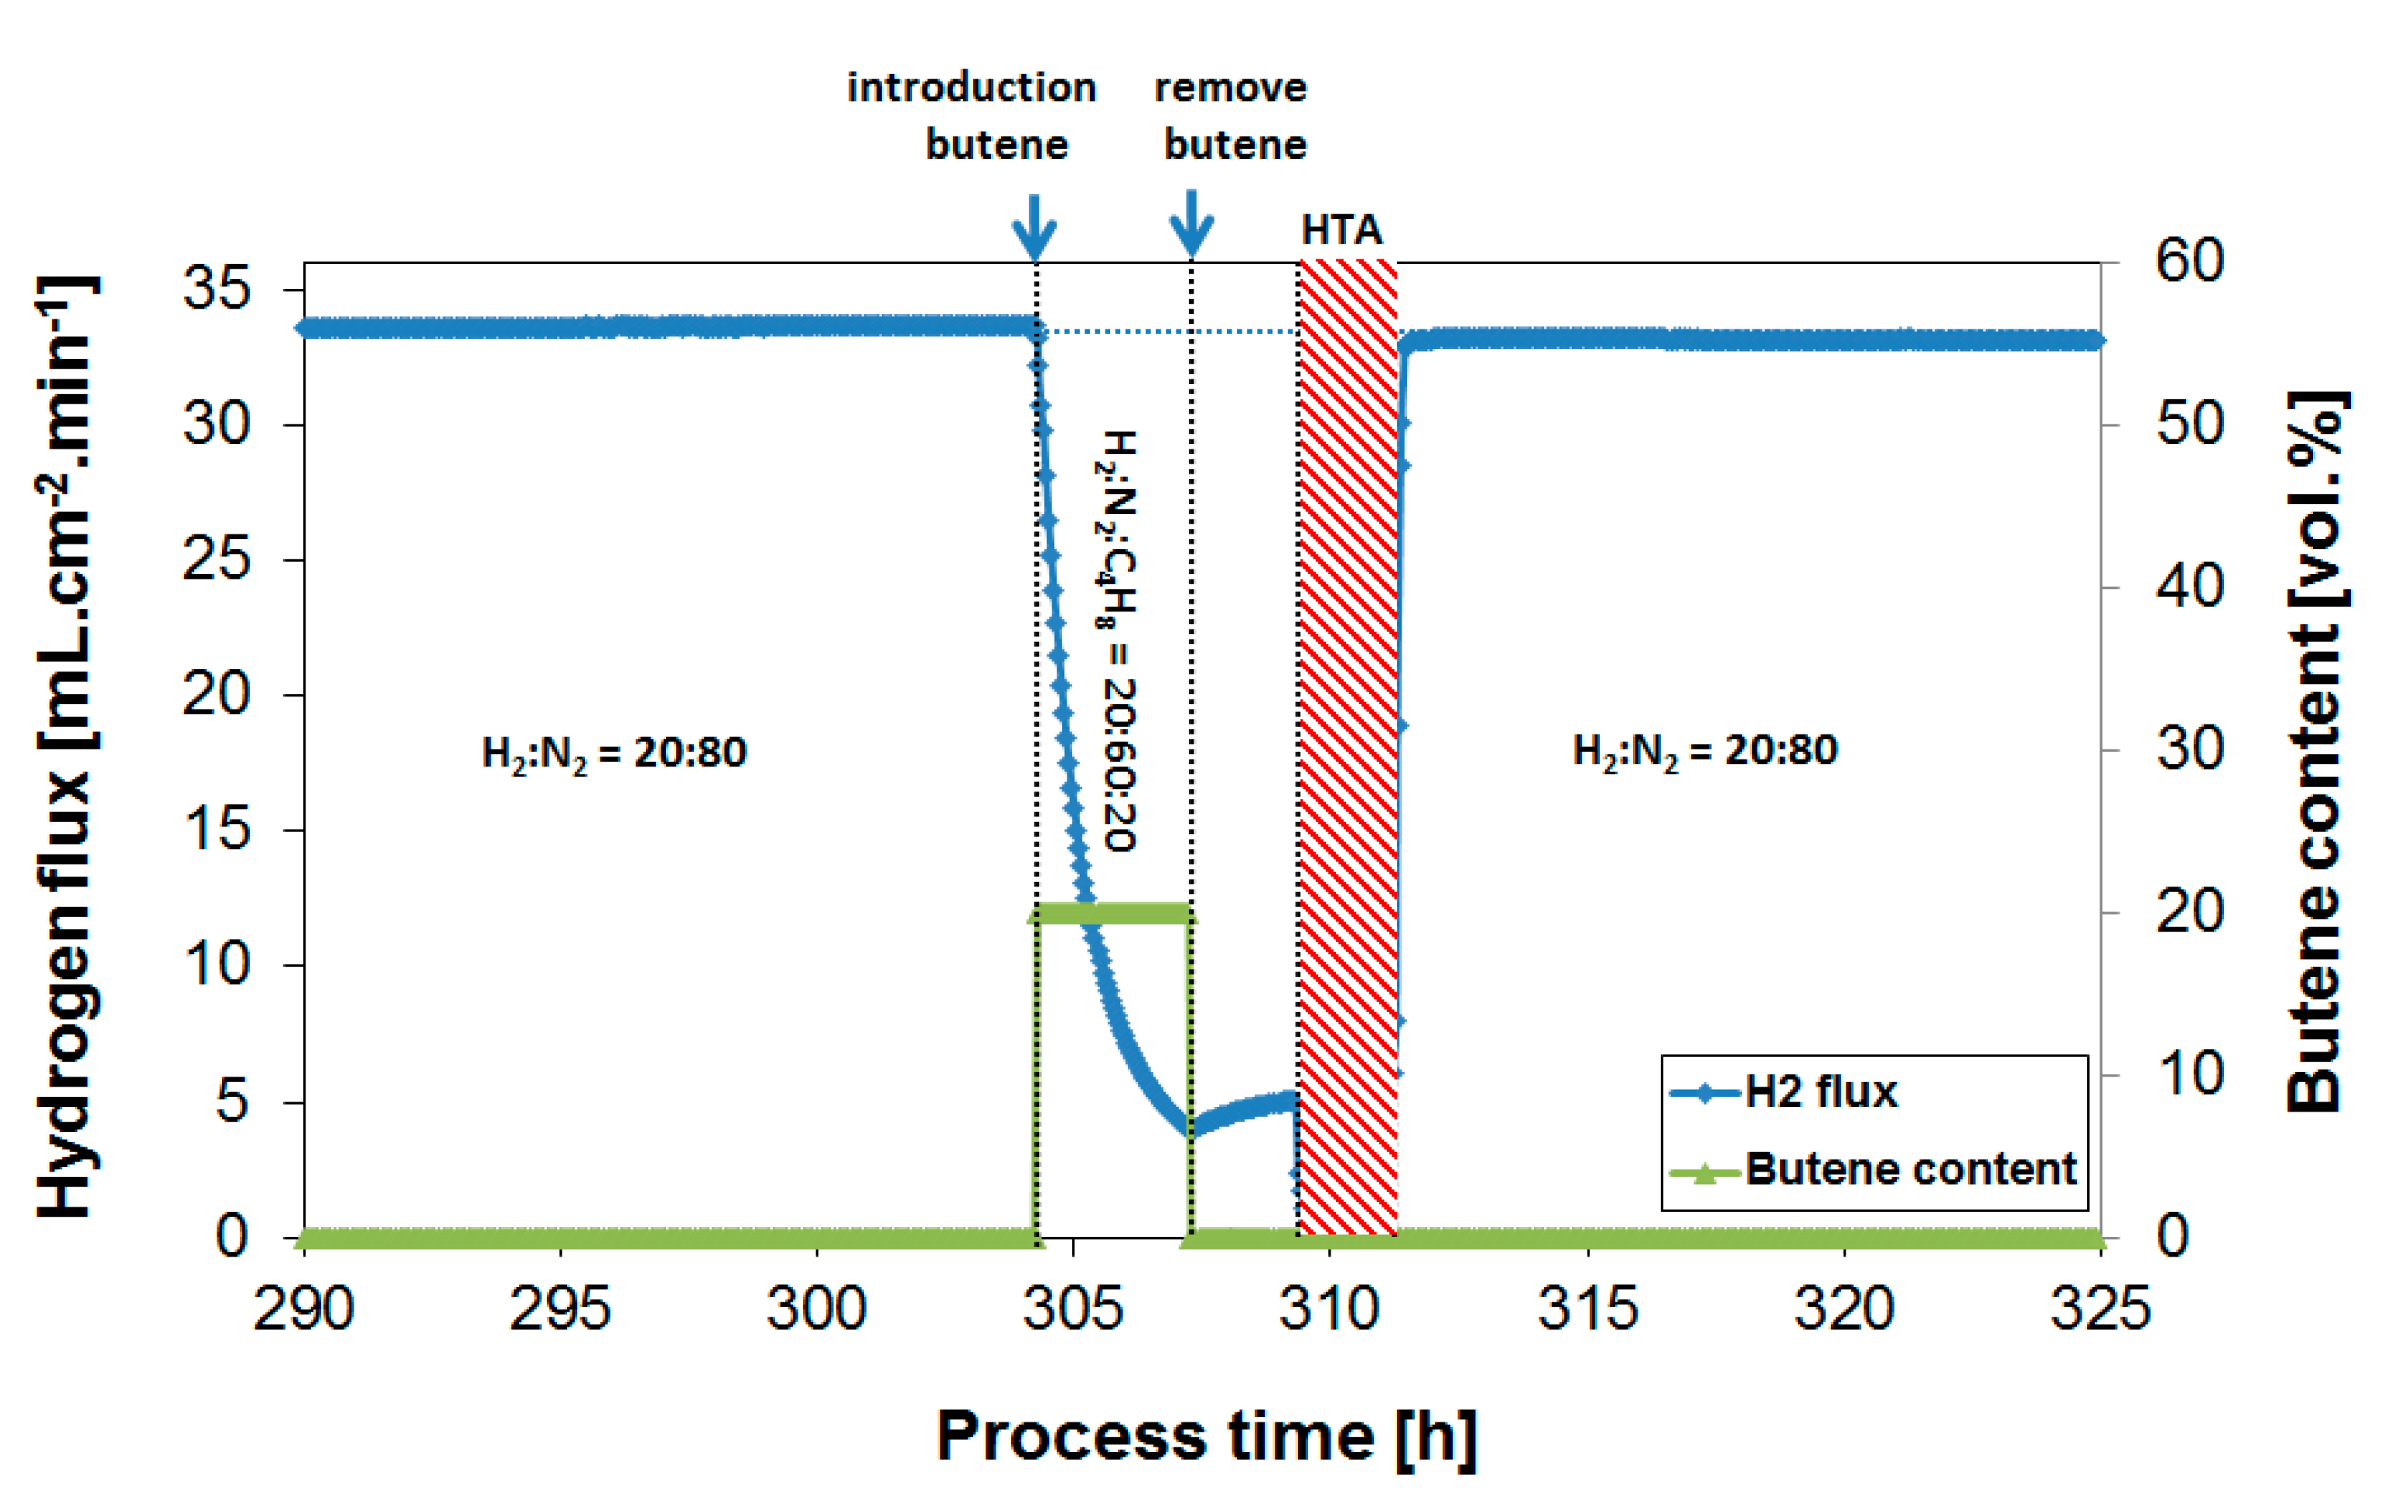
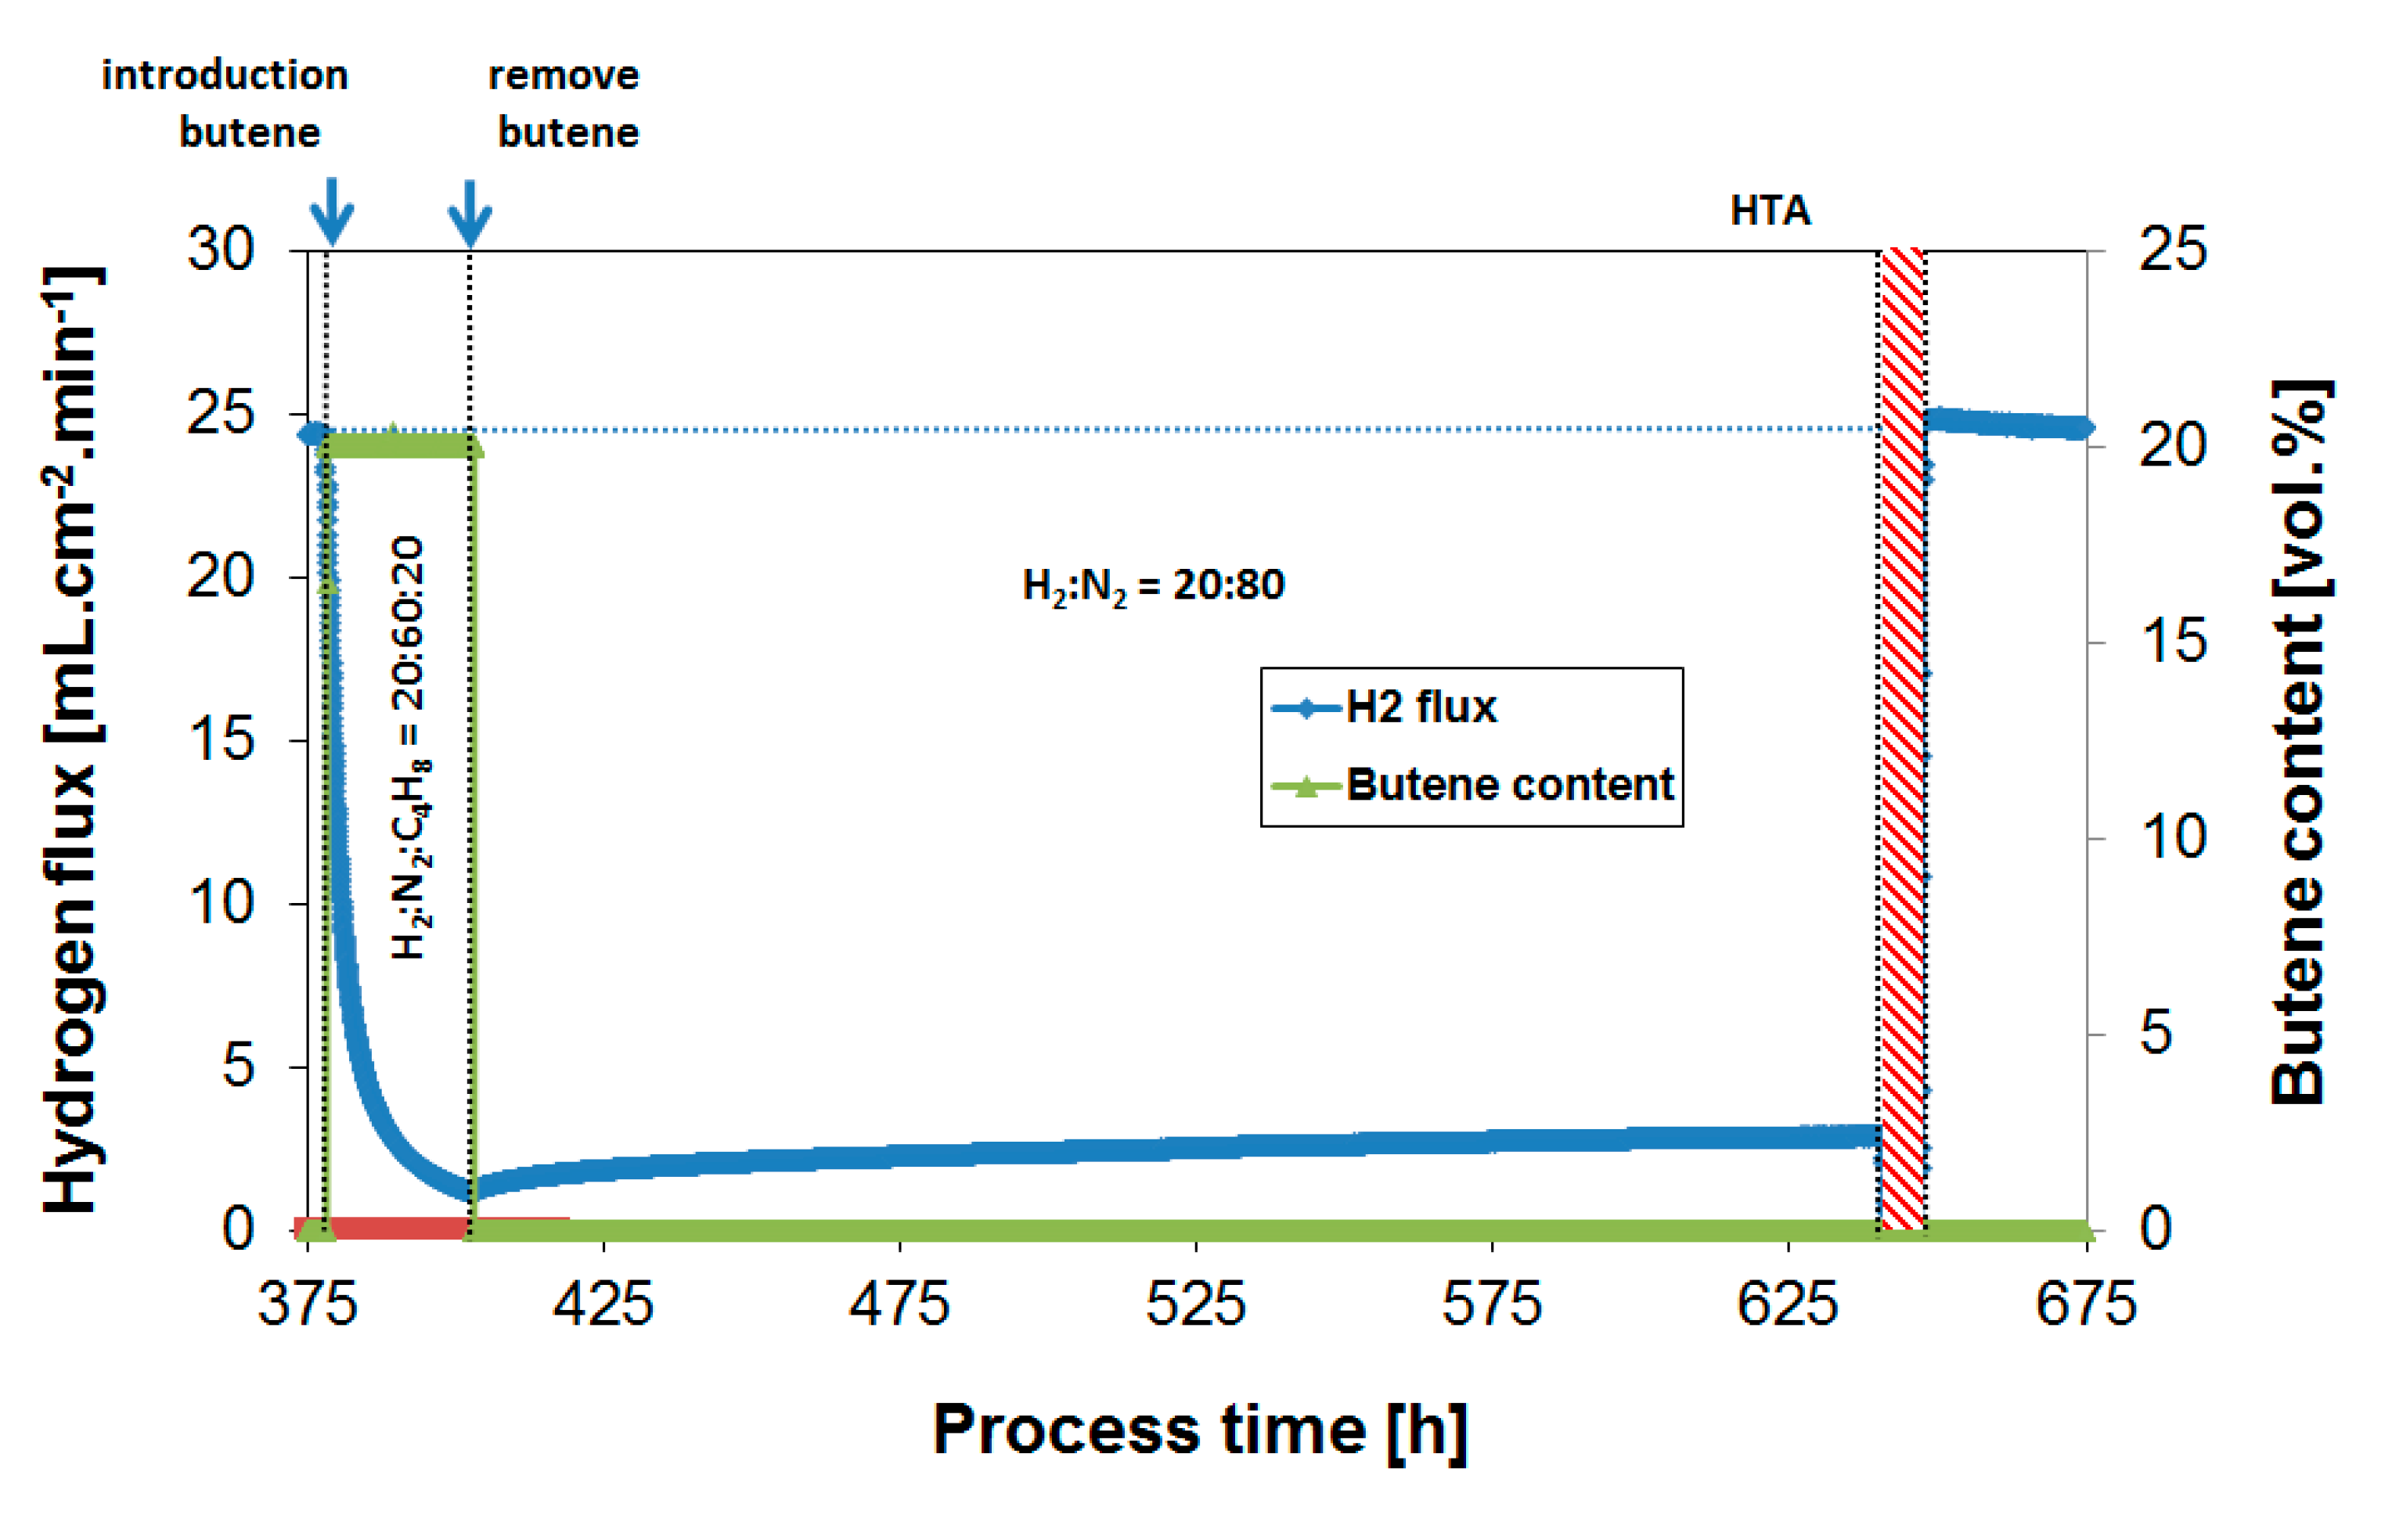
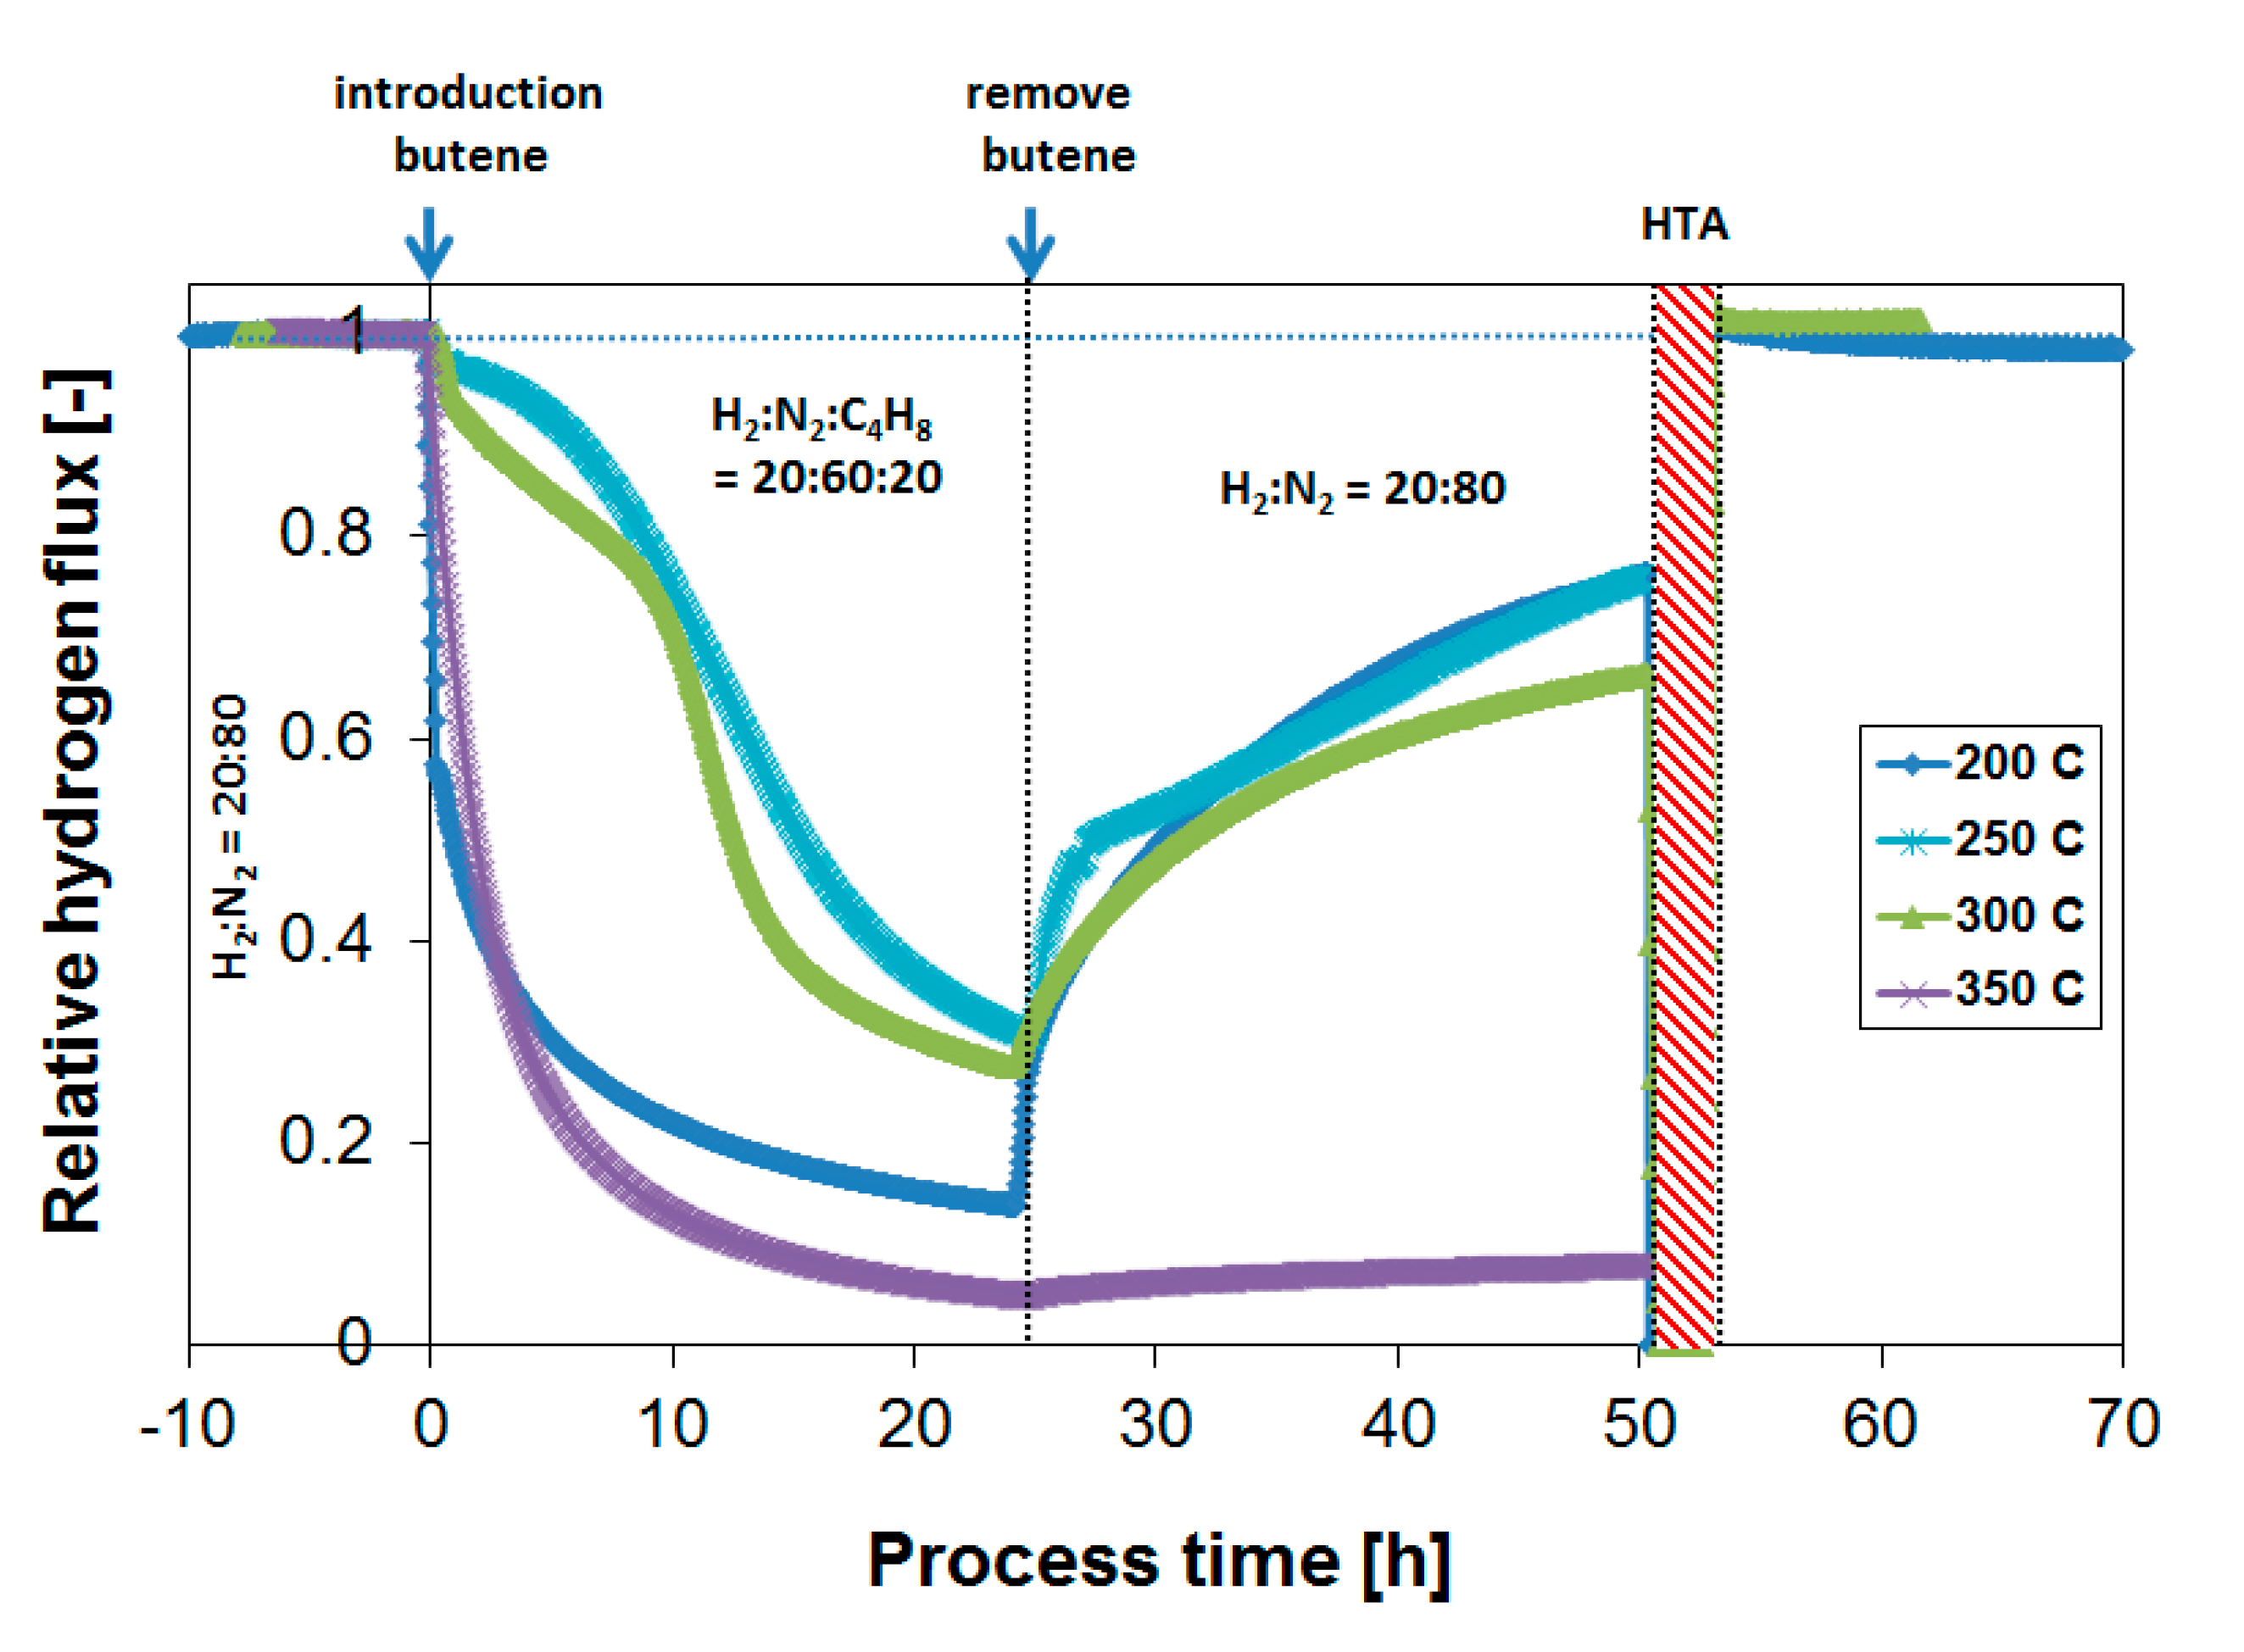
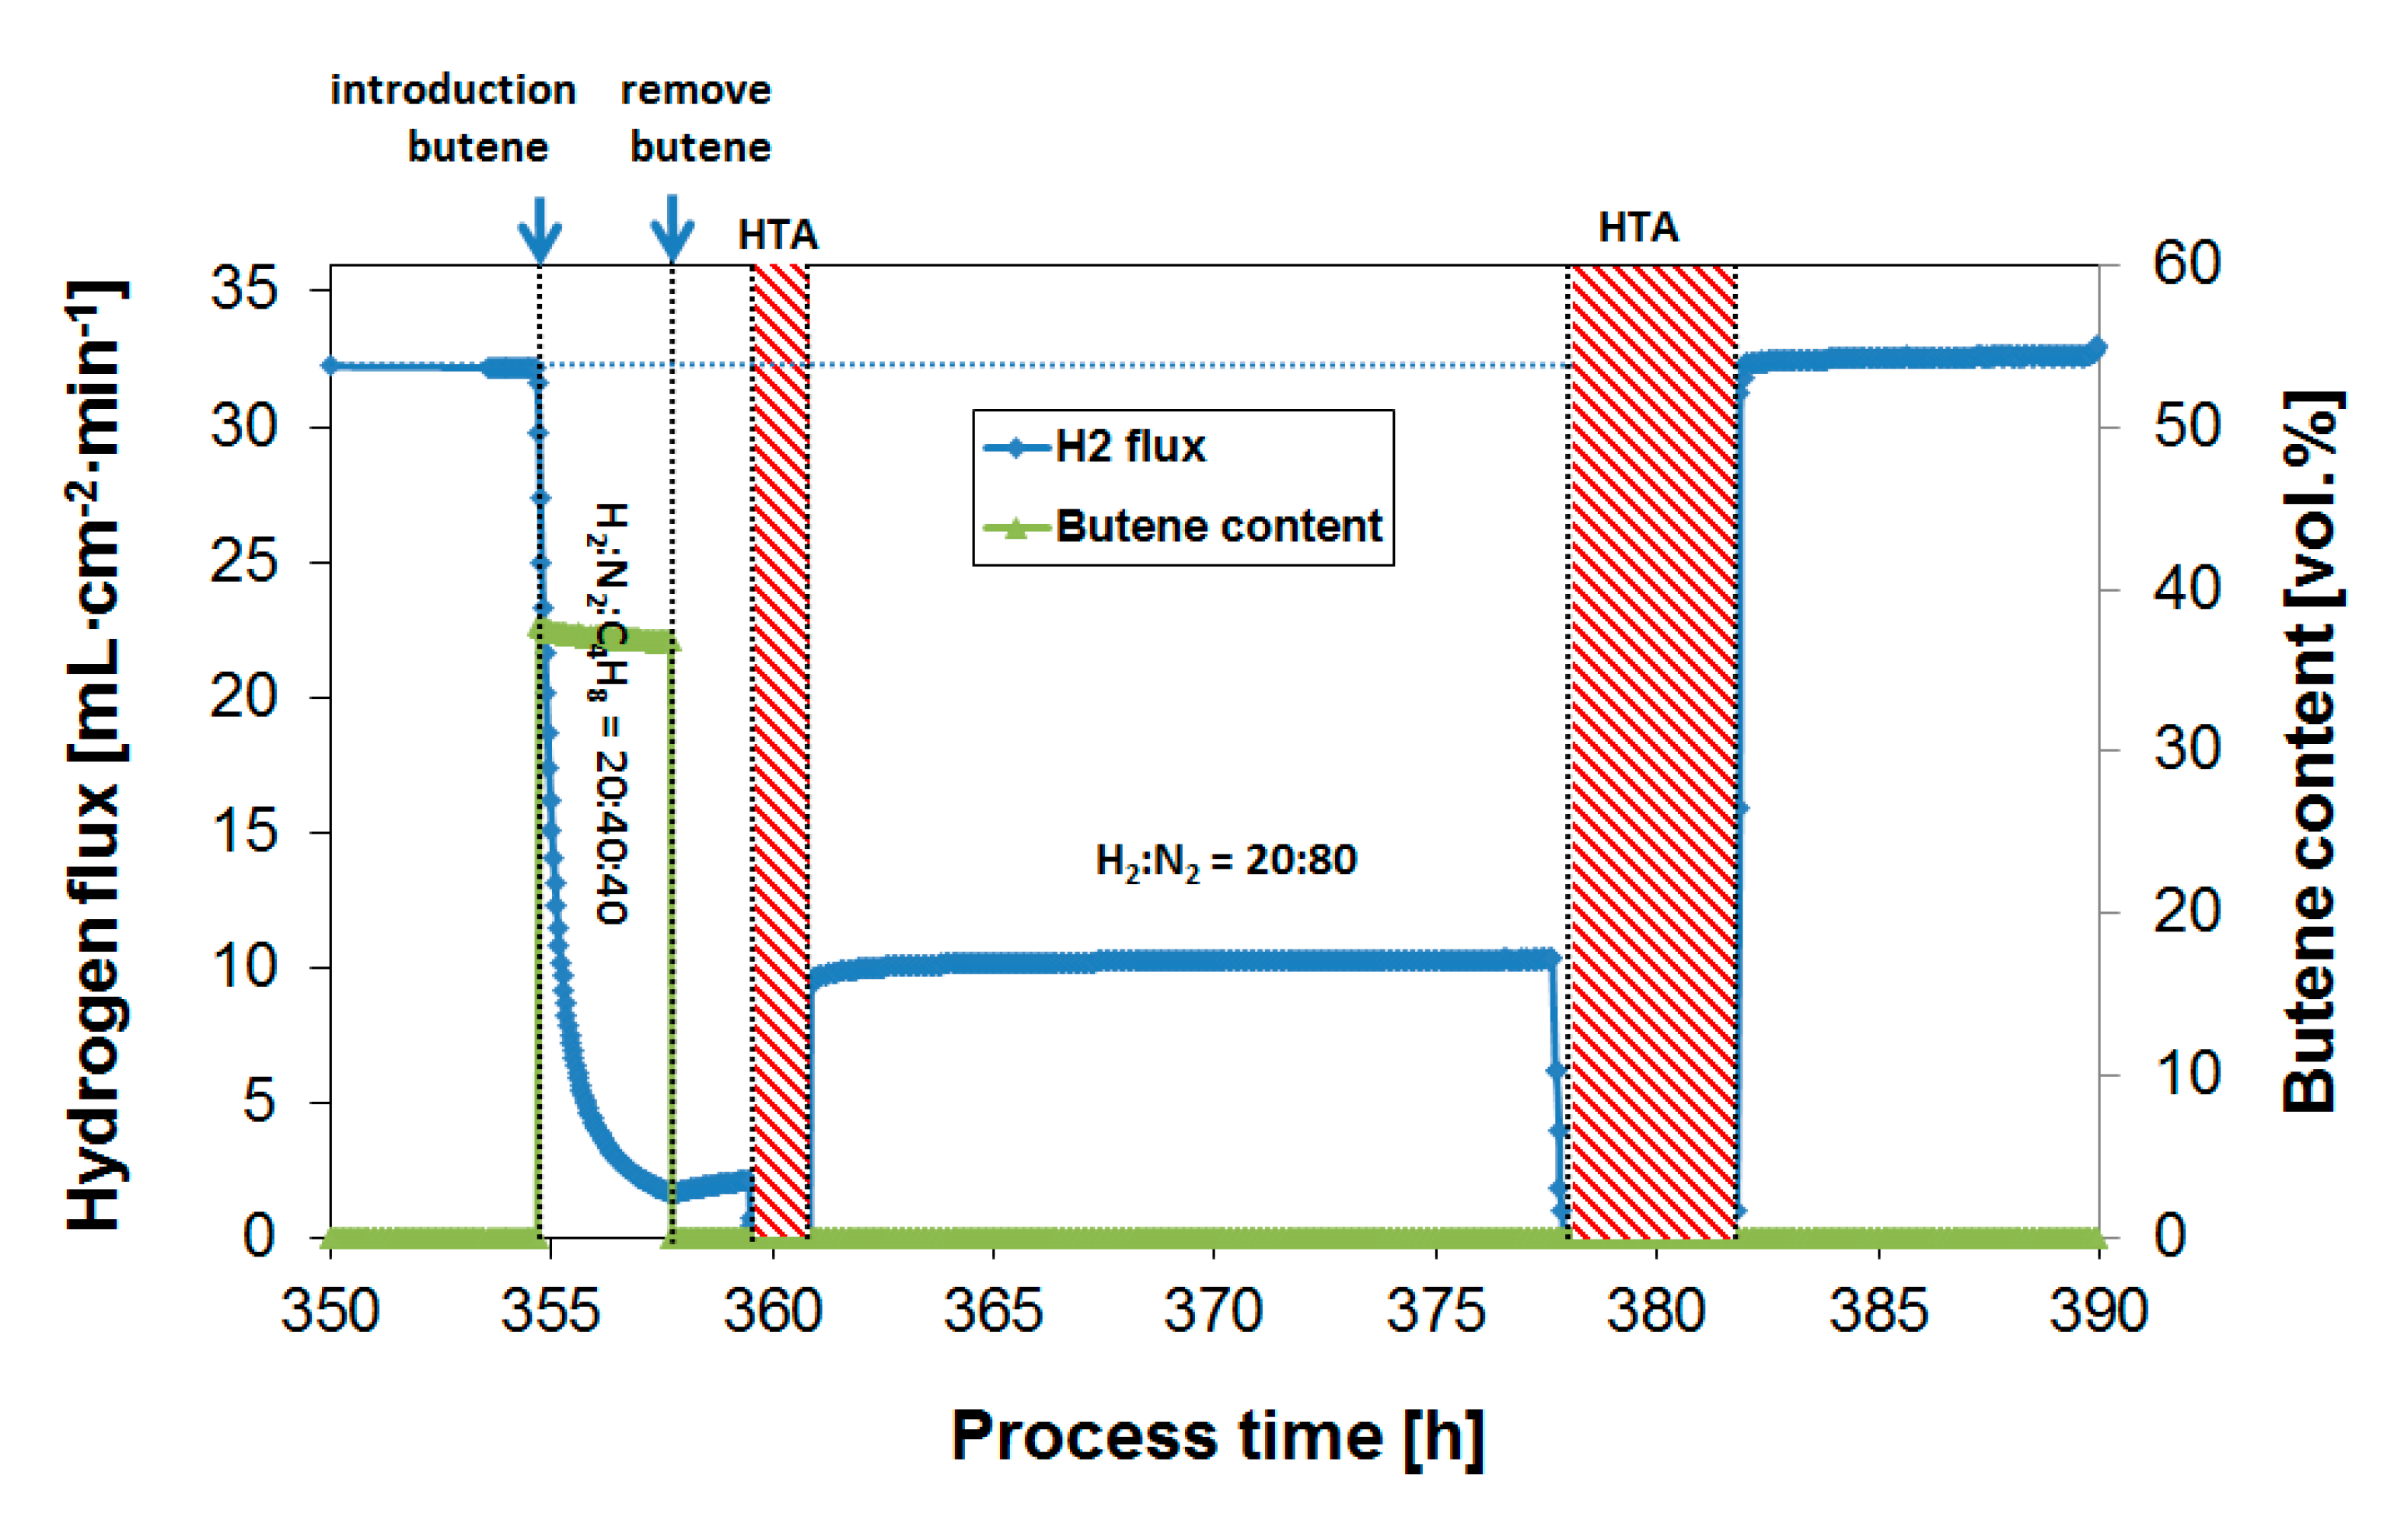
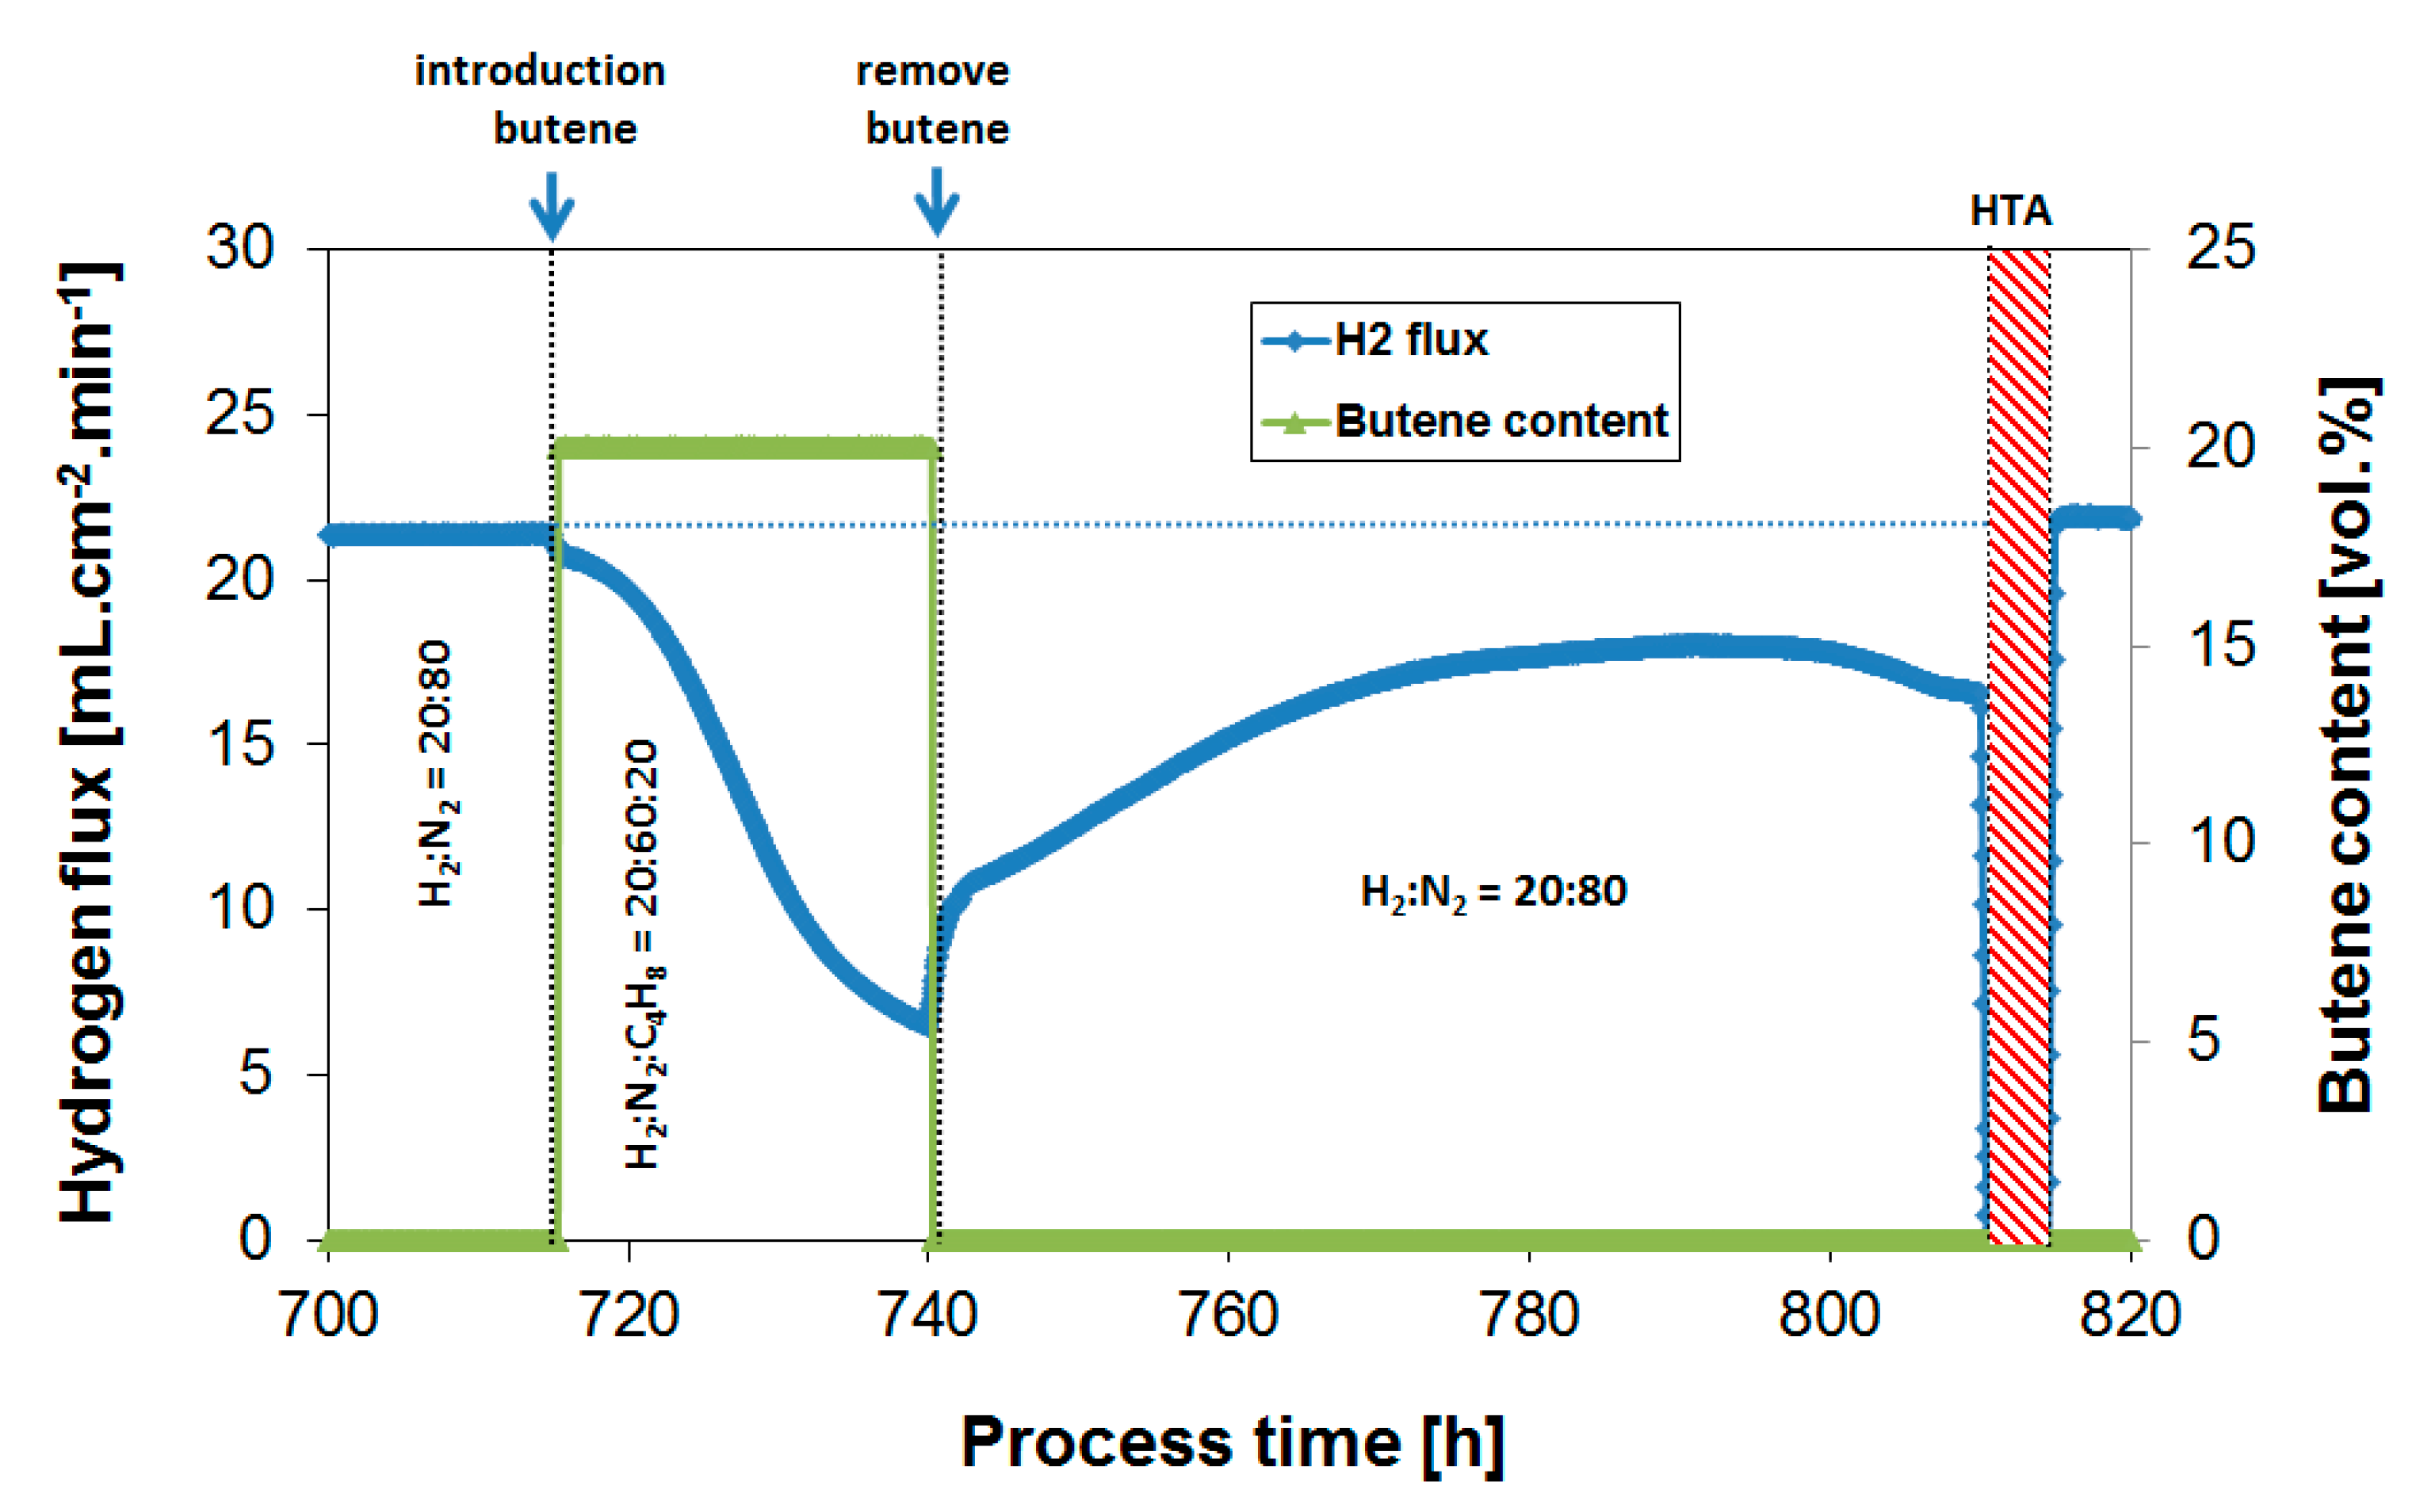
3.4. Long-Term Performance During Butylene Exposure

The behavior of membrane performance over prolonged exposure to butylene (24 h instead of 3 h) at 250 °C is reported in Figure 9. Even though coke formation in the short term is rather limited already at 250 °C (Figure 8), the prolonged exposure to the same temperature leads to drastically reduced H2 fluxes. After 24 h, the H2 flux decreased to a value of approximately 30% of the original H2 flux.
Figure 10 summarizes obtained H2 flux inhibition curves as a function of temperature plotted as relative flux numbers. A further decrease to 200 °C did not improve the membrane operability. On the contrary, even though coke formation tendency in itself was lowered with temperature, the competitive adsorption of butylene with respect to hydrogen accounted for a large initial flux penalty. This is visualized by the large immediate flux decrease directly after butylene introduction for the exposure at 200 °C. A similar initial flux decrease due to absorption is not visible at higher temperatures.
In terms of operating temperature, an optimal temperature was thus found at 250–300 °C with respect to obtaining the highest absolute hydrogen flux in the presence of butylene. The same can be concluded from the flux recovery in the absence of any butylene. Whereas the flux decrease that occurred during the exposure at 350 °C was persistent, the flux decrease due to the surface CxHy species or coke formed at lower temperatures was recovered at a higher rate. This suggests that more persistent poisoning species form at temperatures > 300 °C, which may include various surface species and subsurface carbon [40].

3.5. Membrane Stability

3.5.1. Separation Performance

Figure 11 shows the performance of membrane module 1 during nearly 1600 h of operation during which the module was operated up to 450 °C and 4 bars, respectively. During the operation, the module went through two start-up and shut-down cycles and was exposed to air at elevated temperatures for a total of 15 times to regenerate the performance after hydrocarbon exposure.
During the initial 1500 h of testing, no unselective flow of N2 was observed, showing that the membrane was 100% selective to H2. However, after approximately 1600 h, during the evaluation of the butylene effect at 200 °C, the membrane started to leak, as indicated by the appearance of N2 on the permeate side of the membrane. The module was then cooled down and made available for post-process characterization. A new membrane module was prepared for the longer-term exposure experiments to butylene as described in Section 3.4. This second module was operated for nearly 1000 h and kept 100% selective to hydrogen throughout the test.

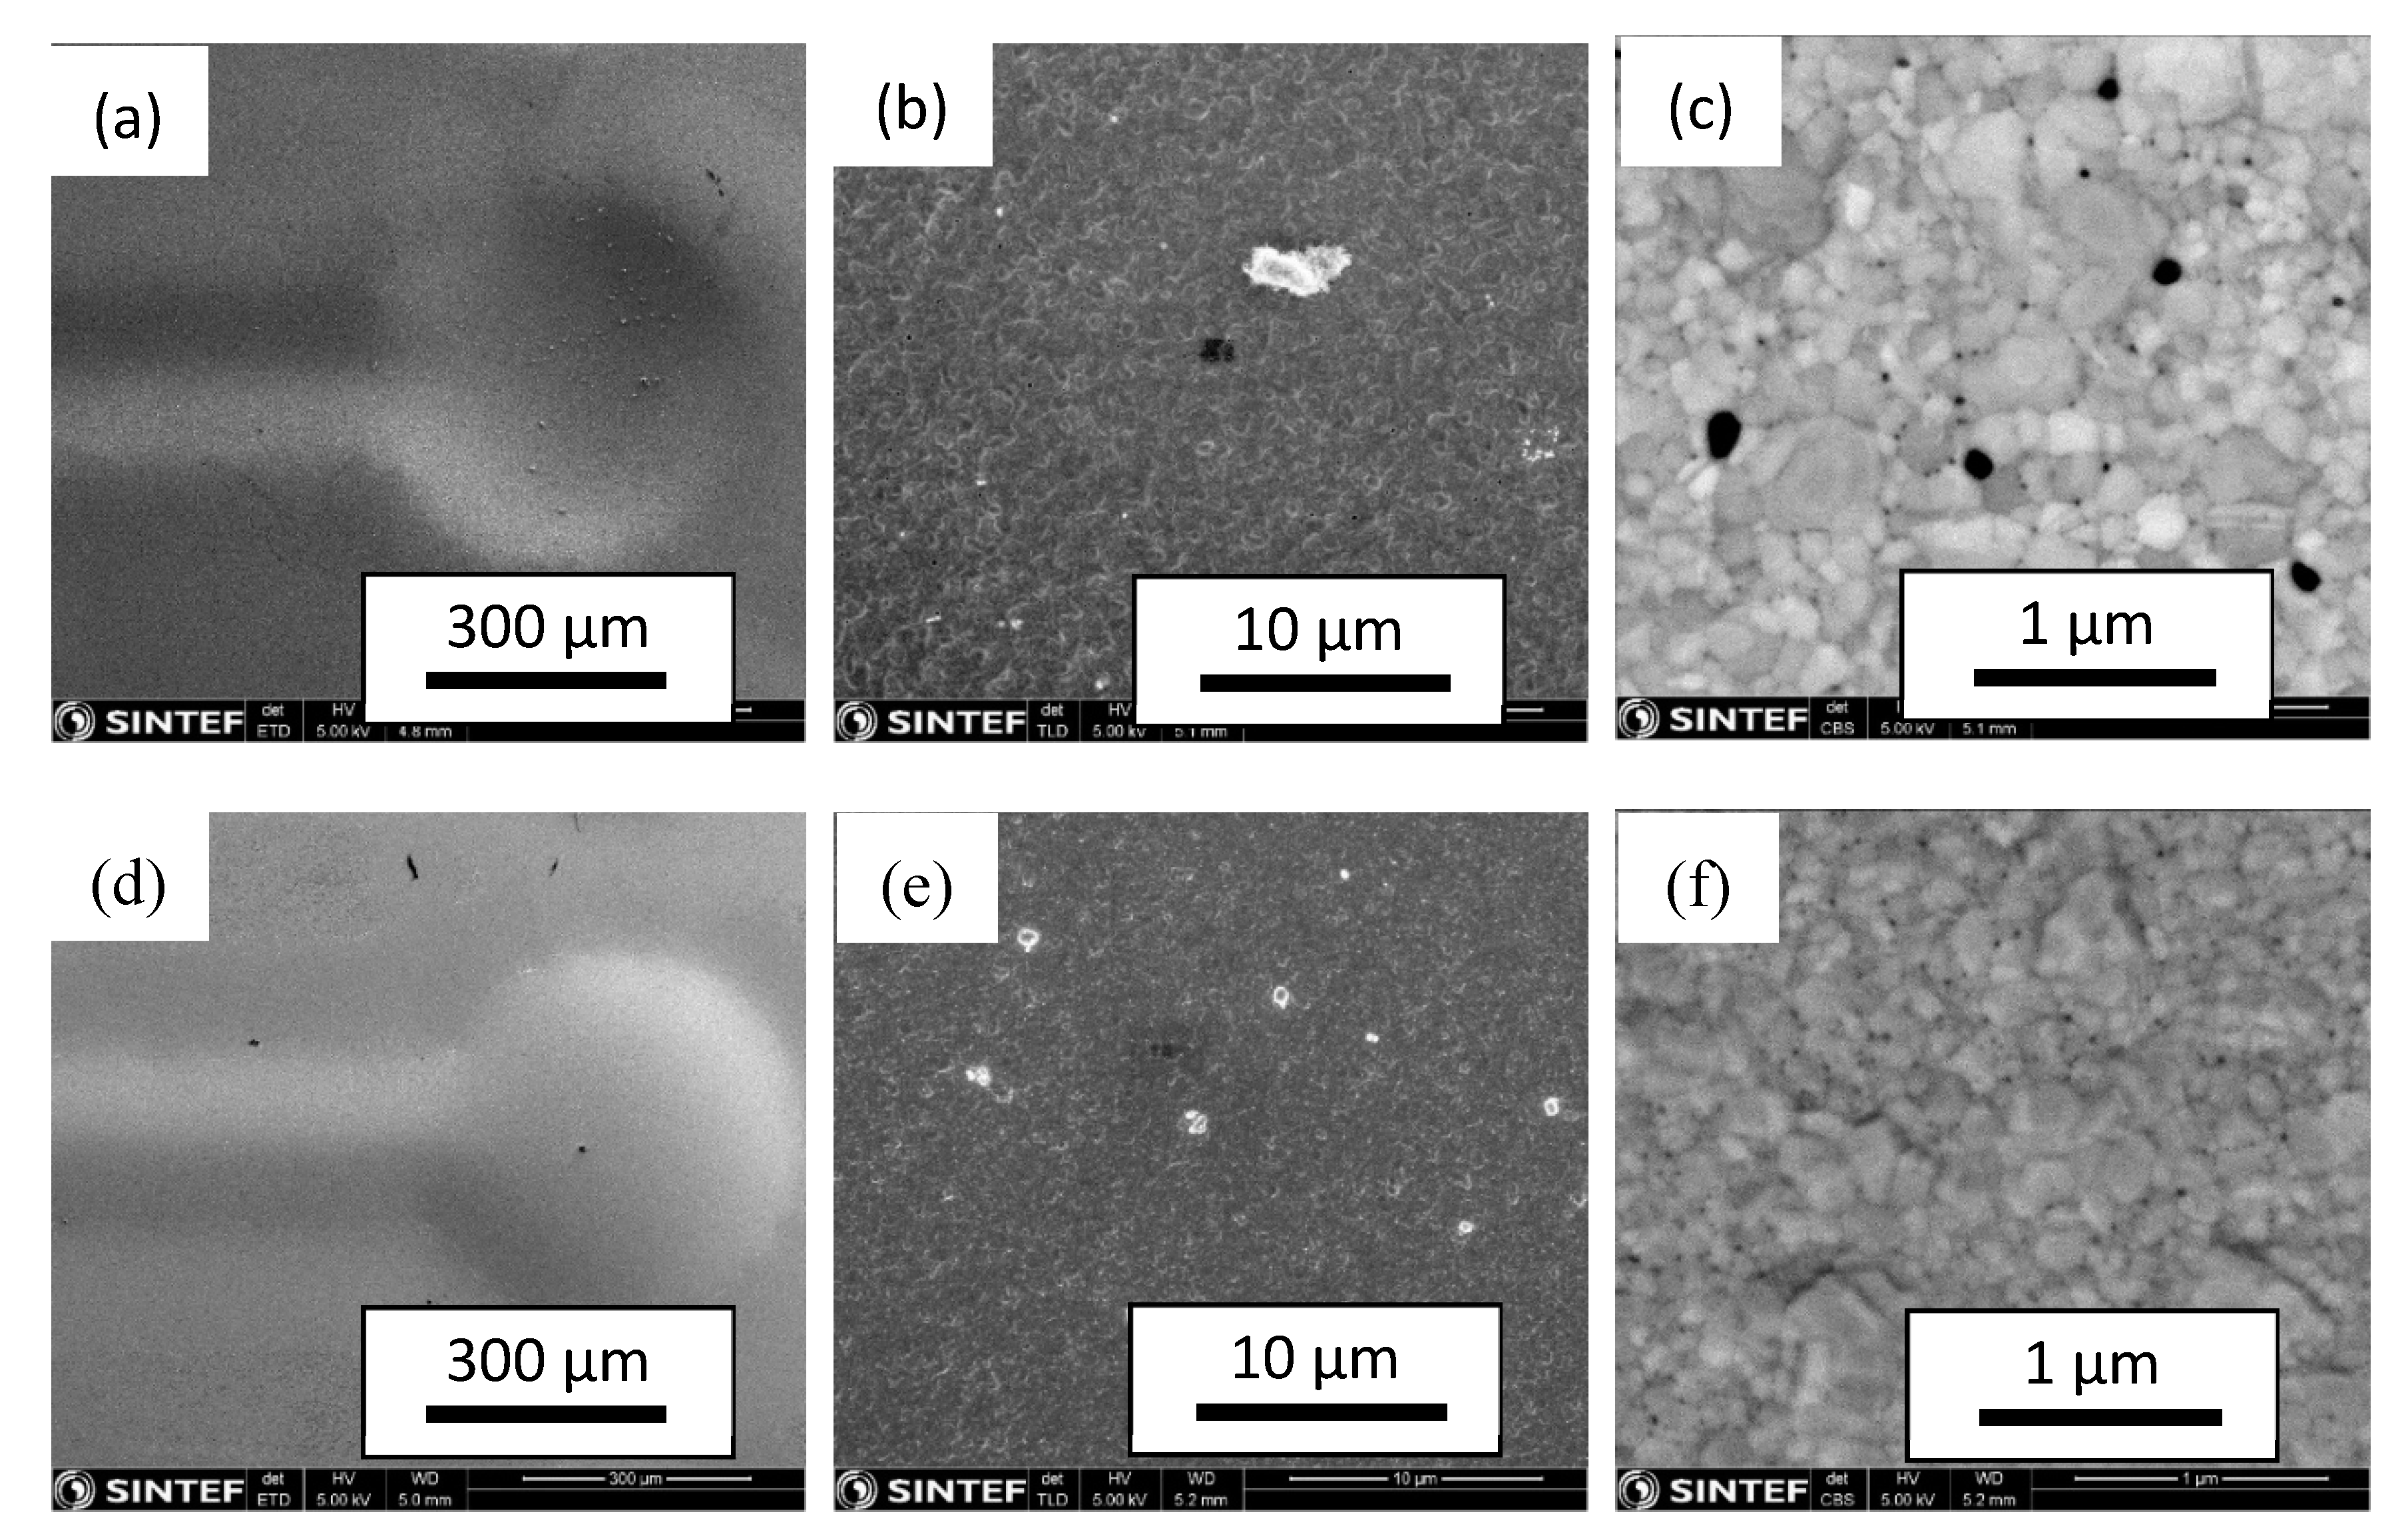
3.5.2. Post-Process Membrane Characterization

SEM micrographs of the feed and permeate surface of the tested membrane (module #1) are shown in Figure 12. Figure 12a,d clearly shows the imprint of microchannels across the Pd77Ag23 film. This is due to plastic deformation of the thin film into the channel support during the higher-pressure operation, as previously reported in [55].
After 1600 h of operation, the feed and permeate sides had a fairly similar grain size, approximately 200–400 nm, which is different from the initial untreated membrane with much smaller grains at the permeate side [46]. Grains with a similar size were observed after long-term operation of a Pd77Ag23 membrane in the absence of any butylene, though over a period of 100 days at up to 20 bar and 450 °C [56]. Thus, the grain growth cannot be clearly linked to the butylene exposure and is most probably simply linked to the high-temperature operation of these types of membranes [57]. An analysis of the two respective sides of the membrane by energy dispersive X-ray spectroscopy (EDS) shows a higher level of carbon on the feed side of the membrane, supporting previous results concluding that the gradual decrease in H2 flux during alkene exposure is due to coke formation on the membrane surface.
Figure 12c,f show as well that pinholes have developed over the long-term testing of the membrane. The development of pinholes is likely to be linked to structural changes resulting from temperature, strain and chemical potential gradients, grain growth and grain boundary deformation in particular. The largest pinholes have a diameter of approximately 50–100 nm, but both Figure 12c,f show a high density of much smaller pinholes that are primarily located at the grain boundaries. Previous work and on-going research show that Pd-based membranes develop cavities along the grain boundaries [58,59,60]. These cavities may represent initial stages of pinhole formation, which lead to unselective leakage and compromise the long-term stability of the membranes. It should also be noted that the current film went through 15 exposures to air at high temperatures to regenerate the performance after hydrocarbon exposure. As shown previously [51,61,62], air-treated membranes can develop structural changes, i.e., void formation and surface roughening, during an oxidation–reduction cycle. For the current membranes, it can thus also be that the pinhole formation is simply related to the multiple heat treatment procedures in air, even though other processes generating defects cannot be ruled out.

4. Conclusions

The hydrogen flux characteristics of a Pd–Ag membrane were evaluated for hydrogen/butane/butylene feed gas mixtures. We report the effect of a wide range of operating conditions, such as temperature (200–450 °C) and H2/butylene (or butane) ratio (0.5–3), on coke formation kinetics. In the presence of butane, the flux-reducing tendency was found to be limited up to the maximum temperature investigated, 450 °C. Compared to butane, the flux-reducing tendency in the presence of butylene was severe. At 400 °C and 20% butylene, the flux decreases by ~85% after 3 h of exposure, but it is shown that the decrease depends on temperature and the H2/butylene ratio. In terms of operating temperature, an optimal temperature was found at 250–300 °C with respect to obtaining the highest absolute hydrogen flux in the presence of butylene. At lower temperatures, the competitive adsorption of butylene over hydrogen accounts for a large initial flux penalty. Whereas the flux decrease that occurred during the exposure at 350 °C was persistent, the flux decrease observed at lower temperatures was recovered at a higher rate. This suggests that more persistent poisoning species form at temperatures > 300 °C, which may include various surface species and subsurface carbon. The experimental sequence was performed applying two membrane modules over a period of 110 days (~2500 h) during which the membranes were operated up to temperature of 450 °C, and pressure up to 4 bars. A tendency of nano-size pore formation was observed by post-process SEM characterization.

Author Contributions

Conceptualization, T.A.P. and M.S.; Methodology, T.P., M.S., and R.B.; Investigation, T.A.P.; Resources, T.A.P.; Writing—Original Draft Preparation, T.A.P. and M.S.; Writing—Review and Editing, T.A.P., M.S. and R.B.; Visualization, T.A.P.; Project Administration, T.A.P.; Funding Acquisition, T.A.P. All authors have read and agreed to the published version of the manuscript.

Funding

This research received funding from the European Union’s Horizon 2020 Research and Innovation Program (H2020) under grant agreement ID: 814671, “Bifunctional Zeolite based Catalysts and Innovative process for Sustainable Hydrocarbon Transformation” (BIZEOLCAT).

Acknowledgments

We acknowledge Martin Fleissner Sunding for the post-process SEM characterization.

Conflicts of Interest

The authors declare no conflict of interest. The funders had no role in the design of the study; in the collection, analyses, or interpretation of data; in the writing of the manuscript, and in the decision to publish the results.

References

  1. James, O.O.; Mandal, S.; Alele, N.; Chowdhury, B.; Maity, S. Lower alkanes dehydrogenation: Strategies and reaction routes to corresponding alkenes. Fuel Process. Technol. 2016, 149, 239–255. [Google Scholar] [CrossRef]
  2. Sattler, J.J.H.B.; Ruiz-Martinez, J.; Santillan-Jimenez, E.; Weckhuysen, B.M. Catalytic Dehydrogenation of Light Alkanes on Metals and Metal Oxides. Chem. Rev. 2014, 114, 10613–10653. [Google Scholar] [CrossRef] [PubMed]
  3. Caspary, K.J.; Gehrke, H.; Heinrita-Adrian, M.; Schwefer, M. Dehydrogenation of Alkanes. In Handbook of Heterogeneous Catalysis; Wiley-VCH Verlag GmbH & Co. KGaA: Weinheim, Germany, 2008. [Google Scholar]
  4. Sheintuch, M. and Simakov, D.S.A. Alkanes Dehydrogenation, in Membrane Reactors for Hydrogen Production Processes; Falco, M.D.D., Marrelli, L., Iaquaniello, G., Eds.; Springer: London, UK, 2011; pp. 183–200. [Google Scholar]
  5. Chang, J.S.; Roh, H.S.; Park, M.S.; Park, S.E. Propane dehydrogenation over a hydrogen permselective membrane reactor. Bull. Korean Chem. Soc. 2002, 23, 674–678. [Google Scholar]
  6. Ricca, A.; Montella, F.; Iaquaniello, G.; Palo, E.; Salladini, A.; Palma, V. Membrane assisted propane dehydrogenation: Experimental investigation and mathematical modelling of catalytic reactions. Catal. Today 2019, 331, 43–52. [Google Scholar] [CrossRef]
  7. Liang, W.; Hughes, R. The catalytic dehydrogenation of isobutane to isobutene in a palladium/silver composite membrane reactor. Catal. Today 2005, 104, 238–243. [Google Scholar] [CrossRef]
  8. Moparthi, A.; Uppaluri, R.; Gill, B. Economic feasibility of silica and palladium composite membranes for industrial dehydrogenation reactions. Chem. Eng. Res. Des. 2010, 88, 1088–1101. [Google Scholar] [CrossRef]
  9. Quicker, P.; Höllein, V.; Dittmeyer, R. Catalytic dehydrogenation of hydrocarbons in palladium composite membrane reactors. Catal. Today 2000, 56, 21–34. [Google Scholar] [CrossRef]
  10. Dittmeyer, R.; Höllein, V.; Daub, K. Membrane reactors for hydrogenation and dehydrogenation processes based on supported palladium. J. Mol. Catal. A Chem. 2001, 173, 135–184. [Google Scholar] [CrossRef]
  11. Zhao, R.; Govind, R.; Itoh, N. Studies on Palladium Membrane Reactor for Dehydrogenation Reaction. Sep. Sci. Technol. 1990, 25, 1473–1488. [Google Scholar] [CrossRef]
  12. Ali, J.K.; Newson, E.; Rippin, D. Exceeding equilibrium conversion with a catalytic membrane reactor for the dehydrogenation of methylcyclohexane. Chem. Eng. Sci. 1994, 49, 2129–2134. [Google Scholar] [CrossRef]
  13. Ali, J.K.; Newson, E.; Rippin, D. Deactivation and regeneration of PdAg membranes for dehydrogenation reactions. J. Membr. Sci. 1994, 89, 171–184. [Google Scholar] [CrossRef]
  14. Itoh, N. Limiting conversions of dehydrogenation in palladium membrane reactors. Catal. Today 1995, 25, 351–356. [Google Scholar] [CrossRef]
  15. Collins, J.P.; Schwartz, R.W.; Sehgal, R.; Ward, T.L.; Brinker, C.J.; Hagen, G.P.; Udovich, C.A. Catalytic Dehydrogenation of Propane in Hydrogen Permselective Membrane Reactors. Ind. Eng. Chem. Res. 1996, 35, 4398–4405. [Google Scholar] [CrossRef]
  16. Sheintuch, M.; Dessau, R.M. Observations, modeling and optimization of yield, selectivity and activity during dehydrogenation of isobutane and propane in a Pd membrane reactor. Chem. Eng. Sci. 1996, 51, 535–547. [Google Scholar] [CrossRef]
  17. Hermann, C.; Quicker, P.; Dittmeyer, R. Mathematical simulation of catalytic dehydrogenation of ethylbenzene to styrene in a composite palladium membrane reactor. J. Membr. Sci. 1997, 136, 161–172. [Google Scholar] [CrossRef]
  18. Yildirim, Y.; Gobina, E.; Hughes, R. An experimental evaluation of high-temperature composite membrane systems for propane dehydrogenation. J. Membr. Sci. 1997, 135, 107–115. [Google Scholar] [CrossRef]
  19. She, Y.; Han, J.; Ma, Y. Palladium membrane reactor for the dehydrogenation of ethylbenzene to styrene. Catal. Today 2001, 67, 43–53. [Google Scholar] [CrossRef]
  20. Keuler, J.N. The dehydrogenation of 2-butanol in a Pd–Ag membrane reactor. J. Membr. Sci. 2002, 202, 17–26. [Google Scholar] [CrossRef]
  21. Farsi, M.; Jahanmiri, A.; Rahimpour, M. Simultaneous isobutane dehydrogenation and hydrogen production in a hydrogen-permselective membrane fixed bed reactor. Theor. Found. Chem. Eng. 2014, 48, 799–805. [Google Scholar] [CrossRef]
  22. Wunsch, A.; Mohr, M.; Pfeifer, P. Intensified LOHC-Dehydrogenation Using Multi-Stage Microstructures and Pd-Based Membranes. Membranes 2018, 8, 112. [Google Scholar] [CrossRef] [Green Version]
  23. Ricca, A.; Palma, V.; Iaquaniello, G.; Palo, E.; Salladini, A.A. Highly selective propylene production in a membrane assisted catalytic propane dehydrogenation. Chem. Eng. J. 2017, 330, 1119–1127. [Google Scholar] [CrossRef]
  24. Palo, E.; Salladini, A.A.; Morico, B.; Palma, V.; Ricca, A.; Iaquaniello, G. Application of Pd-Based Membrane Reactors: An Industrial Perspective. Membranes 2018, 8, 101. [Google Scholar] [CrossRef] [PubMed] [Green Version]
  25. Dittrich, C.J. The role of heat transfer on the feasibility of a packed-bed membrane reactor for propane dehydrogenation. Chem. Eng. J. 2020, 381, 122492. [Google Scholar] [CrossRef]
  26. Paglieri, S.N.; Way, J.D. INNOVATIONS IN PALLADIUM MEMBRANE RESEARCH. Sep. Purif. Methods 2002, 31, 1–169. [Google Scholar] [CrossRef]
  27. Ockwig, N.W.; Nenoff, T.M. Membranes for Hydrogen Separation. Chem. Rev. 2010, 110, 2573–2574. [Google Scholar] [CrossRef]
  28. Peters, T.; Stange, M.; Klette, H.; Bredesen, R. High pressure performance of thin Pd–23%Ag/stainless steel composite membranes in water gas shift gas mixtures; influence of dilution, mass transfer and surface effects on the hydrogen flux. J. Membr. Sci. 2008, 316, 119–127. [Google Scholar] [CrossRef]
  29. Mejdell, A.L.; Jondahl, M.; Peters, T.A.; Bredesen, R.; Venvik, H.J. Effects of CO and CO2 on hydrogen permeation through a ~3 µm Pd/Ag 23 wt% membrane employed in a microchannel membrane configuration. Sep. Purif. Technol. 2009, 68, 178–184. [Google Scholar] [CrossRef]
  30. Chen, C.-H.; Ma, Y.H. The effect of H2S on the performance of Pd and Pd/Au composite membrane. J. Membr. Sci. 2010, 362, 535–544. [Google Scholar] [CrossRef]
  31. Caravella, A.; Scura, F.; Barbieri, G.; Drioli, E. Inhibition by CO and Polarization in Pd-Based Membranes: A Novel Permeation Reduction Coefficient. J. Phys. Chem. B 2010, 114, 12264–12276. [Google Scholar] [CrossRef]
  32. Miguel, C.; Mendes, A.; Tosti, S.; Madeira, L.M. Effect of CO and CO2 on H2 permeation through finger-like Pd–Ag membranes. Int. J. Hydrog. Energy 2012, 37, 12680–12687. [Google Scholar] [CrossRef]
  33. Kurokawa, H.; Yakabe, H.; Yasuda, I.; Peters, T.; Bredesen, R. Inhibition effect of CO on hydrogen permeability of Pd–Ag membrane applied in a microchannel module configuration. Int. J. Hydrog. Energy 2014, 39, 17201–17209. [Google Scholar] [CrossRef]
  34. Kulprathipanja, A.; Alptekin, G.; Falconer, J.; Way, J. Pd and Pd–Cu membranes: Inhibition of H permeation by HS. J. Membr. Sci. 2005, 254, 49–62. [Google Scholar] [CrossRef]
  35. Gao, H.; Lin, Y.; Li, Y.; Zhang, B. Chemical Stability and Its Improvement of Palladium-Based Metallic Membranes. Ind. Eng. Chem. Res. 2004, 43, 6920–6930. [Google Scholar] [CrossRef]
  36. Fernandez, E.E.; Helmi, A.; Coenen, K.K.; Rey, J.M.; Viviente, J.L.; Tanaka, D.A.P.; Annaland, M.M.V.S.; Gallucci, F.F. Development of thin Pd–Ag supported membranes for fluidized bed membrane reactors including WGS related gases. Int. J. Hydrog. Energy 2015, 40, 3506–3519. [Google Scholar] [CrossRef] [Green Version]
  37. De Nooijer, N.; Sanchez, J.D.; Melendez, J.; Fernandez, E.; Tanaka, D.A.P.; Annaland, M.V.S.; Gallucci, F. Influence of H2S on the hydrogen flux of thin-film PdAgAu membranes. Int. J. Hydrog. Energy 2020, 45, 7303–7312. [Google Scholar] [CrossRef]
  38. Montesinos, H.; Julián, I.; Herguido, J.; Menéndez, M. Effect of the presence of light hydrocarbon mixtures on hydrogen permeance through Pd–Ag alloyed membranes. Int. J. Hydrog. Energy 2015, 40, 3462–3471. [Google Scholar] [CrossRef]
  39. Peters, T.; Liron, O.; Tschentscher, R.; Sheintuch, M.; Bredesen, R. Investigation of Pd-based membranes in propane dehydrogenation (PDH) processes. Chem. Eng. J. 2016, 305, 191–200. [Google Scholar] [CrossRef]
  40. Easa, J.; Jin, R.; O’Brien, C.P. Evolution of surface and bulk carbon species derived from propylene and their influence on the interaction of hydrogen with palladium. J. Membr. Sci. 2020, 596, 117738. [Google Scholar] [CrossRef]
  41. Palo, E.; Iaquaniello, G. Method for olefins production. U.S. Patent 9776935B2, 28 March 2012. [Google Scholar]
  42. Boeltken, T.; Belimov, M.; Pfeifer, P.; Peters, T.; Bredesen, R.; Dittmeyer, R. Fabrication and testing of a planar microstructured concept module with integrated palladium membranes. Chem. Eng. Process. Process. Intensif. 2013, 67, 136–147. [Google Scholar] [CrossRef]
  43. Mejdell, A.; Peters, T.; Stange, M.; Venvik, H.; Bredesen, R. Performance and application of thin Pd-alloy hydrogen separation membranes in different configurations. J. Taiwan Inst. Chem. Eng. 2009, 40, 253–259. [Google Scholar] [CrossRef]
  44. Peters, T.; Polfus, J.M.; Van Berkel, F.; Bredesen, R. Interplay between propylene and H2S co-adsorption on the H2 flux characteristics of Pd-alloy membranes employed in propane dehydrogenation (PDH) processes. Chem. Eng. J. 2016, 304, 134–140. [Google Scholar] [CrossRef]
  45. Peters, T.; Stange, M.; Veenstra, P.; Nijmeijer, A.; Bredesen, R. The performance of Pd–Ag alloy membrane films under exposure to trace amounts of H2S. J. Membr. Sci. 2016, 499, 105–115. [Google Scholar] [CrossRef]
  46. Peters, T.; Polfus, J.M.; Stange, M.; Veenstra, P.; Nijmeijer, A.; Bredesen, R. H 2 flux inhibition and stability of Pd-Ag membranes under exposure to trace amounts of NH 3. Fuel Process. Technol. 2016, 152, 259–265. [Google Scholar] [CrossRef]
  47. Tucho, W.M.; Venvik, H.; Stange, M.; Walmsley, J.C.; Holmestad, R.; Bredesen, R. Effects of thermal activation on hydrogen permeation properties of thin, self-supported Pd/Ag membranes. Sep. Purif. Technol. 2009, 68, 403–410. [Google Scholar] [CrossRef]
  48. Mejdell, A.; Klette, H.; Ramachandran, A.; Borg, A.L.; Bredesen, R. Hydrogen permeation of thin, free-standing Pd/Ag23% membranes before and after heat treatment in air. J. Membr. Sci. 2008, 307, 96–104. [Google Scholar] [CrossRef]
  49. Reyerson, L.H.; Cines, M.R. Adsorption of Propane and Propylene by Silica Gel and Metallized Silica Gel. J. Phys. Chem. 1942, 46, 1060–1068. [Google Scholar] [CrossRef]
  50. Abir, H.; Sheintuch, M. Modeling H2 transport through a Pd or Pd/Ag membrane, and its inhibition by co-adsorbates, from first principles. J. Membr. Sci. 2014, 466, 58–69. [Google Scholar] [CrossRef]
  51. Roa, F.; Way, J. The effect of air exposure on palladium–copper composite membranes. Appl. Surf. Sci. 2005, 240, 85–104. [Google Scholar] [CrossRef]
  52. Tsai, C.Y.; Tam, S.Y. Hydrogen selective protective coating, coated article and method. U.S. Patent 13/581,587, 21 March 2011. [Google Scholar]
  53. Yu, J.; Qi, C.; Zhang, J.; Bao, C.; Xu, H. Synthesis of a zeolite membrane as a protective layer on a metallic Pd composite membrane for hydrogen purification. J. Mater. Chem. A 2015, 3, 5000–5006. [Google Scholar] [CrossRef]
  54. Akporiaye, D.; Jensen, S.F.; Olsbye, U.; Rohr, F.; Rytter, E.; Rønnekleiv, A.M.; Spjelkavik, A.I. A Novel, Highly Efficient Catalyst for Propane Dehydrogenation. Ind. Eng. Chem. Res. 2001, 40, 4741–4748. [Google Scholar] [CrossRef]
  55. Peters, T.; Stange, M.; Sunding, M.; Bredesen, R. Stability investigation of micro-configured Pd–Ag membrane modules – Effect of operating temperature and pressure. Int. J. Hydrog. Energy 2015, 40, 3497–3505. [Google Scholar] [CrossRef]
  56. Peters, T.; Tucho, W.M.; Ramachandran, A.; Stange, M.; Walmsley, J.C.; Holmestad, R.; Borg, A.L.; Bredesen, R. Thin Pd–23%Ag/stainless steel composite membranes: Long-term stability, life-time estimation and post-process characterisation. J. Membr. Sci. 2009, 326, 572–581. [Google Scholar] [CrossRef]
  57. Mardilovich, P.P.; She, Y.; Ma, Y.H.; Rei, M.-H. Defect-free palladium membranes on porous stainless-steel support. AIChE J. 1998, 44, 310–322. [Google Scholar] [CrossRef]
  58. Peters, T.; Carvalho, P.; Van Wees, J.; Overbeek, J.; Sagvolden, E.; Van Berkel, F.; Løvvik, O.M.; Bredesen, R. Leakage evolution and atomic-scale changes in Pd-based membranes induced by long-term hydrogen permeation. J. Membr. Sci. 2018, 563, 398–404. [Google Scholar] [CrossRef]
  59. Peters, T.; Carvalho, P.; Stange, M.; Bredesen, R. Formation of hydrogen bubbles in Pd-Ag membranes during H2 permeation. Int. J. Hydrog. Energy 2020, 45, 7488–7496. [Google Scholar] [CrossRef]
  60. Polfus, J.M.; Løwik, O.M.; Bredesen, R.; Peters, T. Hydrogen Induced Vacancy Clustering and Void Formation Mechanisms at Grain Boundaries in Palladium. Acta Mater. 2020. In press. [Google Scholar]
  61. Guazzone, F.; Engwall, E.E.; Ma, Y.H. Effects of surface activity, defects and mass transfer on hydrogen permeance and n-value in composite palladium-porous stainless steel membranes. Catal. Today 2006, 118, 24–31. [Google Scholar] [CrossRef]
  62. Tucho, W.M.; Venvik, H.J.; Walmsley, J.C.; Stange, M.; Ramachandran, A.; Mathiesen, R.H.; Borg, A.; Bredesen, R. and Holmesstad, R. Microstructural studies of self-supported (1.5–10 µm) Pd/23 wt %Ag hydrogen separation membranes subjected to different heat treatments. J. Mater. Sci. 2009, 44, 4429–4442. [Google Scholar] [CrossRef]
Figure 1. Hydrogen flux and permeability as a function of temperature for the Pd77Ag23 alloy membrane. Feed: 80% H2 in N2.
Membranes 10 00291 g001
Figure 2. H2 flux during butane introduction (20%) and overnight exposure to a feed mixture of H2:N2:C4H10 = 20:60:20. Temperature = 400 °C.
Membranes 10 00291 g002
Figure 3. Effect of temperature on the obtained relative H2 flux during butane exposure applying a feed mixture of H2:C4H10:N2 = 20:20:60.
Membranes 10 00291 g003
Figure 4. H2 flux during butylene exposure (20%) to a feed mixture of H2:N2:C4H10 = 20:60:20, and subsequent air treatment to regenerate the membrane performance. Temperature = 400 °C.
Membranes 10 00291 g004
Figure 5. H2 flux during butylene exposure (40%) to a feed mixture of H2:N2:C4H10 = 20:40:40, and subsequent air treatments to regenerate the membrane performance. Temperature = 400 °C.
Membranes 10 00291 g005
Figure 6. Effect of the H2/butylene ratio in the membrane feed on the obtained relative H2 flux after the butylene introduction. Temperature = 400 °C.
Membranes 10 00291 g006
Figure 7. H2 flux during continuous recovery after butylene exposure (20%) to a feed mixture of H2:N2:C4H10 = 20:60:20. Subsequent air treatment to regenerate the membrane performance. Temperature = 350 °C.
Membranes 10 00291 g007
Figure 8. Effect of temperature on the obtained relative H2 flux after butylene introduction. The H2/butylene ratio is equal to 1.
Membranes 10 00291 g008
Figure 9. H2 flux during prolonged exposure to butylene (20%) in a feed containing: H2:N2:C4H10 = 20:60:20. Subsequent air treatment to regenerate the membrane performance. Temperature = 250 °C.
Membranes 10 00291 g009
Figure 10. Effect of temperature on the obtained relative H2 flux during prolonged butylene exposure. H2:N2:C4H10 = 20:60:20.
Membranes 10 00291 g010
Figure 11. Membrane module #1; 1600 h operation up to 450 °C and 4 bars.
Membranes 10 00291 g011
Figure 12. SEM images of the Pd77Ag23 film after testing: (ac) feed (growth side) and (df) permeate (silicon side), at different magnifications.
Membranes 10 00291 g012
Table 1. Hydrogen flux and permeability as a function of operation temperature. A membrane thickness of 10 µm was used to calculate the permeability.
Operation Temperature [°C]H2 Flux [mL·cm−2·min−1]H2 Permeability [mol·m−1·s−1·Pa−0.5]
45095.43.0·10−8
40086.42.7·10−8
35078.42.4·10−8
30071.72.2·10−8
Publisher’s Note: MDPI stays neutral with regard to jurisdictional claims in published maps and institutional affiliations.

