
Alphavirus-Driven Interferon Gamma (IFNg) Expression Inhibits Tumor Growth in Orthotopic 4T1 Breast Cancer Model


 ,
,  and
and 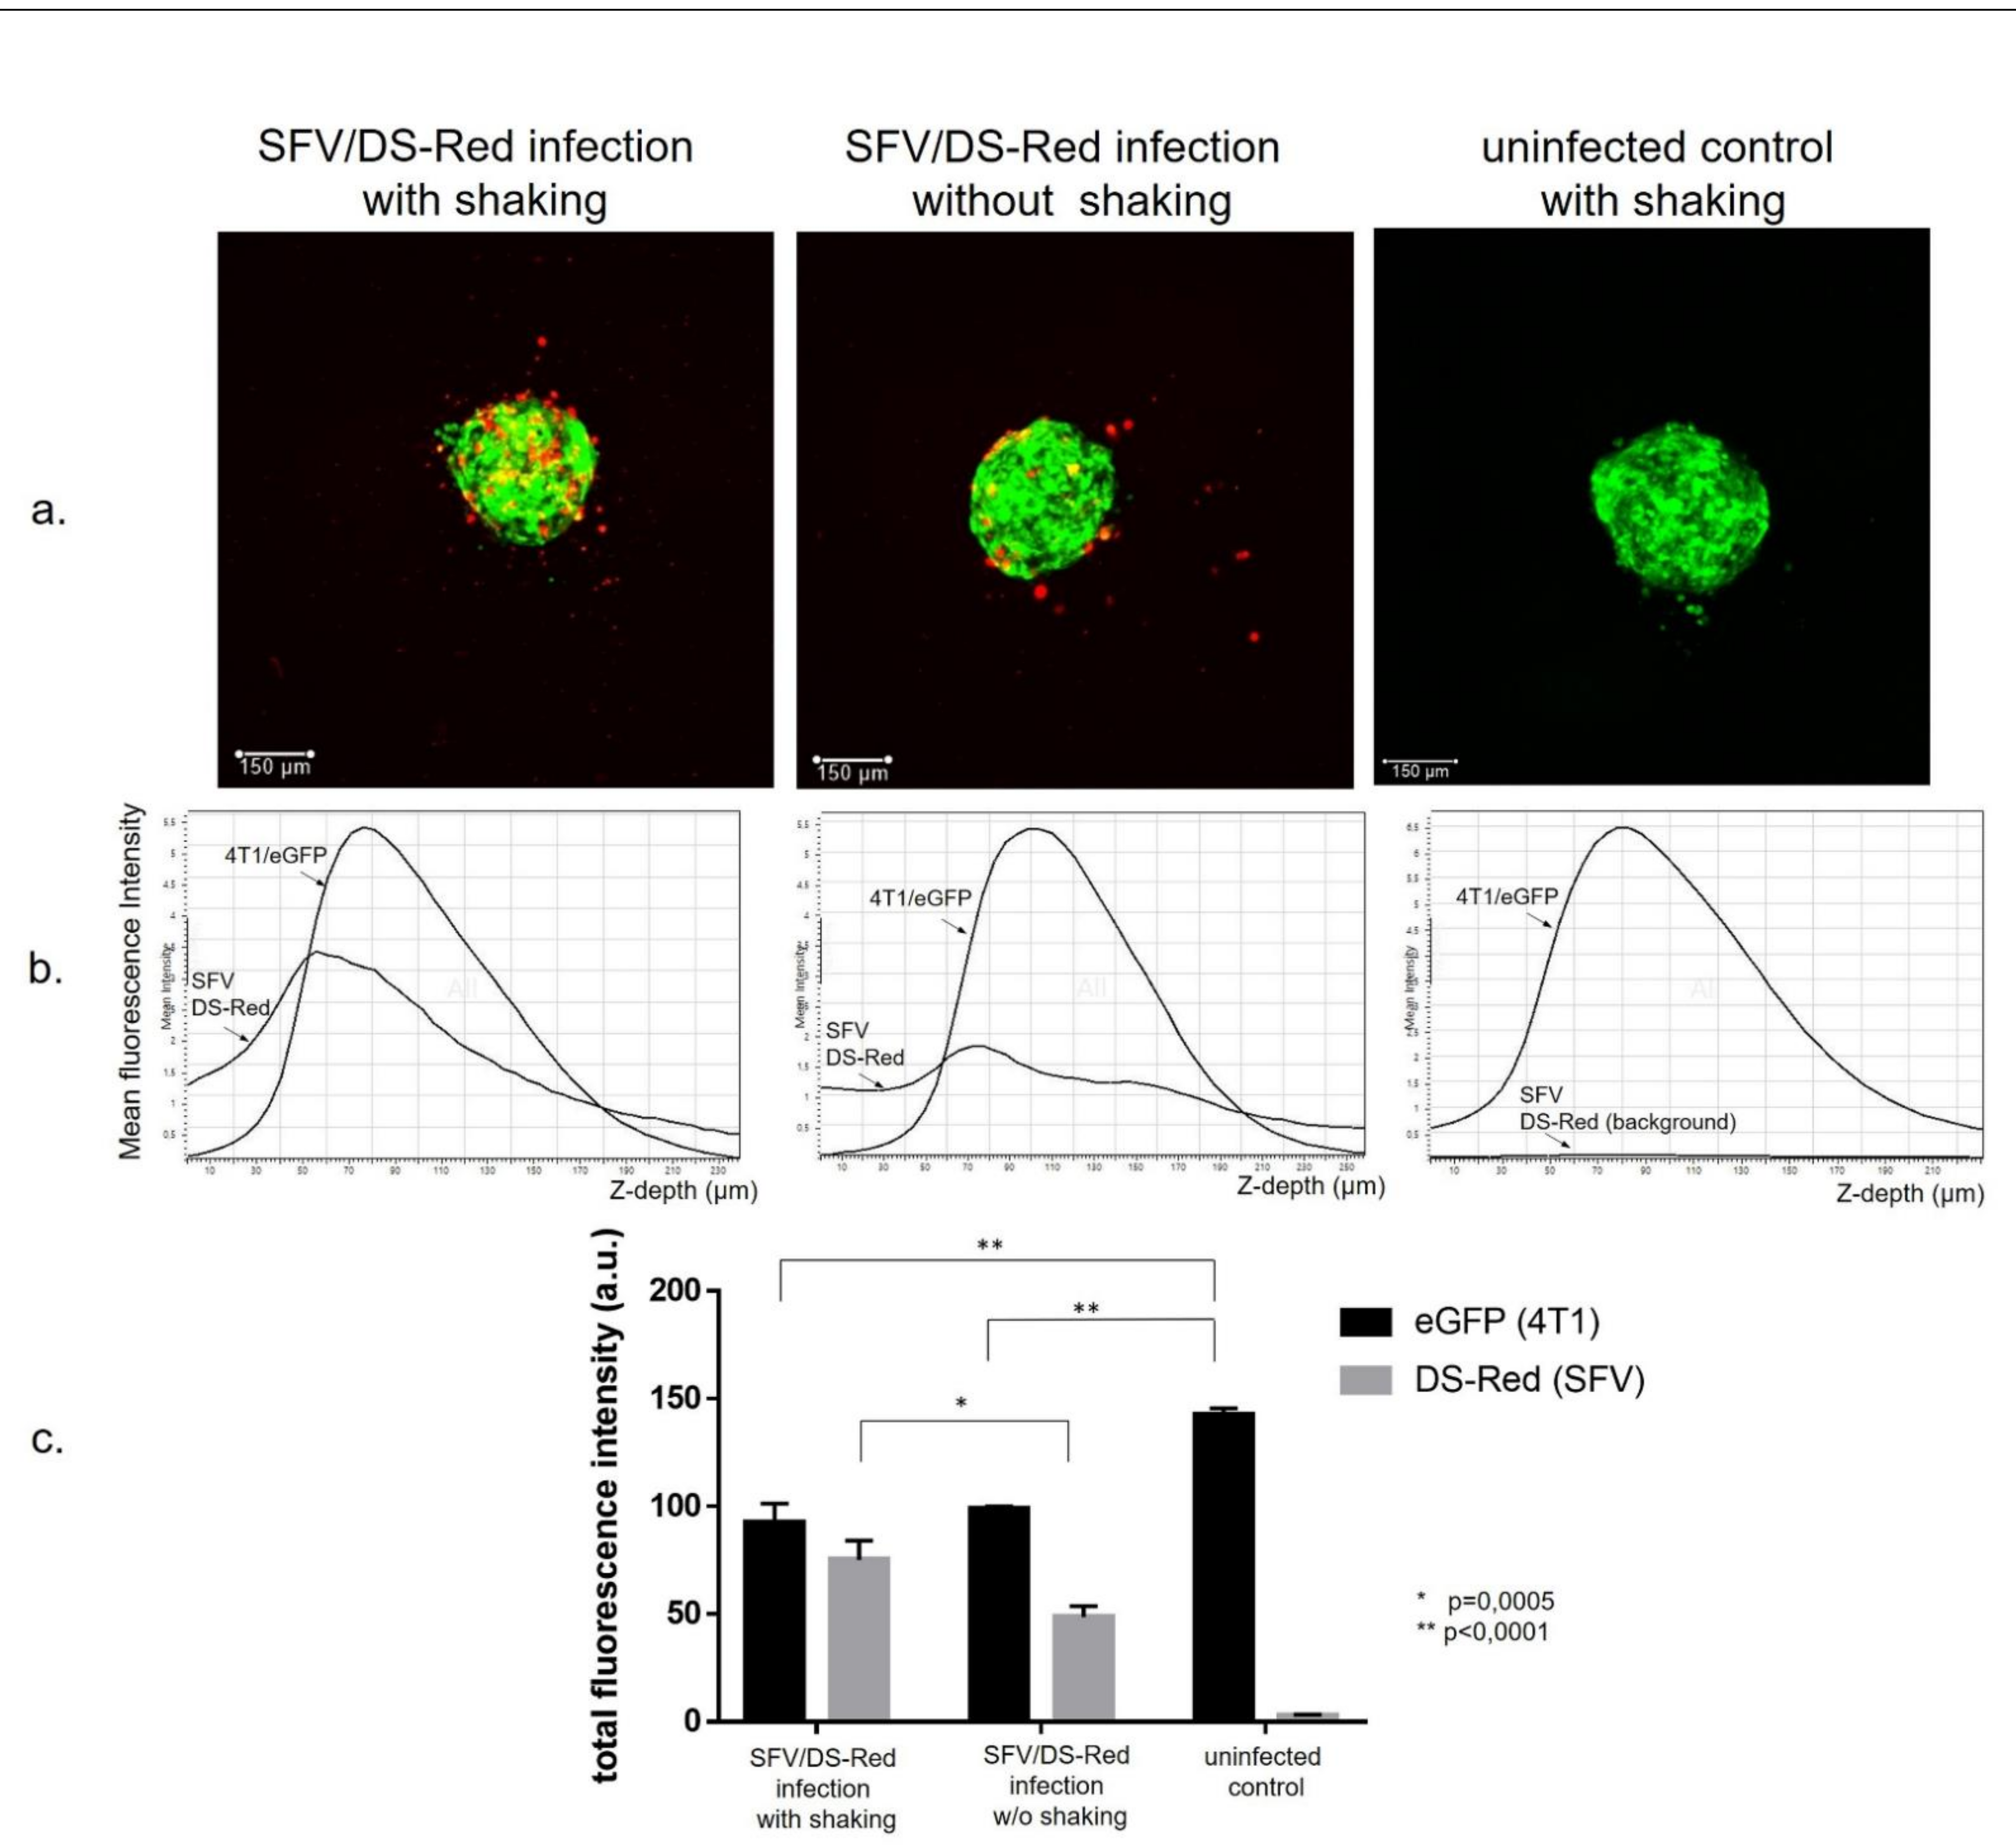
Abstract
1. Introduction
2. Materials and Methods
2.1. Cell Lines
2.2. Formation of 4T1/eGFP Spheroids
2.3. Expression Vectors
2.4. Production of SFV Virus Particles
2.5. Isolation and Culturing of Bone-Marrow-Derived Macrophages (BMDMs)
2.6. BMDM Polarization towards the M1 Phenotype with Virus-Derived IFNg (vdIFNg)
2.7. Analysis of BMDM Polarization by Flow Cytometry
2.8. Nitric Oxide Assay
2.9. Infection of 4T1/eGFP Spheroids with Recombinant SFV Viruses
2.10. Spheroid Confocal Microscopy
2.11. Fluorimetry of 4T1/eGFP Spheroids Infected with SFV Vectors and Cocultured with BMDMs
2.12. Experiments with Animals and In Vivo Imaging
2.13. Coinjection of 4T1(Luc2) Cells with BMDMs
2.14. Treatment of 4T1 Tumors with SFV Vectors
2.15. Flow Cytometry Analysis of Intratumoral Immune Cells
2.16. Flow Cytometry Data Analysis
2.17. Statistical Analysis
3. Results
3.1. Generation of Cancer Cell Spheroids and Their Infection with SFV Vector (SFV/DS-Red)
3.2. SFV-Derived IFNg Activates BMDMs towards an M1-Like Phenotype in 3D Conditions
3.3. SFV/IFNg Infection of the 4T1/eGFP Spheroids Inhibits Spheroid groWth in the Presence and Absence of Macrophages
3.4. Inhibition of Growth of 4T1luc2 Tumor Cells by M1 Macrophages in BALB/c Mice
3.5. Intratumoral Injection of SFV/IFNg Virus Inhibits Orthotopic 4T1 Tumor Growth
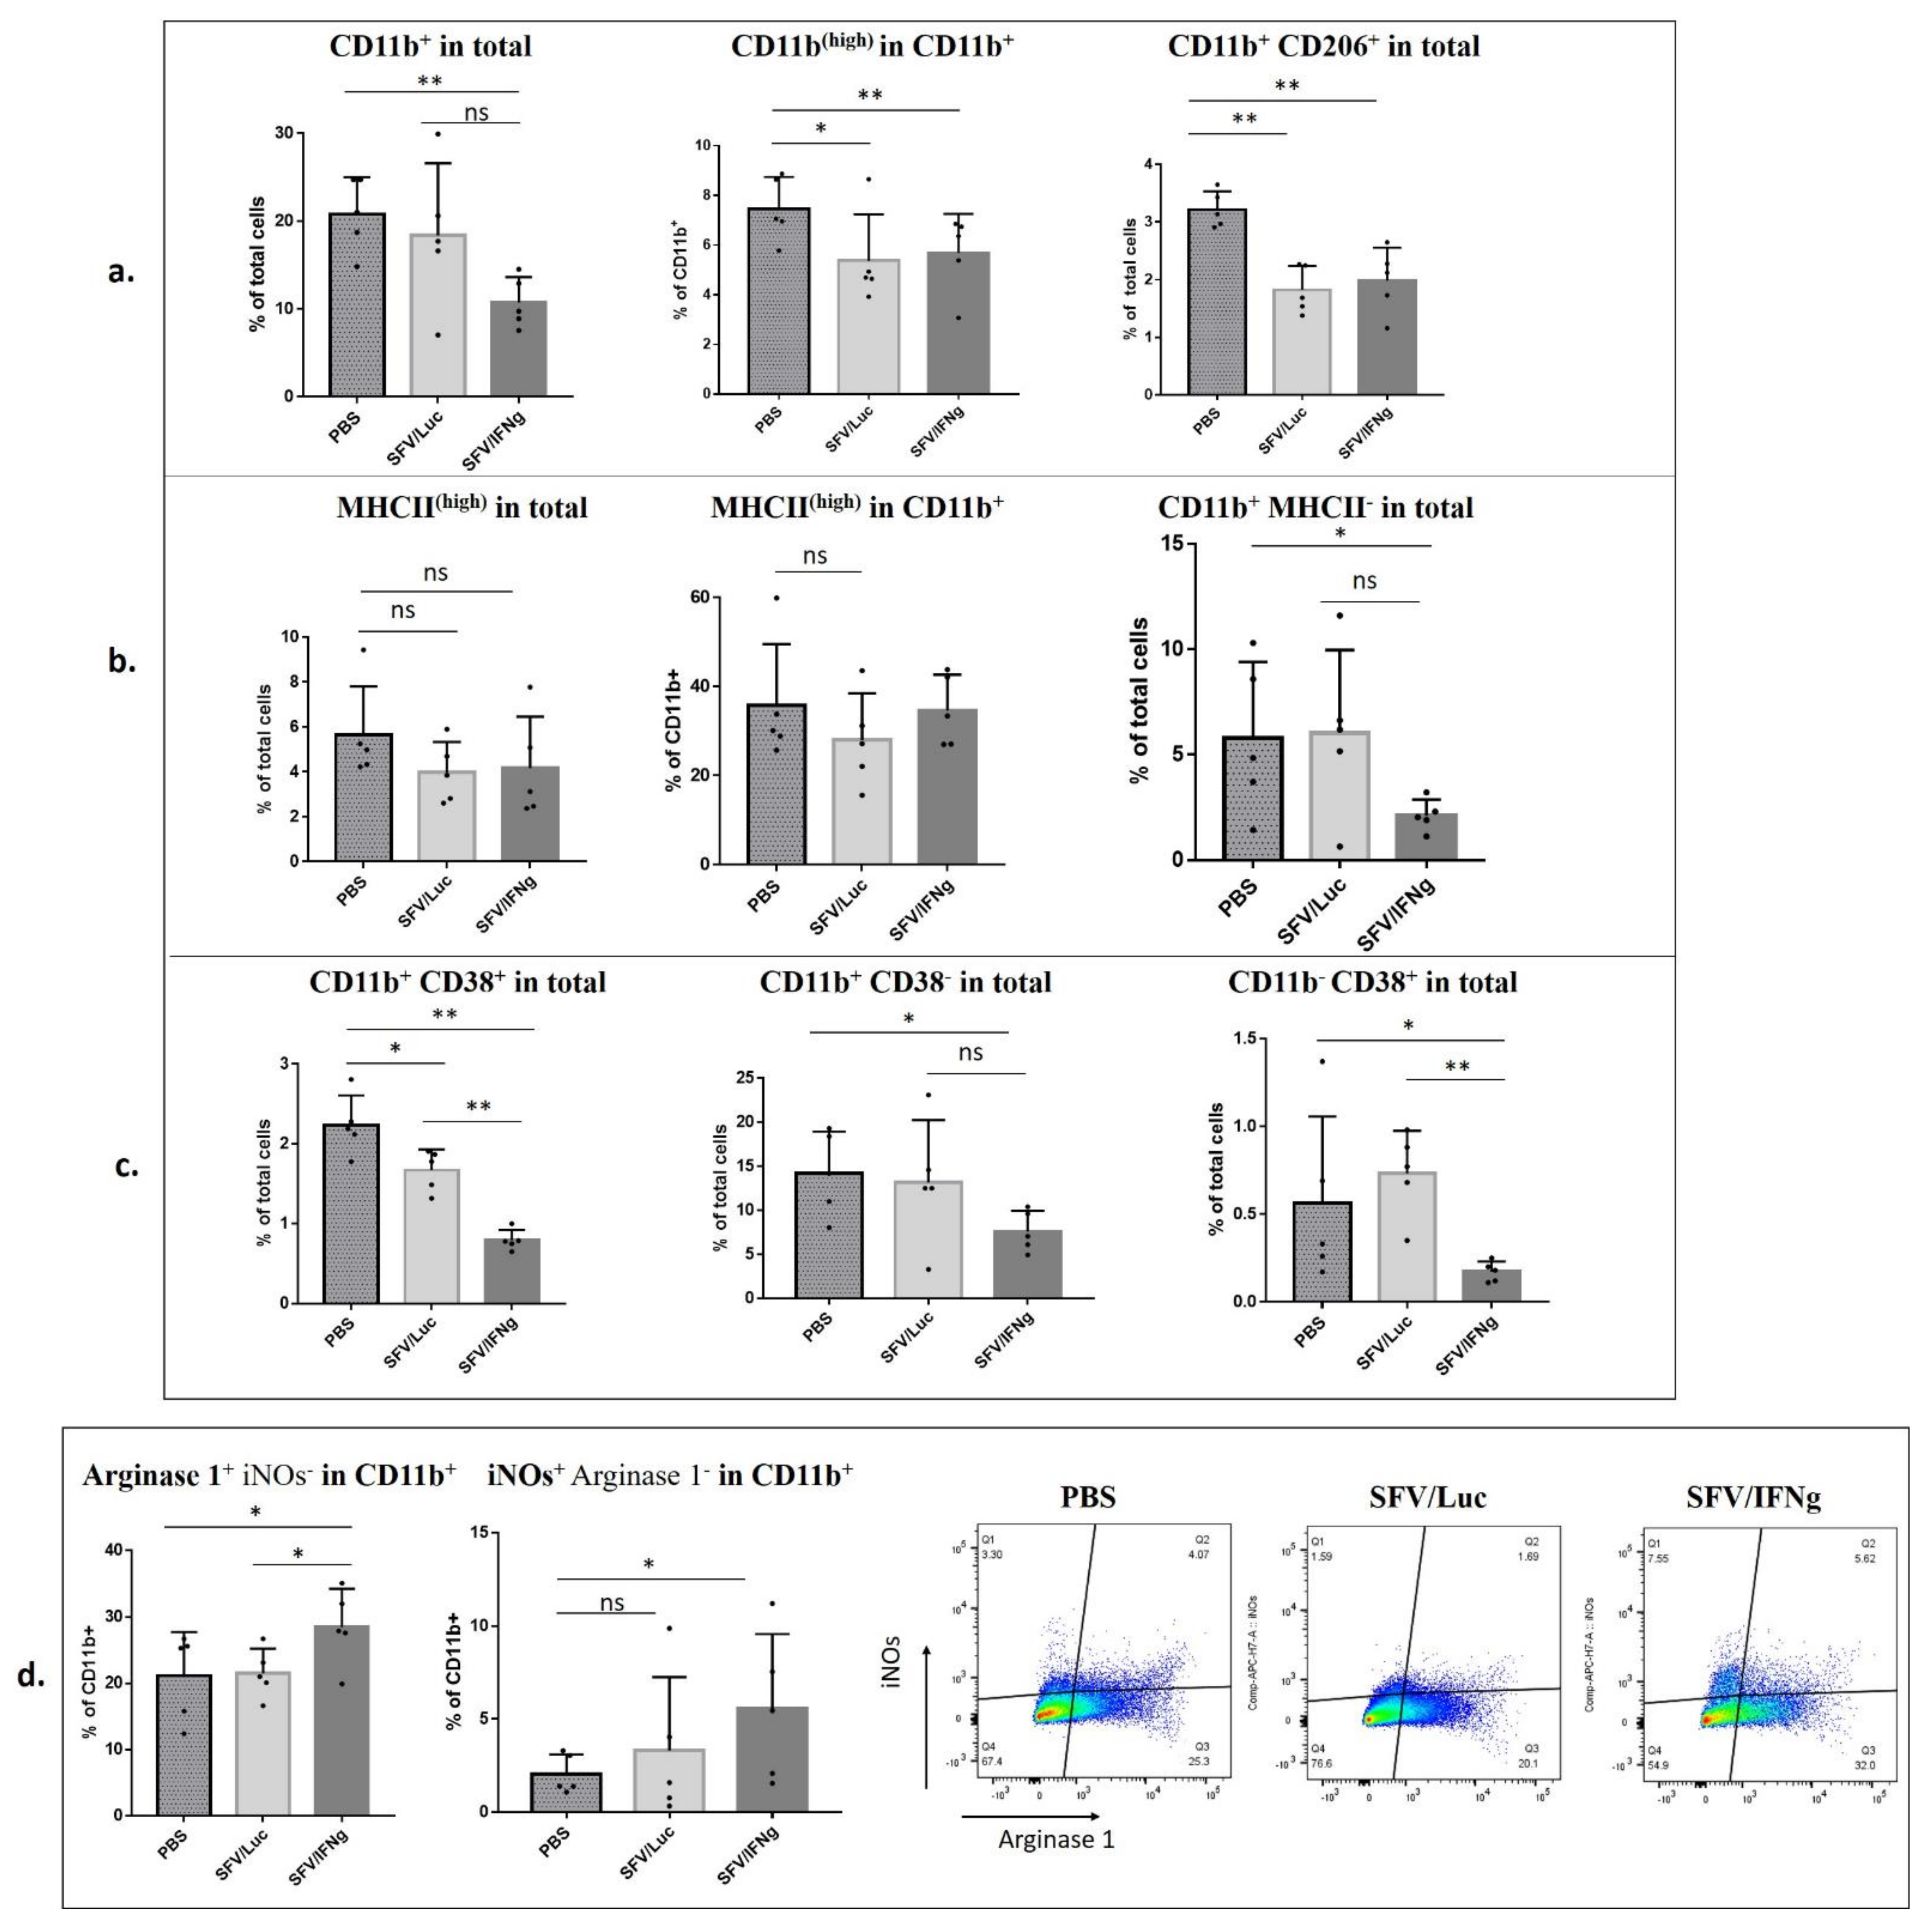
3.6. Analysis of Immune Cell Composition of the Tumors Treated with SFV/IFNg
4. Discussion
5. Conclusions
Supplementary Materials
Author Contributions
Funding
Institutional Review Board Statement
Informed Consent Statement
Data Availability Statement
Acknowledgments
Conflicts of Interest
References
- Berraondo, P.; Sanmamed, M.F.; Ochoa, M.C.; Etxeberria, I.; Aznar, M.A.; Pérez-Gracia, J.L.; Rodríguez-Ruiz, M.E.; Ponz-Sarvise, M.E.; Melero, I. Cytokines in clinical cancer immunotherapy. Br. J. Cancer 2019, 120, 6–15. [Google Scholar] [CrossRef]
- Esquivel-Velázquez, M.; Ostoa-Saloma, P.; Palacios-Arreola, M.I.; Nava-Castro, K.E.; Castro, J.I.; Morales-Montor, J. The role of cytokines in breast cancer development and progression. J. Interferon Cytokine Res. 2015, 35, 1–16. [Google Scholar] [CrossRef]
- Castro, F.; Cardoso, A.P.; Gonçalves, R.M.; Serre, K.; Oliveira, M.J. Interferon-gamma at the crossroads of tumor immune surveillance or evasion. Front. Immunol. 2018, 9, 847. [Google Scholar] [CrossRef] [PubMed]
- Chin, Y.E.; Kitagawa, M.; Su, W.C.; You, Z.H.; Iwamoto, Y.; Fu, X.Y. Cell growth arrest and induction of cyclin-dependent kinase inhibitor p21 WAF1/CIP1 mediated by STAT1. Science 1996, 272, 719–722. [Google Scholar] [CrossRef] [PubMed]
- Kalanjeri, S.; Sterman, D.H. Gene therapy in interventional pulmonology: Interferon gene delivery with focus on thoracic malignancies. Curr. Respir. Care Rep. 2012, 1, 54–66. [Google Scholar] [CrossRef][Green Version]
- Zaidi, M.R. The interferon-gamma paradox in cancer. J. Interferon Cytokine Res. 2019, 39, 30–38. [Google Scholar] [CrossRef] [PubMed]
- Ni, L.; Lu, J. Interferon gamma in cancer immunotherapy. Cancer Med. 2018, 7, 4509–4516. [Google Scholar] [CrossRef] [PubMed]
- Gocher, A.M.; Workman, C.J.; Vignali, D.A.A. Interferon-γ: Teammate or opponent in the tumour microenvironment? Nat. Rev. Immunol. 2021. Available online: https://www.nature.com/articles/s41577-021-00566-3 (accessed on 25 July 2021). [CrossRef]
- Fathallah-Shaykh, H.M.; Zhao, L.J.; Kafrouni, A.I.; Smith, G.M.; Forman, J. Gene transfer of IFN-γ into established brain tumors represses growth by antiangiogenesis. J. Immunol. 2000, 164, 217–222. [Google Scholar] [CrossRef] [PubMed]
- Zhao, P.; Zhu, Y.H.; Wu, J.X.; Liu, R.Y.; Zhu, X.Y.; Xiao, X.; Huang, W. Adenovirus-mediated delivery of human IFNγ gene inhibits prostate cancer growth. Life Sci. 2007, 81, 695–701. [Google Scholar] [CrossRef] [PubMed]
- Kanno, H.; Hattori, S.; Sato, H.; Murata, H.; Huang, F.H.; Hayashi, A.; Kaplitt, M.G. Experimental gene therapy against subcutaneously implanted glioma with a herpes simplex virus-defective vector expressing interferon-γ. Cancer Gene Ther. 1999, 6, 147–155. [Google Scholar] [CrossRef] [PubMed][Green Version]
- Zeytin, H.; Reali, E.; Zaharoff, D.A.; Rogers, C.J.; Schlom, J.; Greiner, J.W. Targeted delivery of murine IFN-γ using a recombinant fowlpox virus: NK cell recruitment to regional lymph nodes and priming of tumor-specific host immunity. J. Interferon Cytokine Res. 2008, 28, 73–87. [Google Scholar] [CrossRef]
- Dreno, B.; Urosevic-Maiwald, M.; Kim, Y.; Guitart, J.; Duvic, M.; Dereure, O.; Khammari, A.; Knol, A.C.; Derbij, A.; Lusky, M.; et al. TG1042 (Adenovirus-interferon-γ) in primary cutaneous B-cell lymphomas: A phase II clinical trial. PLoS ONE 2014, 9, e83670. [Google Scholar] [CrossRef]
- Nemunaitis, J.; Fong, T.; Burrows, F.; Bruce, J.; Peters, G.; Ognoskie, N.; Ando, D. Phase I trial of interferon gamma retroviral vector administered intratumorally with multiple courses in patients with metastatic melanoma. Hum. Gene Ther. 1999, 10, 1289–1298. [Google Scholar] [CrossRef] [PubMed]
- Schoenborn, J.R.; Wilson, C.B. Regulation of interferon-γ during innate and adaptive immune responses. Adv. Immunol. 2007, 96, 41–101. [Google Scholar] [CrossRef] [PubMed]
- Relation, T.; Yi, T.; Guess, A.J.; La Perle, K.; Otsuru, S.; Hasgur, S.; Horwitz, E.M. Intratumoral delivery of interferonγ-secreting mesenchymal stromal cells repolarizes tumor-associated macrophages and suppresses neuroblastoma proliferation in vivo. Stem Cells 2018, 36, 915–924. [Google Scholar] [CrossRef]
- Neophytou, C.M.; Pierides, C.; Christodoulou, M.I.; Costeas, P.; Kyriakou, T.C.; Papageorgis, P. The role of tumor-associated myeloid cells in modulating cancer therapy. Front. Oncol. 2020, 10, 899. [Google Scholar] [CrossRef]
- Jorgovanovic, D.; Song, M.; Wang, L.; Zhang, Y. Roles of IFN-γ in tumor progression and regression: A review. Biomark. Res. 2020, 8, 49. [Google Scholar] [CrossRef] [PubMed]
- Engblom, C.; Pfirschke, C.; Pittet, M.J. The role of myeloid cells in cancer therapies. Nat. Rev. Cancer 2016, 16, 447–462. [Google Scholar] [CrossRef]
- Wu, C.; Hua, Q.; Zheng, L. Generation of Myeloid Cells in Cancer: The Spleen Matters. Front. Immunol. 2020, 11, 1126. [Google Scholar] [CrossRef] [PubMed]
- Ivashkiv, L.B. IFNγ: Signalling, epigenetics and roles in immunity, metabolism, disease and cancer immunotherapy. Nat. Rev. Immunol. 2018, 18, 545–558. [Google Scholar] [CrossRef] [PubMed]
- Mojic, M.; Takeda, K.; Hayakawa, Y. The dark side of IFN-γ: Its role in promoting cancer immunoevasion. Int. J. Mol. Sci. 2018, 19, 89. [Google Scholar] [CrossRef] [PubMed]
- Ding, G.; Shen, T.; Yan, C.; Zhang, M.; Wu, Z.; Cao, L. IFN-γ down-regulates the PD-1 expression and assist nivolumab in PD-1-blockade effect on CD8+ T-lymphocytes in pancreatic cancer. BMC Cancer 2019, 19, 1053. [Google Scholar] [CrossRef] [PubMed]
- Hänze, J.; Wegner, M.; Noessner, E.; Hofmann, R.; Hegele, A. Co-regulation of immune checkpoint PD-L1 with interferon-gamma signaling is associated with a survival benefit in renal cell Cancer. Target Oncol. 2020, 15, 377–390. [Google Scholar] [CrossRef] [PubMed]
- Zibelman, M. Combination of Interferon-Gamma and Nivolumab for Advanced Solid Tumors. Available online: https://clinicaltrials.gov/ct2/show/NCT02614456 (accessed on 25 July 2021).
- Lv, Q.; He, C.; Quan, F.; Yu, S.; Chen, X. DOX/IL-2/IFN-γ co-loaded thermo-sensitive polypeptide hydrogel for efficient melanoma treatment. Bioact. Mater. 2018, 3, 118–128. [Google Scholar] [CrossRef]
- Zhou, Z.H.; Zhao, T.C.; Liang, S.Y.; Zhang, Z.Y.; Zhu, D.W.; Ju, W.T.; Zhong, L.P. A therapeutic approach with combination of interferon-gamma and autophagy inhibitor for oral squamous cell carcinoma. Am. J. Cancer Res. 2021, 11, 1503–1521. [Google Scholar]
- Pyeon, D.; Vu, L.; Giacobbi, N.S.; Westrich, J.A. The antiviral immune forces awaken in the cancer wars. PLoS Pathog. 2020, 16, e1008814. [Google Scholar] [CrossRef]
- Brown, M.C.; Mosaheb, M.M.; Mohme, M.; McKay, Z.P.; Holl, E.K.; Kastan, J.P.; Yang, Y.; Beasley, G.M.; Hwang, E.S.; Ashley, D.M.; et al. Viral infection of cells within the tumor microenvironment mediates antitumor immunotherapy via selective TBK1-IRF3 signaling. Nat. Commun. 2021, 12, 1858. [Google Scholar] [CrossRef]
- Zajakina, A.; Spunde, K.; Lundstrom, K. Application of alphaviral vectors for immunomodulation in cancer therapy. Curr. Pharm. Des. 2017, 23, 4906–4932. [Google Scholar] [CrossRef]
- Singh, A.; Koutsoumpli, G.; Wall, S.; Daemen, T. An alphavirus-based therapeutic cancer vaccine: From design to clinical trial. Cancer Immunol. Immunother. 2019, 68, 849–859. [Google Scholar] [CrossRef]
- Granot, T.; Meruelo, D. The role of natural killer cells in combinatorial anti-cancer therapy using Sindbis viral vectors and irinotecan. Cancer Gene Ther. 2012, 19, 588–591. [Google Scholar] [CrossRef] [PubMed]
- Quetglas, J.I.; Labiano, S.; Aznar, M.A.; Bolanos, E.; Azpilikueta, A.; Rodriguez, I.; Casales, E.; Sánchez-Paulete, A.R.; Segura, V.; Smerdou, V.; et al. Virotherapy with a Semliki Forest virus-ased vector encoding IL12 synergizes with PD-1/PD-L1 blockade. Cancer Immunol. Res. 2015, 3, 449–454. [Google Scholar] [CrossRef] [PubMed]
- Quetglas, J.I.; Dubrot, J.; Bezunartea, J.; Sanmamed, M.F.; Hervas-Stubbs, S.; Smerdou, C.; Melero, I. Immunotherapeutic synergy between anti-CD137 mAb and intratumoral administration of a cytopathic Semliki Forest virus encoding IL-12. Mol. Ther. 2012, 20, 1664–1675. [Google Scholar] [CrossRef]
- Kurena, B.; Müller, E.; Christopoulos, P.F.; Johnsen, I.B.; Stankovic, B.; Øynebråten, I.; Corthay, A.; Zajakina, A. Generation and functional in vitro analysis of semliki forest virus vectors encoding TNF-α and IFN-γ. Front. Immunol. 2017, 8, 1667. [Google Scholar] [CrossRef] [PubMed]
- Schreiber, R.D.; Pace, J.L.; Russell, S.W.; Altman, A.; Katz, D.H. Macrophage-activating factor produced by a T cell hybridoma: Physiochemical and biosynthetic resemblance to gamma-interferon. J. Immunol. 1983, 131, 826–832. [Google Scholar]
- Alexander, P.; Evans, R. Endotoxin and double stranded RNA render macrophages cytotoxic. Nat. New Biol. 1971, 232, 76–78. [Google Scholar] [CrossRef]
- Müller, E.; Christopoulos, P.F.; Halder, S.; Lunde, A.; Beraki, K.; Speth, M.; Øynebråten, I.; Corthay, A. Toll-like receptor ligands and interferon-γ synergize for induction of antitumor M1 macrophages. Front. Immunol. 2017, 8, 1383. [Google Scholar] [CrossRef]
- Vasilevska, J.; Skrastina, D.; Spunde, K.; Garoff, H.; Kozlovska, T.; Zajakina, A. Semliki Forest virus biodistribution in tumor-free and 4T1 mammary tumor-bearing mice: A comparison of transgene delivery by recombinant virus particles and naked RNA replicon. Cancer Gene Ther. 2012, 19, 579–587. [Google Scholar] [CrossRef]
- Liljeström, P.; Garoff, H. A new generation of animal cell expression vectors based on the Semliki Forest virus replicon. Biotechnol. J. 1991, 9, 1356–1361. [Google Scholar] [CrossRef]
- Kurena, B.; Vežāne, A.; Skrastiņa, D.; Trofimova, O.; Zajakina, A. Magnetic nanoparticles for efficient cell transduction with Semliki Forest virus. J. Virol. Methods 2017, 245, 28–34. [Google Scholar] [CrossRef]
- Hutornojs, V.; Niedre-Otomere, B.; Kozlovska, T.; Zajakina, A. Comparison of ultracentrifugation methods for concentration of recombinant alphaviruses: Sucrose and iodixanol cushions. Environ. Exp. Biol. 2012, 10, 117–123. [Google Scholar]
- Weischenfeldt, J.; Porse, B. Bone marrow-derived macrophages (BMM): Isolation and applications. Cold Spring Harb. Protoc. 2008, 12, pdb–prot5080. [Google Scholar] [CrossRef]
- Davies, J.Q.; Gordon, S. Isolation and culture of murine macrophages. Methods Mol. Biol. 2005, 290, 91–103. [Google Scholar] [CrossRef]
- Baklaushev, V.P.; Kilpeläinen, A.; Petkov, S.; Abakumov, M.A.; Grinenko, N.F.; Yusubalieva, G.M.; Latanova, A.A.; Gubskiy, I.L.; Zabozlaev, F.G.; Starodubova, E.S.; et al. Luciferase Expression Allows Bioluminescence Imaging But Imposes Limitations on the Orthotopic Mouse (4T1) Model of Breast Cancer. Sci. Rep. 2017, 7, 7715. [Google Scholar] [CrossRef] [PubMed]
- Bayurova, E.; Jansons, J.; Skrastina, D.; Smirnova, O.; Mezale, D.; Kostyusheva, A.; Kostyushev, D.; Petkov, S.; Podschwadt, P.; Valuev-Elliston, V.; et al. HIV-1 Reverse Transcriptase Promotes Tumor Growth and Metastasis Formation via ROS-Dependent Upregulation of Twist. Oxid. Med. Cell. Longev. 2019, 2019, 6016278. [Google Scholar] [CrossRef]
- DuPre, S.A.; Redelman, D.; Hunter, K.W., Jr. Microenvironment of the murine mammary carcinoma 4T1: Endogenous IFN-gamma affects tumor phenotype, growth, and metastasis. Exp. Mol. Pathol. 2008, 85, 174–188. [Google Scholar] [CrossRef] [PubMed]
- Takahashi, K.; Nagai, N.; Ogura, K.; Tsuneyama, K.; Saiki, I.; Irimura, T.; Hayakawa, Y. Mammary tissue microenvironment determines T cell-dependent breast cancer-associated inflammation. Cancer Sci. 2015, 106, 867–874. [Google Scholar] [CrossRef] [PubMed]
- Grasselly, C.; Denis, M.; Bourguignon, A.; Talhi, N.; Mathe, D.; Tourette, A.; Serre, L.; Jordheim, L.P.; Matera, E.L.; Dumontet, C. The Antitumor Activity of Combinations of Cytotoxic Chemotherapy and Immune Checkpoint Inhibitors Is Model-Dependent. Front. Immunol. 2018, 9, 2100. [Google Scholar] [CrossRef] [PubMed]
- Gordon, S. Alternative activation of macrophages. Nat. Rev. Immunol. 2003, 3, 23–35. [Google Scholar] [CrossRef] [PubMed]
- Mantovani, A.; Allavena, P. The interaction of anticancer therapies with tumor-associated macrophages. Rev. J. Exp. Med. 2015, 212, 435–445. [Google Scholar] [CrossRef]
- El Kasmi, K.C.; Qualls, J.E.; Pesce, J.T.; Smith, A.M.; Thompson, R.W.; Henao-Tamayo, M.; Basaraba, R.J.; König, T.; Schleicher, U.; Koo, M.S.; et al. Toll-like receptor–induced arginase 1 in macrophages thwarts effective immunity against intracellular pathogens. Nat. Immunol. 2008, 9, 1399–1406. [Google Scholar] [CrossRef]
- Oldford, S.A.; Haidl, I.D.; Howatt, M.A.; Leiva, C.A.; Johnston, B.; Marshall, J.S. A critical role for mast cells and mast cell-derived IL-6 in TLR2-mediated inhibition of tumor growth. J. Immunol. 2010, 185, 7067–7076. [Google Scholar] [CrossRef] [PubMed]
- Hu, H.G.; Wu, J.J.; Zhang, B.D.; Li, W.H.; Li, Y.M. Pam3CSK4-CDGSF Augments Antitumor Immunotherapy by Synergistically Activating TLR1/2 and STING. Bioconjug. Chem. 2020, 31, 2499–2503. [Google Scholar] [CrossRef]
- Gorczyca, W. Atlas of Differential Diagnosis in Neoplastic Hematopathology; CRC Press: Boca Raton, FL, USA, 2014; 919p. [Google Scholar]
- Amici, S.A.; Young, N.A.; Narvaez-Miranda, J.; Jablonski, K.A.; Arcos, J.; Rosas, L.; Papenfuss, T.L.; Torrelles, J.B.; Jarjour, W.N.; Guerau-de-Arellano, M. CD38 is robustly induced in human macrophages and monocytes in inflammatory conditions. Front. Immunol. 2018, 9, 1593. [Google Scholar] [CrossRef] [PubMed]
- Jablonski, K.A.; Amici, S.A.; Webb, L.M.; Ruiz-Rosado, J.D.D.; Popovich, P.G.; Partida-Sanchez, S.; Guerau-de-Arellano, M. Novel markers to delineate murine M1 and M2 macrophages. PLoS ONE 2015, 10, e0145342. [Google Scholar] [CrossRef] [PubMed]
- Chen, L.; Diao, L.; Yang, Y.; Yi, X.; Rodriguez, B.L.; Li, Y.; Villalobos, P.A.; Cascone, T.; Liu, X.; Tan, L.; et al. CD38-mediated immunosuppression as a mechanism of tumor cell escape from PD-1/PD-L1 blockade. Cancer Discov. 2018, 8, 1156–1175. [Google Scholar] [CrossRef] [PubMed]
- Levy, A.; Blacher, E.; Vaknine, H.; Lund, F.E.; Stein, R.; Mayo, L. CD38 deficiency in the tumor microenvironment attenuates glioma progression and modulates features of tumor-associated microglia/macrophages. Neuro Oncol. 2012, 14, 1037–1049. [Google Scholar] [CrossRef] [PubMed]
- Karakasheva, T.A.; Waldron, T.J.; Eruslanov, E.; Kim, S.B.; Lee, J.S.; O’Brien, S.; Hicks, P.D.; Basu, D.; Singhal, S.; Malavasi, F.; et al. CD38-expressing myeloid-derived suppressor cells promote tumor growth in a murine model of esophageal cancer. Cancer Res. 2015, 75, 4074–4085. [Google Scholar] [CrossRef]
- Patton, D.T.; Wilson, M.D.; Rowan, W.C.; Soond, D.R.; Okkenhaug, K. The PI3K p110δ regulates expression of CD38 on regulatory T cells. PLoS ONE 2011, 6, e17359. [Google Scholar] [CrossRef]
- Upreti, M.; Jamshidi-Parsian, A.; Koonce, N.A.; Webber, J.S.; Sharma, S.K.; Asea, A.A.; Griffin, R.J. Tumor-endothelial cell three-dimensional spheroids: New aspects to enhance radiation and drug therapeutics. Transl. Oncol. 2011, 4, 365–376. [Google Scholar] [CrossRef] [PubMed]
- Melissaridou, S.; Wiechec, E.; Magan, M.; Jain, M.V.; Chung, M.K.; Farnebo, L.; Roberg, K. The effect of 2D and 3D cell cultures on treatment response, EMT profile and stem cell features in head and neck cancer. Cancer Cell Int. 2019, 19, 16. [Google Scholar] [CrossRef] [PubMed]
- Chaicharoenaudomrung, N.; Kunhorm, P.; Noisa, P. Three-dimensional cell culture systems as an in vitro platform for cancer and stem cell modeling. World J. Stem Cells 2019, 11, 1065. [Google Scholar] [CrossRef] [PubMed]
- Gheytanchi, E.; Naseri, M.; Karimi-Busheri, F.; Atyabi, F.; Mirsharif, E.S.; Bozorgmehr, M.; Madjd, Z. Morphological and molecular characteristics of spheroid formation in HT-29 and Caco-2 colorectal cancer cell lines. Cancer Cell Int. 2021, 21, 204. [Google Scholar] [CrossRef]
- Kenny, P.A.; Lee, G.Y.; Myers, C.A.; Neve, R.M.; Semeiks, J.R.; Spellman, P.T.; Lorenz, K.; Lee, E.H.; Barcellos-Hoff, M.H.; Petersen, O.W.; et al. The morphologies of breast cancer cell lines in three-dimensional assays correlate with their profiles of gene expression. Mol. Oncol. 2007, 1, 84–96. [Google Scholar] [CrossRef] [PubMed]
- Li, L.; Lu, Y. Optimizing a 3D culture system to study the interaction between epithelial breast cancer and its surrounding fibroblasts. J. Cancer 2011, 2, 458–466. [Google Scholar] [CrossRef] [PubMed]
- Rama-Esendagli, D.; Esendagli, G.; Yilmaz, G.; Guc, D. Spheroid formation and invasion capacity are differentially influenced by co-cultures of fibroblast and macrophage cells in breast cancer. Mol. Biol. Rep. 2014, 41, 2885–2892. [Google Scholar] [CrossRef] [PubMed]
- Białkowska, K.; Komorowski, P.; Bryszewska, M.; Miłowska, K. Spheroids as a type of three-dimensional cell cultures-examples of methods of preparation and the most important application. Int. J. Mol. Sci. 2020, 21, 6225. [Google Scholar] [CrossRef]
- Kloker, L.D.; Yurttas, C.; Lauer, U.M. Three-dimensional tumor cell cultures employed in virotherapy research. Oncolytic Virother. 2018, 7, 79–93. [Google Scholar] [CrossRef]
- Berg, D.R.; Offord, C.P.; Kemler, I.; Ennis, M.K.; Chang, L.; Paulik, G.; Bajzer, Z.; Neuhauser, C.; Dingli, D. In vitro and in silico multidimensional modeling of oncolytic tumor virotherapy dynamics. PLoS Comput. Biol. 2019, 15, e1006773. [Google Scholar] [CrossRef] [PubMed]
- Detjen, K.M.; Farwig, K.; Welzel, M.; Wiedenmann, B.; Rosewicz, S. Interferon gamma inhibits growth of human pancreatic carcinoma cells via caspase-1 dependent induction of apoptosis. Gut 2001, 49, 251–262. [Google Scholar] [CrossRef]
- Chawla-Sarkar, M.; Lindner, D.J.; Liu, Y.F.; Williams, B.R.; Sen, G.C.; Silverman, R.H.; Borden, E.C. Apoptosis and interferons: Role of interferon-stimulated genes as mediators of apoptosis. Apoptosis 2003, 8, 237–249. [Google Scholar] [CrossRef]
- Frolov, I.; Akhrymuk, M.; Akhrymuk, I.; Atasheva, S.; Frolova, E.I. Early events in alphavirus replication determine the outcome of infection. J. Virol. 2012, 86, 5055–5066. [Google Scholar] [CrossRef] [PubMed]
- Ryman, K.D.; Klimstra, W.B. Host responses to alphavirus infection. Immunol. Rev. 2008, 225, 27–45. [Google Scholar] [CrossRef] [PubMed]
- Xu, Q.; Tang, Y.; Huang, G. Innate immune responses in RNA viral infection. Front. Med. 2020, 15, 333–346. [Google Scholar] [CrossRef]
- Denton, N.L.; Chen, C.-Y.; Scott, T.R.; Cripe, T.P. Tumor-Associated Macrophages in Oncolytic Virotherapy: Friend or Foe? Biomedicines 2016, 4, 13. [Google Scholar] [CrossRef] [PubMed]
- Delprat, V.; Tellier, C.; Demazy, C.; Raes, M.; Feron, O.; Michiels, C. Cycling hypoxia promotes a pro-inflammatory phenotype in macrophages via JNK/p65 signaling pathway. Sci. Rep. 2020, 10, 882. [Google Scholar] [CrossRef]
- Cho, H.J.; Jung, J.I.; Kwon, G.T.; Her, S.; Park, J.H.; Park, J.H.Y. Bone marrow-derived, alternatively activated macrophages enhance solid tumor growth and lung metastasis of mammary carcinoma cells in a Balb/C mouse orthotopic model. Breast Cancer Res. 2012, 14, R81. [Google Scholar] [CrossRef]
- Kuwada, K.; Kagawa, S.; Yoshida, R.; Sakamoto, S.; Ito, A.; Watanabe, M.; Ieda, T.; Kuroda, S.; Kikuchi, S.; Tazawa, H.; et al. The epithelial-to-mesenchymal transition induced by tumor-associated macrophages confers chemoresistance in peritoneally disseminated pancreatic cancer. J. Exp. Clin. Cancer Res. 2018, 37, 307. [Google Scholar] [CrossRef]
- Yuan, A.; Hsiao, Y.J.; Chen, H.Y.; Chen, H.W.; Ho, C.C.; Chen, Y.Y.; Liu, Y.C.; Hong, T.H.; Yu, S.L.; Chen, J.J.W.; et al. Opposite effects of M1 and M2 macrophage subtypes on lung cancer progression. Sci. Rep. 2015, 5, 14273. [Google Scholar] [CrossRef]
- Wang, F.; Zhang, S.; Jeon, R.; Vuckovic, I.; Jiang, X.; Lerman, A.; Folmesb, C.D.; Dzejaa, P.D.; Herrmann, J. Interferon gamma induces reversible metabolic reprogramming of M1 macrophages to sustain cell viability and pro-inflammatory activity. EBioMedicine 2018, 30, 303–316. [Google Scholar] [CrossRef]
- Liu, S.X.; Gustafson, H.H.; Jackson, D.L.; Pun, S.H.; Trapnell, C. Trajectory analysis quantifies transcriptional plasticity during macrophage polarization. Sci. Rep. 2020, 10, 12273. [Google Scholar] [CrossRef]
- Sriskandan, K.; Garner, P.; Watkinson, J.; Pettingale, K.W.; Brinkley, D.; Calman, F.M.B.; Tee, D.E. A toxicity study of recombinant interferon-gamma given by intravenous infusion to patients with advanced cancer. Cancer Chemother. Pharmacol. 1986, 18, 63–68. [Google Scholar] [CrossRef]
- Zhang, Y.; Zhang, G.L.; Sun, X.; Cao, K.X.; Ma, C.; Nan, N.; Yang, G.W.; Yu, M.W.; Wang, X.M. Establishment of a murine breast tumor model by subcutaneous or orthotopic implantation. Oncol. Lett. 2018, 15, 6233–6240. [Google Scholar] [CrossRef] [PubMed]
- Liu, C.; Han, C.; Liu, J. The Role of Toll-Like Receptors in Oncotherapy. Oncol. Res. 2019, 27, 965–978. [Google Scholar] [CrossRef] [PubMed]
- Paston, S.J.; Brentville, V.A.; Symonds, P.; Durrant, L.G. Cancer Vaccines, Adjuvants, and Delivery Systems. Front. Immunol. 2021, 12, 627932. [Google Scholar] [CrossRef]
- Zhang, Y.; Luo, F.; Cai, Y.; Liu, N.; Wang, L.; Xu, D.; Chu, Y. TLR1/TLR2 agonist induces tumor regression by reciprocal modulation of effector and regulatory T cells. J. Immunol. 2011, 186, 1963–1969. [Google Scholar] [CrossRef]
- Amiset, L.; Fend, L.; Gatard-Scheikl, T.; Rittner, K.; Duong, V.; Rooke, R.; Muller, S.; Bonnefoy, J.Y.; Préville, X.; Haegel, H. TLR2 ligation protects effector T cells from regulatory T-cell mediated suppression and repolarizes T helper responses following MVA-based cancer immunotherapy. Oncoimmunology 2012, 1, 1271–1280. [Google Scholar] [CrossRef]
- Abdel-Aal, A.B.; Lakshminarayanan, V.; Thompson, P.; Supekar, N.; Bradley, J.M.; Wolfert, M.A.; Cohen, P.A.; Gendler, S.J.; Boons, G.J. Immune and anticancer responses elicited by fully synthetic aberrantly glycosylated MUC1 tripartite vaccines modified by a TLR2 or TLR9 agonist. Chembiochem Eur. J. Chem. Biol. 2014, 15, 1508–1513. [Google Scholar] [CrossRef] [PubMed]
- Reed, J.M.; Branigan, P.J.; Bamezai, A. Interferon gamma enhances clonal expansion and survival of CD4+ T cells. J. Interferon Cytokine Res. 2008, 28, 611–622. [Google Scholar] [CrossRef] [PubMed]
- Reid, G.S.; Shan, X.; Coughlin, C.M.; Lassoued, W.; Pawel, B.R.; Wexler, L.H.; Thiele, C.J.; Tsokos, M.; Pinkus, J.L.; Pinkus, G.S.; et al. Interferon-gamma-dependent infiltration of human T cells into neuroblastoma tumors in vivo. Clin. Cancer Res. 2009, 15, 6602–6608. [Google Scholar] [CrossRef]
- Bourgeois-Daigneault, M.C.; Roy, D.G.; Falls, T.; Twumasi-Boateng, K.; St-Germain, L.E.; Marguerie, M.; Garcia, V.; Selman, M.; Jennings, V.A.; Pettigrew, J.; et al. Oncolytic vesicular stomatitis virus expressing interferon-γ has enhanced therapeutic activity. Mol. Ther. Oncolytics 2016, 3, 16001. [Google Scholar] [CrossRef]
- Yamashita, M.; Tasaki, M.; Murakami, R.; Arai, Y.; Nakamura, T.; Nakao, S. Oncolytic vaccinia virus induces a novel phenotype of CD8+ effector T cells characterized by high ICOS expression. Mol. Ther. Oncolytics 2021, 20, 422–432. [Google Scholar] [CrossRef]
- Curiel, T.J.; Coukos, G.; Zou, L.; Alvarez, X.; Cheng, P.; Mottram, P.; Evdemon-Hogan, M.; Conejo-Garcia, J.R.; Zhang, L.; Burow, M.; et al. Specific recruitment of regulatory T cells in ovarian carcinoma fosters immune privilege and predicts reduced survival. Nat. Med. 2004, 10, 942–949. [Google Scholar] [CrossRef] [PubMed]
- Wang, J.; Tian, S.; Sun, J.; Zhang, J.; Lin, L.; Hu, C. The presence of tumour-infiltrating lymphocytes (TILs) and the ratios between different subsets serve as prognostic factors in advanced hypopharyngeal squamous cell carcinoma. BMC Cancer 2020, 20, 731. [Google Scholar] [CrossRef]
- Overacre-Delgoffe, A.E.; Chikina, M.; Dadey, R.E.; Yano, H.; Brunazzi, E.A.; Shayan, G.; Horne, W.; Moskovitz, J.M.; Kolls, J.K.; Sander, C.; et al. Interferon-γ drives Treg fragility to promote anti-tumor immunity. Cell 2017, 169, 1130–1141. [Google Scholar] [CrossRef] [PubMed]
- Overacre-Delgoffe, A.E.; Vignali, D.A.A. Treg Fragility: A Prerequisite for Effective Antitumor Immunity? Cancer Immunol. Res. 2018, 6, 882–887. [Google Scholar] [CrossRef] [PubMed]
- Deligne, C.; Metidji, A.; Fridman, W.H.; Teillaud, J.L. Anti-CD20 therapy induces a memory Th1 response through the IFN-γ/IL-12 axis and prevents protumor regulatory T-cell expansion in mice. Leukemia 2015, 29, 947–957. [Google Scholar] [CrossRef] [PubMed]
- Garner, H.; de Visser, K.E. Immune crosstalk in cancer progression and metastatic spread: A complex conversation. Nat. Rev. Immunol. 2020, 20, 483–497. [Google Scholar] [CrossRef]
- Okita, Y.; Tanaka, H.; Ohira, M.; Muguruma, K.; Kubo, N.; Watanabe, M.; Fukushima, W.; Hirakawa, K.; Hirakawa, K. Role of tumor-infiltrating CD11b+ antigen-presenting cells in the progression of gastric cancer. J. Surg. Res. 2014, 186, 192–200. [Google Scholar] [CrossRef]
- Salerno, F.; Guislain, A.; Freen-Van Heeren, J.J.; Nicolet, B.P.; Young, H.A.; Wolkersa, M.C. Critical role of post-transcriptional regulation for IFN-γ in tumor-infiltrating T cells. Oncoimmunology 2018, 8, e1532762. [Google Scholar] [CrossRef]
- Cheon, H.; Borden, E.C.; Stark, G.R. Interferons and their stimulated genes in the tumor microenvironment. Semin. Oncol. 2014, 41, 156–173. [Google Scholar] [CrossRef] [PubMed]
- Alspach, E.; Lussier, D.M.; Schreiber, R.D. Interferon γ and its important roles in promoting and inhibiting spontaneous and therapeutic cancer immunity. Cold Spring Harb. Perspect. Biol. 2018, 11, a028480. [Google Scholar] [CrossRef] [PubMed]
- Giese, M.A.; Hind, L.E.; Huttenlocher, A. Neutrophil plasticity in the tumor microenvironment. Blood 2019, 133, 2159–2167. [Google Scholar] [CrossRef] [PubMed]
- Feng, X.; Zhang, L.; Acharya, C.; An, G.; Wen, K.; Qiu, L.; Munshi, N.; Tai, Y.T.; Anderson, K.C. Targeting CD38 suppresses induction and function of T regulatory cells to mitigate immunosuppression in multiple myeloma. Clin. Cancer Res. 2017, 23, 4290–4300. [Google Scholar] [CrossRef] [PubMed]


Publisher’s Note: MDPI stays neutral with regard to jurisdictional claims in published maps and institutional affiliations. |
© 2021 by the authors. Licensee MDPI, Basel, Switzerland. This article is an open access article distributed under the terms and conditions of the Creative Commons Attribution (CC BY) license (https://creativecommons.org/licenses/by/4.0/).
Share and Cite
Trofimova, O.; Korotkaja, K.; Skrastina, D.; Jansons, J.; Spunde, K.; Isaguliants, M.; Zajakina, A. Alphavirus-Driven Interferon Gamma (IFNg) Expression Inhibits Tumor Growth in Orthotopic 4T1 Breast Cancer Model. Vaccines 2021, 9, 1247. https://doi.org/10.3390/vaccines9111247
Trofimova O, Korotkaja K, Skrastina D, Jansons J, Spunde K, Isaguliants M, Zajakina A. Alphavirus-Driven Interferon Gamma (IFNg) Expression Inhibits Tumor Growth in Orthotopic 4T1 Breast Cancer Model. Vaccines. 2021; 9(11):1247. https://doi.org/10.3390/vaccines9111247
Chicago/Turabian StyleTrofimova, Olga, Ksenija Korotkaja, Dace Skrastina, Juris Jansons, Karina Spunde, Maria Isaguliants, and Anna Zajakina. 2021. "Alphavirus-Driven Interferon Gamma (IFNg) Expression Inhibits Tumor Growth in Orthotopic 4T1 Breast Cancer Model" Vaccines 9, no. 11: 1247. https://doi.org/10.3390/vaccines9111247
APA StyleTrofimova, O., Korotkaja, K., Skrastina, D., Jansons, J., Spunde, K., Isaguliants, M., & Zajakina, A. (2021). Alphavirus-Driven Interferon Gamma (IFNg) Expression Inhibits Tumor Growth in Orthotopic 4T1 Breast Cancer Model. Vaccines, 9(11), 1247. https://doi.org/10.3390/vaccines9111247