3.1. The Need for Testing PBMCs in B Cell ImmunoSpot® Assays in Serial Dilution
Having pioneered an affinity capture coating (ACC) strategy for ImmunoSpot
® [
29] (illustrated in
Supplemental Figure S1A), that facilitates development of B cell ImmunoSpot
® assays detecting B
mem specific for essentially any antigen, we established such assays for infectious disease-related antigens to which most humans have likely been exposed and thus against which B
mem would have been generated. These were the spike (S-antigen) and nucleocapsid (NCAP) proteins of the ancestral Wuhan-Hu-1 strain of SARS-CoV-2, hemagglutinin (HA) proteins representing seasonal influenza A viruses (CA/09, H1N1 or TX/12, H3N2), seasonal influenza B virus (Phuket/13, Yamagata lineage), Epstein–Barr virus (EBNA1), and human cytomegalovirus (gH pentamer complex). Enabled by the new approach, we set out to screen PBMC samples obtained from healthy adult donors for the presence of B
mem with reactivity against this antigen panel. Of note, the PBMC samples were collected in May 2022 or later, at which point the majority of donors had likely either been infected by the SARS-CoV-2 virus and/or received one or more doses of a COVID-19 vaccine.
As commonly performed for functional assays, including the traditional (T and) B cell ImmunoSpot
® approach, in our initial screening we tested for IgG
+-antibody-secreting cell (ASC) reactivity to each antigen at a fixed cell number of 3 × 10
5 PBMCs per well. At this seeding density the PBMC sediment formed a monolayer on the bottom of the 96-well plate, which is ideal for the detection of secretory footprints originating from rare individual lymphocytes using the ImmunoSpot
® approach [
31]. Moreover, samples were tested in duplicate to counter well-to-well variations that can be expected, particularly when detecting low-frequency events [
20,
32].
Accounting for the possibility that the frequency of B
mem specific for any given antigen in a PBMC test sample can be quite low, it seemed justifiable to test the PBMCs at a cell input close to the monolayer maximum to ensure that even antigen-reactive B
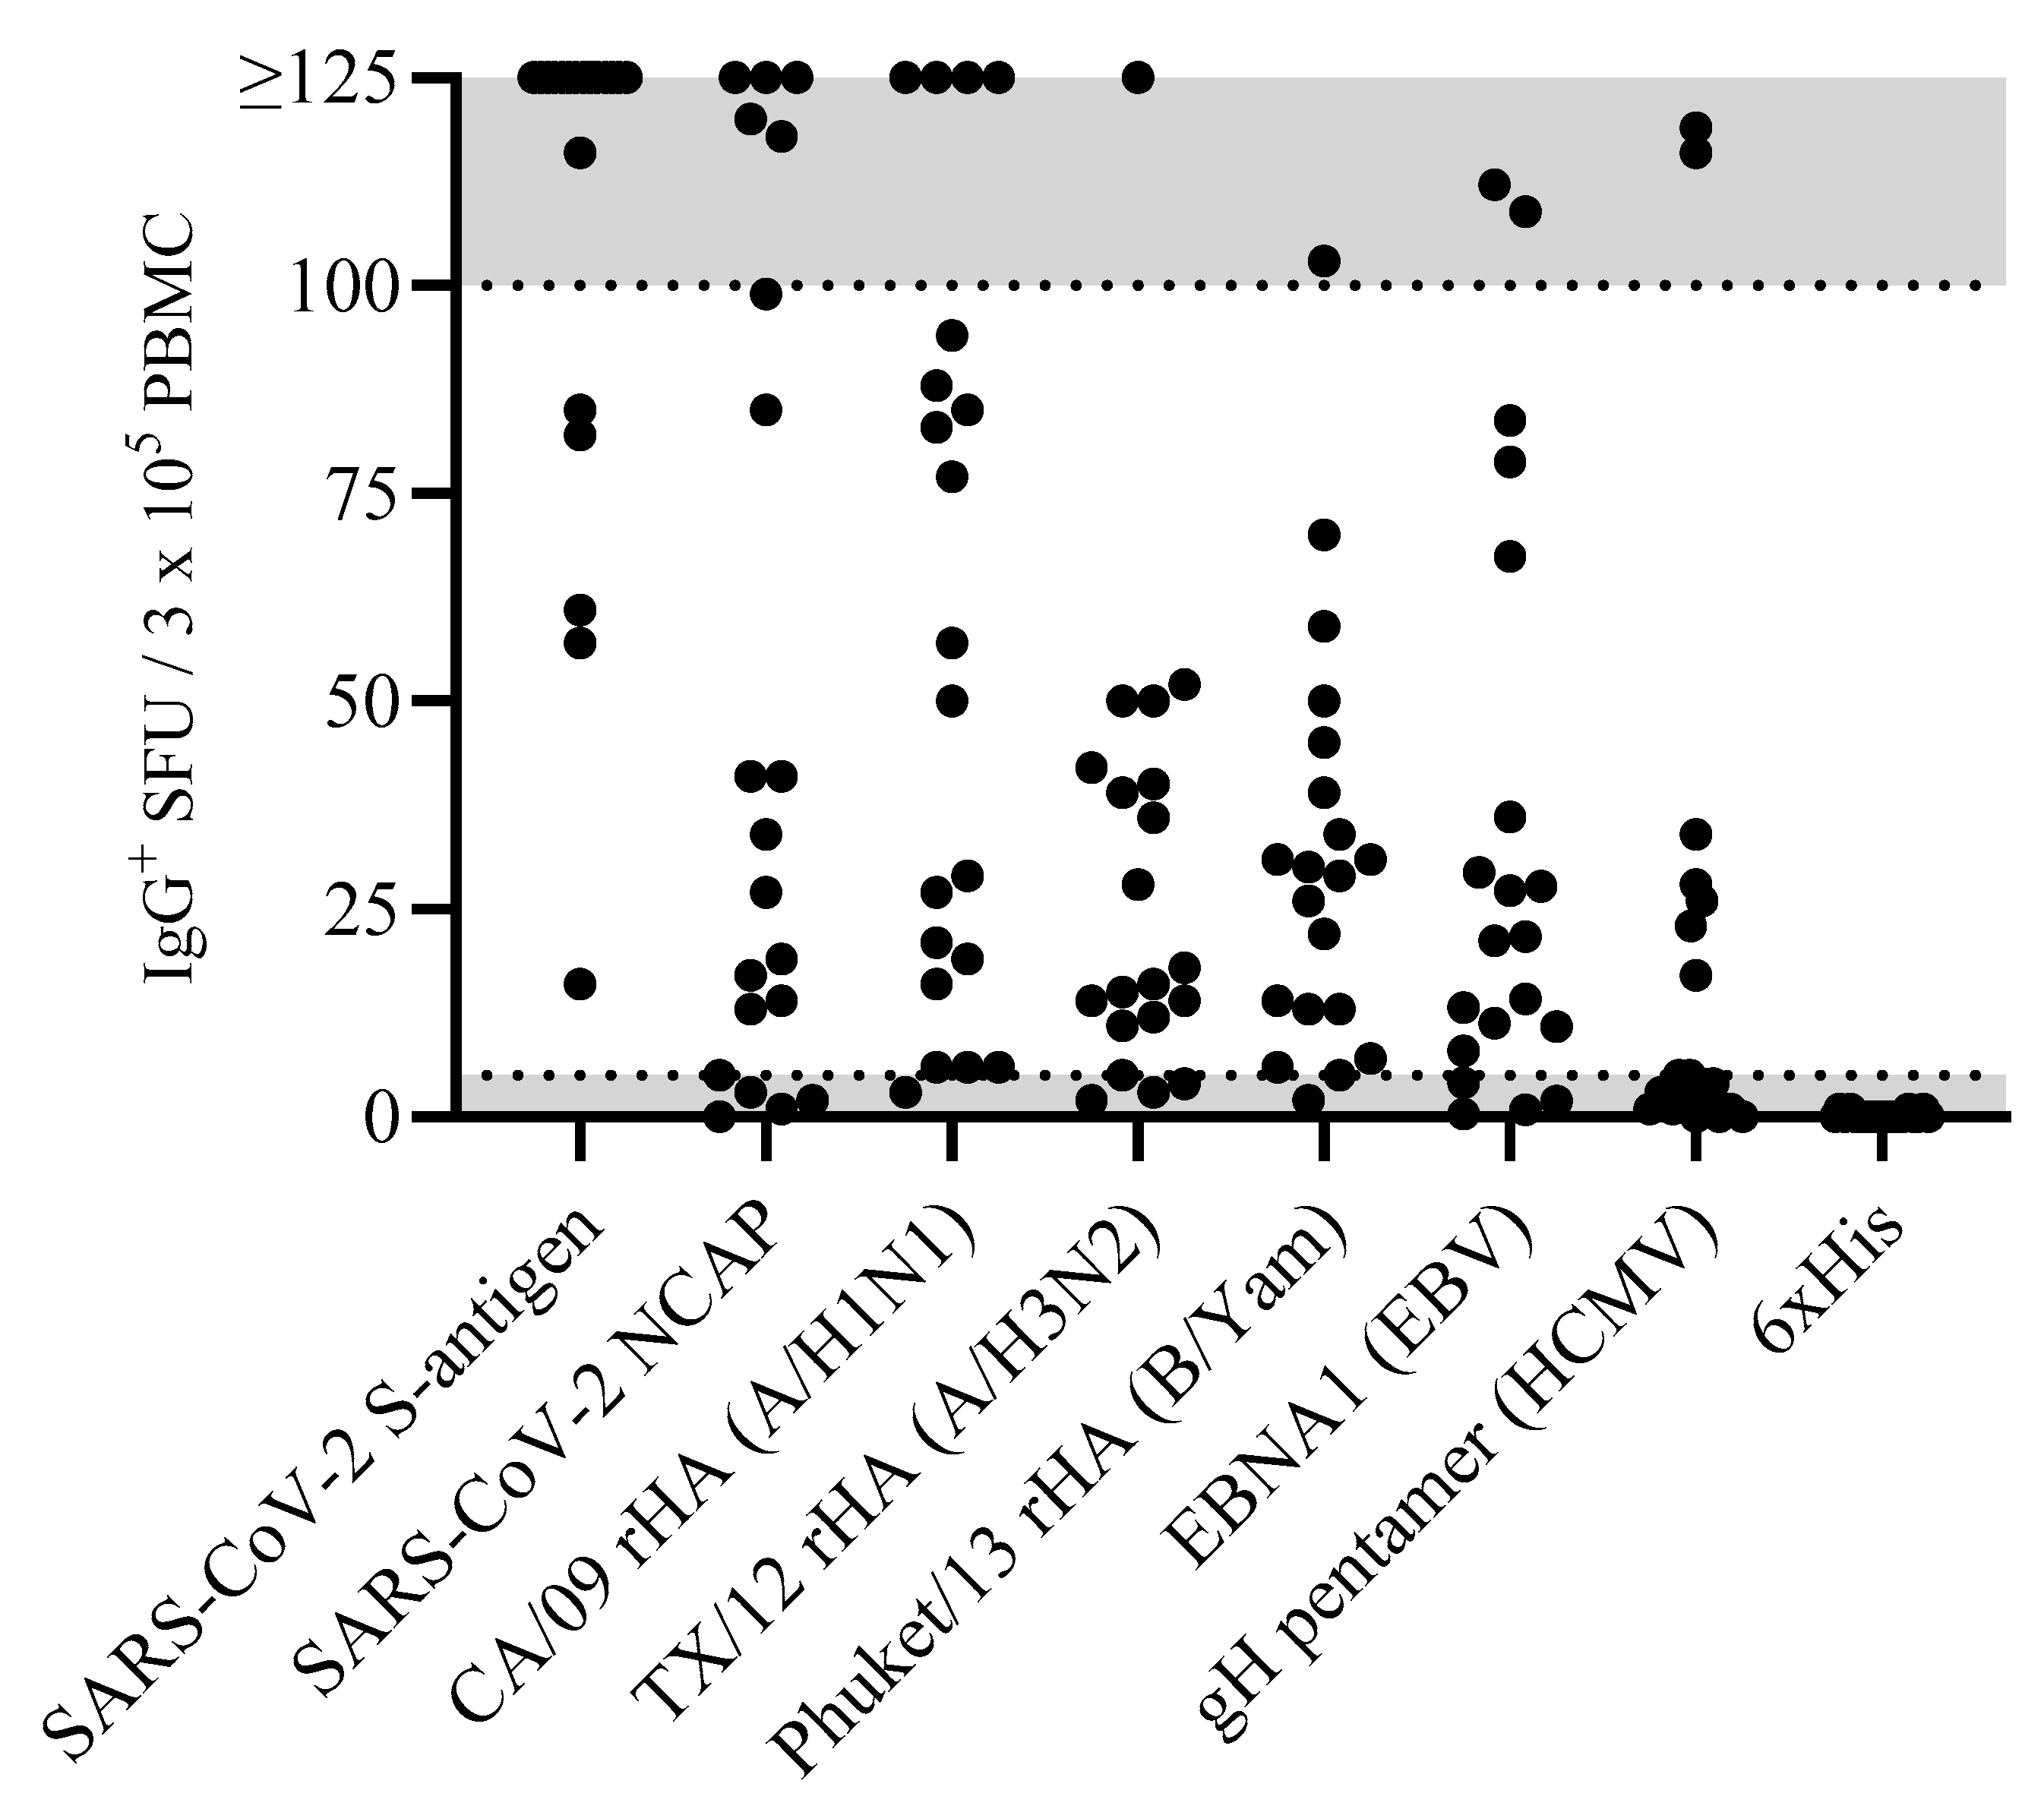
mem occurring at low frequencies could be detected. Raw data obtained for 20 representative donors against the eight antigens in our panel are shown in
Figure 1. Notably, the number of antigen-reactive IgG
+ ASCs varied considerably between individual donors, ranging from above the upper limit of quantification (ULOQ) (>125 SFUs per well, see below) to below the lower limit of quantification (LLOQ, <5 SFUs per well). The data also revealed that no donor exhibited a consistently high or low responder status against all antigens in the panel; to the contrary, in line with the premise that each individual possesses a unique exposure history to environmental pathogens [
33], the magnitude of viral-antigen-reactive IgG
+ ASCs detected within and among different donors varied greatly (
Supplemental Table S1). Moreover, a spectrum of secretory footprint morphologies was often observed within the same assay well, as well as distinct morphologies in wells coated with different viral antigens (
Supplemental Figure S2). Therefore, these data serve to illustrate that testing PBMCs at a fixed number is not suited for reliably establishing the frequency of antigen-reactive IgG
+ B
mem cells in ImmunoSpot
® assays.
To more precisely determine the frequency of antigen-reactive IgG
+ B
mem in donors that initially yielded a result above the assay’s ULOQ, we re-evaluated such antigen/PBMC combinations using a 2-fold serial dilution approach. As shown for a representative sample in
Figure 2, a close to perfect linear relationship was seen between the number of SARS-CoV-2 spike (S-antigen)-reactive IgG
+ secretory footprints (spot-forming units, SFUs) counted and PBMCs plated, but only when the antigen-reactive SFU counts were less than 100 per well (
Figure 2H); at higher cell inputs for this antigen/donor combination the confluence of SFUs and elevated membrane staining (occurring due to an ELISA effect in which antibodies escape into the supernatant and then subsequently bind to the antigen-coated membrane distally from the source ASCs—visible in
Figure 2A–C) resulted in undercounting of individual SFUs (
Figure 2G). The data show that secretory footprints of individual ASCs could be accurately detected under 100 SFUs per well, constituting the ULOQ for this particular donor. For other donors, owing either to variable SFU morphologies and/or fortuitously finding the optimal serial dilution window, the ULOQ can be slightly lower or higher than 100 SFUs per well. Taking this into consideration, we denoted a “gray zone” as the ULOQ in
Figure 1. Nevertheless, for most antigen-specific assays (including S-antigen), the linearity region of the curve rarely exceeds 125 SFUs per well.
The LLOQ can be conservatively set at 5 SFUs per well. According to Poisson’s rule, which applies when measuring antigen-specific lymphocytes [
20], the well-to-well variation in SFUs generated by rare ASCs increases dramatically at lower precursor frequencies. Therefore, in such instances, a multitude of replicates would be required to firmly establish their actual abundance in a test sample. Importantly, only in a narrow window, between 10 and 100 SFUs per well, are antigen-specific SFU counts inherently reliable for frequency calculations. Depending on the frequency of antigen-specific ASCs in a test sample, as well as the resulting secretory footprint morphologies, the ideal range of SFUs for frequency calculations will be unique to each PBMC/antigen combination and hence can only be consistently established using a serial dilution testing approach.
Supplemental Figure S3 illustrates both the high degree of variability in S-antigen-reactive B cells among 12 donors and that a serial dilution approach permits the establishment of a linear range for cell input vs. SFU counts from which the frequencies can be calculated.
Supplemental Figure S4 depicts the linear range for 11 of these 12 donors, with regression lines and frequency extrapolations shown.
Supplemental Table S2 further shows the reproducibility of S-antigen-reactive IgG
+ ASC frequencies—even when they varied considerably between the test samples. While these data are for S-antigen, in the interim we have been implementing serial-dilution-based frequency assessments for most of the antigens shown in
Figure 1, confirming the generalizability of the finding for healthy donors. However, whether this is also applicable when testing samples obtained from elderly and immune-compromised subjects remains an open question.
Serial dilutions are therefore necessary for achieving accurate B
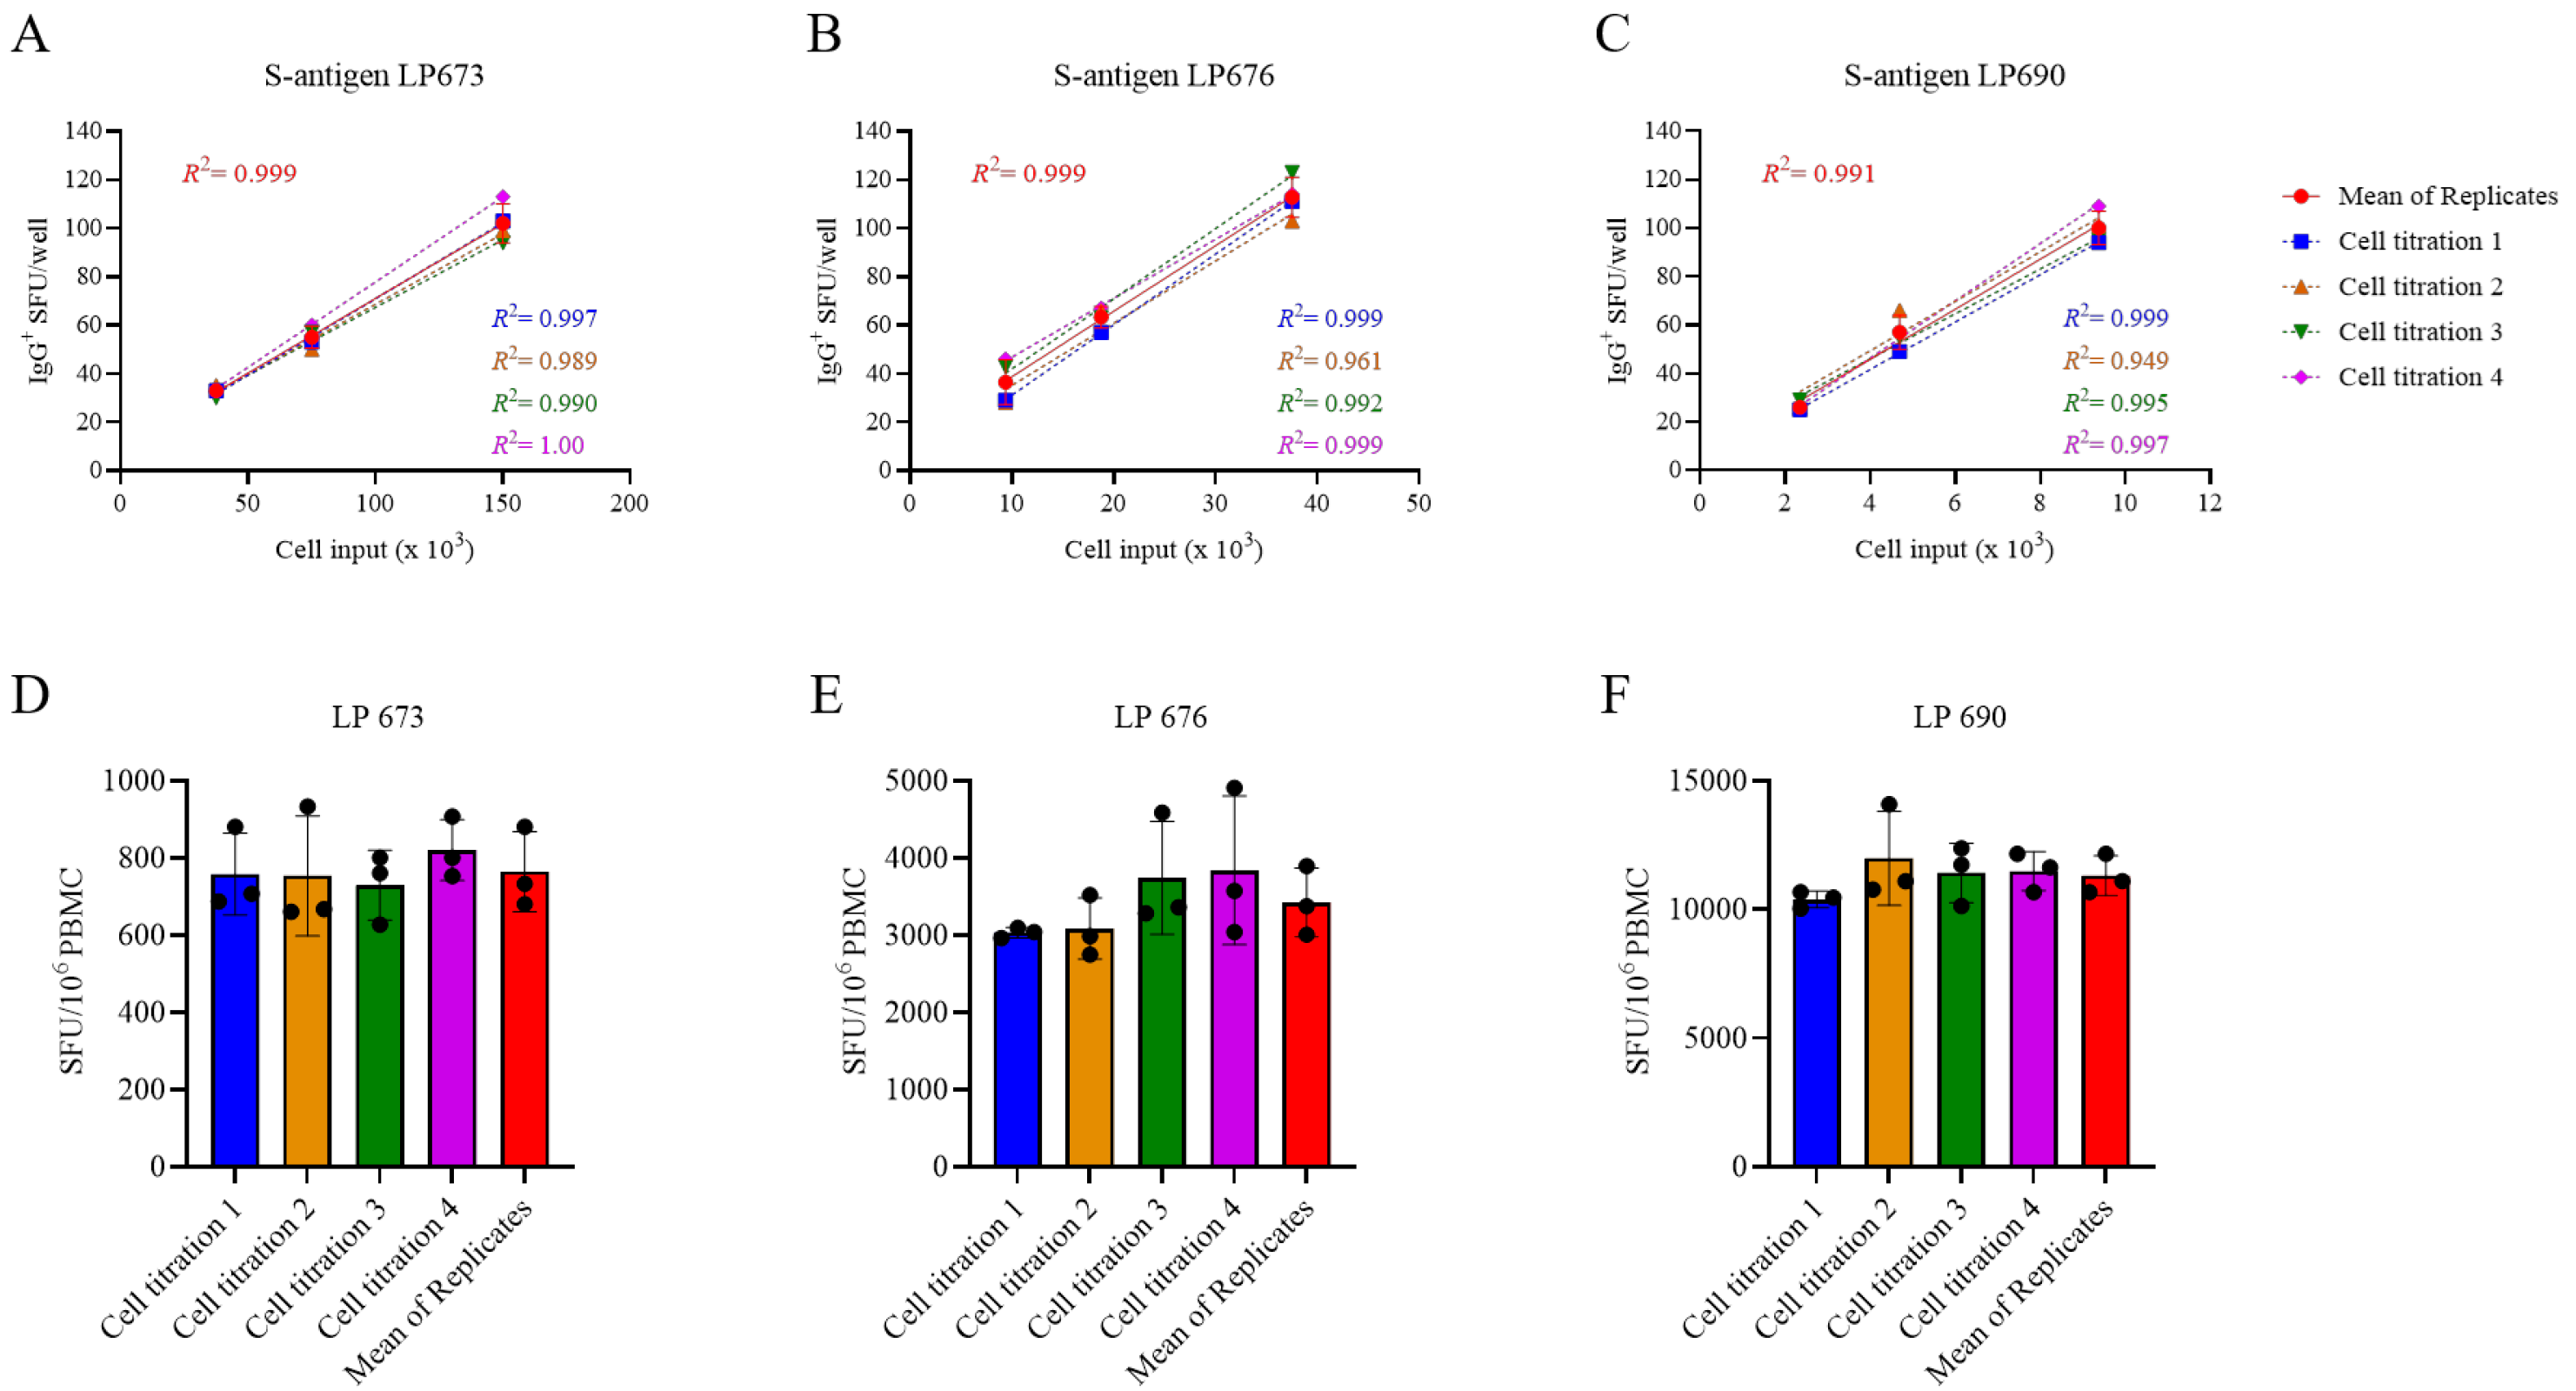
mem frequency measurements in PBMC samples in which antigen-reactive ASCs are abundant, but this increases the number of PBMCs required for testing. Observing the close to perfect linear relationship between PBMC numbers plated and SFUs detected per well, we sought to test the hypothesis that the serial dilution strategy itself could substitute for the reliance on technical replicates. In
Figure 3A–C, PBMCs from three SARS-CoV-2 S-antigen-reactive subjects were serially diluted in four replicate wells for each dilution—SFU counts are shown for the linear range of 10 to 100 SFUs per well only. The mean SFU counts at the designated cell inputs were first calculated, and it was established that the mean SFU counts originating from 2-fold serially diluted PBMCs closely followed a linear function. Moreover, very similar regression lines were also obtained when the same calculations were performed using each of the replicates separately. Moreover, frequencies were calculated by extrapolation using either the individual SFU counts within a singlet serial dilution or using the mean counts from the quadruplicates (
Figure 3D–F). In each instance, the frequency of S-antigen-reactive IgG
+ ASCs per 10
6 PBMCs was not significantly different between the respective singlet serial dilutions nor were they different from the frequency determined using the mean SFU count from the four replicate wells at each cell dilution. The conclusion that singlet serial dilutions enable accurate frequency determinations was also confirmed for several additional antigens and for determining the frequency of ASCs producing different classes of immunoglobulin (IgA, IgM, or IgG) (
Supplemental Figure S5). Collectively, these data demonstrate that serial dilutions performed in single wells yield nearly equivalent data compared to results obtained from serial dilutions performed in quadruplicate; however, the former approach requires only a quarter as many PBMCs, representing the first substantial saving on blood volumes needed for routine testing.
3.2. Multiplexing B Cell ImmunoSpot® Assays
Immunoglobulins (Igs) occur in four major classes (IgA, IgE, IgG, and IgM) and there are four IgG subclasses (IgG1, IgG2, IgG3, and IgG4). While all of these molecules share the task of specific antigen recognition, they can fundamentally differ in the effector functions they elicit upon binding to antigen. Comprehensive immune monitoring therefore needs to account for each of these Ig classes and subclasses, including the Bmem that are pre-committed to secrete them. Traditional ELISPOT assays measure one analyte at a time: one would need to run four single-color assays to cover all the Ig classes, plus an additional four single-color assays to segregate each of the IgG subclasses, necessitating increased PBMC utilization. Multiplexing the detection of Ig classes and/or IgG subclasses is the most practical solution to this requirement and—as we will show in the following—can be accomplished without increasing the need for additional PBMC test material.
While four-color B cell ImmunoSpot
® analysis is already commercially available [
19], so far its sensitivity for detecting the individual antigen-specific Ig analytes has not been formally established versus their single-color measurements. Multiplexing in FluoroSpot analysis is currently limited to four analytes owing to the requirement that each fluorescence-tagged detection antibody possess distinct excitation/emission properties that do not overlap, so that each can be visualized without leaking into the other’s detection channels and therefore permitting automated single-color counting in each color plane without the need for compensation [
19]. In systematic studies we have established here that traditional single-color enzymatic ELISPOT assays and four-color fluorescent analysis provide indistinguishable antigen-specific IgG SFU counts within the linear range (
Figure 4); however, in ELISPOT the linearity in S-antigen-specific SFU counts broke down earlier than FluoroSpot in large part due to the increased size of individual secretory footprints and elevated membrane staining in wells with a high density of SFUs—both attributable to enzymatic amplification. Similarly, we previously demonstrated that pan (total) Ig SFU counts were also equivalent between single-color enzymatic ELISPOT and single- or four-color FluoroSpot assays [
25].
With this notion in mind, we systematically studied PBMCs obtained from healthy human donors in order to determine the frequency of ASCs that secrete the four Ig classes and the four IgG subclasses. Following five days of in vitro polyclonal stimulation, the donors’ PBMCs were plated at 2 × 10
5 cells per well and then serially diluted 2-fold. The results shown in
Supplemental Table S3 established that (a) even for a single Ig class or IgG subclass, the frequency of pan-Ig ASCs can vary substantially between healthy individuals, and (b) that in all individuals IgM-, IgG- and IgG1-secreting ASCs substantially outnumbered ASCs secreting other classes/subclasses. In most instances the SFU counts originating from IgM
+, IgG
+, or IgG1
+ ASCs were above the linear range for accurate frequency calculations at the same PBMC inputs at which ASCs secreting the rarer classes/subclasses (IgA, IgG2, IgG3, and IgG4) were exceedingly infrequent, if not undetectable. Lastly, these studies established that—except if one is particularly interested in the rarer Ig classes and subclasses—starting the serial dilution at 2–3 × 10
4 PBMCs per well is sufficient for multiplexed pan-Ig measurements.
Systematic four-color ImmunoSpot
® studies conducted to establish the frequency of B
mem-derived ASCs with reactivity for a SARS-CoV-2 S-antigen representing the prototype Wuhan-Hu-1 strain were consistent with results shown in
Figure 1 (Yao et al., manuscript in preparation). Collectively, these data confirmed the prevalence of the IgG class, and specifically the IgG1 subclass, within the antigen-specific ASC compartment.
Based on the data presented, and all the experience we have gained so far, we recommend, for initial B
mem characterization, to perform tests in which the PBMCs are serially diluted starting at 1–3 × 10
5 cells per well for each antigen and at 1–3 × 10
4 PBMCs per well for the pan-Ig assay. Since these tests can each be conducted using a single well serial dilution approach without compromising the resolution of the results, and because the detection of four Ig classes or IgG subclasses can be multiplexed using four-color detection systems, even when starting with a 3 × 10
5 PBMC input, 1.2 × 10
6 cells from the polyclonal stimulation cultures are sufficient for measuring all four Ig classes and four IgG subclasses per antigen with an additional 1.2 × 10
5 cells needed for establishing the frequency of ASCs producing each of the four Ig classes or IgG subclasses (irrespective of antigen specificity). The recommended plate layout for routine PBMC testing in B cell ImmunoSpot
® assays (
Supplemental Figure S6) accommodates frequency determinations for both antigen-specific and pan-Ig B
mem of all classes and subclasses despite the considerable variability of frequencies in which such B
mem occur in blood, except for those being present at very low frequencies.
3.3. Extending the Lower Limit of Detection
As can be seen in
Figure 1, when tested at 3 × 10
5 PBMCs per well, there are still some donors in whom antigen-specific IgG
+ ASCs were not detected above the positivity threshold (>5 SFUs per 3 × 10
5 PBMCs). Such an outcome may reflect two fundamentally different scenarios: either such donors have not been exposed to the antigen (true negative) or the frequency of B
mem reactivity for the antigen in question was below the detection limit of the assay as performed for this particular donor (false negative). Owing to the heterogeneous and often unverifiable antigen exposure histories of human subjects, determining the distinction between a true negative vs. a false negative test result is not a simple task. SARS-CoV-2 S-antigen and NCAP provide here a rare opportunity to distinguish between immunologically naïve and antigen-exposed individuals. As shown in
Supplemental Table S4, subjects whose PBMCs were cryopreserved before the introduction of the SARS-CoV-2 virus into the human population exhibited negligible IgG
+ ASC reactivity when 1 × 10
5 or 2 × 10
5 PBMCs were tested against SARS-CoV-2 S-antigen or NCAP, respectively. Such samples serve as true negatives and yielded the expected results. In contrast, donors who had either recovered from verified SARS-CoV-2 infection or completed the primary COVID-19 mRNA vaccination series possessed clearly elevated frequencies of S-antigen reactive B
mem-derived IgG
+ ASCs and provided 100% diagnostic specificity when tested at 1 × 10
5 PBMCs or lower inputs per well. However, these positive test results were seen using samples isolated within half a year following verified infection or vaccination and raised the question of whether testing 2 × 10
5 PBMCs would suffice for reliably detecting S-antigen or NCAP-reactive B
mem in samples from subjects whose prior infection and/or vaccination history was unknown.
With this specific question in mind, cryopreserved PBMCs (collected between May and October 2022) were subjected to polyclonal stimulation and evaluated for B
mem-derived IgG
+ ASC reactivity against SARS-CoV-2 S-antigen and NCAP representing the ancestral Wuhan-Hu-1 strain (
Supplemental Table S5). Owing to the elevated frequency of S-antigen-reactive B
mem-derived IgG
+ ASCs detected in earlier experiments (
Figure 1), these samples were exclusively tested using a singlet serial dilution approach starting at 2 × 10
5 PBMCs per well. However, to account for the possibility that NCAP-reactive B
mem frequencies could be low, we tested these samples using either a singlet serial dilution approach starting at 2 × 10
5 or by seeding replicate wells with 5 × 10
5 PBMCs. Notably, B
mem-derived IgG
+ ASC reactivity against the S-antigen was readily apparent in 100% of these donors (n = 10) and supports the notion that S-antigen-reactive B
mem were generated as a consequence of prior infection(s) and/or vaccination(s). Half (5/10) of these donors, however, did not exhibit clearly elevated numbers of NCAP-reactive B
mem-derived IgG
+ ASCs when tested at an initial starting input of 2 × 10
5 PBMCs per well. Had these five donors indeed avoided prior SARS-CoV-2 virus infection despite its wide spread early in 2022 [
34], or were the frequencies of NCAP-reactive B
mem in such PBMC samples merely below the detection limit of the assay as performed? Only through modifying the testing procedure and seeding 5 × 10
5 PBMCs per well to augment the assay’s detection limit could this question be addressed. Among the donors that yielded <5 NCAP-reactive IgG
+ SFUs in wells seeded with 2 × 10
5 PBMCs, four of five donors demonstrated an increased number of NCAP-reactive IgG
+ SFUs in wells seeded with 5 × 10
5 PBMCs. Nevertheless, the resulting SFU counts were not necessarily increased by 2.5-fold as might be expected. However, when the SFU counts from the four replicate NCAP-coated wells seeded with 5 × 10
5 PBMCs were aggregated together, entailing a 10-fold increase in the number of PBMCs tested in the assay, it became more evident that 8 of 10 donors had likely been previously infected; however, this cannot be definitively confirmed. Furthermore, when testing PBMCs at high cell inputs, and particularly when aiming to detect very low frequencies of antigen-specific ASCs, it is advisable to incorporate an irrelevant antigen into the test to serve as a comparator for “chance” reactivity.
As such, B cell ImmunoSpot
® assays are capable of detecting individual ASCs so long as (a) these cells do not compete for real estate on the membrane on which their respective secretory footprints are being captured (as shown above, this is a limitation readily overcome by performing serial dilutions when measuring high-frequency ASC populations) and (b) the PBMCs do not pile up in layers on the membrane. In the latter case of cell crowding, bystander cells in the lower stratum can be expected to hinder the generation of secretory footprints on the antigen-coated membrane by ASCs in the upper strata. From direct visualization of PBMCs on the membrane, we already know that cell inputs of >1 × 10
6 PBMCs per well exceed a single stratum (i.e., a monolayer) when input into a standard 96-well assay plate [
31]. To experimentally address how many PBMCs can be plated per well before cell crowding starts to interfere with detection of ASCs at single cell resolution, we admixed polyclonally simulated PBMCs (that contained ASCs at an optimal “Goldilocks number”, i.e., ~50 SFUs per well) with increasing numbers of autologous unstimulated PBMCs (that do not contain IgG
+ ASCs). The results are shown in
Supplemental Figure S7, indicating that PBMC inputs exceeding 5 × 10
5 per well can undermine the ability to discern individual secretory footprints. Therefore, if extending the lower limit of detection is intended, the number of PBMCs interrogated can be indefinitely increased by testing additional replicates, each at 5 × 10
5 PBMCs per well.
Collectively, the data presented so far suggest that testing of uncharacterized PBMCs for antigen-specific ASCs should start at 3–5 × 10⁵ PBMCs per well and progress in a 2-fold serial dilution. This approach should permit reliable detection and accurate quantification of ASC populations existing at intermediate to high frequencies. If a donor is in the low/ambiguous frequency range, subsequent re-testing at 5 × 10⁵ PBMCs per well in replicates will enable extending the limit of detection and of quantification. Such a strategy requires, however, that additional vials of cryopreserved PBMCs are set aside (see below). As an alternative “fail-safe” approach, to accommodate the scenario in which Bmem frequencies in the study cohort could also exist at low frequencies, in the first test one could perform a serial dilution in singlet wells and also set up replicate wells with an input of 5 × 10⁵ PBMCs. In such a testing approach, the serial dilution would adequately cover the intermediate to high ASC frequency range, while the replicate wells seeded with the highest cell input would enable low-frequency measurements. We confirmed the utility of such a “fail-safe” approach for detecting low frequencies of S-antigen-reactive IgA+ or IgG4+ ASCs in a cohort of COVID-19-mRNA-vaccinated donors, whereas the frequency of the more abundant S-antigen-reactive IgG1+ ASCs was determined using a serial dilution approach and a lower starting cell input of 2 × 10⁵ PBMCs.
3.4. Targeted Cryopreservation of PBMCs for Testing (and Re-Testing) in B Cell ImmunoSpot® Assays
In previous work we have established protocols according to which PBMCs can be cryopreserved without loss of functionality for later testing in B cell ImmunoSpot
® assays [
19,
25] and we have shown the high reproducibility of the data (CV < 20%) when different aliquots of the same sample are tested on different days, even by different investigators [
20]. Such robust assay performance is essential for the ability to (a) test clinical samples in central laboratories far from sites where they were collected, (b) test samples independent of the time point of collection, (c) test PBMCs of different donors side-by-side in a single high-throughput experiment avoiding inter-assay variations of results, (d) reproduce results by repeatedly testing aliquots of the same blood draw, and (e) extend the results of the first screening run if needed or intended, e.g., to lower detection limits, or to perform subsequent B cell cross-reactivity or affinity spectrum analysis by ImmunoSpot
® [
35,
36]. For the latter two options it is essential to first establish the “Goldilocks number” that yields ~50 SFUs per well for a given antigen/sample combination. Cryopreservation is also essential (f) for generating reference PBMCs with established B
mem frequencies for antigens of interest [
12], as well as for (g) the ability to validate B cell ImmunoSpot
® assays [
20].
Cryopreservation of PBMCs for testing in functional assays is already well established and is traditionally performed at 10 million PBMCs per vial. The data shown above, however, suggest that only 1–2 × 10⁶ PBMCs following the 5-day polyclonal stimulation would be sufficient to establish the frequency of Bmem with reactivity for an antigen, even when the assessment extends to all four Ig classes and four IgG subclasses. Even if the PBMCs would need to be re-tested, e.g., to extend the lower detection limit, only a few million more cells at most (far less than 10 million) would be needed. The question therefore arose as to whether PBMCs can be cryopreserved in lower numbers per cryovial than 10 million to avoid the waste of precious cell material.
To address this question, PBMCs collected by leukapheresis were either directly subjected to polyclonal stimulation immediately upon receipt, without cryopreservation, i.e., were tested “fresh”, or following cryopreservation in aliquots containing 10, 5, or 2 × 10
6 PBMCs per vial. To allow for batch testing of multiple donors’ samples in parallel, cryopreserved aliquots were thawed two weeks or more after being generated, subjected to polyclonal stimulation, and then tested for ASC activity in ImmunoSpot
® assays. Pan-Ig and antigen-specific ASC frequencies were established using the singlet two-fold serial dilution strategy described above. In
Table 1, the frequencies of S-antigen-reactive IgG
+ ASCs are represented as the percentage of all IgG
+ ASCs. The results are essentially identical for fresh and frozen cells and, notably, irrespective of the number of PBMCs cryopreserved per vial. Collectively, these data indicate, at least for healthy adult donors, that cryopreserving a custom number of PBMCs is feasible. However, whether this conclusion can be extended to donors with different disease states or those undergoing various therapies would need to be verified in each specific clinical scenario.
The above experiment also provided insights into cell losses associated with the cryopreservation of PBMCs obtained from healthy adult donors at various cell densities. As seen in
Table 2, the viabilities of PBMCs frozen at the various cell densities upon thawing and following the polyclonal stimulation were indistinguishable and mirrored what was observed using freshly isolated cell material. Data accumulated over the years documenting cell recovery following the in vitro polyclonal stimulation procedure when starting with samples cryopreserved at 10 million PBMCs per vial confirm the conclusion that with rare exceptions at least 50% of the PBMCs can be recovered after cryopreservation followed by a 5-day polyclonal stimulation culture (
Supplemental Figure S8B). This finding may serve as a guide for planning B cell ImmunoSpot
® assays cryopreserving custom numbers of PBMCs for optimized cell utilization.
We have established here that PBMCs can be cryopreserved short-term without impaired B cell function irrespective of cell numbers frozen per vial, but it will be important to learn whether this also applies for long-term storage. While we have not studied this question in due detail yet, we have encouraging data suggesting that samples cryopreserved at 10 million PBMCs per vial fully maintain their B cell functionality in liquid nitrogen for at least 4 years; we have obtained blood by leukapheresis from donors after PCR-verified SARS-CoV-2 infection early on (starting in late 2020) and have repeatedly tested aliquots of them since, reproducing the original results obtained back then even after 4 years (Kirchenbaum, work in progress). Notably, for successful long-term storage of cryopreserved cell material it is important to avoid glass phase transitions [
37,
38] due to partial warming up of cells when aliquots are handled and/or removed from the liquid nitrogen storage tank.


