
Routine Immunisation Coverage Shows Signs of Recovery at Global Level Postpandemic, but Important Declines Persist in About 20% of Countries


Abstract
1. Introduction
- (1)
- Quantify global and country-level immunisation coverage trends in the pandemic and postpandemic period (years: 2020–2023) compared with prepandemic (years: 2000–2019) in terms of percentage coverage and number of immunisations;
- (2)
- Explore potential predictors that help in understanding routine immunisation country performance compared with expectations, factoring in country demographics, RI programme breadth, health financing, pandemic health system disruption, and COVID-19 policy responses.
2. Materials and Methods
2.1. Coverage Trends
2.2. Global and Country-Level Performance
2.3. Predicting RI Performance
3. Results
3.1. Coverage Trends
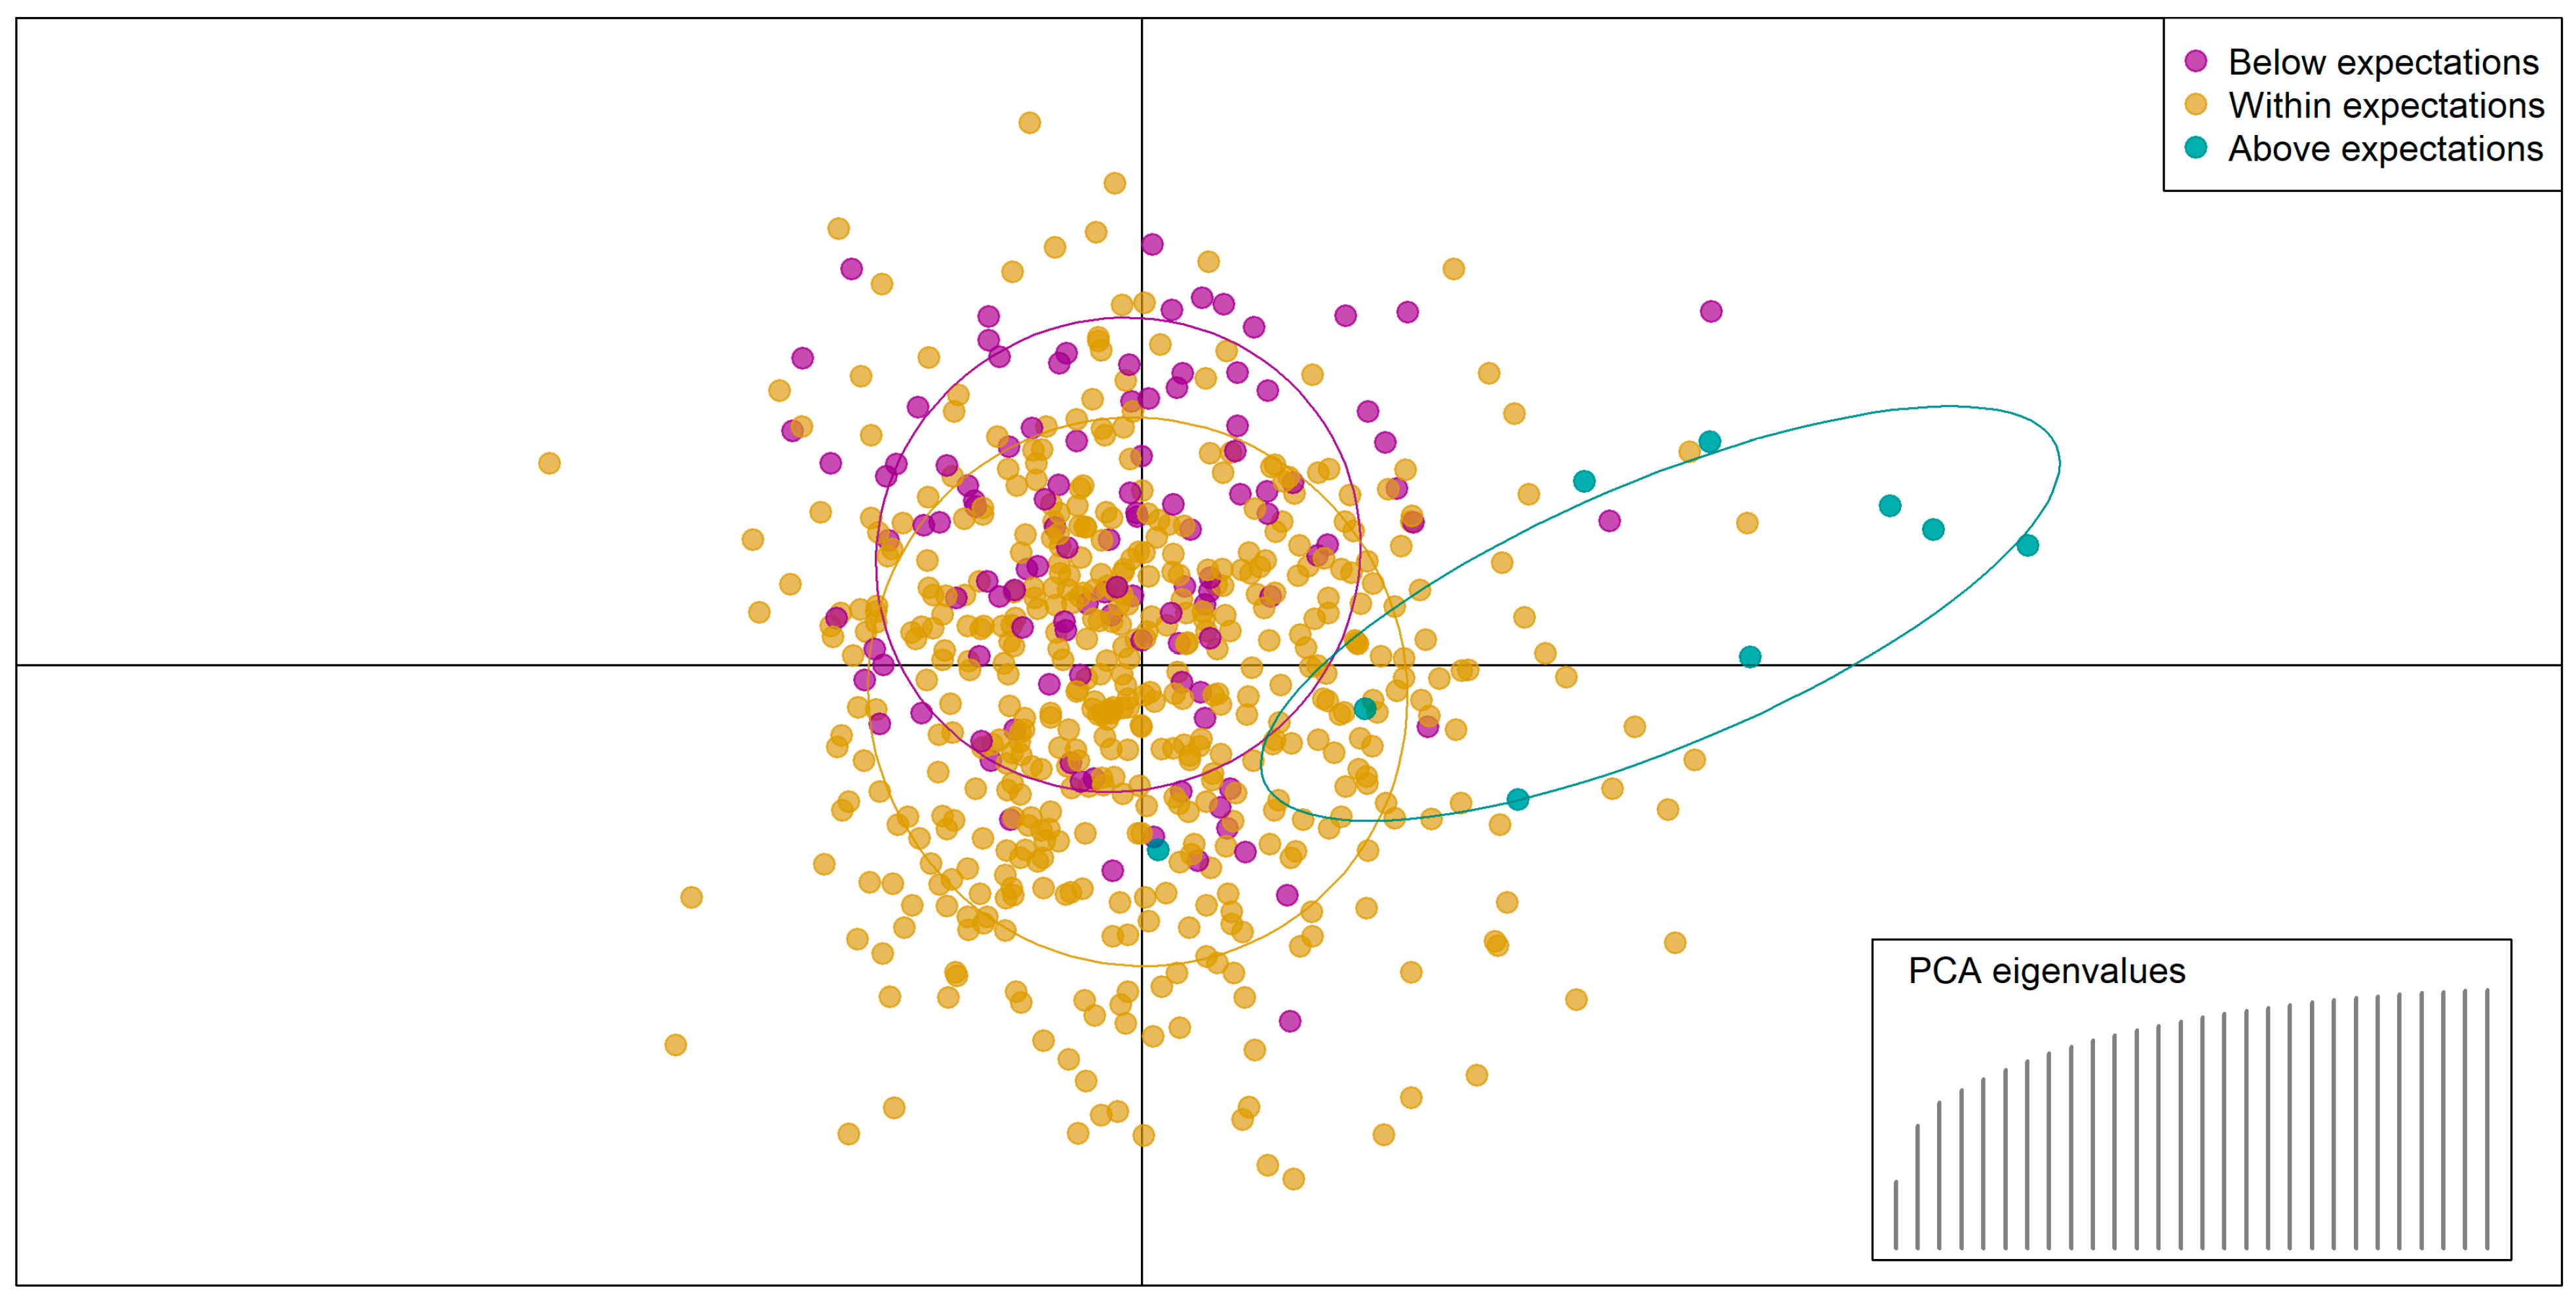
3.2. Predicting RI Performance
4. Discussion
Supplementary Materials
Author Contributions
Funding
Institutional Review Board Statement
Informed Consent Statement
Data Availability Statement
Conflicts of Interest
Abbreviations
| ARIMA | Autoregressive integrated moving average |
| DAPC | Discriminant analysis of principal components |
| DTP | Diphtheria–tetanus–pertussis |
| GDP | Gross domestic product |
| GHS | Global health security |
| MDA | Mean decrease in accuracy |
| MDI | Mean decrease in impurity |
| PCA | Principal component analysis |
| PAHO | Pan-American Health Organisation |
| PHEIC | Public health emergency of international concern |
| PPP | Purchasing power parity |
| RI | Routine immunisation |
| WHO | World Health Organisation |
| WUENIC | WHO and UNICEF Estimates of National Immunisation Coverage |
| UNICEF | United Nations Children’s Fund |
| UNWPP | United Nations World Population Prospects |
References
- World Health Organisation. Vaccines and Immunization. Available online: https://www.who.int/health-topics/vaccines-and-immunization#tab=tab_1 (accessed on 7 August 2023).
- Hartner, A.M.; Li, X.; Echeverria-Londono, S.; Roth, J.; Abbas, K.; Auzenbergs, M.; de Villiers, M.J.; Ferrari, M.J.; Fraser, K.; Fu, H.; et al. Estimating the Health Effects of COVID-19-Related Immunisation Disruptions in 112 Countries during 2020–30: A Modelling Study. Lancet Glob. Health 2024, 12, e563–e571. [Google Scholar] [CrossRef] [PubMed]
- World Health Organisation. Pulse Survey on Continuity of Essential Health Services During the COVID-19 Pandemic: Interim Report, 27 August 2020; World Health Organisation: Geneva, Switzerland, 2020. [Google Scholar]
- World Health Organisation. Second Round of the National Pulse Survey on Continuity of Essential Health Services During the COVID-19 Pandemic; World Health Organisation: Geneva, Switzerland, 2021. [Google Scholar]
- World Health Organisation. Third Round of the Global Pulse Survey on Continuity of Essential Health Services During the COVID-19 Pandemic; World Health Organisation: Geneva, Switzerland, 2022. [Google Scholar]
- Causey, K.; Fullman, N.; Sorensen, R.J.D.; Galles, N.C.; Zheng, P.; Aravkin, A.; Danovaro-Holliday, M.C.; Martinez-Piedra, R.; Sodha, S.V.; Velandia-González, M.P.; et al. Estimating Global and Regional Disruptions to Routine Childhood Vaccine Coverage During the COVID-19 Pandemic in 2020: A Modelling Study. Lancet 2021, 398, 522–534. [Google Scholar] [CrossRef]
- Evans, B.; Keiser, O.; Kaiser, L.; Jombart, T. Analysis of Global Routine Immunisation Coverage Shows Disruption and Stagnation During the First Two-Years of the COVID-19 Pandemic with Tentative Recovery in 2022. Vaccine X 2023, 15, 100383. [Google Scholar] [CrossRef] [PubMed]
- Burton, A.; Monasch, R.; Lautenbach, B.; Gacic-Dobo, M.; Neill, M.; Karimov, R.; Wolfson, L.; Jones, G.; Birmingham, M. WHO and UNICEF Estimates of National Infant Immunization Coverage: Methods and Processes. Bull. World Health Organ. 2009, 87, 535–541. [Google Scholar] [CrossRef] [PubMed]
- Burton, A.; Kowalski, R.; Gacic-Dobo, M.; Karimov, R.; Brown, D. A Formal Representation of the WHO and UNICEF Estimates of National Immunization Coverage: A Computational Logic Approach. PLoS ONE 2012, 7, e47806. [Google Scholar] [CrossRef]
- Bhattacharjee, N.V.; Schumacher, A.E.; Aali, A.; Abate, Y.H.; Abbasgholizadeh, R.; Abbasian, M.; Abbasi-Kangevari, M.; Abbastabar, H.; ElHafeez, S.A.; Abd-Elsalam, S.; et al. Global Fertility in 204 Countries and Territories, 1950–2021, with Forecasts to 2100: A Comprehensive Demographic Analysis for the Global Burden of Disease Study 2021. Lancet 2024, 403, 2057–2099. [Google Scholar] [CrossRef]
- United Nations. World Population Prospects-Population Division-United Nations. Available online: https://population.un.org/wpp/ (accessed on 25 August 2024).
- Harris, R.C.; Chen, Y.; Côte, P.; Ardillon, A.; Nievera, M.C.; Ong-Lim, A.; Aiyamperumal, S.; Chong, C.P.; Kandasamy, K.V.; Mahenthiran, K.; et al. Impact of COVID-19 on Routine Immunisation in South-East Asia and Western Pacific: Disruptions and Solutions. Lancet Reg. Health West. Pac. 2021, 10, 100140. [Google Scholar] [CrossRef]
- Cardoso Pinto, A.M.; Shariq, S.; Ranasinghe, L.; Budhathoki, S.S.; Skirrow, H.; Whittaker, E.; Seddon, J.A. Reasons for Reductions in Routine Childhood Immunisation Uptake during the COVID-19 Pandemic in Low- and Middle-Income Countries: A Systematic Review. PLoS Glob. Public Health 2023, 3, e0001415. [Google Scholar] [CrossRef]
- World Health Organisation Statement on the Fifteenth Meeting of the IHR (2005) Emergency Committee on the COVID-19 Pandemic. Available online: https://www.who.int/news/item/05-05-2023-statement-on-the-fifteenth-meeting-of-the-international-health-regulations-(2005)-emergency-committee-regarding-the-coronavirus-disease-(covid-19)-pandemic (accessed on 23 January 2025).
- Evans, B.; Jombart, T. Worldwide Routine Immunisation Coverage Regressed during the First Year of the COVID-19 Pandemic. Vaccine 2022, 40, 3531–3535. [Google Scholar] [CrossRef]
- Hyndman, R.J.; Khandakar, Y. Automatic Time Series Forecasting: The Forecast Package for R. J. Stat. Softw. 2008, 27, 1–22. [Google Scholar] [CrossRef]
- Hogan, D.; Gupta, A. Why Reaching Zero-Dose Children Holds the Key to Achieving the Sustainable Development Goals. Vaccines 2023, 11, 781. [Google Scholar] [CrossRef] [PubMed]
- O’brien, K.L.; Lindstrand, A.; Cherian, T.; Chang-Blanc, D.; Feikin, D. The World of Immunization: Achievements, Challenges, and Strategic Vision for the Next Decade. J. Infect. Dis. 2021, 224, 452–467. [Google Scholar] [CrossRef]
- WUENIC WHO UNICEF Immunization Coverage Estimates 2023 Revision. Available online: https://data.unicef.org/resources/dataset/immunization/ (accessed on 15 August 2023).
- WHO. Immunization Data Portal-All Data. Available online: https://immunizationdata.who.int/global?topic=&location= (accessed on 27 January 2025).
- World Health Organisation. Coverage of Essential Health Services (Index Based on Tracer Interventions That Include Reproductive, Maternal, Newborn and Child Health, Infectious Diseases, Non-Communicable Diseases and Service Capacity and Access) (SDG 3.8.1). Available online: https://platform.who.int/data/maternal-newborn-child-adolescent-ageing/indicator-explorer-new/MCA/coverage-of-essential-health-services-(index-interventions-reproductive-maternal-newborn-and-child-health)-(sdg-3.8.1) (accessed on 5 March 2024).
- World Health Organization. The National Health Workforce Accounts Database. Available online: https://www.who.int/data/gho/data/themes/topics/health-workforce (accessed on 7 August 2024).
- Global Health Security Index GHS Index. Available online: https://ghsindex.org/about/ (accessed on 28 February 2024).
- World Health Organisation. Global Health Expenditure Database. Available online: https://apps.who.int/nha/database/Select/Indicators/en (accessed on 9 March 2024).
- World Bank GDP per Capita, PPP (Current International $)|Data. Available online: https://data.worldbank.org/indicator/NY.GDP.PCAP.PP.CD (accessed on 9 August 2024).
- The Economist The Pandemic’s True Death Toll. Available online: https://www.economist.com/graphic-detail/coronavirus-excess-deaths-estimates (accessed on 3 May 2024).
- Our World in Data Estimated Cumulative Excess Deaths Per 100,000 People During COVID, from The Economist. Available online: https://ourworldindata.org/grapher/excess-deaths-cumulative-per-100k-economist (accessed on 9 September 2024).
- Hale, T.; Angrist, N.; Goldszmidt, R.; Kira, B.; Petherick, A.; Phillips, T.; Webster, S.; Cameron-Blake, E.; Hallas, L.; Majumdar, S.; et al. A Global Panel Database of Pandemic Policies (Oxford COVID-19 Government Response Tracker). Nat. Hum. Behav. 2021, 5, 529–538. [Google Scholar] [CrossRef] [PubMed]
- OxCGRT/Covid-Policy-Dataset: Systematic Dataset of COVID-19 Policy, from Oxford University. Available online: https://github.com/OxCGRT/covid-policy-dataset (accessed on 17 March 2025).
- Lachenbruch, P.A.; Goldstein, M. Discriminant Analysis. Biometrics 1979, 35, 69. [Google Scholar] [CrossRef]
- Fisher, R.A. The Use of Multiple Measurements in Taxonomic Problems. Ann. Eugen. 1936, 7, 179–188. [Google Scholar] [CrossRef]
- Hotelling, H. Analysis of a Complex of Statistical Variables into Principal Components. J. Educ. Psychol. 1933, 24, 417–441. [Google Scholar] [CrossRef]
- Karl Pearson, L., III. On Lines and Planes of Closest Fit to Systems of Points in Space. Lond. Edinb. Dublin Philos. Mag. J. Sci. 1901, 2, 559–572. [Google Scholar] [CrossRef]
- Legendre, P.; Legendre, L. Numerical Ecology; Elsevier: Amsterdam, The Netherlands, 2012; Volume 24, ISBN 9780444538697. [Google Scholar]
- Ho, T.K. Random Decision Forests. In Proceedings of the International Conference on Document Analysis and Recognition, Montreal, QC, Canada, 14–16 August 1995; Volume 1, pp. 278–282. [Google Scholar] [CrossRef]
- Evans, B. Bevans249/Ri_post_pandemic: Quantification of Post-Pandemic (2023) Routine Immunisation Coverage Trends and Exploration of Variables to Classify Country Performance. Available online: https://github.com/bevans249/ri_post_pandemic (accessed on 21 March 2025).
- Global Partners Announce a New Effort–“The Big Catch-up”–to Vaccinate Millions of Children and Restore Immunization Progress Lost During the Pandemic. Available online: https://www.who.int/news/item/24-04-2023-global-partners-announce-a-new-effort-the-big-catch-up-to-vaccinate-millions-of-children-and-restore-immunization-progress-lost-during-the-pandemic (accessed on 15 August 2023).
- Aheto, J.M.K.; Olowe, I.D.; Chan, H.M.T.; Ekeh, A.; Dieng, B.; Fafunmi, B.; Setayesh, H.; Atuhaire, B.; Crawford, J.; Tatem, A.J.; et al. Geospatial Analyses of Recent Household Surveys to Assess Changes in the Distribution of Zero-Dose Children and Their Associated Factors before and during the COVID-19 Pandemic in Nigeria. Vaccines 2023, 11, 1830. [Google Scholar] [CrossRef]
- Troiano, G.; Nardi, A. Vaccine Hesitancy in the Era of COVID-19. Public Health 2021, 194, 245–251. [Google Scholar] [CrossRef]
- Matthijssen, M.A.M.; Cloin, M.; van Leeuwen, F.; van de Goor, I.; Achterberg, P. What Made People (More) Positive toward the COVID-19 Vaccine? Exploring Positive and Negative Deviance Perspectives. BMC Public Health 2025, 25, 441. [Google Scholar] [CrossRef]
- He, K.; Mack, W.J.; Neely, M.; Lewis, L.; Anand, V. Parental Perspectives on Immunizations: Impact of the COVID-19 Pandemic on Childhood Vaccine Hesitancy. J. Community Health 2022, 47, 39–52. [Google Scholar] [CrossRef]
- Skirrow, H.; Lewis, C.; Haque, H.; Choundary-Salter, L.; Foley, K.; Whittaker, E.; Costelloe, C.; Bedford, H.; Saxena, S. The Impact of the COVID-19 Pandemic on UK Parents’ Attitudes towards Routine Childhood Vaccines: A Mixed-Methods Study. PLoS ONE 2024, 19, e0306484. [Google Scholar] [CrossRef]


| Field | Variables Included | Source |
|---|---|---|
| Health system descriptors (n = 6) | Prepandemic immunisation system strength: mean DTP3 coverage (mean 2015–2019) | WUENIC [19] |
| Immunisation system breadth: number of vaccines in infant immunisation schedule (latest data) | WHO [20] | |
| Broader health system strength: Universal Health Coverage index (2019) | WHO [21] | |
| Health workforce capacity: including (i) mean number of doctors and (ii) mean number of nurses (mean 2015–2019 per 100,000 population) | WHO [22] | |
| Global health security index (2019) | GHS Index [23] | |
| Financial indicators (n = 4) | Health financing: broken into (i) government expenditure, (ii) external (donor) investment, and (iii) private financing, i.e., out-of-pocket payments and certain insurance (mean 2015–2019 USD purchasing power parity, PPP) | WHO [24] |
| Country wealth: gross domestic product (GDP; mean 2015–2019 per capita) | World Bank [25] | |
| Pandemic impact (n = 17) | COVID-19 direct health burden: proxy based on number of excess deaths per 100,000 people per year (2020–2022) | Economist [26,27] |
| Eight containment policies per year (2020–2022): stringency of (i) school closures, (ii) workplace closures, (iii) cancellation of public events, (iv) restrictions on gatherings, (v) public transport closures, (vi) stay-at-home orders, (vii) internal movement restrictions, (viii) international travel controls | Oxford COVID-19 Government Response Tracker [28,29] | |
| Two economic policies per year (2020–2022): extent of (i) income support and (ii) debt relief during the pandemic | Oxford COVID-19 Government Response Tracker [28,29] | |
| Six health policies per year (2020–2022): extent of (i) public information campaigns, (ii) COVID-19 lab/diagnostic testing policies, (iii) contact tracing efforts, (iv) mask wearing requirements, (v) availability of COVID-19 vaccines, and (vi) protection of elderly populations | Oxford COVID-19 Government Response Tracker [28,29] | |
| Country descriptors (n = 1) | Population: total population (mean 2020–2023) | UNWPP [11] |
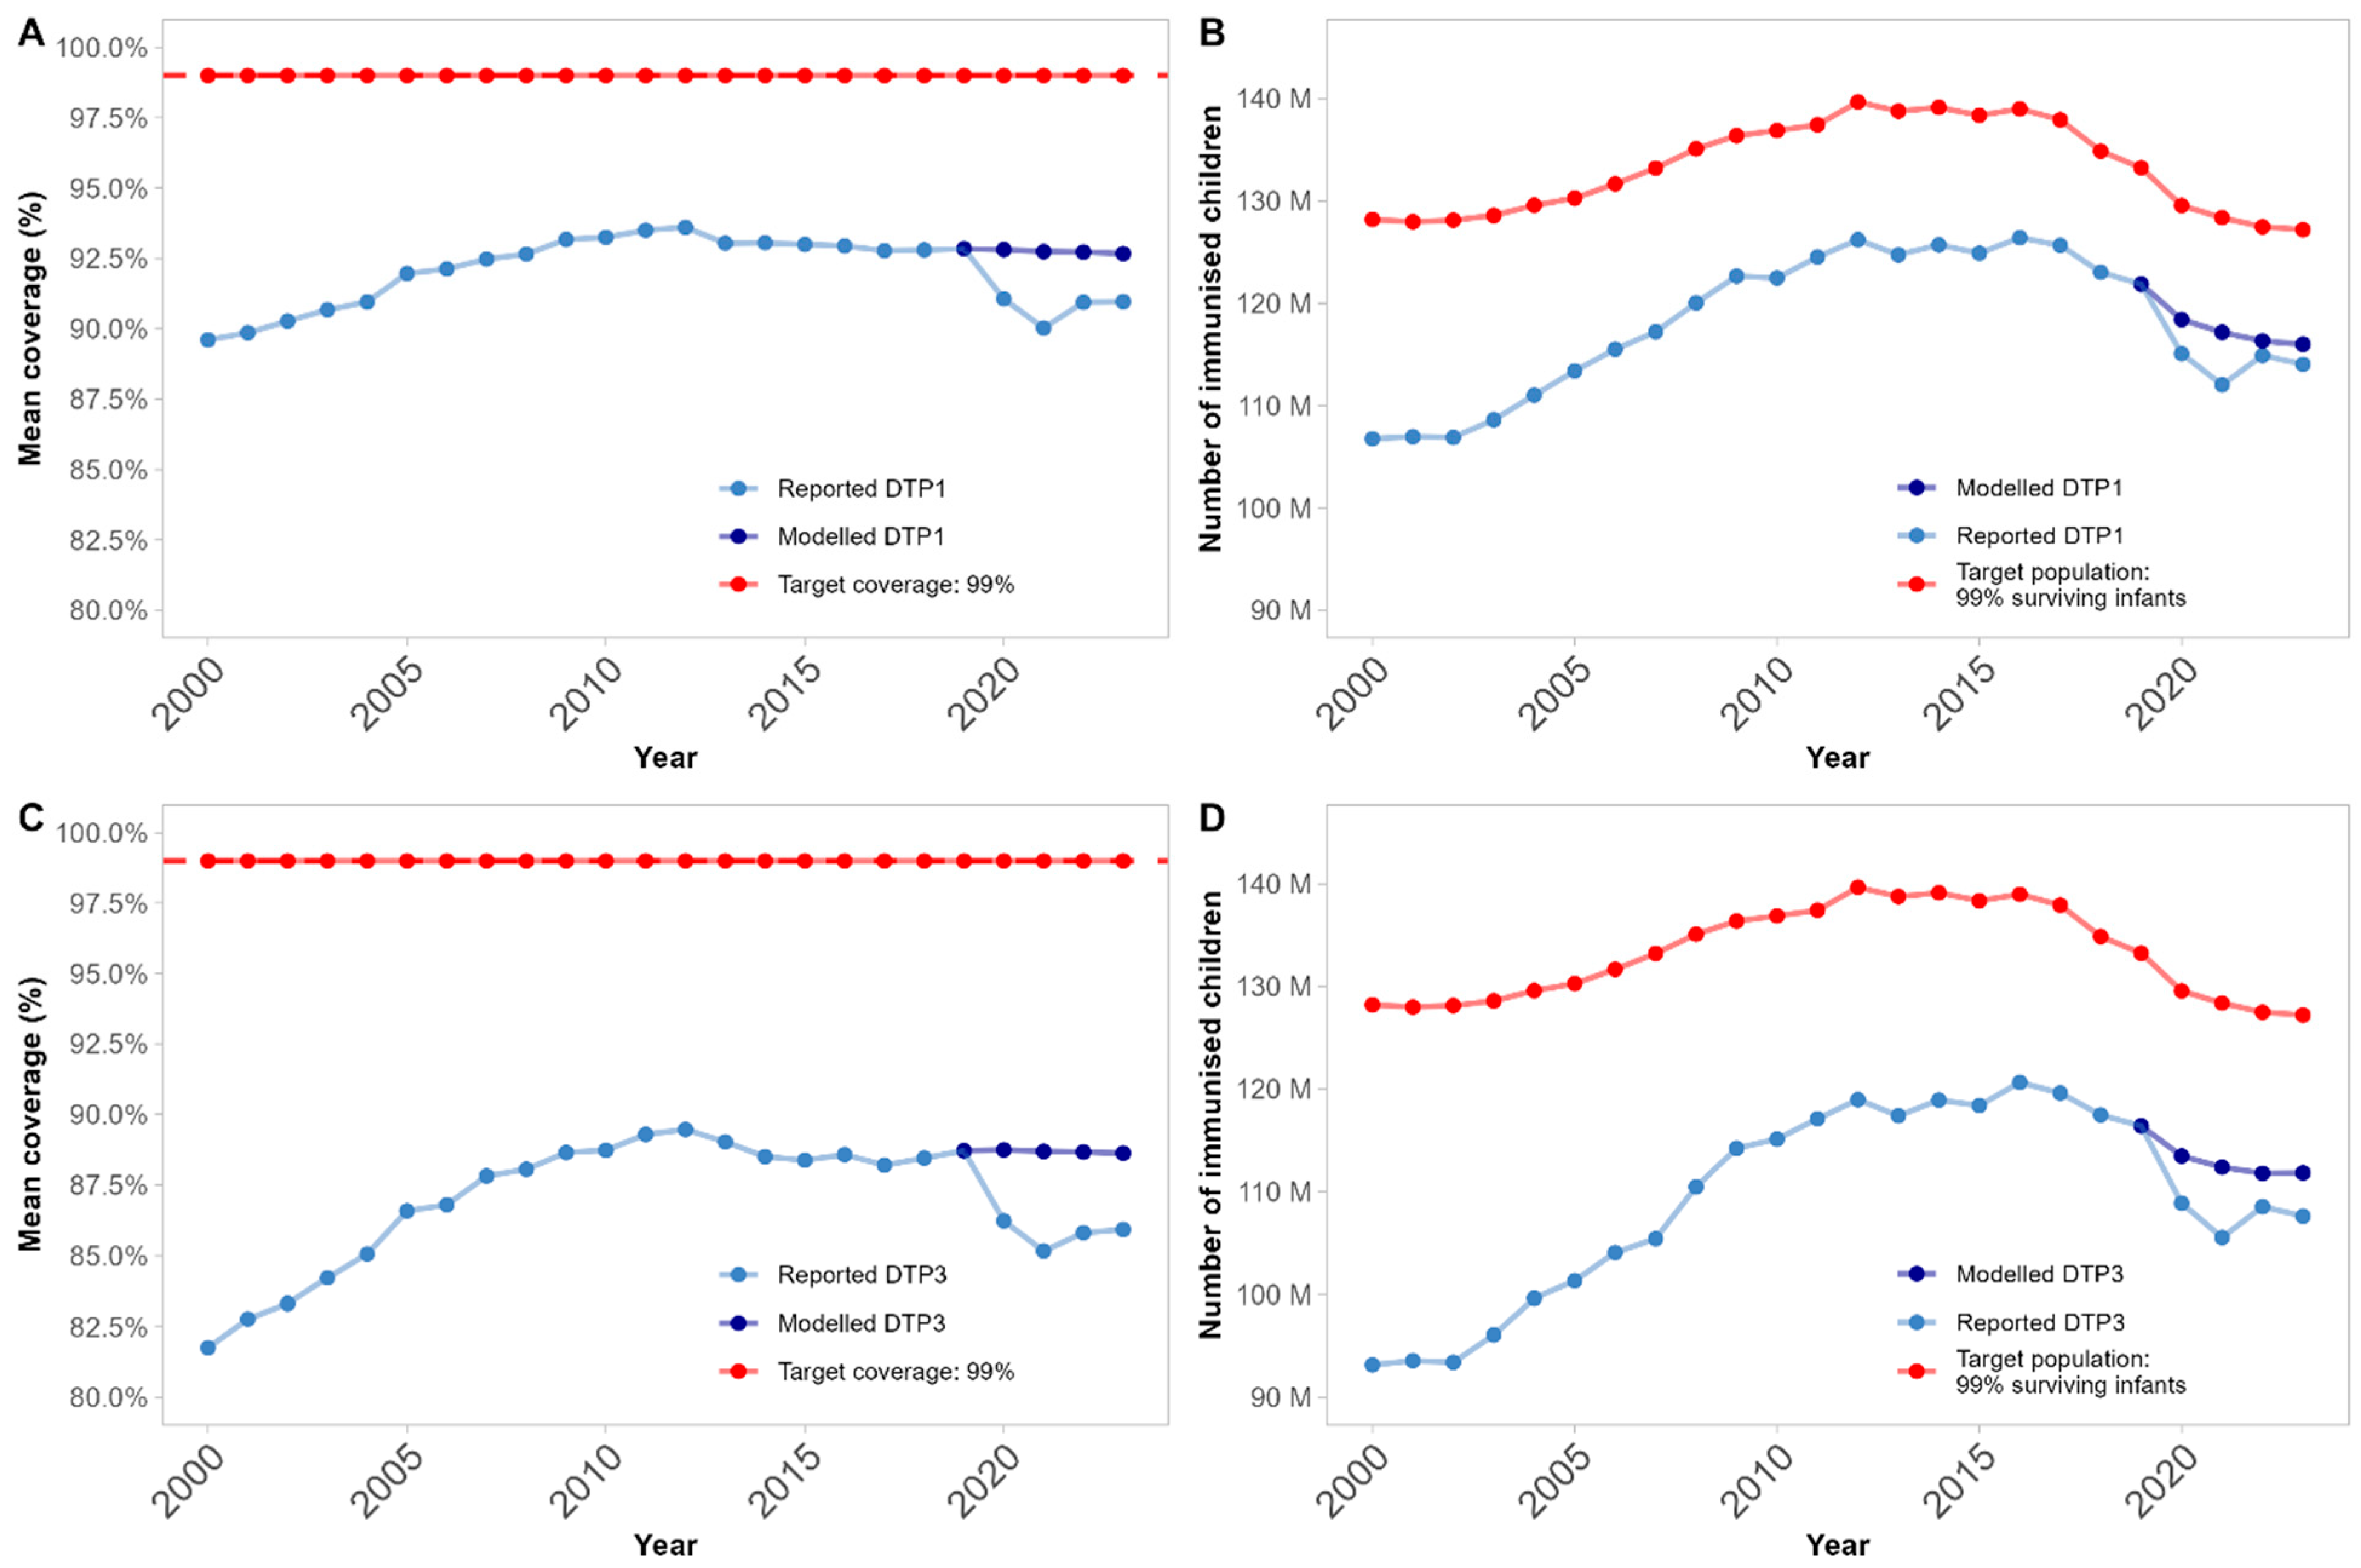
| Year | Expected | Reported | Delta [95% CIs] | p-Value |
|---|---|---|---|---|
| 2020 | 88.7% | 86.2% | −2.5% [−1.7%; −3.3%] | <0.0001 |
| 2021 | 88.7% | 85.2% | −3.5% [−2.3%; −4.7%] | <0.0001 |
| 2022 | 88.7% | 85.8% | −2.9% [−1.4%; −4.3%] | 0.0002 |
| 2023 | 88.6% | 85.9% | −2.7% [−1.1%; −4.3%] | 0.0008 |
| Year | Expected | Reported | Delta [95% CIs] | p-Value |
|---|---|---|---|---|
| 2020 | 597,036 | 572,857 | −24,180 [−4755; −43,605] | 0.02 |
| 2021 | 591,324 | 555,302 | −36,022 [−10,597; −61,448] | 0.006 |
| 2022 | 588,180 | 571,111 | −17,069 [−3366; −30,772] | 0.02 |
| 2023 | 588,432 | 566,191 | −22,240 [−212; −44,269] | 0.05 |
Disclaimer/Publisher’s Note: The statements, opinions and data contained in all publications are solely those of the individual author(s) and contributor(s) and not of MDPI and/or the editor(s). MDPI and/or the editor(s) disclaim responsibility for any injury to people or property resulting from any ideas, methods, instructions or products referred to in the content. |
© 2025 by the authors. Licensee MDPI, Basel, Switzerland. This article is an open access article distributed under the terms and conditions of the Creative Commons Attribution (CC BY) license (https://creativecommons.org/licenses/by/4.0/).
Share and Cite
Evans, B.; Kaiser, L.; Keiser, O.; Jombart, T. Routine Immunisation Coverage Shows Signs of Recovery at Global Level Postpandemic, but Important Declines Persist in About 20% of Countries. Vaccines 2025, 13, 388. https://doi.org/10.3390/vaccines13040388
Evans B, Kaiser L, Keiser O, Jombart T. Routine Immunisation Coverage Shows Signs of Recovery at Global Level Postpandemic, but Important Declines Persist in About 20% of Countries. Vaccines. 2025; 13(4):388. https://doi.org/10.3390/vaccines13040388
Chicago/Turabian StyleEvans, Beth, Laurent Kaiser, Olivia Keiser, and Thibaut Jombart. 2025. "Routine Immunisation Coverage Shows Signs of Recovery at Global Level Postpandemic, but Important Declines Persist in About 20% of Countries" Vaccines 13, no. 4: 388. https://doi.org/10.3390/vaccines13040388
APA StyleEvans, B., Kaiser, L., Keiser, O., & Jombart, T. (2025). Routine Immunisation Coverage Shows Signs of Recovery at Global Level Postpandemic, but Important Declines Persist in About 20% of Countries. Vaccines, 13(4), 388. https://doi.org/10.3390/vaccines13040388