Article

Discrepancy in SARS-CoV-2 Infection Status Among PCR, Serological, and Cellular Immunity Assays of Nucleocapsids: A Historical Cohort Study

1
Department of Radiation Health Management, Fukushima Medical University School of Medicine, Fukushima City 960-1295, Fukushima, Japan
2
Global Exchange Center, Fukushima Medical University School of Medicine, Fukushima City 960-1247, Fukushima, Japan
3
Department of General Internal Medicine, Hirata Central Hospital, Hirata 963-8202, Fukushima, Japan
4
Proteomics Laboratory, Isotope Science Center, The University of Tokyo, Tokyo 113-8654, Japan
5
Laboratory for Systems Biology and Medicine, Research Center for Advanced Science and Technology, The University of Tokyo, Tokyo 113-8654, Japan
6
Medical & Biological Laboratories Co., Ltd., Tokyo 105-0012, Japan
7
General Incorporated Association for Comprehensive Disaster Health Management Research Institute, Tokyo 108-0074, Japan
*
Author to whom correspondence should be addressed.
Vaccines 2025, 13(3), 259; https://doi.org/10.3390/vaccines13030259
Submission received: 1 January 2025 / Revised: 14 February 2025 / Accepted: 25 February 2025 / Published: 28 February 2025
(This article belongs to the Special Issue Understanding Immune Responses to COVID-19 Vaccines)

Abstract

:
Background/Objectives: Limited research has compared tests assessing humoral and cellular immunity related to SARS-CoV-2 infection. This study evaluated immunoglobulin G for nucleocapsid (IgG(N)) and T-spot for nucleocapsid (T-spot(N)) assays against polymerase chain reaction (PCR) test results for identifying infected individuals. Methods: This study included participants who had completed five blood samplings since their second COVID-19 vaccination between 9 September 2021 and 6 November 2022. Chemiluminescent immunoassay (CLIA) tests measured the humoral immune response, IgG(S) and neutralizing activity tests the immune status, and IgG(N) tests the infection history. For cellar immunity, T-spot(S) indicated immune status, and T-spot(N) indicated infection history. Results: The primary outcome was the proportion of individuals who tested positive for PCR and the proportion who tested positive for IgG(N) and T-spot(N). Overall, this study included 2104 participants. In the PCR-negative group, 1838 individuals tested negative for IgG(N), whereas 64 tested positive at least once. The geometric mean of IgG(S) at T5 was 1541.7 AU/mL in the IgG(N)-negative group and 3965.8 AU/mL in the IgG(N)-positive group, which was 2.6 times higher. In the PCR-positive group, 25 individuals tested negative for IgG(N), while 177 tested positive at least once. The geometric mean of IgG(S) at T5 was 2700.6 AU/mL in the IgG(N)-negative group and 5400.8 AU/mL in the IgG(N)-positive group, showing higher values in the IgG(N)-positive group. Conclusions: A discrepancy was noted between PCR test results and the IgG(N) and T-spot(N) determinations. Combining multiple assays is required to accurately identify the past-infected population.

1. Introduction

Since its initial detection in China in December 2019, severe acute respiratory syndrome coronavirus 2 (SARS-CoV-2) has rapidly spread worldwide, causing a global pandemic. This highly contagious virus spreads primarily through droplet transmission, contact transmission, and aerosol transmission, with droplets being the main mode of propagation [1]. Effective infection control measures include isolating infected individuals and preventing contact between infected and non-infected individuals. In clinical settings, the SARS-CoV-2 diagnosis relies on polymerase chain reaction (PCR), antigen, and antibody tests. PCR and antigen tests primarily detect current infections, while antibody tests can indicate past or ongoing infections, particularly in later stages. PCR tests offer high accuracy yet require specialized equipment and skilled operators, making them costly and time-consuming. Rapid antigen tests typically yield quick results in 15 to 30 min and are simple and inexpensive [2]. However, their sensitivity is lower than that of PCR tests, often resulting in false-negative outcomes [3]. Addressing these limitations in detecting SARS-CoV-2 infection is crucial for swiftly and accurately identifying infected individuals to prevent further spread.
Numerous studies have explored strategies to efficiently identify infected individuals by combining various tests, each with its own advantages and disadvantages. Each test often presents false positives or false negatives. For example, RT-PCR tests may yield negative results during the initial days of infection or after recovery, when the viral load is low. Antibody tests may also be negative early in the infection, owing to the absence of antibodies, whereas, in previously infected individuals, cross-reactivity might cause positive results despite the lack of current infection. Antigen tests targeting specific and highly reactive viral antigens that precede antibody production are less likely to present false positives or negatives [4]. Additionally, a portion of SARS-CoV-2-infected individuals are asymptomatic [5]. Asymptomatic carriers of COVID-19 can transmit SARS-CoV-2, with their infectivity being similar to that of symptomatic patients [6]. Despite such studies, few have compared multiple tests to evaluate both humoral and cellular immunity concerning SARS-CoV-2 infection.
On 8 May 2023, Japan eased regulations on SARS-CoV-2, prompting the Ministry of Health, Labour and Welfare to shift from comprehensive monitoring to sentinel surveillance to understand the epidemic status of COVID-19. This change made tracking COVID-19 cases difficult, leading to outbreaks in medical facilities and schools, highlighting its significance in Japan. Fukushima Prefecture, located in the Tohoku region, experienced unprecedented devastation from the 2011 earthquake in Great East Japan and the Fukushima Daiichi Nuclear Power Plant accident [7]. These experiences fostered ongoing collaboration across community, local government, and public and private healthcare sectors for over a decade [8,9,10]. During the COVID-19 pandemic, leveraging this regional cooperation, the Fukushima Vaccine Community Survey was conducted in Hirata Village, Soma City, and Minamisoma City within Fukushima Prefecture [11,12]. This survey involved regular blood sampling of residents and healthcare workers to observe changes in SARS-CoV-2 antibody titers post-vaccination. Approximately 2500 individuals participated, making it one of the most comprehensive sources of information on post-vaccination antibody titers nationwide. Hence, this region is ideal for community-level evaluation of various antibody titers and test results.
Various testing methods are employed to diagnose COVID-19; however, few studies have compared the results from multiple methods. This study aimed to compare the results of multiple tests conducted within the same cohort to determine SARS-CoV-2 infection during the pandemic. IgG(N) and T-spot(N) determinations were compared with PCR results to identify infected individuals.

2. Materials and Methods

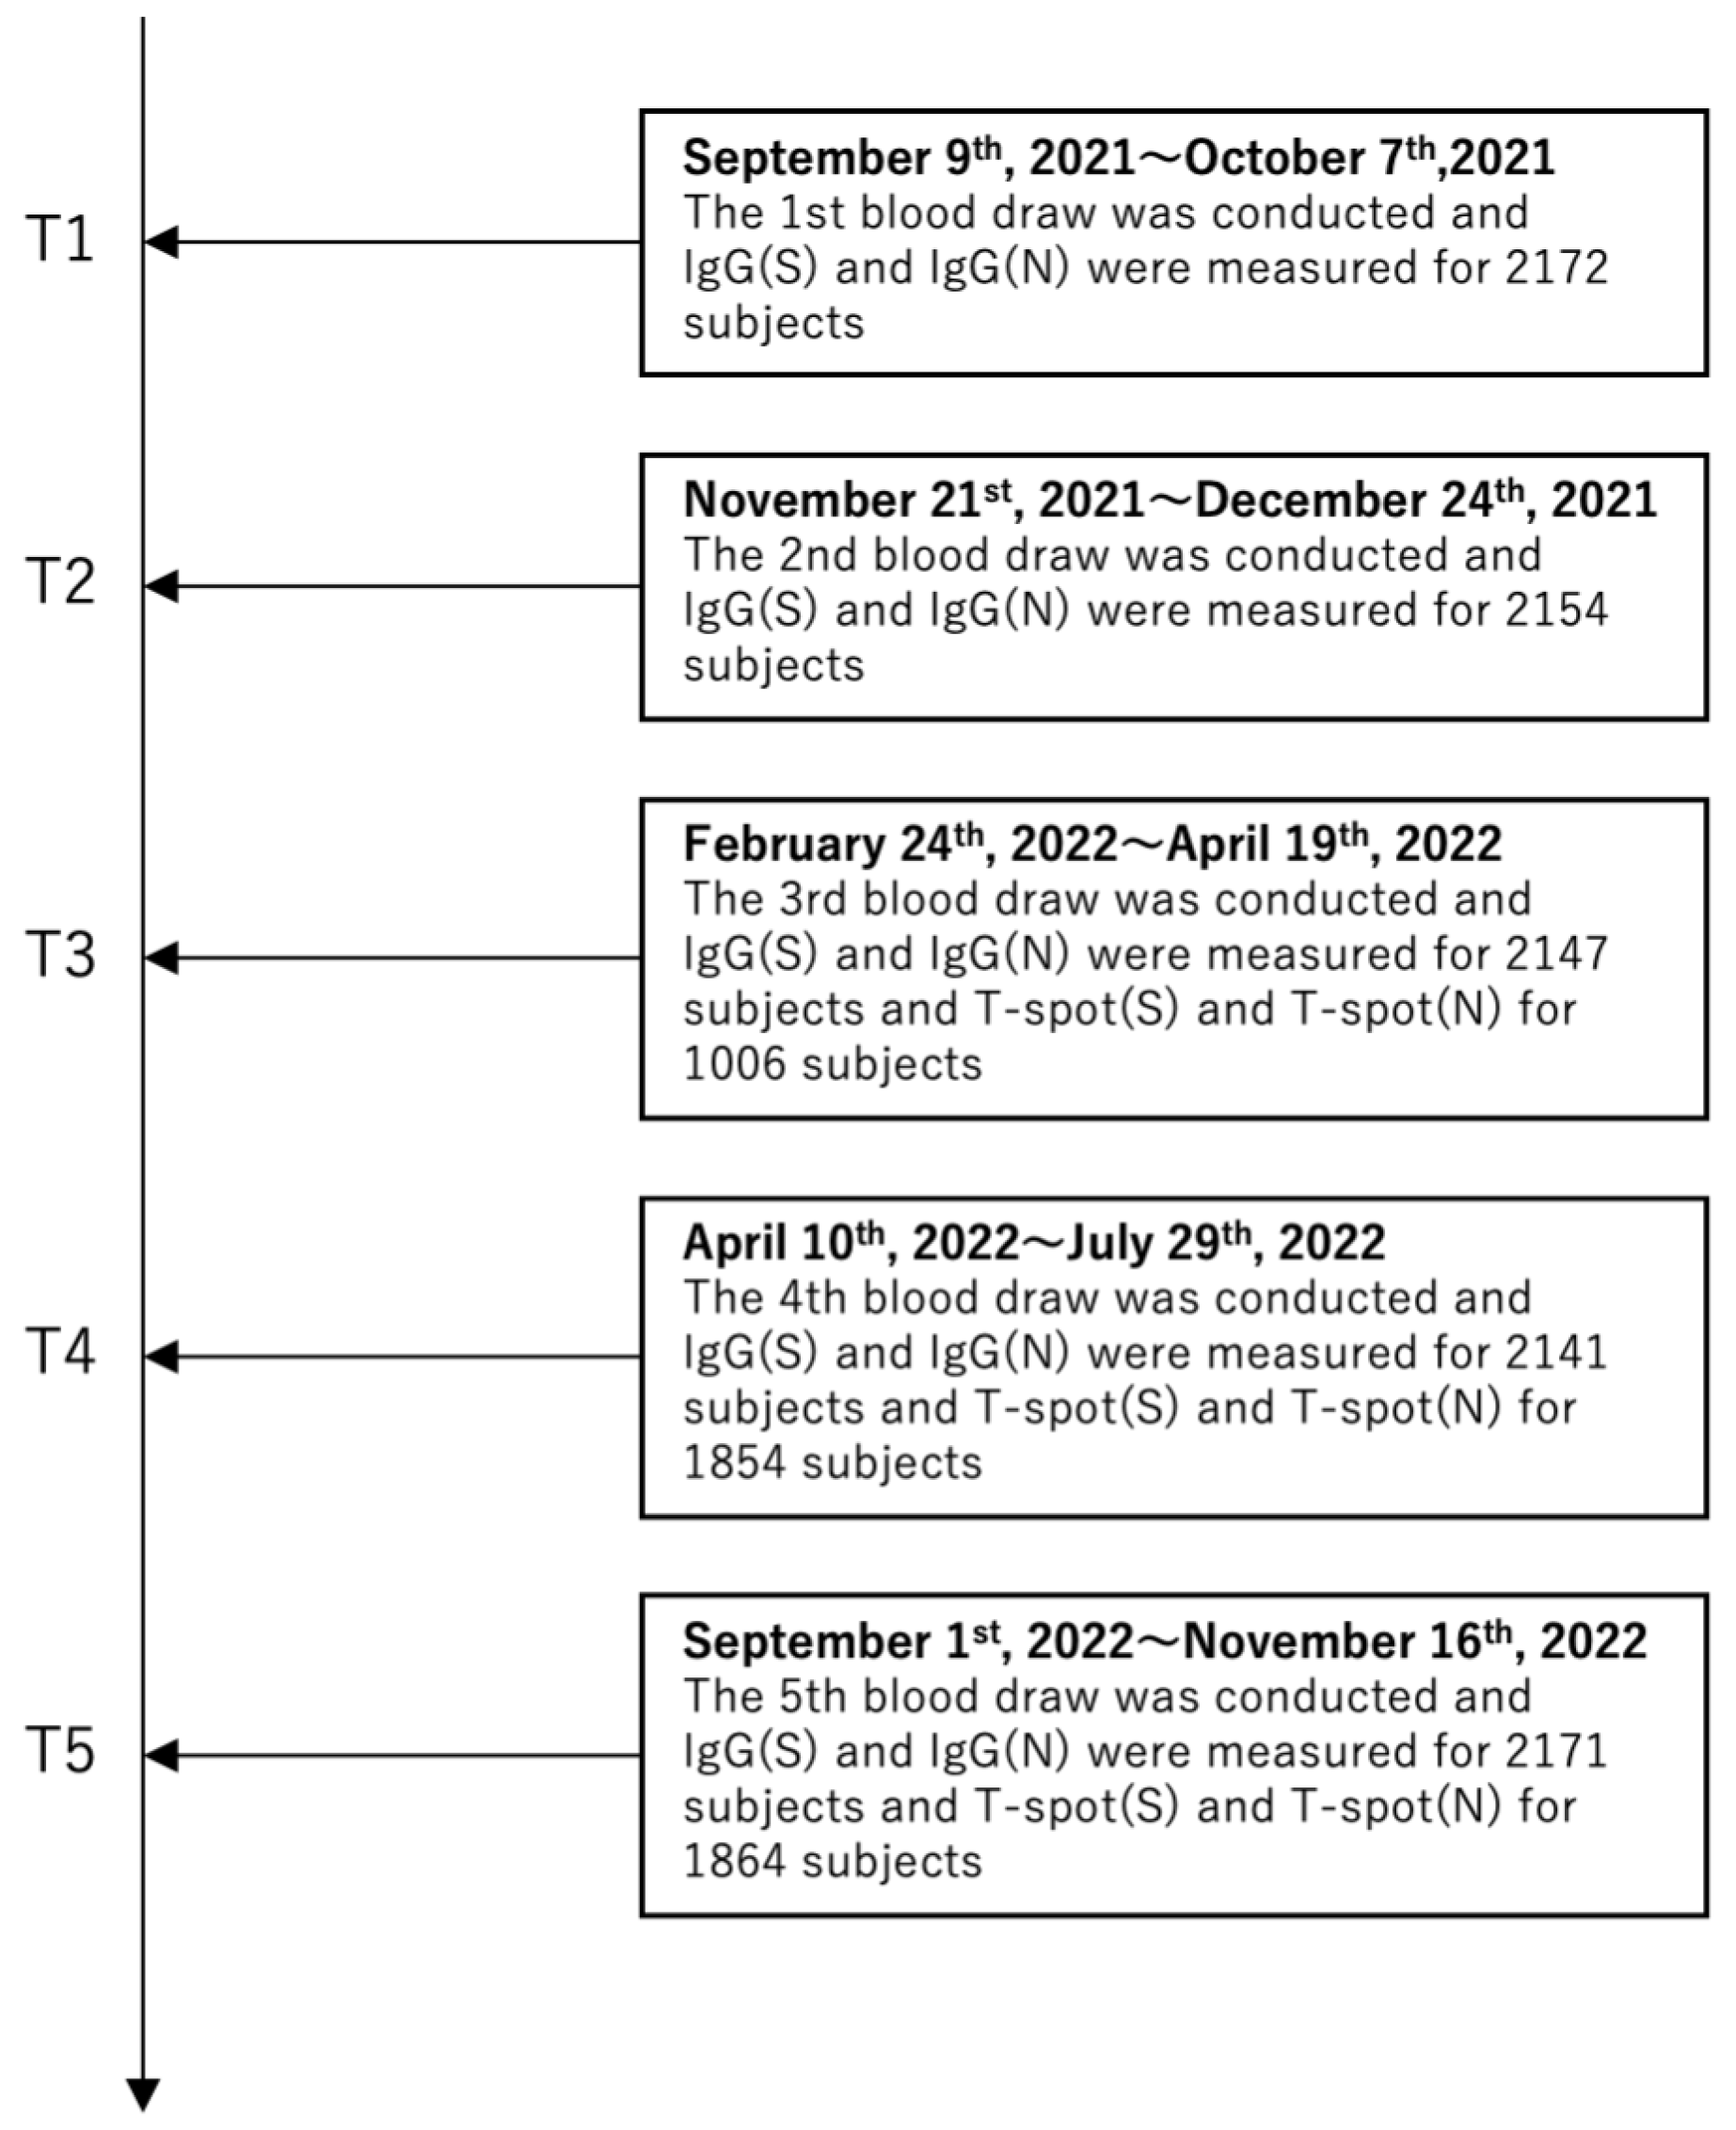
2.1. Study Design and Participants

This study is an observational historical cohort study that selected participants from the Fukushima cohort study for the Fukushima Vaccination Cohort Survey. Blood sampling occurred as follows: the first from 9 September to 7 October 2021 (T1); the second from 21 November to 24 December 2021 (T2); the third from 24 February to 19 April 2022 (T3); the fourth from 10 April to 29 July 2022 (T4); and the fifth from 1 September to 6 November 2022 (T5) (Figure 1). The blood sampling method was described elsewhere [11]. In total, 2527 participants were included in the entire cohort, and 354 participants were excluded without the infection status data. The study focused on individuals who completed all five samplings after their second COVID-19 vaccination; sixty-nine participants who did not have all of the data on five blood tests were excluded. Overall, 2104 participants were included in the final analysis. Data on participants’ age, sex, type of vaccine received, smoking history, drinking history, medication history, comorbidities, symptoms during infection, and consent to participate in the study were collected via a questionnaire survey. Regarding alcohol consumption, individuals who have opportunities to drink in their daily lives, including occasional or social drinking, were classified as alcohol consumers. At each sampling visit, a questionnaire was also used to investigate whether participants had undergone a PCR test since the last visit. If so, the PCR results (positive/negative) and the date of the PCR test were recorded. PCR tests were performed on healthcare providers and patients who had subjective symptoms such as fever or when clusters occurred at the healthcare facility. Written informed consent was obtained from all participants. This study was approved by the ethics committees of Hirata Central Hospital (number 2021-0611-1) and Fukushima Medical University (number 2021-116).

2.2. Serological Testing

Blood samples were processed by centrifugation to obtain serum-only samples, which were subsequently sent to the University of Tokyo for analysis. IgG antibody titers against the SARS-CoV-2 spike (S) protein, IgG antibody titers against the SARS-CoV-2 nucleocapsid (N) protein, and neutralizing activity were measured using chemiluminescent immunoassays with iFlash 3000 (YHLO Biotech, Shenzhen, China) and iFlash-2019-nCoV series reagents (YHLO Biotech). IgG(S) and neutralizing activity were used as indicators of immune status, whereas IgG(N) served as an indicator of infection history. The cut-off values of IgG(S), IgG(N), and neutralizing activity were 10 AU/mL.

2.3. Cellular Immune Response Measurements

Cellular immune responses were evaluated using the T-Spot COVID test (Oxford Immunotec, Abingdon, Cambridge, UK), an ELISpot interferon-γ release assay. Peripheral blood samples (10 mL) were collected in heparin lithium and EDTA tubes. Following the addition of T-cell Xtend reagent (Oxford Immunotec) and density gradient centrifugation to isolate peripheral blood mononuclear cells (PBMCs), 250,000 PBMCs per participant were added to each of the four wells: negative control, positive control, SARS-CoV-2 spike antigen, and SARS-CoV-2 nucleocapsid antigen. Stimulation of T cells in the SARS-CoV-2 antigen wells induced INF-γ production, detected by AP-labeled secondary antibodies and substrates to form INF-γ-producing spots. The results were interpreted by subtracting the number of spots in the negative control well from the number of spots in each well. Results interpretation followed official guidelines: <5 spots per well indicated non-reactivity, 5 to 7 spots was inconclusive, and ≥8 spots indicated reactivity. Tests with >10 spots in the negative control well were deemed invalid.

2.4. Primary Outcome

The primary outcome was the proportion of individuals who tested positive for PCR, IgG(N), and T-spot(N).

2.5. Statistical Analyses

First, descriptive summaries of participant information were compiled. Positive results for IgG(N) and T-spot(N) were descriptively summarized for individuals with and without infection. Geometric mean values of IgG(S) at T5 were presented for individuals who tested positive for IgG(N) at least once across all tests and those who never tested positive, categorized by infection history. Similarly, geometric mean values of T-spot(S) at T5 were shown for each group. Next, the relationships between different assays were figured. Then, symptoms among infected participants within each group of IgG(N), negative or positive, were summarized. Continuous or categorical variables are shown as median (interquartile) or number (percentage). The analysis in this study is descriptive, with categorical variables expressed as frequencies and percentages and antibody titers as geometric means and 95% confidence intervals. All statistical analyses were performed using STATA/IC15.

3. Results

3.1. Participant Characteristics

The number of participants for each blood test (T1–T5) is shown in Figure 1. The serological assay was performed between the T1 and T5 blood samplings; however, the cellular immune responses assay was performed only between the T3 and T5 blood samplings. Table 1 summarizes the demographic and health characteristics of the 2373 study participants. The average age of participants was 52 [38–68] years. The cohort comprised 1220 women and 884 men, with women accounting for 58.0% of the participants. By the fifth blood draw, 2070 individuals had received up to the third vaccine dose, and 1406 had received up to the fourth dose.

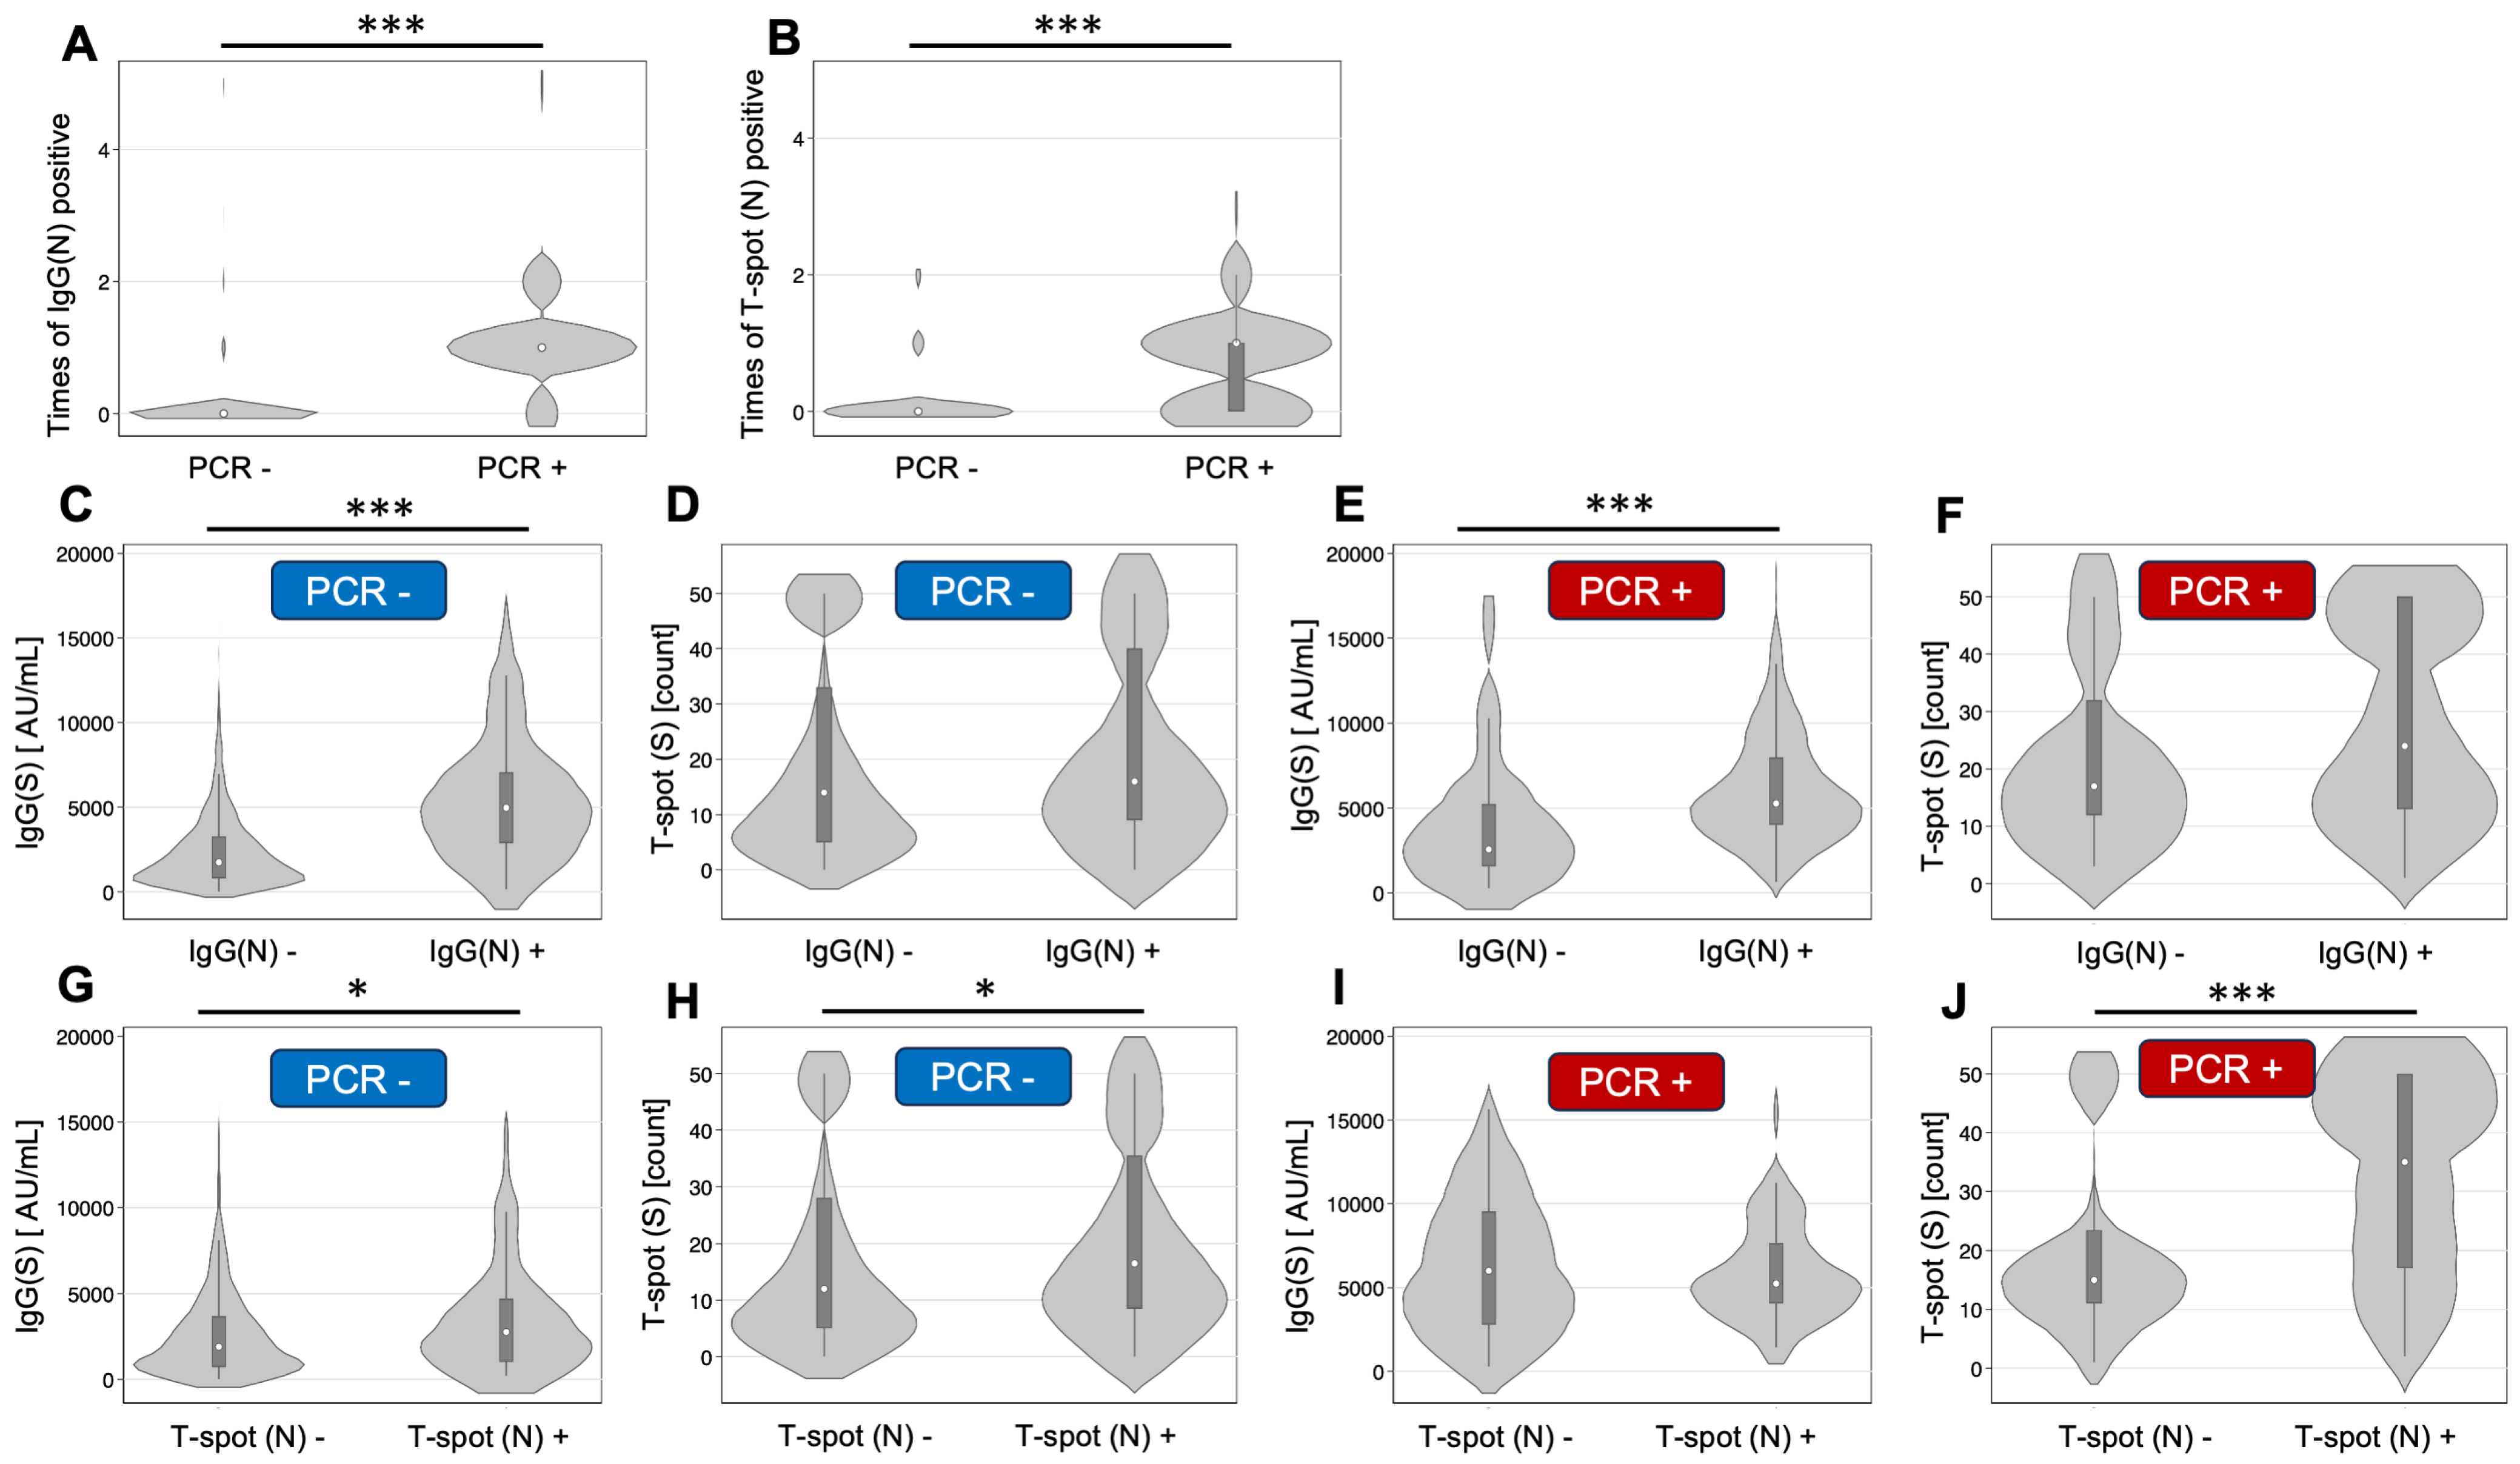
3.2. Relationship Between Infection Status and IgG(N) and T-spot(N)

Table 2 displays the frequency of positive results for IgG(N) and T-spot(N). Among the 1902 non-infected individuals, 40 (2.1%) were positive once for IgG(N), 14 (0.7%) twice, 1 (0.1%) three times, and 9 (0.5%) five times. Among the 202 infected individuals, 24 (11.9%) consistently tested negative for IgG(N). For T-spot(N), among the 865 non-infected individuals, 45 (5.2%) tested positive once and 60 (6.5%) twice. Among the 115 infected individuals, 48 (41.7%) tested negative for T-spot(N). The number of participants per frequency of positive IgG(N) and T-spot(N) among those who had all five IgG tests and all three T-spot tests were showed in Table S1.

3.3. Grouping by Infection History and IgG(N) Determination

For IgG(S), among the non-infected group, 1838 were IgG(N)-negative, and 64 were IgG(N)-positive at least once (Table 3). For non-infected participants, the geometric mean of IgG(S) at T5 was 1541.7 AU/mL in the IgG(N)-negative group and 3965.8 AU/mL in the IgG(N)-positive group, the latter being 2.57 times higher. Similarly, among the infected group, 25 were IgG(N)-negative, and 177 were IgG(N)-positive at least once. The geometric mean of IgG(S) at T5 was 2700.6 AU/mL in the IgG(N)-negative group and 5400.8 AU/mL in the IgG(N)-positive group, the latter being 2.0 times higher.
For T-spot(S), among the non-infected group, 1525 were IgG(N)-negative, and 52 were IgG(N)-positive at least once (Table 3). The geometric mean of T-spot(S) at T5 was 12.6 spots in the IgG(N)-negative group and 15.2 spots in the IgG(N)-positive group. Similarly, among the infected group, 17 were IgG(N)-negative, and 161 were IgG(N)-positive at least once. The geometric mean of T-spot(S) at T5 was 17.9 spots in the IgG(N)-negative group and 21.2 spots in the IgG(N)-positive group, the latter being 1.2 times higher.

3.4. Grouping by Infection History and T-spot(N) Status

For IgG(S), among the non-infected group, 789 were T-spot(N)-negative, and 72 were T-spot(N)-positive at least once (Table 4). For non-infected participants, the geometric mean of IgG(S) at T5 was 1556.7 AU/mL in the T-spot(N)-negative group and 2268.2 AU/mL in the T-spot(N)-positive group, the latter being 1.5 times higher. Similarly, among the infected group, 48 were T-spot(N) negative, and 70 were T-spot(N)-positive at least once. The geometric mean of IgG(S) at T5 was 4872.7 AU/mL in the T-spot(N)-negative group and 5277.0 AU/mL in the T-spot(N)-positive group, the latter being 1.1 times higher.
For T-spot(S), among the non-infected group, 755 were T-spot(N)-negative, and 71 were T-spot(N)-positive at least once (Table 4). For non-infected participants, the geometric mean of T-spot(S) at T5 was 11.4 spots in the T-spot(N)-negative group and 15.0 spots in the T-spot(N)-positive group, the latter being 1.3 times higher. Similarly, among the infected group, 48 were T-spot(N) negative, and 70 were T-spot(N)-positive at least once. For infected participants, the geometric mean of T-spot(S) at T5 was 15.1 spots in the T-spot(N)-negative group and 26.4 spots in the T-spot(N)-positive group, the latter being 1.8 times higher.

3.5. Relationships Between Different Assays

A summary of the relationships between different assays is shown in Figure 2. There were significant differences in the times of IgG(N) positivity by the results of PCR and the times of T-spot (N) positivity by the results of PCR (p < 0.001). The IgG(S) titers at T5 by the group of IgG(N) results were significantly different in both the positive PCR group and the negative PCR group (p < 0.001).

3.6. Symptoms Among Infected Participants

Symptoms among the infected participants within each group, IgG(N)-negative or -positive, were descriptively analyzed. Only sore throat was significantly higher among IgG(N)-positive groups (Table 5, p = 0.042).

4. Discussion

Accurate diagnosis of COVID-19 infected status among the population was important to the design of the strategy regarding infection control. In this study, five blood samples were collected from rural Japanese healthcare workers and residents between September 2021 and November 2022. IgG(N) and T-spot(N) results were compared with PCR findings to determine COVID-19 infection.
A discrepancy was noted between the PCR results and IgG(N) and T-spot(N) measurements. In this study, 2.1% (40/1902) and 8.5% (45/865) of participants tested positive for IgG(N) and T-spot(N), respectively, despite negative PCR results, indicating previous infection. The geometric mean values of IgG(S) and T-spot(S) at T5 were 1541.7 AU/mL and 12.6 in the IgG(N)-negative group and 3965.8 AU/mL and 15.2 in the IgG(N)-positive group, with geometric mean ratios of 2.6 and 1.2, respectively. These individuals likely had low viral loads or asymptomatic infection at the time of the study. Prior studies have shown that early infection and periods of convalescence often result in negative PCR tests due to low viral loads [3,13,14]. Additionally, some people have subclinical infections consistent with these results [15,16,17,18]. Multiple tests may be necessary to accurately determine true infection status [19,20,21,22].
Some individuals infected with coronaviruses had a weak immune response. In this study, 12.3% (25/202) and 41.7% (48/115) of participants had negative IgG(N) and T-spot(N), respectively, despite positive PCR tests. The geometric mean values of IgG(S) and T-spot(S) at T5 were 2700.6 AU/mL and 17.9 in the IgG(N)-negative population and 5400.8 AU/mL and 21.2 in the IgG(N)-positive population, with geometric mean ratios of 2.0 and 1.2, respectively. This means that IgG(S) antibody titers in PCR-positive, IgG(N)-negative individuals were 50.0% lower than those in IgG(N)-positive individuals. In a previous study, IgG(S) antibody titers were higher in IgG(N)-positive than in IgG(N)-negative individuals without a history of previous disease, consistent with these results [23]. These populations may include numerous people with inadequate IgG(N) and IgG(S) production, i.e., a reduced ability to produce antibodies. For example, people with underlying diseases, such as older patients or those undergoing hemodialysis, have low antibody titers after vaccination [23,24,25]. Given that some populations have reduced humoral and cellular immunity, using methods that do not rely on antibody production, such as PCR and antigen testing, is crucial to determine the infection history of these individuals.
SARS-CoV-2 infection may not be simply divided into infected or uninfected. Participants were classified into four groups based on PCR and IgG(N) test results. The IgG(S) antibody titers at T5 were PCR-positive and IgG(N)-positive (5400.8 AU/mL), PCR-positive and IgG(N)-negative (2700.6 AU/mL), PCR-negative and IgG(N)-positive (3965.8 AU/mL), and PCR-negative and IgG(N)-negative (1541.7 AU/mL). In summary, even with the same PCR results, antibody titers varied based on IgG(N) results, indicating that PCR alone may not fully categorize infection status. New models are needed for a comprehensive understanding of infectivity.
This study had several limitations. First, the study was biased toward a predominantly female population, with most of the participants being healthcare professionals (57.4% female). Second, the chemiluminescence immunoassay and T-Spot COVID-19 test used were research methods whose applicability in clinical settings is unclear. Third, the tests were conducted during the prevalence of the BA-5 strain, which limited their generalizability to other strains over time. Fourth, we did not clarify the period of PCR results performed before the first blood sampling. Fifth, we did not measure the viral load, and the assessment and interpretation of the time interval between the PCR test and antibody test were difficult; thus, we did not include this information. Despite these limitations, this is the first study to classify participants into several groups based on IgG(N) and T-spot(N) determinations and PCR results and to compare antibody titers and cellular immune response measurements for each group.

5. Conclusions

A discrepancy was noted between PCR test results and the IgG(N) and T-spot(N) determinations. Classifying individuals definitively as infected or non-infected based on a single test, such as PCR, may be challenging. Therefore, combining several types of assays is necessary to accurately identify the infected population. Additionally, differences in antibody titers were observed based on IgG(N) results, even among individuals with the same PCR outcomes. A comprehensive classification and method are required to understand infection status in detail.

Supplementary Materials

The following supporting information can be downloaded at https://www.mdpi.com/article/10.3390/vaccines13030259/s1, Table S1: Number of participants per frequency of positive IgG(N) and T-spot(N) for nucleocapsids among those who had all five IgG tests and all three T-spot tests (n = 983).

Author Contributions

Conception: Y.K. (Yurie Kobashi), M.T.; data collection: Y.K. (Yurie Kobashi), T.K. (Tatsuhiko Kodama), Y.N., F.O., H.S., T.Z., C.Y., N.I., T.A., and M.T.; examinations: T.K. (Takeshi Kawamura), A.N., and Y.K. (Yudai Kaneko); data analysis and interpretation: Y.K. (Yurie Kobashi), M.T.; data curation: Y.K. (Yurie Kobashi), M.T.; drafting of the article: T.U.; critical revision of the article: Y.K. (Yurie Kobashi), M.T.; final approval of the version to be published: All authors. All authors have read and agreed to the published version of the manuscript.

Funding

This study was funded by the Japan Agency for Medical Research and Development (AMED) under the title “Development of Vaccines for the Novel Coronavirus Disease”, Grant No. JP21nf0101638; Moderna Inc.; JSPS KAKENHI Grant Number 23H00503; Medical and Biological Laboratories Co., Ltd.; Shenzhen YHLO Biotech Co., Ltd., distributor and manufacturer of the antibody measurement system (iFlash 3000); grants from the Kowa Co.; and the Research Center for Advanced Science and Technology in the University of Tokyo. The funders did not participate in the study design, collection, analysis, interpretation of data, writing of this article, or the decision to submit it for publication.

Institutional Review Board Statement

This study was approved by the ethics committees of Hirata Central Hospital (number: 2021-0611-1, accepted date: 17 June 2021) and Fukushima Medical University (number: 2021-116, accepted date: 21 December 2021).

Informed Consent Statement

Written informed consent has been obtained from the patient(s) to publish this paper.

Data Availability Statement

The datasets generated for this study are not available publicly; however, they can be accessed upon request to the corresponding author with the permission of Fukushima Medical University and Hirata Central Hospital.

Acknowledgments

We thank all the staff from Fukushima Medical University, Seireikai Health Care Group, Hirata Village office, Soma City office, Soma Central Hospital, Soma General Hospital, Minamisoma City office, Minamisoma City Medical Association, Minamisoma Municipal General Hospital, and Shindo Clinic, Medical Governance Institute, and NPO Institute of Medical Care and Societal Health. Their invaluable contributions, especially from Masahiko Nihei, Hideo Sato, Rie Yanai, Yasuko Suzuki, Keiko Abe, Hidekiyo Tachiya, Kouki Nakatsuka, Ryuzaburo Shineha, Miki Sato, Masahiko Sato, Naoharu Tadano, Kazuo Momma, Shuichi Mori, Saori Yoshisato, Katsuko Onoda, Satoshi Kowata, Masatsugu Tanaki, Tomoyoshi Oikawa, Joji Shindo, Yuka Harada, Xujin Zhu, Tomoyo Nishimura, and Toshihiko Atarashi, were crucial to the completion of this study.

Conflicts of Interest

Kaneko is employed by Medical and Biological Laboratories, Co. (MBL, Tokyo, Japan). MBL imported the testing materials used in this study. Kaneko participated in the testing process; however, he was not involved in the research design and analysis. Kobashi and Tsubokura received a research grant from the Pfizer Health Research Foundation for research that is not associated with this study (from 1 December 2020 to 30 November 2022). All authors declare no other competing interests.

Abbreviations

The following abbreviations are used in this manuscript:
IgG(N)Immunoglobin G for nucleocapsid
PCRPolymerase chain reaction
SARS-CoV-2Severe acute respiratory syndrome coronavirus 2
CLIAChemiluminescent immunoassay

References

  1. Zhou, L.; Ayeh, S.K.; Chidambaram, V.; Karakousis, P.C. Modes of transmission of SARS-CoV-2 and evidence for preventive behavioral interventions. BMC Infect. Dis. 2021, 21, 496. [Google Scholar] [CrossRef] [PubMed]
  2. Zhan, Z.; Li, J.; Cheng, Z.J. Rapid antigen test combine with nucleic acid detection: A better strategy for COVID-19 screening at points of entry. J. Epidemiol. Glob. Health 2022, 12, 13–15. [Google Scholar] [CrossRef] [PubMed]
  3. Lee, J.; Song, J.U.; Shim, S.R. Comparing the diagnostic accuracy of rapid antigen detection tests to real time polymerase chain reaction in the diagnosis of SARS-CoV-2 infection: A systematic review and meta-analysis. J. Clin. Virol. 2021, 144, 104985. [Google Scholar] [CrossRef] [PubMed]
  4. Yüce, M.; Filiztekin, E.; Özkaya, K.G. COVID-19 diagnosis—A review of current methods. Biosens. Bioelectron. 2021, 172, 112752. [Google Scholar] [CrossRef]
  5. Oran, D.P.; Topol, E.J. Prevalence of Asymptomatic SARS-CoV-2 Infection. Ann. Intern. Med. 2020, 173, 362–367. [Google Scholar] [CrossRef]
  6. Zhao, H.; Lu, X.; Deng, Y.; Tang, Y.; Lu, J. COVID-19: Asymptomatic carrier transmission is an underestimated problem. Epidemiol. Infect. 2020, 148, e116. [Google Scholar] [CrossRef]
  7. Tominaga, T.; Hachiya, M.; Tatsuzaki, H.; Akashi, M. The Accident at the Fukushima Daiichi Nuclear Power Plant in 2011. Health Phys. 2014, 106, 630–637. [Google Scholar] [CrossRef]
  8. Kayama, M.; Akiyama, T.; Ohashi, A.; Horikoshi, N.; Kido, Y.; Murakata, T.; Kawakami, N. Experiences of Municipal Public Health Nurses Following Japan’s Earthquake, Tsunami, and Nuclear Disaster. Public Health Nurs. 2014, 31, 517–525. [Google Scholar] [CrossRef]
  9. Ishiwatari, M. Institutional Coordination of Disaster Management: Engaging National and Local Governments in Japan. Nat. Hazards Rev. 2021, 22, 04020059. [Google Scholar] [CrossRef]
  10. Yumiya, Y.; Goto, A.; Murakami, M.; Ohira, T.; Rudd, R.E. Communication between Health Professionals and Community Residents in Fukushima: A Focus on the Feedback Loop. Health Commun. 2019, 35, 1274–1282. [Google Scholar] [CrossRef]
  11. Kobashi, Y.; Kawamura, T.; Shimazu, Y.; Zhao, T.; Sugiyama, A.; Nakayama, A.; Kaneko, Y.; Nishikawa, Y.; Omata, F.; Takita, M.; et al. Humoral immunity after second dose of BNT162b2 vaccine in Japanese communities: An observational cross-sectional study, Fukushima Vaccination Community Survey. Sci. Rep. 2022, 12, 18929. [Google Scholar] [CrossRef] [PubMed]
  12. Kobashi, Y.; Nishikawa, Y.; Kawamura, T.; Kodama, T.; Shimazu, Y.; Obara, D.; Zhao, T.; Tsubokura, M. Seroprevalence of SARS-CoV-2 antibodies among hospital staff in rural Central Fukushima, Japan: A historical cohort study. Int. Immunopharmacol. 2021, 98, 107884. [Google Scholar] [CrossRef] [PubMed]
  13. Pagheh, A.S.; Ziaee, A.; Abrari Romenjan, K.; Rezaei, F.; Bahman, B.; Alamzadeh, E.; Elhamirad, S.; Ziaee, M. SARS-COV-2 IgG specific antibodies persistence in recovered COVID-19 individuals and its association with severity and time of illness. New Microbes New Infect. 2023, 52, 101096. [Google Scholar] [CrossRef]
  14. Stead, D.; Adeniyi, O.V.; Singata-Madliki, M.; Abrahams, S.; Batting, J.; Jelliman, E.; Parrish, A. Cumulative incidence of SARS-CoV-2 and associated risk factors among healthcare workers: A cross-sectional study in the Eastern Cape, South Africa. BMJ Open 2022, 12, e058761. [Google Scholar] [CrossRef]
  15. Zhao, D.; Wang, M.; Wang, M.; Zhao, Y.; Zheng, Z.; Li, X.; Zhang, Y.; Wang, T.; Zeng, S.; Hu, W.; et al. Asymptomatic infection by SARS-CoV-2 in healthcare workers: A study in a large teaching hospital in Wuhan, China. Int. J. Infect. Dis. 2020, 99, 219–225. [Google Scholar] [CrossRef]
  16. Thiruvengadam, R.; Chattopadhyay, S.; Mehdi, F.; Desiraju, B.K.; Chaudhuri, S.; Singh, S.; Bhartia, V.; Kshetrapal, P.; Mouli Natchu, U.C.; Wadhwa, N.; et al. Longitudinal serology of SARS-CoV-2-Infected individuals in India: A prospective cohort study. Am. J. Trop. Med. Hyg. 2021, 105, 66–72. [Google Scholar] [CrossRef]
  17. Kharroubi, G.; Cherif, I.; Ghawar, W.; Dhaouadi, N.; Yazidi, R.; Chaabane, S.; Snoussi, M.A.; Salem, S.; Ben Hammouda, W.; Ben Hammouda, S.; et al. Incidence and risk factors of SARS-CoV-2 infection among workers in a public health laboratory in Tunisia. Arch. Virol. 2023, 168, 69. [Google Scholar] [CrossRef]
  18. Sanada, T.; Honda, T.; Yasui, F.; Yamaji, K.; Munakata, T.; Yamamoto, N.; Kurano, M.; Matsumoto, Y.; Kohno, R.; Toyama, S.; et al. Serologic survey of IgG against SARS-CoV-2 among hospital visitors without a history of SARS-CoV-2 infection in Tokyo, 2020–2021. J. Epidemiol. 2022, 32, 105–111. [Google Scholar] [CrossRef]
  19. Marklund, E.; Leach, S.; Nyström, K.; Lundgren, A.; Liljeqvist, J.Å.; Nilsson, S.; Yilmaz, A.; Andersson, L.M.; Bemark, M.; Gisslén, M. Longitudinal follow up of immune responses to SARS-CoV-2 in health care workers in Sweden with several different commercial IgG-assays, measurement of neutralizing antibodies and CD4+ T-cell Responses. Front. Immunol. 2021, 12, 750448. [Google Scholar] [CrossRef]
  20. Turbett, S.E.; Anahtar, M.; Dighe, A.S.; Garcia Beltran, W.; Miller, T.; Scott, H.; Durbin, S.M.; Bharadwaj, M.; Thomas, J.; Gogakos, T.S.; et al. Evaluation of three commercial SARS-CoV-2 serologic assays and their performance in two-test algorithms. J. Clin. Microbiol. 2020, 59, e01892-20. [Google Scholar] [CrossRef]
  21. Algaissi, A.; Alfaleh, M.A.; Hala, S.; Abujamel, T.S.; Alamri, S.S.; Almahboub, S.A.; Alluhaybi, K.A.; Hobani, H.I.; Alsulaiman, R.M.; AlHarbi, R.H.; et al. SARS-CoV-2 S1 and N-based serological assays reveal rapid seroconversion and induction of specific antibody response in COVID-19 patients. Sci. Rep. 2020, 10, 16561. [Google Scholar] [CrossRef] [PubMed]
  22. Lisboa Bastos, M.; Tavaziva, G.; Abidi, S.K.; Campbell, J.R.; Haraoui, L.P.; Johnston, J.C.; Lan, Z.; Law, S.; MacLean, E.; Trajman, A.; et al. Diagnostic accuracy of serological tests for Covid-19: Systematic review and meta-analysis. BMJ 2020, 370, m2516. [Google Scholar] [CrossRef] [PubMed]
  23. Igawa, G.; Ai, T.; Yamamoto, T.; Ito, K.; Nojiri, S.; Saito, K.; Wakita, M.; Fukuda, H.; Hori, S.; Misawa, S.; et al. Antibody response and seroprevalence in healthcare workers after the BNT162b2 vaccination in a University Hospital at Tokyo. Sci. Rep. 2022, 12, 8707. [Google Scholar] [CrossRef]
  24. Speer, C.; Göth, D.; Benning, L.; Buylaert, M.; Schaier, M.; Grenz, J.; Nusshag, C.; Kälble, F.; Kreysing, M.; Reichel, P.; et al. Early humoral responses of hemodialysis patients after COVID-19 vaccination with BNT162b2. Clin. J. Am. Soc. Nephrol. 2021, 16, 1073–1082. [Google Scholar] [CrossRef]
  25. Anand, S.; Montez-Rath, M.E.; Han, J.; Garcia, P.; Cadden, L.; Hunsader, P.; Kerschmann, R.; Beyer, P.; Dittrich, M.; Block, G.A.; et al. Antibody response to COVID-19 vaccination in patients receiving dialysis. J. Am. Soc. Nephrol. 2021, 32, 2435–2438. [Google Scholar] [CrossRef]
Figure 1. The timeline for the five blood samplings.
Vaccines 13 00259 g001
Figure 2. Relationships between different assays. (A) IgG(N)-positive times by the results of PCR. (B) T-spot (N)-positive times by the results of PCR. (C) IgG(S) titer at T5 by the group of IgG(N) results and negative PCR. (D) T-spot(S) at T5 by the group of IgG(N) results and negative PCR. (E) IgG(S) titer at T5 by the group of IgG(N) results and positive PCR. (F) T-spot(S) at T5 by the group of IgG(N) results and positive PCR. (G) IgG(S) titer at T5 by the group of T-spot (N) results and negative PCR. (H) T-spot(S) at T5 by the group of T-spot (N) results and negative PCR. (I) IgG(S) titer at T5 by the group of T-spot (N) results and positive PCR. (J) T-spot(S) at T5 by the group of T-spot (N) results and positive PCR. * p < 0.05, *** p < 0.001 with Wilcoxon rank sum test.
Vaccines 13 00259 g002
Table 1. Characteristics of the participants in this study (n = 2104).
Variablen (%)
Age 52 (39–67)
Under 41572 (27.2)
41–65977 (46.4)
Over 65555 (26.3)
Sex: female1220 (58.0)
Type of third dose vaccination (n = 2070)
mRNA-12731401 (67.7)
BNT162b669 (32.3)
Type of fourth dose vaccination (n = 1406)
mRNA-1273337 (24.0)
BNT162b1008 (71.7)
Others61 (4.3)
Smoking habit (n = 2069)392 (19.0)
Alcohol consumption (n = 2058)904 (43.9)
Daily medicine
Steroid (n = 2072)40 (1.9)
Immunosuppression (n = 2067)21 (1.0)
Biologics (n = 2065)11 (0.5)
Comorbidity
Hypertension (n = 2098)555 (26.5)
Diabetes (n = 2098)155 (7.4)
Dyslipidemia (n = 2098)248 (11.8)
BMI (n = 1923)
Under 18.5120 (6.2)
18.5–under 251221 (63.5)
25–30443 (23.0)
Over 30139 (7.2)
Table 2. Number of persons per number of times the IgG(N) and T-spot(N) were positive (n = 2104 for IgG(N), n = 980 for T-spot(N)).
Not InfectedInfectedInfected and Hospitalized
IgG(N)
Never1838241
1 time401423
2 times14264
3 times100
4 times000
5 times920
T-spot(N)
Never789453
1 time50600
2 times2291
3 times010
Table 3. Geometric mean (95% CI) of IgG(S) and T-spot(S) at T5 for each infection status group and IgG(N)-positive status group.
Geometric Mean (95% CI)
IgG(S) at T5
Not infected (with PCR test)
IgG(N)-negative (n = 1838)1541.7 (1469.8–1617.0)
IgG(N)-positive between T1 and T5 (n = 64)3965.8 (3071.0–5121.4)
Infected (with PCR test)
IgG(N)-negative (n = 25)2700.6 (1800.6–4050.5)
IgG(N)-positive between T1 and T5 (n = 177) 5400.8 (4963.4–5876.8)
T-spot(S) at T5
Not infected (with PCR test)
IgG(N)-negative (n = 1525)12.6 (11.9–13.3)
IgG(N)-positive between T1 and T5 (n = 52)15.2 (11.2–20.6)
Infected (with PCR test)
IgG(N)-negative (n = 17)17.9 (11.8–27.1)
IgG(N)-positive between T1 and T5 (n = 161)21.2 (18.6–24.3)
Table 4. Geometric mean (95% CI) of IgG(S) and T-spot(S) at T5 for each infection status group and T-spot(N)-positive status group.
Geometric Mean (95% CI)
IgG(S) at 5T
Not infected (with PCR test)
T-spot(N)-negative (n = 789)1556.7 (1435.1–1688.6)
T-spot(N)-positive between T1 and T5 (n = 72)2268.2 (1770.3–2906.1)
Infected (with PCR test)
T-spot(N)-negative (n = 48)4872.7 (3824.6–6208.1)
T-spot(N)-positive between T1 and T5 (n = 70)5277.0 (4668.8–5964.3)
T-spot(S) at 5T
Not infected (with PCR test)
T-spot(N)-negative (n = 755)11.4 (10.5–12.3)
T-spot(N)-positive between T1 and T5 (n = 71)15.0 (11.6–19.1)
Infected (with PCR test)
T-spot(N)-negative (n = 48)15.1 (11.8–19.4)
T-spot(N)-positive between T1 and T5 (n = 70)26.4 (21.7–32.0)
Table 5. Symptoms among infected participants within each group of IgG(N)-negative or -positive (n = 202).
IgG(N)-Negative
(n = 25)
IgG(N)-Positive
(n = 177)
p-Value
Fever19 (79.2)131 (74.0)0.59
Dysgeusia2 (8.3)33 (18.6)0.21
Cough13 (54.2)121 (68.4)0.166
Sore throat10 (41.7)112 (63.3)0.042
Headache9 (37.5)74 (41.8)0.69
Joint and muscle pain6 (25.0)51 (28.8)0.70
Diarrhea2 (8.3)27 (15.3)0.37
Rash0 (0.0)4 (2.3)0.46
Fatigue10 (41.7)107 (60.5)0.080
Eye symptoms0 (0.0)2 (1.1)0.60
Difficulty breathing2 (8.3)33 (18.6)0.21
Chest pain1 (4.2)8 (4.5)0.94
Difficulty talking1 (4.2)4 (2.3)0.58
Disclaimer/Publisher’s Note: The statements, opinions and data contained in all publications are solely those of the individual author(s) and contributor(s) and not of MDPI and/or the editor(s). MDPI and/or the editor(s) disclaim responsibility for any injury to people or property resulting from any ideas, methods, instructions or products referred to in the content.

