
A Profile of Adult Severe Acute Respiratory Syndrome Coronavirus 2 Pneumonia Patients According to Pneumococcal Vaccination Status
 , ,
, ,  and
and
Abstract
:1. Introduction
2. Materials and Methods
2.1. Design and Study Population
2.1.1. Patient Selection
2.1.2. SARS-CoV-2 Pneumonia Inclusion Criteria
2.1.3. SARS-CoV-2 Pneumonia Exclusion Criteria
2.2. Data Analysis
3. Results
3.1. Sociodemographic and Health-Related Variables
3.2. Comorbidities
4. Discussion
5. Conclusions
Author Contributions
Funding
Institutional Review Board Statement
Informed Consent Statement
Data Availability Statement
Acknowledgments
Conflicts of Interest
References
- Menchén, D.A.; Vázquez, J.B.; Allende, J.M.B.; García, G.H. Viral Pneumonia. COVID-19 Pneumonia. Medicine 2022, 13, 3224–3234. [Google Scholar] [PubMed]
- Heneghan, C.; Pluddemann, A.; Mahtani, K.R. Differentiating Viral from Bacterial Pneumonia; Technical Report; Centre for Evidence-Based Medicine, Nuffield Department of Primary Care Health Sciences University of Oxford: Oxford, UK, 2020. [Google Scholar]
- Drijkoningen, J.J.C.; Rohde, G.G.U. Pneumococcal Infection in Adults: Burden of Disease. Clin. Microbiol. Infect. Off. Publ. Eur. Soc. Clin. Microbiol. Infect. Dis. 2014, 20 (Suppl. 5), 45–51. [Google Scholar] [CrossRef] [PubMed]
- Bonten, M.J.M.; Huijts, S.M.; Bolkenbaas, M.; Webber, C.; Patterson, S.; Gault, S.; van Werkhoven, C.H.; van Deursen, A.M.M.; Sanders, E.A.M.; Verheij, T.J.M.; et al. Polysaccharide Conjugate Vaccine Against Pneumococcal Pneumonia in Adults. N. Engl. J. Med. 2015, 372, 1114–1125. [Google Scholar] [CrossRef] [PubMed]
- American Lung Association. What Causes Pneumonia? American Lung Association: Chicago, IL, USA, 2023. [Google Scholar]
- Cleveland Clinic. COVID Pneumonia; Cleveland Clinic: Cleveland, OH, USA, 2023. [Google Scholar]
- Budinger, G.R.S.; Misharin, A.V.; Ridge, K.M.; Singer, B.D.; Wunderink, R.G. Distinctive Features of Severe SARS-CoV-2 Pneumonia. J. Clin. Investig. 2021, 131, e149412. [Google Scholar] [CrossRef] [PubMed]
- Bonnave, C.; Mertens, D.; Peetermans, W.; Cobbaert, K.; Ghesquiere, B.; Deschodt, M.; Flamaing, J. Adult Vaccination for Pneumococcal Disease: A Comparison of the National Guidelines in Europe. Eur. J. Clin. Microbiol. Infect. Dis. Off. Publ. Eur. Soc. Clin. Microbiol. 2019, 38, 785–791. [Google Scholar] [CrossRef] [PubMed]
- González-Romo, F.; Picazo, J.J.; García Rojas, A.; Labrador Horrillo, M.; Barrios, V.; Magro, M.C.; Gil Gregorio, P.; de la Cámara, R.; Rodríguez, A.; Barberán, J.; et al. Consensus Document on Pneumococcal Vaccination in Adults at Risk by Age and Underlying Clinical Conditions. 2017 Update. Rev. Esp. Quimioter. 2017, 30, 142–168. [Google Scholar] [PubMed]
- Matanock, A.; Lee, G.; Gierke, R.; Kobayashi, M.; Leidner, A.; Pilishvili, T. Use of 13-Valent Pneumococcal Conjugate Vaccine and 23-Valent Pneumococcal Polysaccharide Vaccine among Adults Aged ≥65 Years: Updated Recommendations of the Advisory Committee on Immunization Practices. Morb. Mortal. Wkly. Rep. 2019, 68, 1069–1075. [Google Scholar] [CrossRef] [PubMed]
- de Sanidad, M.; Social, C.Y.B.; De Vacunación, V.Y.P. Enfermedad Neumocócica Invasiva. Recomendaciones De Vacunación Actuales Acordadas En El Consejo Interterritorial De Sistema Nacional De Salud (CISNS); 2023. [Google Scholar]
- Kobayashi, M.; Farrar, J.L.; Gierke, R.; Britton, A.; Childs, L.; Leidner, A.J.; Campos-Outcalt, D.; Morgan, R.L.; Long, S.S.; Talbot, H.K. Use of 15-Valent Pneumococcal Conjugate Vaccine and 20-Valent Pneumococcal Conjugate Vaccine among US Adults: Updated Recommendations of the Advisory Committee on Immunization Practices—United States, 2022. Morb. Mortal. Wkly. Rep. 2022, 71, 109–117. [Google Scholar] [CrossRef] [PubMed]
- Servicio Andaluz de Salud de la Dirección General de Salud Pública y ordenación Farmacéutica de la Consejería de Salud y Consumo de la Junta de Andalucía. Programa De Vacunación Frente a Neumococo En Andalucía; 2023; Available online: https://www.juntadeandalucia.es/organismos/saludyconsumo/consejeria/sgspis/dgspof (accessed on 18 July 2023).
- Dirección General de Salud Púbica de la Consejería de Sanidad de la Junta de Castilla y León. Actualización Del Programa De Vacunación Frente Al Neumococo De Castilla Y León; 2023; Available online: https://www.jcyl.es/web/jcyl/Portada/es/Plantilla100Directorio/1248366924958/1279887997704/1284182459768/DirectorioPadre (accessed on 18 July 2023).
- Servicio de Prevención y Protección de la Salud de la Dirección General de Salud Pública y Adicciones de la Consejería de Salud de la Región de Murcia. Vacunación Antineumocócica En Personas a Partir De 65 Años Y Con Condiciones De Riesgo De Cualquier Edad; 2023; Available online: https://r.search.yahoo.com/_ylt=AwrkELQziDdlRjcIhBy_.wt.;_ylu=Y29sbwMEcG9zAzEEdnRpZAMEc2VjA3Ny/RV=2/RE=1698166963/RO=10/RU=https%3a%2f%2fwww.murciasalud.es%2fdocuments%2f5435832%2f5539780%2fProtocolo%2bde%2bvacunaci%25C3%25B3n%2bantineumoc%25C3%25B3cica.pdf%2f1fbdf9c3-cb0b-be72-7a1e-c082c8781aed%3ft%3d1694081761430/RK=2/RS=Sp5xHhWLi9Z.Cir0Pi.ZopOK7yI- (accessed on 18 July 2023).
- Comunidad de Madrid. Vacunación Frente a Neumococo En El Adulto; 2023. [Google Scholar]
- Centro Nacional de Epidemiología. Instituto de Salud Carlos III. Resultados De La Vigilancia Epidemiológica De Las Enfermedades Transmisibles. Informe Anual. Años 2017–2018; Anual Report; Government Agency, 2020. [Google Scholar]
- de Miguel, S.; Domenech, M.; González-Camacho, F.; Sempere, J.; Vicioso, D.; Sanz, J.C.; Comas, L.G.; Ardanuy, C.; Fenoll, A.; Yuste, J. Nationwide Trends of Invasive Pneumococcal Disease in Spain from 2009 through 2019 in Children and Adults during the Pneumococcal Conjugate Vaccine Era. Clin. Infect. Dis. 2021, 73, e3778–e3787. [Google Scholar] [CrossRef] [PubMed]
- Marimon, J.M.; Ardanuy, C. Epidemiology of Pneumococcal Diseases in Spain After the Introduction of Pneumococcal Conjugate Vaccines. Enfermedades Infecc. Y Microbiol. Clin. 2021, 39, 142–150. [Google Scholar] [CrossRef] [PubMed]
- Vila Córcoles, Á. Pneumococcal Vaccination in Times of COVID-19. Med. Clin. 2022, 158, 366–368. [Google Scholar] [CrossRef] [PubMed]
- Tang, H.; Lai, C.; Chao, C. Changing Epidemiology of Respiratory Tract Infection during COVID-19 Pandemic. Antibiotics 2022, 11, 315. [Google Scholar] [CrossRef] [PubMed]
- Chiu, N.; Chi, H.; Tai, Y.; Peng, C.; Tseng, C.; Chen, C.; Tan, B.F.; Lin, C. Impact of Wearing Masks, Hand Hygiene, and Social Distancing on Influenza, Enterovirus, and all-Cause Pneumonia during the Coronavirus Pandemic: Retrospective National Epidemiological Surveillance Study. J. Med. Internet Res. 2020, 22, e21257. [Google Scholar] [CrossRef] [PubMed]
- Lastrucci, V.; Bonaccorsi, G.; Forni, S.; D’Arienzo, S.; Bachini, L.; Paoli, S.; Lorini, C.; Gemmi, F. The Indirect Impact of COVID-19 Large-Scale Containment Measures on the Incidence of Community-Acquired Pneumonia in Older People: A Region-Wide Population-Based Study in Tuscany, Italy. Int. J. Infect. Dis. 2021, 109, 182–188. [Google Scholar] [CrossRef] [PubMed]
- Moberley, S.; Holden, J.; Tatham, D.P.; Andrews, R.M. Vaccines for Preventing Pneumococcal Infection in Adults. Cochrane Database Syst. Rev. 2013, 2013. [Google Scholar] [CrossRef] [PubMed]
- Vila-Corcoles, A.; Hospital, I.; Ochoa-Gondar, O.; Satue, E.; de Diego, C.; Vila-Rovira, A.; Gómez-Bertomeu, F.; Raga, X.; Aragón, M. Clinical Effectiveness of 13-Valent and 23-Valent Pneumococcal Vaccination in Middle-Aged and Older Adults: The EPIVAC Cohort Study, 2015–2016. Vaccine 2020, 38, 1170–1180. [Google Scholar] [CrossRef]
- Charlson, M.E.; Pompei, P.; Ales, K.L.; MacKenzie, C.R. A New Method of Classifying Prognostic Comorbidity in Longi-tudinal Studies: Development and Validation. J. Chronic Dis. 1987, 40, 373–383. [Google Scholar] [CrossRef] [PubMed]
- Grant, L.R.; Meche, A.; McGrath, L.; Miles, A.; Alfred, T.; Yan, Q.; Chilson, E. Risk of Pneumococcal Disease in US Adults by Age and Risk Profile. In Open Forum Infectious Diseases; Oxford University Press: Oxford, UK, 2023; Volume 10. [Google Scholar]
- Pelton, S.I.; Bornheimer, R.; Doroff, R.; Shea, K.M.; Sato, R.; Weycker, D. Decline in Pneumococcal Disease Attenuated in Older Adults and those with Comorbidities Following Universal Childhood PCV13 Immunization. Clin. Infect. Dis. 2019, 68, 1831–1838. [Google Scholar] [CrossRef] [PubMed]
- Albrich, W.C.; Rassouli, F.; Waldeck, F.; Berger, C.; Baty, F. Influence of Older Age and Other Risk Factors on Pneumonia Hospitalization in Switzerland in the Pneumococcal Vaccine Era. Front. Med. 2019, 6, 286. [Google Scholar] [CrossRef] [PubMed]


| Vaccinated (n = 70, 23.3%) | Not Vaccinated (n = 230, 76.7%) | |||||||
|---|---|---|---|---|---|---|---|---|
| SARS-CoV-2 Pneumonia (n = 17, 24.3%) | No SARS-CoV-2 Pneumonia (n = 53, 75.7%) | p-Value | RR (95% CI) | SARS-CoV-2 Pneumonia (n = 70, 30.4%) | No SARS-CoV-2 Pneumonia (n = 160, 69.6%) | p-Value | RR (95% CI) | |
| Age Median (IQR) | 58.00 (9.00) | 59.00 (11.00) | 0.078 | - | 53.60 (11.00) | 55.00 (45.00) | 0.422 | - |
| Age groups n (%) <50 years 50–60 years >60 years | 4 (23.5) 9 (52.9) 4 (23.5) | 12 (22.6) 25 (47.2) 16 (30.2) | 0.939 0.685 0.597 | Reference 1.06 (0.38–2.93) 0.80 (0.24–2.71) | 21 (30.0) 37 (52.9) 12 (17.1) | 52 (32.5) 69 (43.1) 39 (24.4) | 0.708 0.171 0.221 | Reference 1.21 (0.78–1.89) 0.82 (0.44–1.51) |
| Gender n (%) Female Male | 3 (17.6) 14 (82.4) | 18 (34.0) 35 (66.0) | 0.203 0.203 | Reference 2.00 (0.64–6.24) | 28 (40.0) 42 (60.0) | 65 (40.6) 95 (59.4) | 0.932 0.932 | Reference 1.02 (0.68–1.52) |
| Level of education n (%) University Secondary or PT Primary | 2 (11.8) 5 (29.4) 10 (58.8) | 7 (13.2) 9 (17.0) 37 (69.8) | 0.882 0.270 0.404 | Reference 1.61 (0.39–6.58) 0.96 (0.25–3.66) | 13 (18.6) 11 (15.7) 46 (65.7) | 29 (18.1) 41 (25.6) 90 (56.3) | 0.928 0.099 0.183 | Reference 0.68 (0.34–1.37) 1.09 (0.66–1.49) |
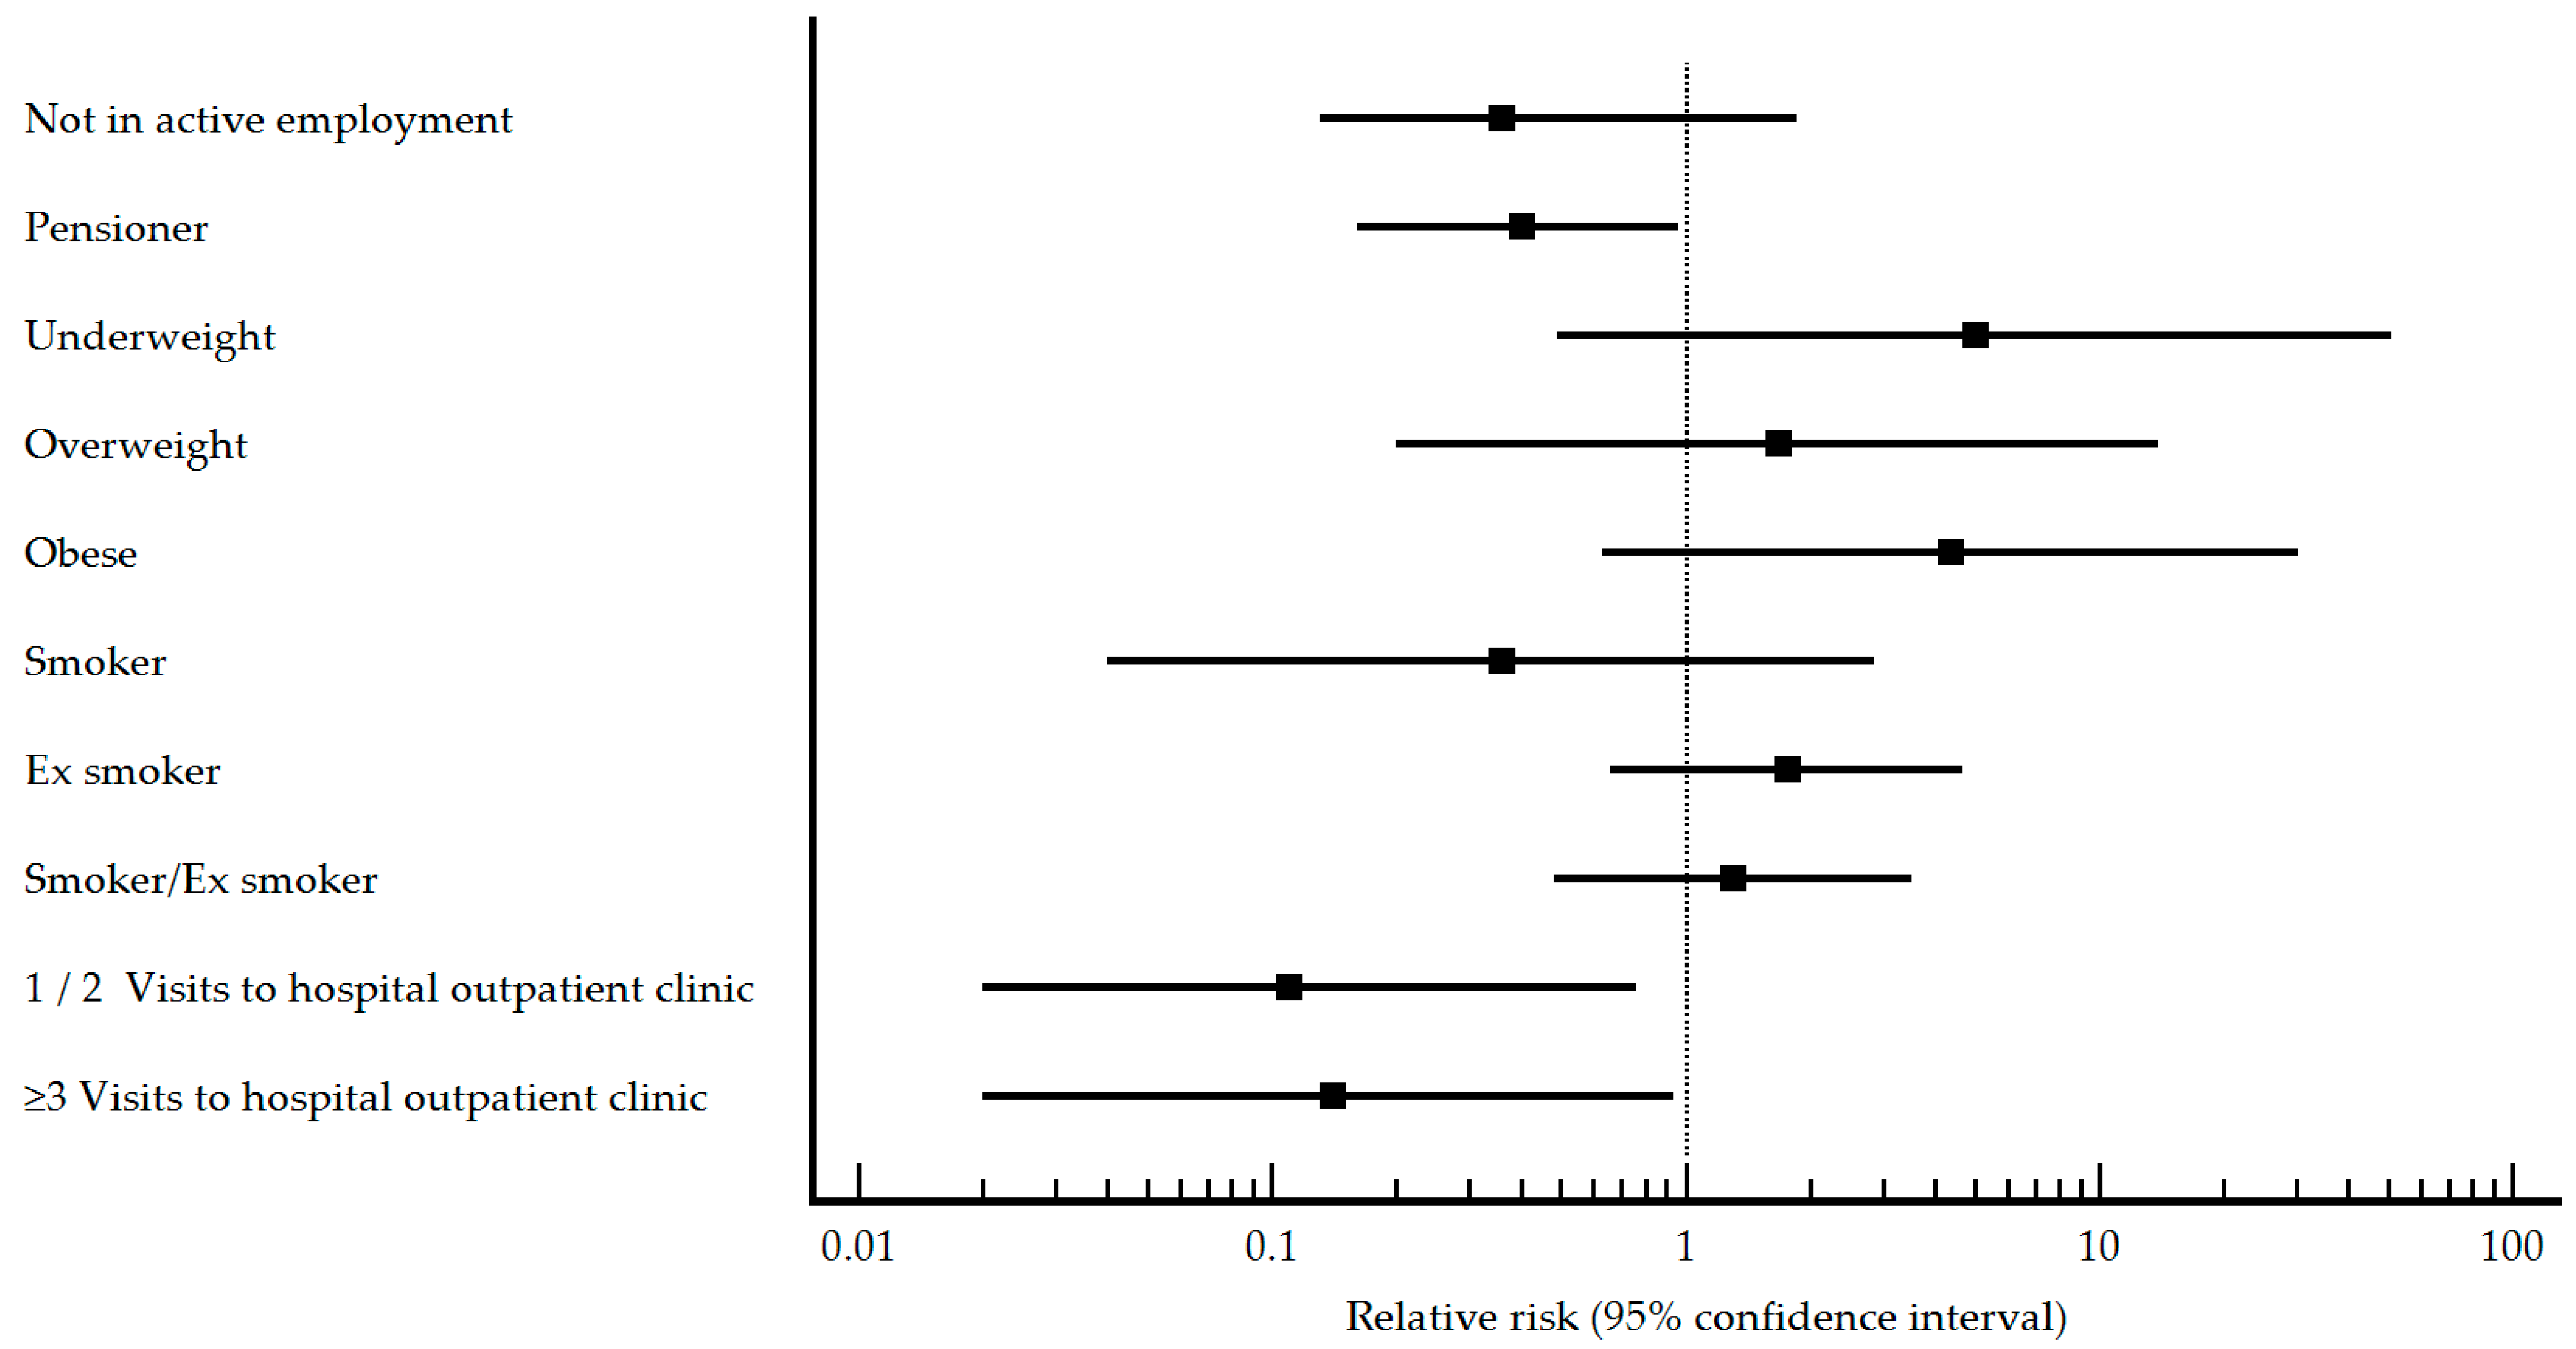
| Employment status n (%) Not in active employment Pensioner Worker | 2 (11.8) 6 (35.3) 9 (52.9) | 8 (15.4) 31 (59.6) 13 (25.0) | 0.160 0.083 0.033 | 0.36 (0.13–1.86) 0.40 (0.16–0.96) Reference | 9 (12.9) 12 (17.1) 49 (70.0) | 37 (23.6) 29 (18.5) 91 (58.0) | 0.064 0.800 0.086 | 0.56 (0.30–1.05) 0.84 (0.49–1.42) Reference |
| Works in an educational center n (%) No Yes | 11 (73.3) 4 (26.7) | 32 (64.0) 18 (36.0) | 0.484 0.484 | Reference 0.71 (0.26–1.98) | 26 (37.7) 43 (62.3) | 52 (33.8) 102 (66.2) | 0.570 0.570 | Reference 0.89 (0.60–1.33) |
| Marital status n (%) Single Married Widowed Separated/divorced | 1 (5.9) 11 (64.7) 1 (5.9) 4 (23.5) | 8 (15.1) 34 (64.2) 1 (1.9) 10 (18.9) | 0.328 0.970 0.394 0.682 | 0.45 (0.07–3.09) Reference 2.05 (0.47–8.97) 1.17 (0.44–3.10) | 6 (8.6) 55 (78.6) 1 (1.4) 8 (11.4) | 30 (18.9) 105 (66.0) 4 (2.5) 20 (12.6) | 0.049 0.056 0.599 0.799 | 0.48 (0.23–1.04) Reference 0.58 (0.10–3.40) 0.83 (0.45–1.55) |
| Coexistence n (%) Living alone With cohabitants | 4 (23.5) 13 (76.5) | 12 (22.6) 41 (77.4) | 0.939 0.939 | 1.04 (0.39–2.74) Reference | 4 (5.7) 66 (94.3) | 18 (11.3) 142 (88.8) | 0.186 0.186 | 0.57 (0.23–1.42) Reference |
| Body Mass Index n (%) Underweight Normal weight Overweight Obese | 0 (0) 1 (9.1) 3 (27.3) 7 (63.6) | 1 (2.9) 9 (26.5) 15 (44.1) 9 (26.5) | 0.481 0.136 0.222 0.006 | 5.00 (0.49–50.83) Reference 1.67 (0.20–13.98) 4.38 (0.63–30.46) | 0 (0) 4 (10.5) 18 (47.4) 16 (42.1) | 7 (7.2) 32 (33.0) 28 (28.9) 30 (30.9) | 0.022 <0.001 0.007 0.100 | 1.13 (0.14–8.77) Reference 3.52 (1.31–9.49) 3.13 (1.15–8.55) |
| Smoking habit n (%) Never smoked Smoker Ex-smoker Smoker/ex-smoker | 4 (23.5) 0 (0) 13 (76.5) 13 (76.5) | 16 (30.2) 13 (24.5) 24 (45.3) 37 (69.8) | 0.597 0.025 0.026 0.825 | Reference 0.36 (0.04–2.87) 1.76 (0.66–4.68) 1.30 (0.48–3.51) | 38 (54.3) 5 (7.1) 27 (38.6) 32 (45.7) | 59 (36.9) 43 (26.9) 58 (36.3) 101 (63.1) | 0.014 <0.001 0.740 0.013 | Reference 0.27 (0.11–0.63) 0.81 (0.54–1.21) 0.61 (0.42–0.91) |
| Alcohol consumption n (%) No Yes | 10 (58.8) 7 (41.2) | 41 (77.4) 12 (22.6) | 0.136 0.136 | Reference 1.88 (0.84–4.22) | 48 (68.6) 22 (31.4) | 128 (80.0) 32 (20.0) | 0.061 0.061 | Reference 1.49 (1.00–2.23) |
| Frequency of hand washing n (%) 0–4 times/day 5–10 times/day >10 times/day | 5 (29.4) 7 (41.2) 5 (29.4) | 14 (26.4) 21 (39.6) 18 (34.0) | 0.810 0.907 0.727 | 1.21 (0.21–3.57) 1.15 (0.42–3.15) Reference | 20 (28.6) 32 (45.7) 18 (25.7) | 52 (32.5) 64 (40.0) 44 (27.5) | 0.558 0.421 0.778 | 0.96 (0.56–1-64) 1.15 (0.71–1.86) Reference |
| Frequency of hand hygiene with hydroalcoholic solution n (%) 0–4 times/day 5–10 times/day >10 times/day | 9 (52.9) 3 (17.6) 5 (29.4) | 28 (52.8) 16 (30.2) 9 (17.0) | 0.671 0.313 0.270 | 0.68 (0.28–1.68) 0.44 (0.13–1.55) Reference | 47 (67.1) 13 (18.6) 10 (14.3) | 79 (49.4) 42 (26.3) 39 (24.4) | 0.013 0.209 0.086 | 1.83 (1.01–3.32) 1.16 (0.56–2.40) Reference |
| Mask use in enclosed spaces n (%) No Yes | 0 (0) 17 (100.0) | 1 (1.9) 52 (98.1) | 0.570 0.570 | Reference 0.49 (0.12–2.09) | 1 (1.4) 69 (98.6) | 5 (3.1) 155 (96.9) | 0.456 0.456 | Reference 1.85 (0.31–11.18) |
| Mask use in outdoor spaces n (%) No Yes | 6 (37.5) 10 (62.5) | 14 (28.0) 36 (72.0) | 0.462 0.462 | 1.38 (0.58–3.28) Reference | 38 (59.4) 26 (40.6) | 46 (29.9) 108 (70.1) | <0.001 <0.001 | 2.33 (1.54–3.54) Reference |
| Mask use in community open spaces n (%) No Yes | 4 (23.5) 13 (76.5) | 4 (7.8) 47 (92.2) | 0.081 0.081 | 2.31 (1.00–5.36) Reference | 15 (21.7) 54 (78.3) | 21 (13.4) 136 (86.6) | 0.114 0.114 | 1.47 (0.94–2.29) Reference |
| Mask use n (%) Not used Only in enclosed spaces Only in open spaces In open and enclosed spaces | 0 (0) 3 (17.6) 0 (0) 14 (82.4) | 0 (0) 5 (9.4) 1 (1.9) 47 (88.7) | - 0.358 0.570 0.502 | 2.18 (0.51–9.38) 1.63 (0.60–4.47) 2.18 (0.51–9.38) Reference | 0 (0) 16 (22.9) 0 (0) 54 (77.1) | 3 (1.9) 16 (10.0) 2 (1.3) 139 (86.9) | 0.247 0.010 0.339 0.063 | 0.89 (0.16–4.95) 1.79 (1.18–2.70) 1.19 (0.24–6.00) Reference |
| Mask type n (%) Hygienic, reusable Hygienic, non-reusable Surgical Self-filtering FFP2 | 0 (0) 0 (0) 14 (82.4) 3 (17.6) | 3 (5.7) 1 (1.9) 32 (60.4) 17 (32.1) | 0.318 0.570 0.100 0.253 | 1.67 (0.23–12.22) 3.33 (0.59–18.89) 2.03 (0.65–6.29) Reference | 2 (2.9) 4 (5.7) 46 (65.7) 18 (25.7) | 12 (7.6) 4 (2.5) 90 (57.3) 51 (32.5) | 0.174 0.224 0.233 0.303 | 0.55 (0.14–2.10) 1.92 (0.86–4.26) 1.30 (0.82–2.06) Reference |
| Frequency of mask change n (%) >2 times/day 1 time/day 3 times/week 2 times/week 1 time/week | 0 (0) 10 (58.8) 5 (29.4) 2 (11.8) 0 (0) | 6 (11.3) 22 (41.5) 14 (26.4) 6 (11.3) 5 (9.4) | 0.150 0.216 0.810 0.955 0.193 | Reference 2.19 (0.33–14.42) 1.84 (0.26–13.14) 1.75 (0.20–15.41) 1.17 (0.09–14.92) | 7 (10.0) 31 (44.3) 12 (17.1) 10 (14.3) 10 (14.3) | 18 (11.5) 62 (39.5) 27 (17.2) 27 (17.2) 23 (14.6) | 0.739 0.497 0.986 0.585 0.953 | Reference 1.19 (0.60–2.38) 1.10 (0.50–2.41) 0.97 (0.42–2.20) 1.08 (0.48–2.44) |
| Self-perceived health n (%) Very poor Poor Fair Good Very good | 1 (5.9) 2 (11.8) 8 (47.1) 4 (23.5) 2 (11.8) | 3 (5.7) 7 (13.2) 19 (35.8) 22 (41.5) 2 (3.8) | 0.976 0.882 0.408 0.185 0.221 | 0.50 (0.07–2.55) 0.44 (0.09–2.13) 0.59 (0.19–1.85) 0.31 (0.08–1.17) Reference | 1 (1.4) 6 (8.6) 21 (30.0) 37 (52.9) 5 (7.1) | 7 (4.4) 21 (13.1) 55 (34.4) 60 (37.5) 17 (10.6) | 0.255 0.330 0.515 0.030 0.407 | 0.55 (0.08–4.02) 0.98 (0.34–2.78) 1.22 (0.52–2.85) 1.68 (0.75–3.78) Reference |
| Visits to primary health services n (%) 0 1–2 ≥3 | 5 (29.4) 6 (35.3) 6 (35.3) | 25 (47.2) 16 (30.2) 12 (22.6) | 0.200 0.696 0.301 | Reference 1.64 (0.57–4.68) 2.00 (0.71–5.62) | 12 (17.1) 28 (40.0) 30 (42.9) | 65 (40.6) 62 (38.8) 33 (20.6) | <0.001 0.864 <0.001 | Reference 2.00 (1.09–3.65) 3.06 (1.71–5.46) |
| Visits to specialist n (%) 0 1–2 ≥3 | 9 (52.9) 4 (23.5) 4 (23.5) | 29 (54.7) 13 (24.5) 11 (20.8) | 0.898 0.934 0.815 | Reference 0.99 (0.35–2.78) 1.17 (0.30–4.60) | 43 (61.4) 21 (30.0) 6 (8.6) | 102 (63.7) 33 (20.6) 25 (15.6) | 0.740 0.122 0.153 | Reference 1.31 (0.86–1.99) 0.57 (0.22–1.49) |
| Visits to hospital outpatient clinic n (%) 0 1–2 ≥3 | 16 (94.1) 0 (0) 1 (5.9) | 19 (35.8) 19 (35.8) 15 (28.3) | <0.001 0.004 0.057 | Reference 0.11 (0.02–0.76) 0.14 (0.02–0.94) | 58 (82.9) 7 (10.0) 5 (7.1) | 53 (33.1) 60 (37.5) 47 (29.4) | <0.001 <0.001 <0.001 | Reference 0.20 (0.10–0.41) 0.18 (0.08–0.43) |
| Admission to hospital n (%) 0–2 ≥3 | 17 (100.0) 0 (0) | 51 (96.2) 2 (3.8) | 0.418 0.418 | Reference 1.33 (0.26–6.96) | 69 (98.6) 1 (1.4) | 154 (96.3) 6 (3.8) | 0.348 0.348 | Reference 0.46 (0.07–2.86) |
| Vaccinated (n = 70, 23.3%) | Not Vaccinated (n = 230, 76.7%) | |||||||
|---|---|---|---|---|---|---|---|---|
| SARS-CoV-2 Pneumonia (n = 17, 24.3%) | No SARS-CoV-2 Pneumonia (n = 53, 75.7%) | p-Value | RR (95% CI) | SARS-CoV-2 Pneumonia (n = 70, 30.4%) | No SARS-CoV-2 Pneumonia (n = 160, 69.6%) | p-Value | RR (95% CI) | |
| COMORBIDITY n (%) No Yes | 0 (0) 17 (100.0) | 1 (1.9) 52 (98.1) | 0.570 | Reference 0.49 (0.12–2.09) | 1 (1.4) 69 (98.6) | 11 (6.9) 149 (93.1) | 0.085 | Reference 3.80 (0.58–25.06) |
| Charlson comorbidity index n (%) None Low High | 6 (35.3) 6 (35.3) 5 (29.4) | 14 (26.4) 8 (15.1) 31 (58.5) | 0.078 | Reference 1.43 (0.58–3.52) 0.46 (0.16–1.33) | 19 (27.1) 34 (48.6) 17 (24.3) | 49 (30.6) 27 (16.9) 84 (52.5) | <0.001 | Reference 1.99 (1.28–3.10) 0.60 (0.34–1.07) |
| Chronic respiratory failure n (%) No Yes | 14 (82.4) 3 (17.6) | 47 (88.7) 6 (11.3) | 0.502 | Reference 1.45 (0.52–4.08) | 68 (97.1) 2 (2.9) | 153 (95.6) 7 (4.4) | 0.592 | Reference 0.72 (0.21–2.49) |
| Pneumonia in the last 2 years n (%) No Yes | 15 (93.8) 1 (6.3) | 50 (94.3) 3 (5.7) | 0.939 | Reference 1.08 (0.19–6.26) | 69 (98.6) 1 (1.4) | 154 (96.3) 6 (3.8) | 0.348 | Reference 0.46 (0.07–2.86) |
| Cellular/humoral immunity n (%) No Yes | 17 (100.0) 0 (0) | 50 (94.3) 3 (5.7) | 0.318 | Reference 0.99 (0.17–5.65) | 70 (100.0) 0 (0) | 155 (96.9) 5 (3.1) | 0.137 | Reference 0.54 (0.09–3.24) |
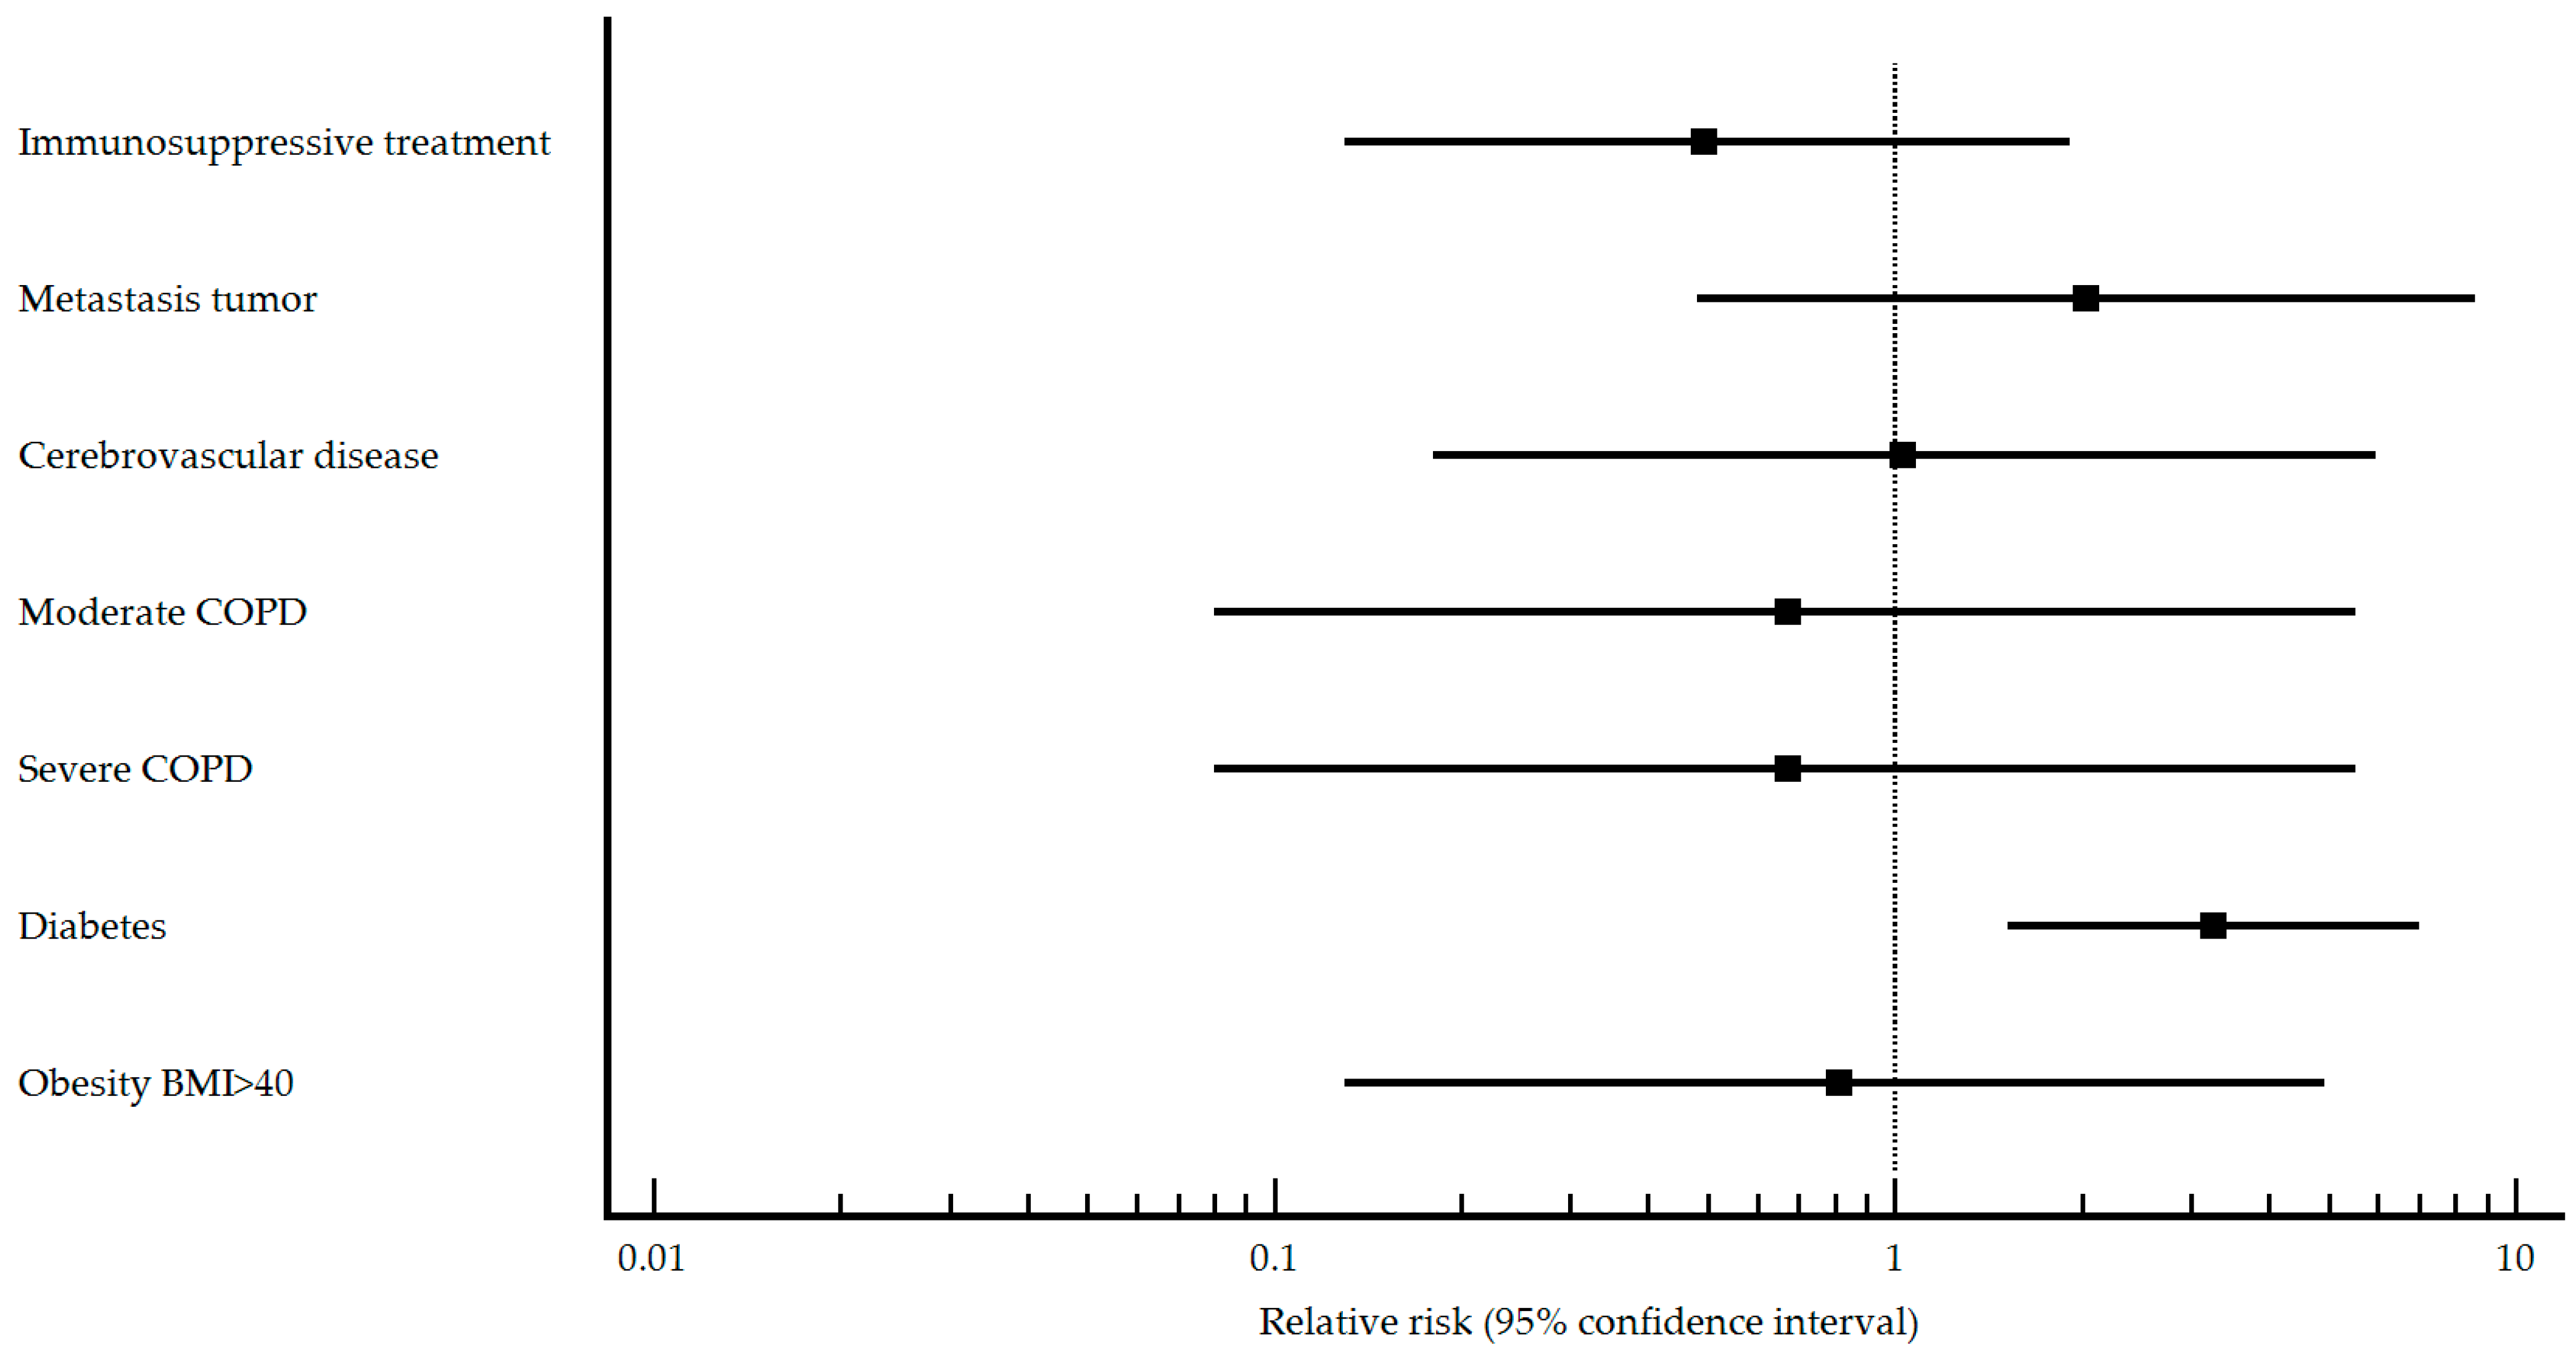
| Immunosuppressive treatment n (%) No Yes | 15 (88.2) 2 (11.8) | 40 (75.5) 13 (24.5) | 0.270 | Reference 0.49 (0.13–1.91) | 69 (98.6) 1 (1.4) | 138 (86.8) 21 (13.2) | 0.005 | Reference 0.14 (0.02–0.93) |
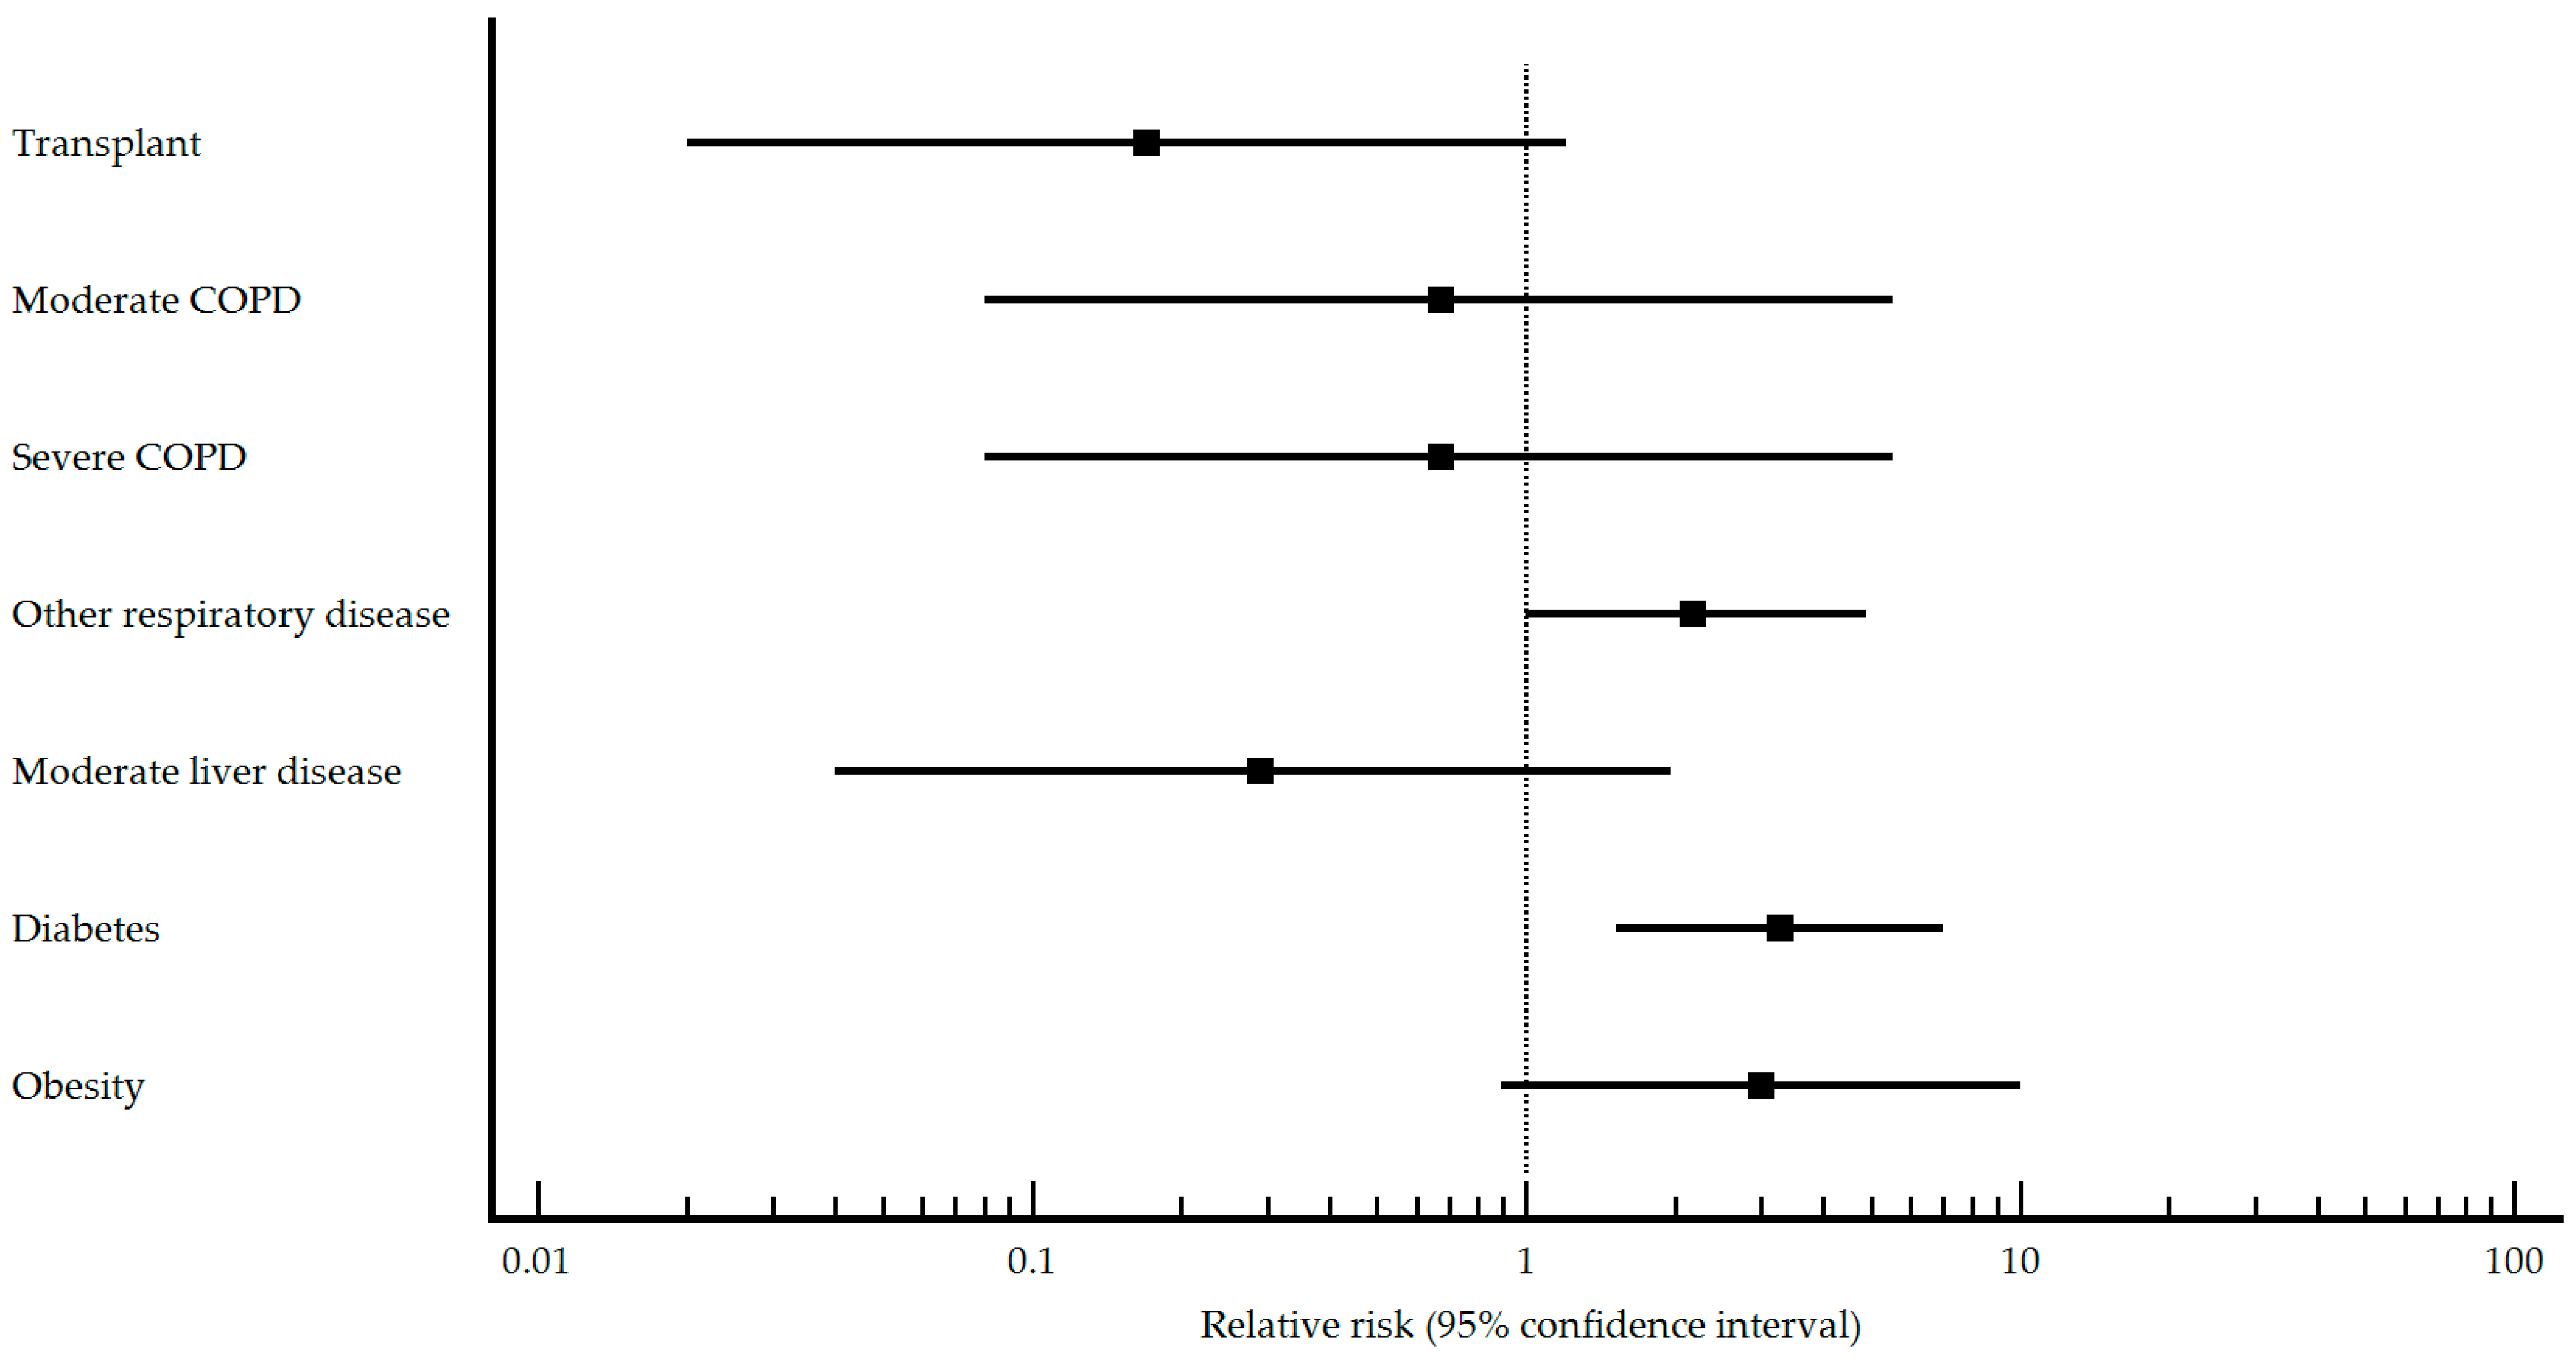
| Transplant n (%) No Yes | 17 (100.0) 0 (0) | 36 (67.9) 17 (32.1) | 0.008 | Reference 0.17 (0.02–1.21) | 69 (98.6) 1 (1.4) | 155 (96.9) 5 (3.1) | 0.456 | Reference 0.54 (0.09–3.27) |
| HIV n (%) No Yes | 16 (94.1) 1 (5.9) | 52 (98.1) 1 (1.9) | 0.364 | Reference 2.13 (0.50–9.07) | 70 (100.0) 0 (0) | 158 (98.7) 2 (1.3) | 0.339 | Reference 1.09 (0.22–5.44) |
| AIDS n (%) No Yes | 17 (100.0) 0 (0) | 53 (100.0) 0 (0) | 1 | Reference 2.06 (0.48–8.74) | 70 (100.0) 0 (0) | 158 (98.7) 2 (1.3) | 0.339 | Reference 1.09 (0.22–5.44) |
| Metastasic tumor n (%) No Yes | 17 (100.0) 0 (0) | 52 (98.1) 1 (1.9) | 0.570 | Reference 2.03 (0.48–8.62) | 69 (98.6) 1 (1.4) | 138 (86.3) 22 (13.8) | 0.004 | Reference 0.13 (0.02–0.90) |
| Non metastatic tumor n (%) No Yes | 16 (94.1) 1 (5.9) | 47 (88.7) 6 (11.3) | 0.521 | Reference 0.56 (0.09–3.63) | 64 (91.4) 6 (8.6) | 136 (85.0) 24 (15.0) | 0.186 | Reference 0.63 (0.30–1.31) |
| Lymphoma n (%) No Yes | 17 (100.0) 0 (0) | 50 (94.3) 3 (5.7) | 0.318 | Reference 0.99 (0.17–5.65) | 69 (98.6) 1 (1.4) | 155 (96.9) 5 (3.1) | 0.456 | Reference 0.54 (0.09–3.27) |
| Leukemia n (%) No Yes | 17 (100.0) 0 (0) | 53 (100.0) 0 (0) | 1 | Reference 2.06 (0.48–8.74) | 69 (98.6) 1 (1.4) | 154 (96.3) 6 (3.8) | 0.348 | Reference 0.46 (0.07–2.86) |
| Chronic renal failure n (%) No Yes | 16 (94.1) 1 (5.9) | 45 (84.9) 8 (15.1) | 0.328 | Reference 0.42 (0.06–2.82) | 70 (100.0) 0 (0) | 155 (96.9) 5 (3.1) | 0.137 | Reference 0.54 (0.09–3.24) |
| Asplenia n (%) No Yes | 17 (100.0) 0 (0) | 51 (96.2) 2 (3.8) | 0.418 | Reference 1.33 (0.26–6.96) | 69 (98.6) 1 (1.4) | 160 (100.0) 0 (0) | 0.135 | Reference 1.66 (0.41–6.73) |
| Myocardial infarction n (%) No Yes | 16 (94.1) 1 (5.9) | 50 (94.3) 3 (5.7) | 0.976 | Reference 1.03 (0.18–5.94) | 69 (98.6) 1 (1.4) | 150 (93.7) 10 (6.3) | 0.111 | Reference 0.29 (0.04–1.89) |
| Congestive heart failure n (%) No Yes | 16 (94.1) 1 (5.9) | 45 (84.9) 8 (15.1) | 0.328 | Reference 0.42 (0.06–2.82) | 68 (97.1) 2 (2.9) | 147 (91.9) 13 (8.1) | 0.142 | Reference 0.42 (0.11–1.55) |
| Peripheral vascular disease n (%) No Yes | 16 (94.1) 1 (5.9) | 47 (88.7) 6 (11.3) | 0.521 | Reference 0.56 (0.09–3.63) | 66 (94.3) 4 (5.7) | 151 (94.4) 9 (5.6) | 0.976 | Reference 1.01 (0.44–2.34) |
| Other cardiac diseases n (%) No Yes | 12 (70.6) 5 (29.4) | 37 (69.8) 16 (30.2) | 0.950 | Reference 0.97 (0.39–2.41) | 42 (60.0) 28 (40.0) | 113 (70.6) 47 (29.4) | 0.115 | Reference 1.38 (0.93–2.04) |
| Cerebrovascular disease n (%) No Yes | 16 (94.1) 1 (5.9) | 50 (94.3) 3 (5.7) | 0.976 | Reference 1.03 (0.18–5.94) | 65 (92.9) 5 (7.1) | 159 (99.4) 1 (0.6) | 0.004 | Reference 2.87 (1.90–4.34) |
| COPD n (%) No Yes | 16 (94.1) 1 (5.9) | 48 (90.6) 5 (9.4) | 0.656 | Reference 0.67 (0.11–4.19) | 66 (94.3) 4 (5.7) | 153 (95.6) 7 (4.4) | 0.672 | Reference 1.21 (0.54–2.71) |
| COPD type n (%) Mild Moderate Severe | 0 (0) 1 (100.0) 0 (0) | 0 (0) 2 (50.0) 2 (50.0) | - <0.001 <0.001 | Reference 0.67 (0.08–5.54) 0.67 (0.08–5.54) | 1 (33.3) 2 (66.7) 0 (0) | 1 (20.0) 3 (60.0) 1 (20.0) | 0.030 0.336 <0.001 | Reference 0.80 (0.14–4.62) 1.00 (0.14–7.10) |
| Other respiratory disease n (%) No Yes | 11 (64.7) 6 (35.3) | 45 (84.9) 8 (15.1) | 0.072 | Reference 2.18 (1.00–4.88) | 62 (88.6) 8 (11.4) | 148 (92.5) 12 (7.5) | 0.335 | Reference 1.35 (0.76–2.41) |
| Neurological disease n (%) No Yes | 17 (100.0) 0 (0) | 51 (96.2) 2 (3.8) | 0.418 | Reference 1.33 (0.26–6.96) | 68 (97.1) 2 (2.9) | 150 (93.7) 10 (6.3) | 0.289 | Reference 0.53 (0.15–1.92) |
| Dementia n (%) No Yes | 17 (100.0) 0 (0) | 53 (100.0) 0 (0) | 1 | Reference 2.06 (0.48–8.74) | 70 (100.0) 0 (0) | 158 (98.7) 2 (1.3) | 0.339 | Reference 1.09 (0.22–5.44) |
| Neuromuscular disease n (%) No Yes | 17 (100.0) 0 (0) | 51 (96.2) 2 (3.8) | 0.418 | Reference 1.33 (0.26–6.96) | 67 (95.7) 3 (4.3) | 158 (98.7) 2 (1.3) | 0.156 | Reference 2.01 (0.96–4.24) |
| Chronic kidney disease n (%) No Yes | 16 (94.1) 1 (5.9) | 46 (86.8) 7 (13.2) | 0.414 | Reference 0.48 (0.07–3.18) | 68 (97.1) 2 (2.9) | 149 (93.1) 11 (6.9) | 0.229 | Reference 0.49 (0.14–1.78) |
| Moderate liver disease n (%) No Yes | 17 (100.0) 0 (0) | 42 (79.2) 11 (20.8) | 0.042 | Reference 0.29 (0.04–1.97) | 69 (98.6) 1 (1.4) | 148 (92.5) 12 (7.5) | 0.066 | Reference 0.24 (0.04–1.61) |
| Mild liver disease n (%) No Yes | 17 (100.0) 0 (0) | 50 (94.3) 3 (5.7) | 0.318 | Reference 0.99 (0.17–5.75) | 66 (94.3) 4 (5.7) | 151 (94.4) 9 (5.6) | 0.976 | Reference 1.01 (0.44–2.34) |
| Diabetes n (%) No Yes | 9 (52.9) 8 (47.1) | 46 (86.8) 7 (13.2) | 0.003 | Reference 3.26 (1.52–6.99) | 43 (61.4) 27 (38.6) | 142 (88.7) 18 (11.3) | <0.001 | Reference 2.58 (1.81–3.68) |
| Connective tissue disease n (%) No Yes | 17 (100.0) 0 (0) | 51 (96.2) 2 (3.8) | 0.418 | Reference 1.33 (0.26–6.96) | 70 (100.0) 0 (0) | 155 (96.9) 5 (3.1) | 0.137 | Reference 0.54 (0.09–3.24) |
| Peptic ulcer n (%) No Yes | 16 (94.1) 1 (5.9) | 52 (98.1) 1 (1.9) | 0.394 | Reference 2.13 (0.50–9.07) | 66 (94.3) 4 (5.7) | 153 (95.6) 7 (4.4) | 0.672 | Reference 1.21 (0.54–2.71) |
| Hemophilia n (%) No Yes | 17 (100.0) 0 (0) | 53 (100.0) 0 (0) | 1 | Reference 2.06 (0.48–8.74) | 69 (98.6) 1 (1.4) | 160 (100.0) 0 (0) | 0.135 | Reference 1.66 (0.41–6.73) |
| Anemia n (%) No Yes | 17 (100.0) 0 (0) | 50 (94.3) 3 (5.7) | 0.318 | Reference 0.99 (0.17–5.65) | 67 (95.7) 3 (4.3) | 155 (96.9) 5 (3.1) | 0.648 | Reference 1.24 (0.50–3.11) |
| Obesity n (%) No Yes | 3 (27.3) 8 (72.5) | 25 (59.5) 17 (40.5) | 0.022 | Reference 2.99 (0.89–10.04) | 48 (68.6) 22 (31.4) | 127 (79.4) 33 (20.6) | 0.078 | Reference 1.46 (0.97–2.18) |
| Obesity BMI ≥ 40 n (%) No Yes | 16 (94.1) 1 (5.9) | 49 (92.5) 4 (7.5) | 0.825 | Reference 0.81 (0.13–4.93) | 62 (88.6) 8 (11.4) | 153 (95.6) 7 (4.4) | 0.049 | Reference 1.85 (1.10–3.10) |
Disclaimer/Publisher’s Note: The statements, opinions and data contained in all publications are solely those of the individual author(s) and contributor(s) and not of MDPI and/or the editor(s). MDPI and/or the editor(s) disclaim responsibility for any injury to people or property resulting from any ideas, methods, instructions or products referred to in the content. |
© 2023 by the authors. Licensee MDPI, Basel, Switzerland. This article is an open access article distributed under the terms and conditions of the Creative Commons Attribution (CC BY) license (https://creativecommons.org/licenses/by/4.0/).
Share and Cite
Morales-Suárez-Varela, M.; Toledo, D.; Fernández-Sierra, M.A.; Liébana, M.; Rubiera, G.; Navarro, G.; Prados, C.; Chamarro, J.; Peraita-Costa, I.; Domínguez, A.; et al. A Profile of Adult Severe Acute Respiratory Syndrome Coronavirus 2 Pneumonia Patients According to Pneumococcal Vaccination Status. Vaccines 2023, 11, 1630. https://doi.org/10.3390/vaccines11111630
Morales-Suárez-Varela M, Toledo D, Fernández-Sierra MA, Liébana M, Rubiera G, Navarro G, Prados C, Chamarro J, Peraita-Costa I, Domínguez A, et al. A Profile of Adult Severe Acute Respiratory Syndrome Coronavirus 2 Pneumonia Patients According to Pneumococcal Vaccination Status. Vaccines. 2023; 11(11):1630. https://doi.org/10.3390/vaccines11111630
Chicago/Turabian StyleMorales-Suárez-Varela, María, Diana Toledo, María Amelia Fernández-Sierra, María Liébana, Gerardo Rubiera, Gema Navarro, Concepción Prados, Judith Chamarro, Isabel Peraita-Costa, Angela Domínguez, and et al. 2023. "A Profile of Adult Severe Acute Respiratory Syndrome Coronavirus 2 Pneumonia Patients According to Pneumococcal Vaccination Status" Vaccines 11, no. 11: 1630. https://doi.org/10.3390/vaccines11111630