Article

Kinome Analysis to Define Mechanisms of Adjuvant Action: PCEP Induces Unique Signaling at the Injection Site and Lymph Nodes

1
UVAXX Pte. Ltd., 203 Henderson Industrial Road, Singapore 159546, Singapore
2
Vaccine and Infectious Disease Organization, 120 Veterinary Road, University of Saskatchewan, Saskatoon, SK S7N 5E3, Canada
3
School of Public Health, 107 Wiggins Road, University of Saskatchewan, Saskatoon, SK S7N 5E5, Canada
4
Department of Biochemistry, Microbiology, and Immunology, 107 Wiggins Road, University of Saskatchewan, Saskatoon, SK S7N 5E5, Canada
*
Author to whom correspondence should be addressed.
Vaccines 2022, 10(6), 927; https://doi.org/10.3390/vaccines10060927
Submission received: 13 April 2022 / Revised: 3 June 2022 / Accepted: 7 June 2022 / Published: 11 June 2022
(This article belongs to the Special Issue Vaccine Adjuvants Research)

Abstract

:
Understanding the mechanism of action of adjuvants through systems biology enables rationale criteria for their selection, optimization, and application. As kinome analysis has proven valuable for defining responses to infectious agents and providing biomarkers of vaccine responsiveness, it is a logical candidate to define molecular responses to adjuvants. Signaling responses to the adjuvant poly[di(sodiumcarboxylatoethylphenoxy)phosphazene] (PCEP) were defined at the site of injection and draining lymph node at 24 h post-vaccination. Kinome analysis indicates that PCEP induces a proinflammatory environment at the injection site, including activation of interferon and IL-6 signaling events. This is supported by the elevated expression of proinflammatory genes (IFNγ, IL-6 and TNFα) and the recruitment of myeloid (neutrophils, macrophages, monocytes and dendritic cells) and lymphoid (CD4+, CD8+ and B) cells. Kinome analysis also indicates that PCEP’s mechanism of action is not limited to the injection site. Strong signaling responses to PCEP, but not alum, are observed at the draining lymph node where, in addition to proinflammatory signaling, PCEP activates responses associated with growth factor and erythropoietin stimulation. Coupled with the significant (p < 0.0001) recruitment of macrophages and dendritic cells to the lymph node by PCEP (but not alum) supports the systemic consequences of the adjuvant. Collectively, these results indicate that PCEP utilizes a complex, multi-faceted MOA and support the utility of kinome analysis to define cellular responses to adjuvants.

1. Introduction

By impacting the magnitude, duration, and nature, of the immune response, adjuvant selection can make, or break, a vaccine candidate [1]. Despite this, greater priority is often placed on antigens while relying on historic, empirical approaches to adjuvant selection and optimization. More recently, there has been priority to expand the panel of adjuvants available for human and livestock vaccines and to develop a greater understanding of their mechanisms of action (MOA) [2].
Many consequences of adjuvant administration have been described, ranging from localized depot effects [3], enhanced uptake and presentation of antigens [4,5], to higher-order impacts on immune response, including modulation of cytokine and chemokine profiles [6,7,8] and recruitment of immune cells [8,9]. Increasingly, there are efforts to elucidate different molecular MOA of adjuvants through omics approaches within the context of systems vaccinology [2]. Here the priority is to gain insight into the cellular responses induced by different adjuvants, at different biological locations, and to correlate these induced responses with various indicators of vaccine efficacy. To this objective, transcriptional responses has frequently been applied to define responses to common adjuvants [10,11,12,13,14]. From these efforts, a panel of “adjuvant core response genes” have been identified, as well as defining various molecular effectors including cytokines, chemokines, innate immune receptors, interferon-induced genes, and adhesion molecules [6]. While transcriptional profiling offers some advantages in terms of the maturity of the technology, ease of application, and magnitude of coverage, the findings must be interpreted with the caveat of potential disconnect between transcriptional and phenotypic responses due to post-transcriptional and post-translational regulatory events.
Kinase-mediated protein phosphorylation is the central mechanism for regulation of many cellular processes, including those associated with innate and adaptive immunity [15]. Investigations of global patterns of kinase-mediated signaling (kinome analysis) has emerged as a powerful tool to understand complex cellular biology [16]. Within that, kinome peptide arrays have demonstrated utility for deciphering immunity, including characterizing host-pathogen interactions [17,18,19], anticipating individual responses to vaccination [20], and describing cellular responses to discrete molecules (such as pathogen-associated molecular patterns) that are often employed as vaccine adjuvants [21,22]. Tissue and individual-specific signaling differences have been defined [23], supporting the use of the technology to define individualized responses to vaccines as well as characterizing different routes of vaccine delivery and unique sites of adjuvant action. The technology has proven robust in defining responses in biologically complex samples, including peripheral blood mononuclear cells [20], muscle and gut tissue [19,24], and whole insect homogenates [25]. Collectively, kinome analysis appears a strong candidate to be included within systems vaccinology approaches to define adjuvant MOA.
Polyphosphazenes are a novel category of adjuvants shown to be effective in a range of species through both parenteral and mucosal delivery [26,27]. These high molecular weight synthetic polymers consist of a backbone of alternating phosphorus and nitrogen atoms with organic side groups anchored to the phosphorus atoms [28,29]. Of the polphosphazenes, poly[di(sodiumcarboxylatoethylphenoxy)phosphazene] (PCEP), has demonstrated considerable ability to promote high-titre, long-lasting, immune responses to several antigens [30,31,32,33]. Through systemic and mucosal administration, including respiratory, oral, rectal, and intravaginal routes, PCEP promotes a balanced Th1/Th2 type response [26,27], and functions well in combination with other adjuvants [34]. These characteristics prompted interest to advance PCEP as an adjuvant for human and veterinary applications.
There is growing appreciation of the biological complexity of the MOA of polphosphazenes. Indications of their immunostimulatory properties indicate that the formation of depots at the injection site offer minimal contribution to their adjuvant activity [31], although complexes with the antigen do facilitate antigen delivery to immune cells [35]. Recent efforts attribute their activity to stimulation of immune responses at the injection site [4], splenocytes [27,36], and lymph nodes [37]. The potential of PCEP as an adjuvant for human and animal vaccines, coupled with indications of a diverse and biological complexity MOA, make it an ideal candidate for investigation of kinome analysis to describe molecular responses to adjuvants.

2. Materials and Methods

2.1. Adjuvants

PCEP was generated by Idaho National Laboratory (Idaho Falls, ID, USA) using described methods [36,37]. Endotoxin levels within PCEP were determined to be less than 0.034 ng/mL as assessed by the Limulus Amebocyte Lysate assay (Biowhittaker, Walkersville, MD, USA). PCEP was dissolved in Dulbecco’s phosphate buffered saline (PBS) (Gibco, Grand Island, NY, USA). The alum adjuvant (Thermo Fisher Scientific, Rockford, IL, USA) is a mixture of alum and magnesium hydroxide (40 mg/mL).

2.2. Mouse Trials

Female BALB/c mice (purchased from Charles River Laboratories, North Franklin, CT, USA) of 4–6 weeks of age were used in these experiments. The animal experiments were approved by the University of Saskatchewan’s Animal Research Ethics Board and adhered to the Canadian Council on Animal Care guidelines for humane use of animals.

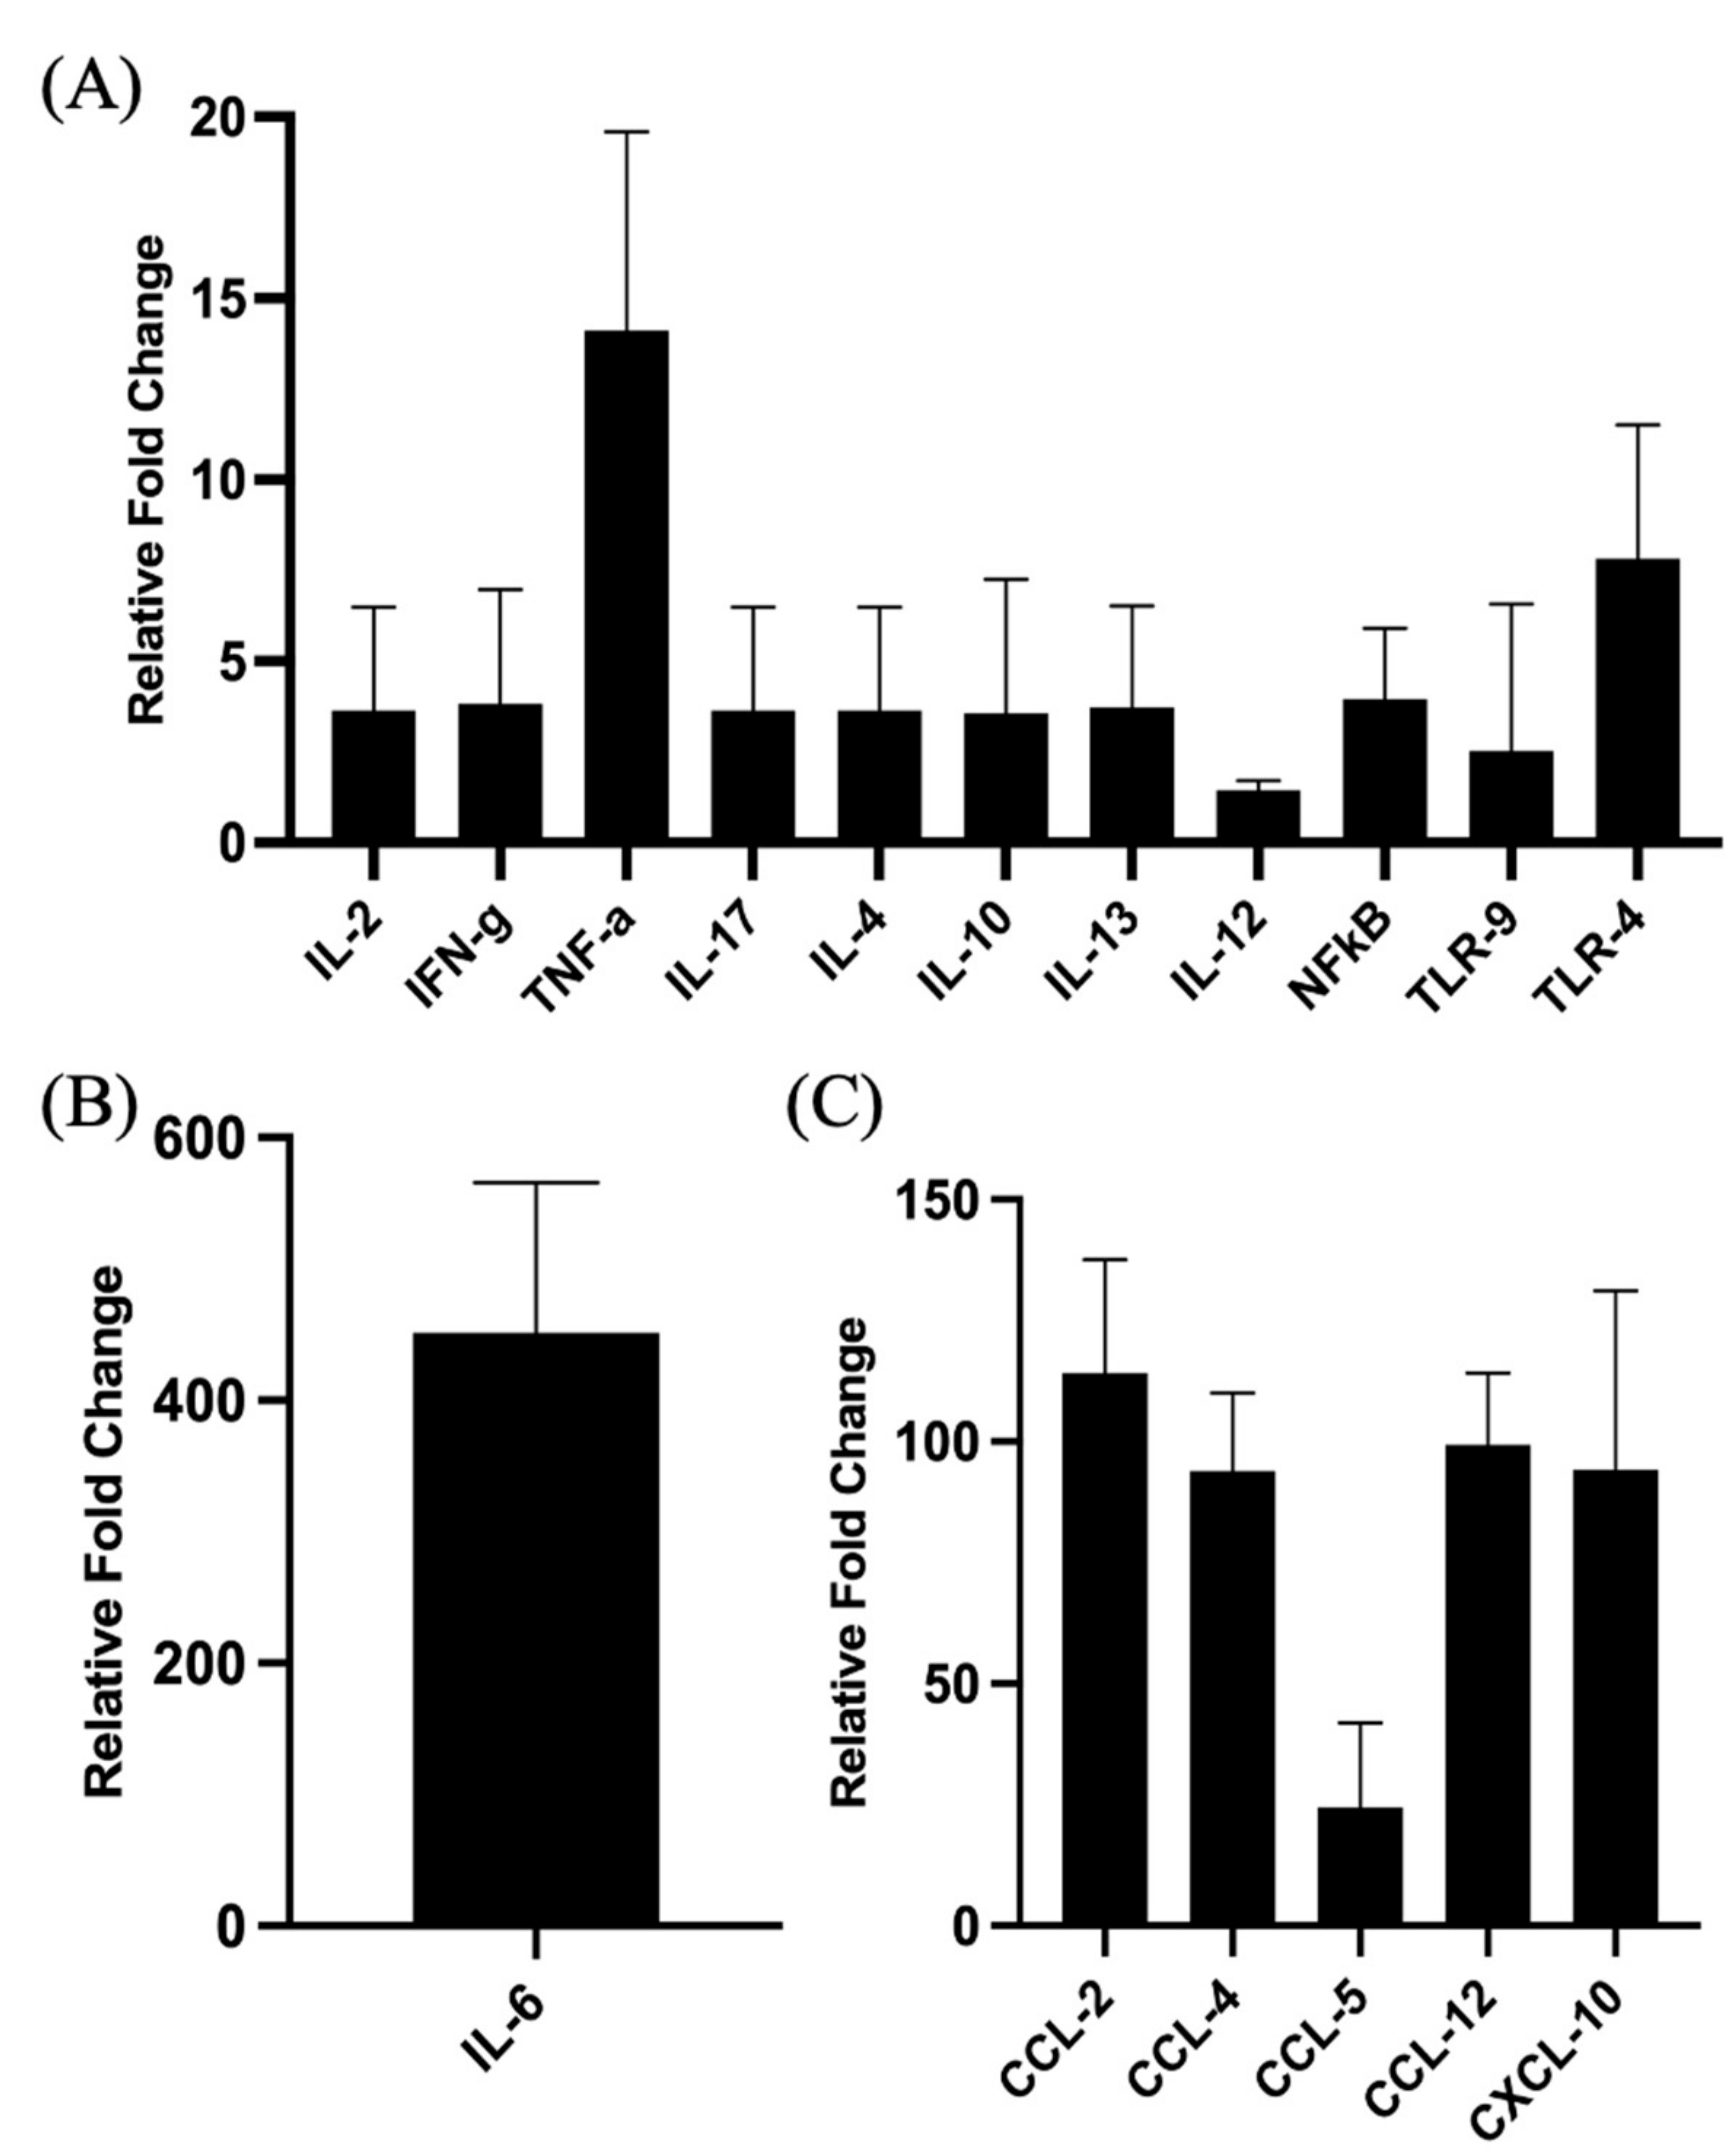
2.3. Quantitative Real-Time PCR (qRT-PCR)

Female BALB/c mice (n = 6) were injected intramuscularly (i.m) in the quadriceps muscle with 25 μL of either phosphate-buffered saline (PBS) as control or 50 μg PCEP per animal. As the trauma caused by injecting a liquid into the tissue is sufficient to alter gene expression [6,38], the PBS-injected group is an important control. Mice were euthanized and samples collected at 24 h post-injection.
Immediately after mice were euthanized, whole muscle tissues from the thigh were collected in TRIzol (Invitrogen) and aseptically homogenized with 2.3 mm Zirconia microbeads (Biospec Products Inc., Bartlesville, OK, USA) in a Mini-BeadbeaterTM (Biospec Products Inc., Bartlesville, OK, USA). The homogenates were centrifuged for 1 min at 10,000× g, and the supernatants were collected for total RNA extraction as per the manufacturer’s instruction. The extracted RNA was quantified and treated with DNase (Invitrogen). The cDNA was synthesized using random hexamers (Applied Biosystems) and SuperScript®® II Reverse Transcriptase (Invitrogen) as per manufacturer’s instruction. All PCR reactions were carried out in duplicate in 96-well plates with optical quality tape (Bio-Rad) using an iCycler iQ®® Real-Time PCR Detection System (Bio-Rad, Hercules, CA, USA). Each PCR reaction contained 1 μL target cDNA, 0.2 μM each of forward and reverse primers, 7.5 μL of iQ SYBR®® Green Supermix (Invitrogen) and distilled water to 15 μL of final volume according to manufacturer’s instruction. The negative control contained all the reagents except cDNA. All the primers used in quantitative RT-PCR are shown in Table 1. Reference genes GAPDH, RPL19 and18 s rRNA were analyzed and the best (GAPDH) was selected for further analysis. Amplification was performed by initial denaturation at 95 °C for 3 min in cycle 1, followed by cycle 2 (95 °C, 15 s; 55 °C, 30 s; 72 °C, 30 s) ×45 and then cycle 3, the Melt curve analysis, was pre-set at 55 °C ramping to 95 °C with 1 °C increase each 10 s and final hold at 20 °C. A Melt Curve analysis was performed to ensure that any product detected was specific to the desired amplicon.

2.4. Isolation of Recruited Cells from Site of Injection and Draining Lymph Node

Female BALB/c mice were divided into three groups (n = 5 per group) and were injected i.m on both legs with 25 μL of either PBS as control, 50 μg PCEP, or 0.5 mg of alum. At 24 h post-injection, muscle tissues were dissected from the site of injection, minced, and incubated with digestion buffer (Hank’s Balanced Salt Solution [HBSS] [Gibco] supplemented with 0.1% type II collagenase D [Worthington Biochemical, NJ, USA], 0.2% BSA [Sigma–Aldrich, MO, USA], 0.025% trypsin [Gibco] and 0.01% DNase I [Roche Diagnostics, Germany]) for 45 min at 37 °C under constant agitation. The cell suspension was filtered through 70 μm cell strainer and layered on 25% percoll (GE healthcare, Chicago, IL, USA) and centrifuged at 2000× g for 1 h. The cell pellets were washed twice, resuspended in RPMI (Gibco) with 10% FBS (Gibco), and used for fluorescent labeling for FACS analysis. Cell viability was estimated by Trypan Blue (Gibco) exclusion.
The draining inguinal lymph nodes were dissected, minced, and incubated with digestion buffer containing 2 mg/mL collagenase D (Roche Diagnostics, Mannheim, Germany) and 0.25 mg/mL DNase I in HEPES (Gibco) for 15 min at 37 °C. These samples were then filtered through 70 μm cell strainer to obtain a single cell suspension which was used for fluorescent labeling for FACS analysis.

2.5. Flow Cytometry

For FACS analysis, all the cells were stained in the presence of an Fc block. For staining, cells were incubated for 20 min at 4 °C using the following antibodies: CD11b-FITC, Ly6C-APC, Ly6G-APC, F4/80- PE, CD11c-PE, CD3-APC, CD8-FITC, CD4-FITC, CD19-FITC (all from eBiosciences, CA, USA) and CD8-PerCP-Cy5.5, CD4-PerCP-Cy5.5 (all from BD Biosciences). The following markers were used to identify specific cell types: monocytes (CD11b+ Ly6C+), neutrophils (CD11b+ Ly6G+), macrophages (F4/80), dendritic cells (CD11c), B cells (CD19), CD4+ T cells (CD3+ CD4+) and CD8+ T cells (CD3+ CD8+).
Unstained cells were used to set up the instrument. Compensation controls were set up using single stains and isotype controls were used to determine the level of non-specific binding. The cells were gated based on simple forward and side scatter patterns. Furthermore, all the dead cells were excluded using the viability dye, propidium iodide and doublet discrimination was performed by plotting FSC-H vs. FSC-A. If we take the example of lymphocytes, they were identified and gated by their forward and side scatter patterns. The CD3+ T cells were then further identified and gated by the expression of CD4+ and CD8+. The expression of surface markers was assessed using CellQuest analysis software on a FACSCalibure flow cytometer (BD Biosciences).

2.6. Peptide Arrays for Kinome Analysis

Female BALB/c mice were divided into three groups (n = 5) and were injected i.m on both legs with 25 μL of either PBS as control, 50 μg PCEP, or 0.5 mg of alum. At 24 h post injection, muscle tissues were dissected from the site of injection, minced, and incubated with digestion buffer (Hank’s Balanced Salt Solution [HBSS] [Gibco] supplemented with 0.1% type II collagenase D [Worthington Biochemical, Lakewood, NJ, USA], 0.2% BSA [Sigma–Aldrich, MO, USA], 0.025% trypsin [Gibco] and 0.01% DNase I [Roche Diagnostics, Germany]) for 45 min at 37 °C under constant agitation. The cell suspension was filtered through 70 μm cell strainer and layered on 25% percoll (GE healthcare, Chicago, IL, USA) and centrifuged at 2000× g for 1 h. The cell pellets were washed thrice with ice-cold PBS and stored at −20 °C until further use.
Similarly, the draining inguinal lymph nodes were dissected, collected, minced, and incubated with digestion buffer containing 2 mg/mL collagenase D (Roche Diagnostics, Mannheim, Germany) and 0.25 mg/mL DNase I in HEPES (Gibco) for 15 min at 37 °C. It was then filtered through 70 μm cell strainer to obtain a single cell suspension. The cells were washed thrice with ice-cold PBS and stored at −20 °C until further use.
Protocols for the design and application of the peptide arrays have been described [20]. Arrays were constructed by a commercial provider (JPT Innovative Peptide Solutions, Berlin, Germany and designed to include peptides representing phosphorylation events associated with a wide variety of signaling pathways. Each array includes nine technical replicates of each of the 282 unique peptides. All kinome experiments were performed on the same day to minimize potential inter-assay variance.

2.7. Analysis of Kinome Data

Peptide-spot intensities were transformed using a variance-stabilizing normalization (VSN) method through the online software, PIIKA 2.0 (https://saphire.usask.ca/saphire/piika2.0/) [39]. Peptides that showed variation in technical replicates via Chi-squared test (χ2 < 0.01) were removed from subsequent analysis. Consistent technical replicates were averaged together, and fold-change (FC) for each peptide was calculated as previously described [20]. Theta-distributed stochastic neighbour embedding(t-SNE) analysis and hierarchical clustering were conducted using peptides with consistent phosphorylation (χ2 > 0.01). The t-SNE analysis was conducted using the R package Rtsne (https://github.com/jkrijthe/Rtsne) (accessed on 14 June 2021) and visualized using ggplot2 (https://ggplot2.tidyverse.org) (accessed on 14 June 2021). The t-SNE analysis was performed 100 times and the result with the lowest value of the objective function was selected. The construction of the heatmap using PIIKA 2.0 has been previously [39]. Hierarchical clustering was conducted using the Pearson correlation distance and McQuitty linkage. Peptides were considered differentially phosphorylated under two given criteria: first, the peptide was consistently phosphorylated according to the Chi-squared test and second, the VSN-transformed phosphorylation intensity of an individual peptide was significantly different (two-tailed Welch’s t-test for Unequal Variances, p < 0.05) between cohorts.

2.8. Pathway Over-Representation Analysis

Peptides that were differentially phosphorylated were subjected to pathway over-representation analysis (ORA) using InnateDB [40]. ORA was completed using the hypergeometric algorithm with Benjamani–Hochberg correction method, and pathways were considered statistically significant with a false discovery rate (FDR) of p < 0.05.

2.9. Statistical Analysis

The increase in target gene expression levels in PCEP stimulated muscle tissues were calculated as fold change increase (2−ΔΔCT). The data for cell recruitment were analyzed using Graph-Pad Prism 6 software (GraphPad Software, San Diego, CA, USA). Differences in the cell numbers between the treatments were analyzed by two-way ANOVA by Ranks and the significant differences between the treatments were compared by Bonferroni multiple-comparison test where **** p < 0.0001, *** p < 0.001, ** p < 0.005, * p < 0.05.

3. Results

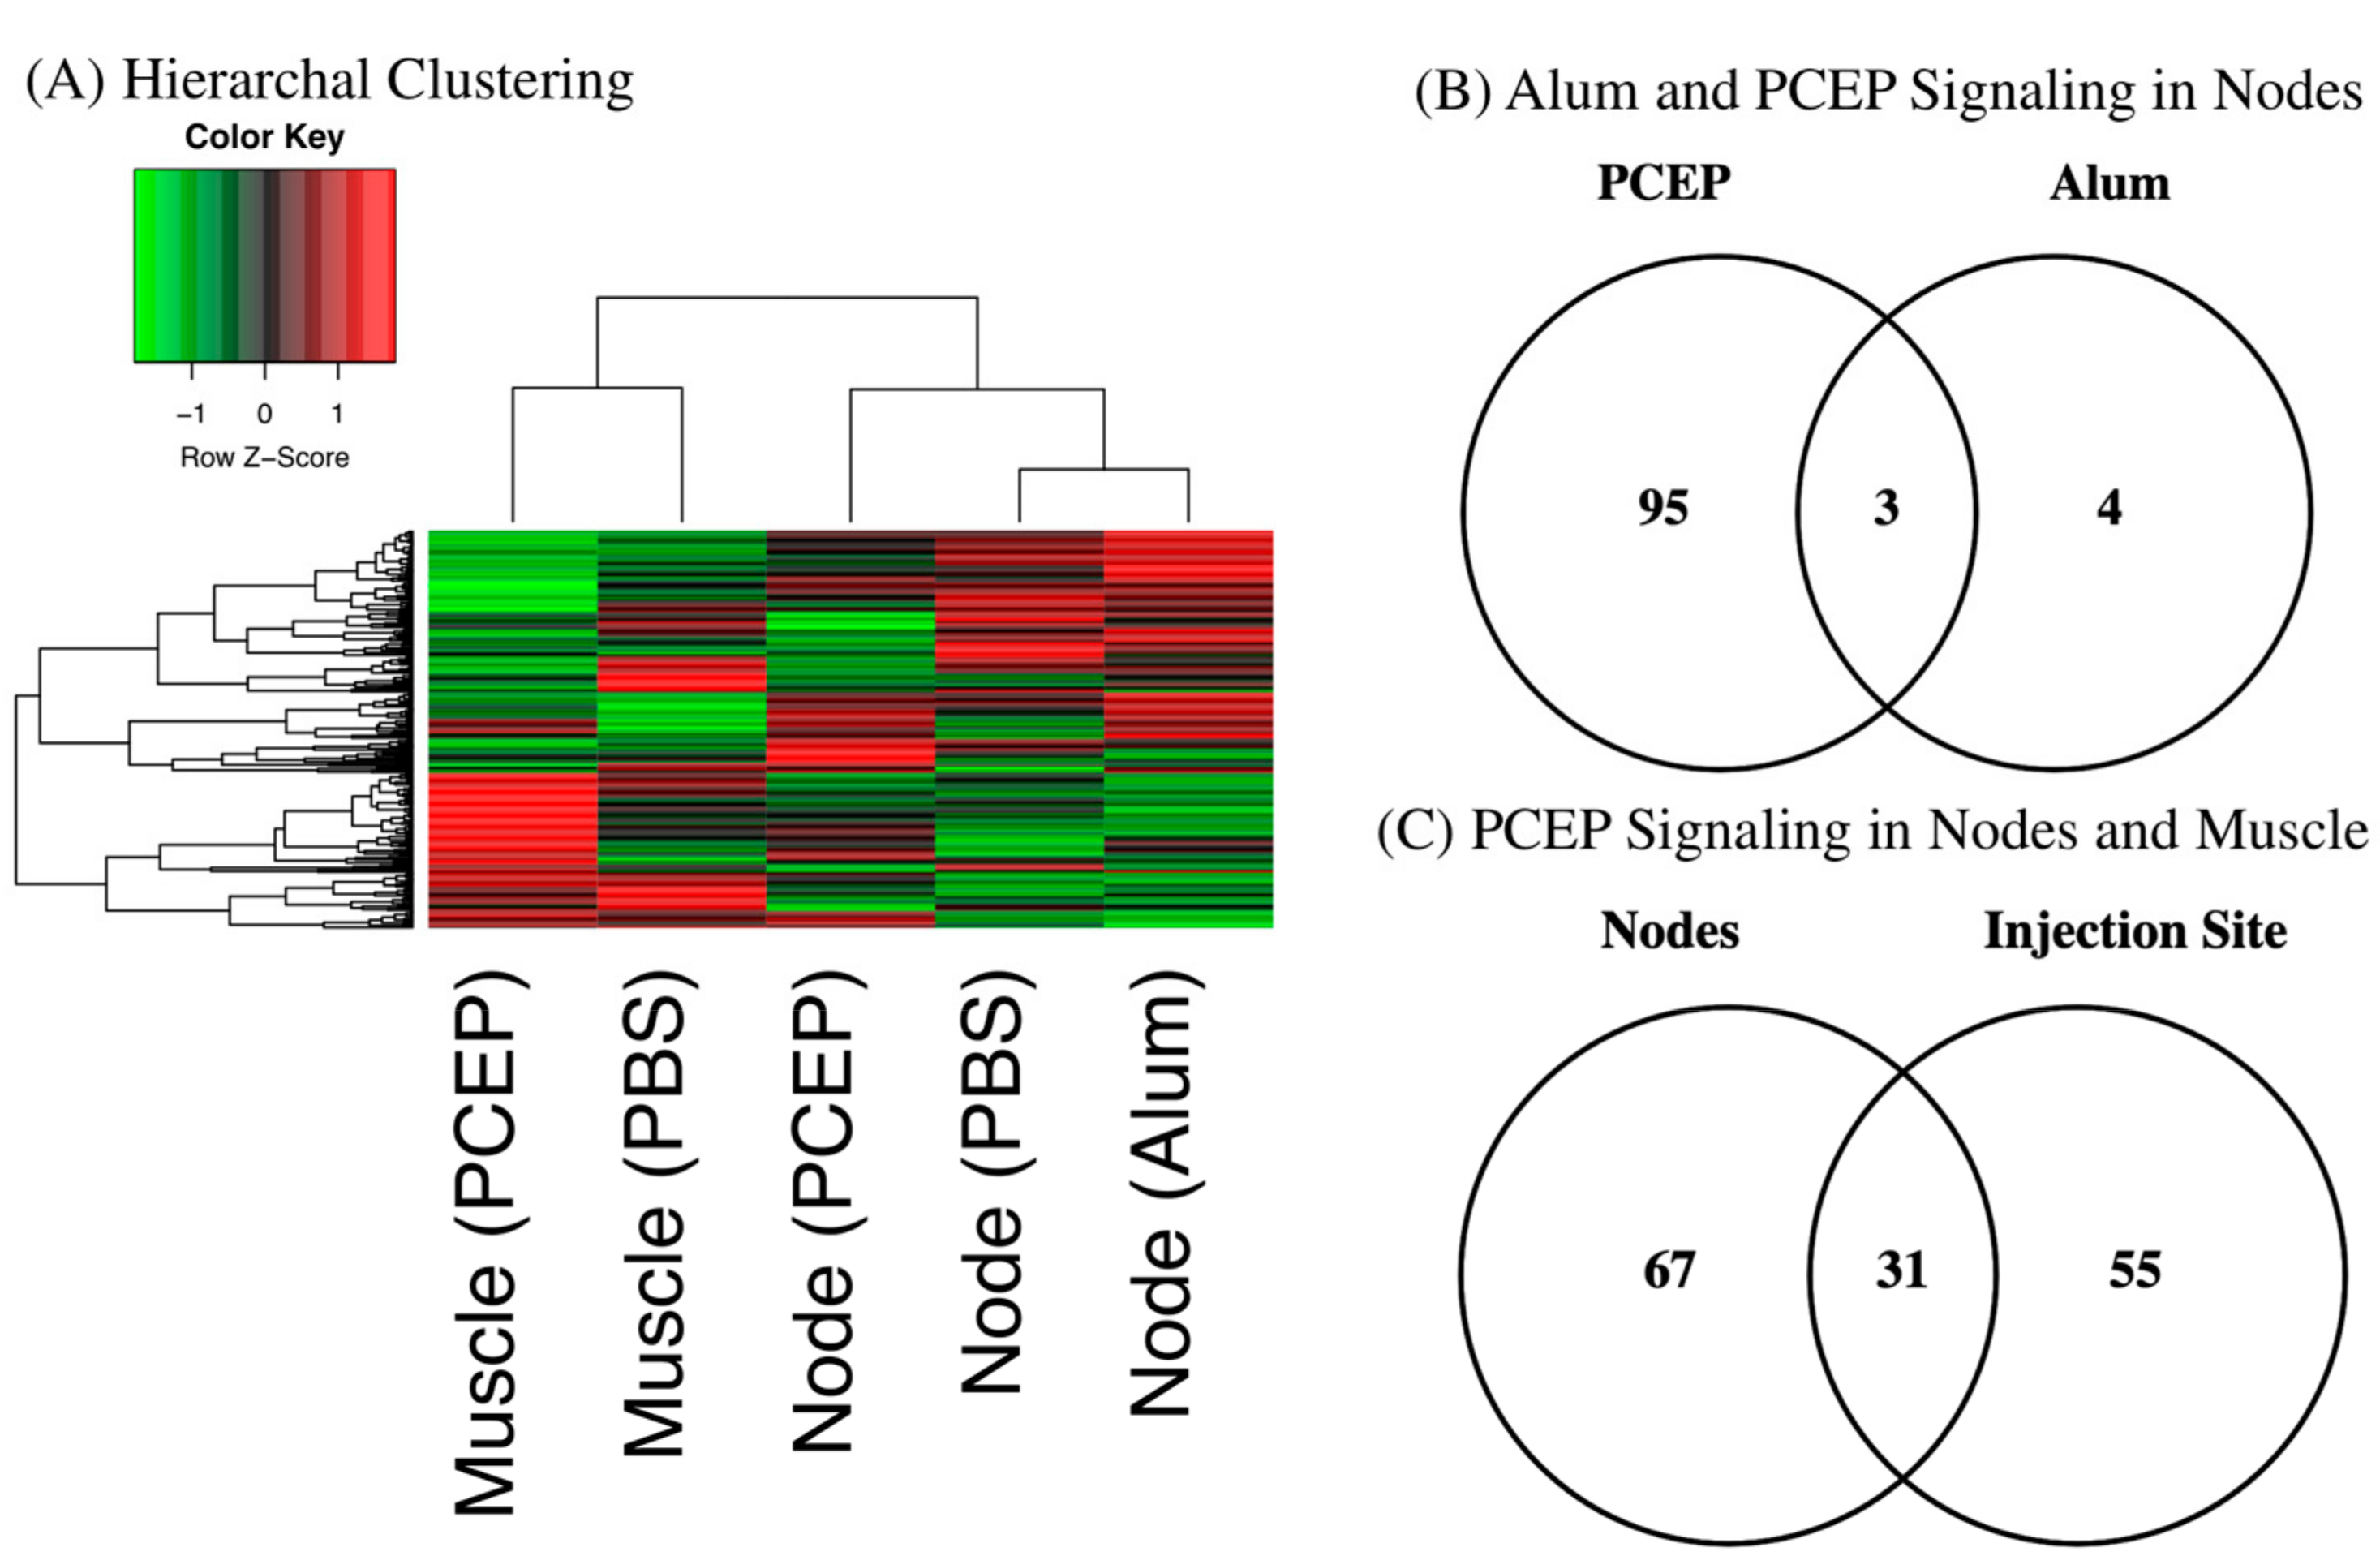
3.1. Kinome Analysis

Hierarchal clustering of the kinome datasets indicates tissue-specific differences in signaling between the injection site and draining lymph nodes (Figure 1A). These differences are anticipated given the distinct functions of these tissues [41]. Hierarchal clustering also offers indication of the relative magnitude of the differential responses to each adjuvant at the lymph node; close clustering of the alum and PBS datasets, relative to PCEP, indicates the more dramatic consequences of PCEP. These differential magnitudes of response are quantified through consideration of the number of peptides which are differentially phosphorylated peptide in response to each adjuvant; seven for alum and 98 for PCEP (Figure 1B). In comparing the tissue-specific responses, PCEP induces pronounced signaling responses at both the injection site (98 differentially phosphorylated peptides) and the lymph nodes (86 differentially phosphorylated peptides), but these responses are quite distinct, indicating PCEP induces systemic, tissue-specific responses (Figure 1C).

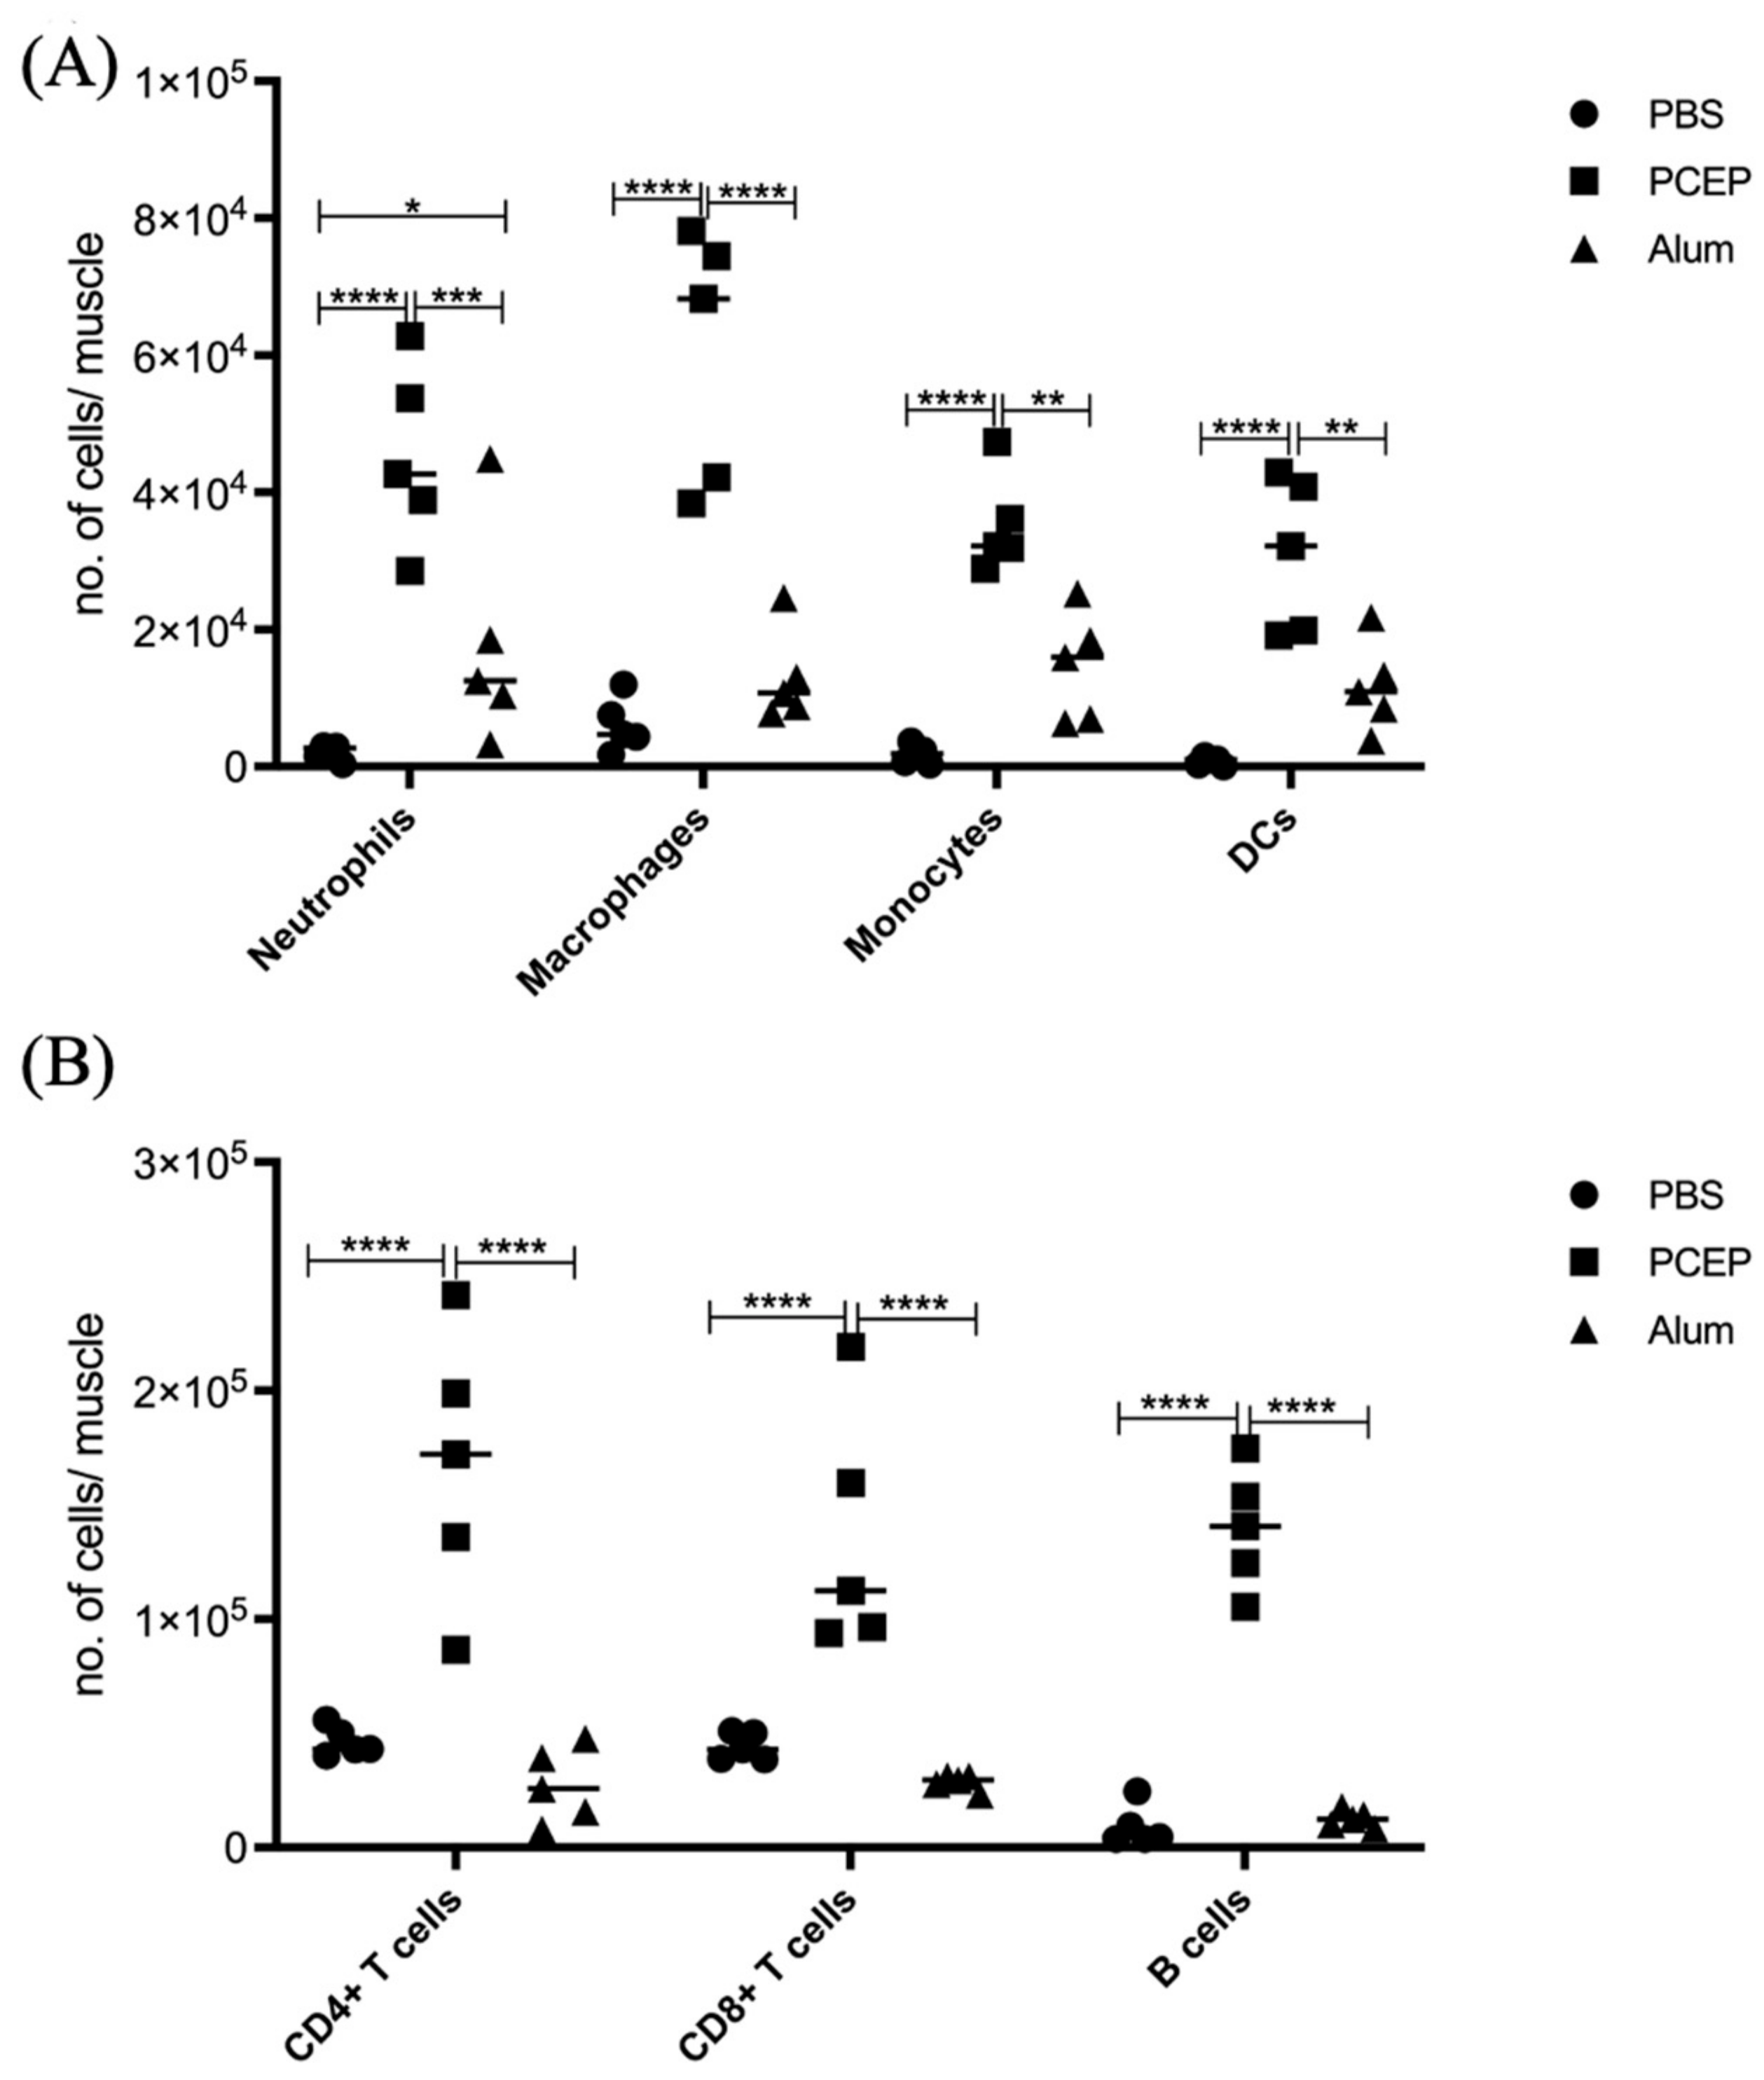
3.2. Signaling Events at the Injection Site

At the site of injection, administration of PBS is likely to cause localized tissue damage that result in cellular responses [6,38]. By comparing the responses to adjuvant relative to the PBS control of the same tissue enables identification of adjuvant-specific signaling responses. At the site of injection, 87 peptides show significant (p < 0.05) differences in phosphorylation levels in response to PCEP relative to the PBS control (Table 2). Within these differentially phosphorylated peptides, there is an approximately equal proportion of peptides with increased or decreased phosphorylation. Pathway overrepresentation analysis of these proteins associated with these phosphorylation events indicates activation of pro-inflammatory immune responses. Specifically, the patterns of peptide phosphorylation indicate activation of interferon-mediated signaling as well as activation of branches of the innate immune response, including Toll-like receptor and interleukin signaling (Table 3).

3.3. Validation of Signaling Events at Site of Injection

The proinflammatory responses to PCEP were investigated through quantitative RT-PCR of a panel of known pro-inflammatory genes. Consistent with the kinome data, there is increased expression of pro-inflammatory genes, most notably for Il-6 (Figure 2B) but also for TLRs, TNFα and IFNγ (Figure 2A). Increased expression of members a family of chemokine receptors, which is also characteristic of proinflammatory responses, is observed at the injection site (Figure 2C). The functional consequences of PCEP, and further evidence of the pro-inflammatory responses induced by this adjuvant, are supported by patterns of cell migration to the injection site. A variety of immune cells, including myeloid cells (neutrophils, macrophages, monocytes and dendritic cells) (Figure 3A) and lymphoid cells (CD4+, CD8+, and B cells), were recruited to the injection site (Figure 3B).

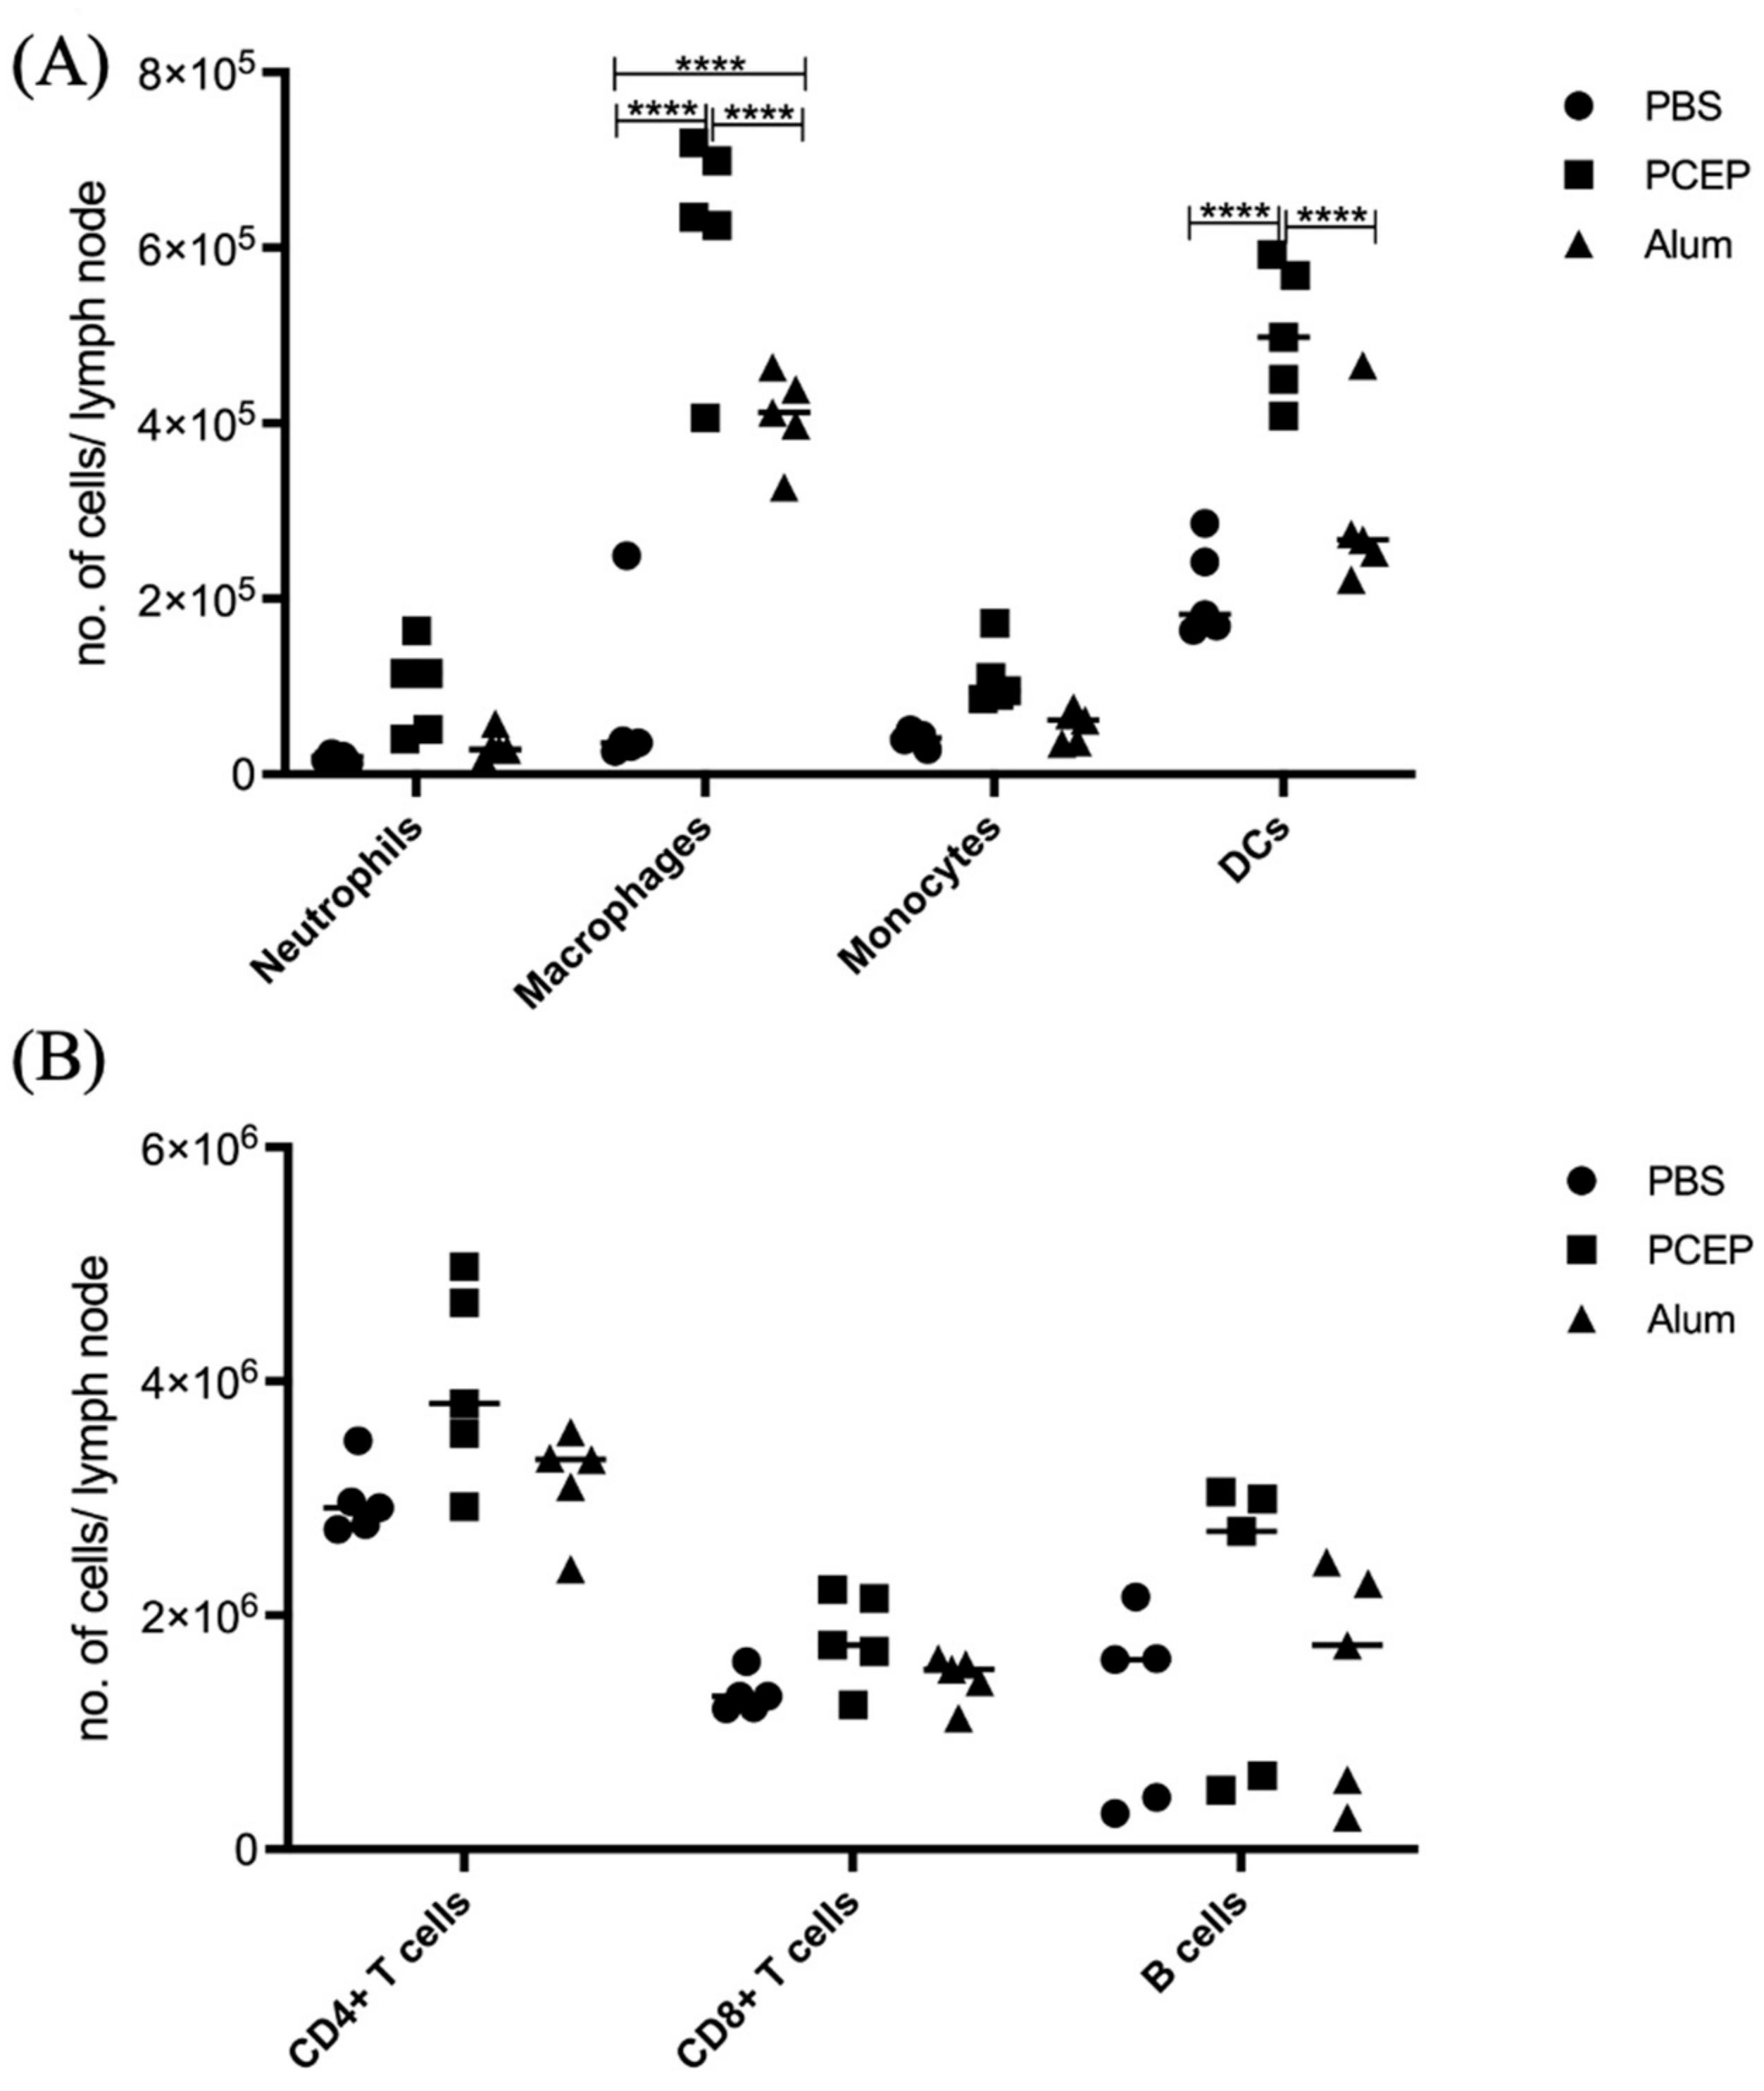
3.4. Signaling Events at the Draining Lymph Nodes

At the draining lymph nodes, 98 peptides show significant (p < 0.05) differences in phosphorylation levels in response to PCEP at 24 h post-injection (Table 4). By comparison, alum induced differential phosphorylation of only 7 peptides (Table 5). This indicates that the impact of alum is largely localized to site of injection, whereas PCEP induces more systemic immune responses. Pathway overrepresentation analysis indicates that PCEP induces pro-inflammatory innate immune responses at the draining lymph node, as indicated by the Jak-Stat signaling pathway, interleukin signaling pathways (including Il-2, Il-6, and Il-7), as well as activation of pathways associated with vascular endothelial growth factor (VEGF), erythropoietin (EPO) and transforming growth factor beta (TGFβ) (Table 6). The small number of differential phosphorylated peptides at the lymph nodes in response to alum negates the ability to perform pathway analysis.

3.5. Validation of Signaling Events at Draining Lymph Nodes

The differential impacts of alum and PCEP on signaling at the lymph node are supported by patterns of immune cell migration; in response to PCEP all of categories of immune cells considered, including macrophages, neutrophils, monocytes, dendritic cells, B cells, CD4+, and CD8+ cells, were significantly higher in lymph nodes of animals administered with PCEP (Figure 4). In contrast, fewer categories of immune cells, and to lesser degrees, were impacted by the administration of alum.

4. Discussion

Within this investigation, kinome profiling was performed to define signaling events to PCEP at the injection site and draining lymph node at twenty-four hours post-injection. At the injection site, PCEP induced pro-inflammatory signaling, as exemplified by the Jak-Stat pathway. PCEP-induced activation of interferon-based signaling was supported by elevated expression of proinflammatory genes as well as recruitment of immune cells. This supports the hypothesis that an element of the MOA of PCEP resides in its ability to promote a pro-inflammatory environment at the injection site. Kinome analysis also indicates that responses to PCEP are not restricted to the injection site as strong signaling responses, relative to alum and distinct from those observed at the injection site, occur at the draining lymph node. Consistent with that, PCEP resulted in significantly higher recruitment of immune cells to the lymph node than alum. Collectively, these results indicate that the complex, multi-faceted adjuvant activity of PCEP and support the utility of kinome analysis to define adjuvant MOA.
In 2015, Hagan and Fox predicted a “New Golden Age” for vaccine adjuvants [42]. This enthusiastic assessment was based on an expanding knowledge of adjuvant MOA that was largely enabled through systems vaccinology approaches. While initially overlooked, we now have fuller appreciation of the ability of adjuvants to improve the range, practicality, and efficacy of vaccines through dose sparing, enabling rapid immune responses, broadening of the induced antibody response, and optimizing of the magnitude of the vaccine-associated antibody response [1,2]. Adjuvants can also be the critical determinants of new categories of vaccines, including for the induction of T cell responses, mucosal vaccines, and personalized vaccines. This includes interest in individual adjuvants with these characteristics as different formulations and co-formulations. Within this power to impact immune responses, there is also the appreciation of the potential for unintended, and potentially detrimental responses, both at the site of administration as well as systemic consequences [43].
The value of systems vaccinology is to identify molecular responses to immunization to identify surrogate markers of immunogenicity and reactogenicity that anticipate whether the patient will develop the desired immune response (correlates of immunity) and/or will be protected from the targeted disease (correlates of protection), as well as to understanding the underlying mechanisms of these outcomes [44]. These responses occur at the site of injection as well as other immune related locations, such as peripheral blood mononuclear cells and lymph nodes. While systems vaccinology approaches have largely been grounded in transcriptional analysis, that various adjuvants are known to activate signaling pathways associated with innate and adaptative immune responses, coupled with recent advances in technologies for defining global patterns of phosphorylation-mediated signal transduction, there is both opportunity and priority to apply kinome analysis to define adjuvant MOA. The motivations for the current investigation were to define biological responses to an important adjuvant, including considerations of localized and systemic effects, as well as to investigate kinome analysis as a tool to define adjuvant MOA.
With respect to the MOA of PCEP, the current work supports the hypothesis this adjuvant functions through both localized and systemic immune responses. At the site of injection, there is clear indication of activation of proinflammatory signaling beyond that resulting from general tissue damage [38]. This offers mechanistic explanation and additional dimension of the observed patterns of induced expression of a variety of proinflammatory genes. There have also been indications that the MOA of PCEP is not limited to the site of injection with indication of activation of higher-order immune response as suggested by patterns of increased patterns migration of immune cells to lymph nodes in response to PCEP administration [37]. With that, however, there was minimal information about the biochemical basis of these changes, including potential insights into biomarkers, as well as comparable analysis of these changes to other adjuvants. The kinome analysis of the responses within the lymph nodes to PBS, alum, and PCEP provides context of the magnitude of systemic responses induced by PCEP relative to alum; a difference of 100 versus 7 differentially phosphorylated peptides. Within those signaling responses, there are the anticipated changes to signaling associated with inflammatory responses as well as activation of erythropoietin (EPO) mediated signaling. Within mouse models, it has been demonstrated that administration, or engineered overexpression, of EPO increased humoral antibody responses to several antigens [45]. Similarly, administration of EPO to patients with chronic kidney disease improved vaccine responsiveness [46]. Erythropoietin treatment is also associated with an augmented immune response to the influenza vaccine in hematologic patients [47]. Collectively this suggests a role for EPO in humoral immune responses. The implication that PCEP administration influences EPO signaling within the lymph nodes merits further investigation as a potential MOA. Collectively, the results of this investigation highlight and detail the complex, multi-faceted MOA of PCEP while supporting the utility of kinome analysis as a tool to define responses to adjuvants.

Author Contributions

Conceptualization: S.A., G.M. and S.N.; Methodology: S.A. and E.S.; Validation: S.A. and E.S.; Formal analysis: E.S. and S.A.; Investigation: S.A and E.S.; Writing—original draft preparation: S.A. and S.N.; Writing—review and editing: S.A., E.S., G.M. and S.N.; Visualization: S.A. and E.S.; Supervision, G.M. and S.N.; Project administration: G.M. and S.N.; Funding acquisition: G.M. and S.N. All authors have read and agreed to the published version of the manuscript

Funding

S.N received funding from Natural Sciences and Engineering Research Council of Canada Discovery Grant RGPIN-05690-2018 and G.M received funding from Natural Sciences and Engineering Research Council of Canada Grant number 402993 (https://www.nserc-crsng.gc.ca/).

Institutional Review Board Statement

The study was done in accordance with the Canadian Council on Animal Care guidelines, and experimental protocols were approved by the University of Saskatchewan Animal Research Ethics Board (protocol code-19940212 and date of approval 26 January 2011).

Acknowledgments

This research was enabled by individual Discovery Grants from the Natural Sciences and Engineering Research Council of Canada (NSERC) to SN and GM. VIDO also receives operational funding from the Government of Saskatchewan through Innovation Saskatchewan and the Ministry of Agriculture. Published with permission of the Director of VIDO as manuscript #945.

Conflicts of Interest

The authors declare no conflict of interest.

References

  1. Reed, S.G.; Orr, M.T.; Fox, C.B. Key roles of adjuvants in modern vaccines. Nat. Med. 2013, 19, 1597–1608. [Google Scholar] [CrossRef] [PubMed]
  2. Nanishi, E.; Dowling, D.J.; Levy, O. Toward precision adjuvants: Optimizing science and safety. Curr. Opin. Pediatr. 2020, 32, 125–138. [Google Scholar] [CrossRef] [PubMed] [Green Version]
  3. Morefield, G.L.; Sokolovska, A.; Jiang, D.; HogenEsch, H.; Robinson, J.P.; Hem, S.L. Role of aluminum-containing adjuvants in antigen internalization by dendritic cells in vitro. Vaccine 2005, 23, 1588–1595. [Google Scholar] [CrossRef] [PubMed]
  4. Seubert, A.; Monaci, E.; Pizza, M.; O’Hagan, D.T.; Wack, A. The adjuvants aluminum hydroxide and MF59 induce monocyte and granulocyte chemoattrac- tants and enhance monocyte differentiation toward dendritic cells. J. Immunol. 2008, 180, 5402–5412. [Google Scholar] [CrossRef]
  5. Wilson-Welder, J.H.; Torres, M.P.; Kipper, M.J.; Mallapragada, S.K.; Wannemuehler, M.J.; Narasimhan, B. Vaccine adjuvants: Current challenges and future approaches. J. Pharm. Sci. 2009, 98, 1278–1316. [Google Scholar] [CrossRef]
  6. Mutwiri, G.; Benjamin, P.; Soita, H.; Babiuk, L.A. Co-administration of polyphosphazenes with CpG oligodeoxynucleotides strongly enhances immune responses in mice immunized with Hepatitis B virus surface antigen. Vaccine 2008, 26, 2680–2688. [Google Scholar] [CrossRef]
  7. Li, H.; Nookala, S.; Re, F. Aluminum hydroxide adjuvants activate caspase-1 and induce IL-1beta and IL-18 release. J. Immunol. 2007, 178, 5271–5276. [Google Scholar] [CrossRef]
  8. Mosca, F.; Tritto, E.; Muzzi, A.; Monaci, E.; Bagnoli, F.; Iavarone, C.; O’Hagan, D.; Rappuoli, R.; De Gregorio, E. Molecular and cellular signatures of human vaccine adjuvants. Proc. Natl. Acad. Sci. USA 2008, 105, 10501–10506. [Google Scholar] [CrossRef] [Green Version]
  9. Calabro, S.; Tortoli, M.; Baudner, B.C.; Pacitto, A.; Cortese, M.; O’Hagan, D.T.; De Gregorio, E.; Seubert, A.; Wack, A. Vaccine adjuvants alum and MF59 induce rapid recruitment of neutrophils and monocytes that participate in antigen transport to draining lymph nodes. Vaccine 2011, 29, 1812–1823. [Google Scholar] [CrossRef]
  10. Caproni, E.; Tritto, E.; Cortese, M.; Muzzi, A.; Mosca, F.; Monaci, E.; Baudner, B.; Seubert, A.; Gregorio, D.G. MF59 and Pam3CSK4 boost adaptive responses to influenza subunit vaccine through an IFN type I-independent mechanism of action. J. Immunol. 2012, 188, 3088–3098. [Google Scholar] [CrossRef] [Green Version]
  11. Santoro, F.; Pettini, E.; Kazmin, D.; Ciabattini, A.; Fiorino, F.; Gilfillan, G.D.; Evenroed, I.M.; Andersen, P.; Pozzi, G.; Medaglini, D. Transcriptomics of the Vaccine Immune Response: Priming with Adjuvant Modulates Recall Innate Responses After Boosting. Front. Immunol. 2018, 9, 1248. [Google Scholar] [CrossRef] [PubMed]
  12. Lindqvist, M.; Nookaew, I.; Brinkenberg, I.; Samuelson, E.; Thörn, K.; Nielsen, J.; Harandi, A.M. Unraveling molecular signatures of immunostimulatory adjuvants in the female genital tract through systems biology. PLoS ONE 2011, 6, e20448. [Google Scholar] [CrossRef] [PubMed] [Green Version]
  13. Morel, S.; Didierlaurent, A.; Bourguignon, P.; Delhaye, S.; Baras, B.; Jacob, V.; Planty, C.; Elouahabi, A.; Harvengt, P.; Carlsen, H.; et al. Adjuvant System AS03 containing α-tocopherol modulates innate immune response and leads to improved adaptive immunity. Vaccine 2011, 29, 2461–2473. [Google Scholar] [CrossRef] [PubMed]
  14. Olafsdottir, T.; Lindqvist, M.; Harandi, A.M. Molecular signatures of vaccine adjuvants. Vaccine 2015, 33, 5302–5307. [Google Scholar] [CrossRef] [PubMed] [Green Version]
  15. Cohen, P. Protein kinases--the major drug targets of the twenty-first century? Nat. Rev. Drug Discov. 2002, 1, 309–315. [Google Scholar] [CrossRef] [PubMed]
  16. Facciuolo, A.; Denomy, C.; Lipsit, S.; Kusalik, A.; Napper, S. From Beef to Bees: High-Throughput Kinome Analysis to Understand Host Responses of Livestock Species to Infectious Diseases and Industry-Associated Stress. Front. Immun. 2020, 11, 765. [Google Scholar] [CrossRef]
  17. Kindrachuk, J.; Arsenault, R.; Kusalik, A.; Kindrachuk, K.; Trost, B.; Napper, S.; Jahrling, P.; Blaney, J. Systems Kinomics Demonstrates Congo Basin Monkeypox Virus Infection Selectively Modulates Host Cell Signaling Responses as Compared to West African Monkeypox Virus. Mol. Cell. Proteomics. 2012, 11, M111.015701. [Google Scholar] [CrossRef] [Green Version]
  18. Arsenault, R.J.; Li, Y.; Bell, K.; Doig, K.; Potter, A.; Griebel, P.J.; Kusalik, A. Mycobacterium avium subsp. paratuberculosis inhibits gamma interferon-induced signaling in bovine monocytes: Insights into the cellular mechanisms of Johne’s disease. Infect. Immun. 2012, 80, 3039–3048. [Google Scholar] [CrossRef] [Green Version]
  19. Arsenault, R.J.; Napper, S.; Kogut, M.H. Salmonella enterica Typhimurium infection causes metabolic changes in chicken muscle involving AMPK, fatty acid and insulin/mTOR signaling. Vet. Res. 2013, 44, 35. [Google Scholar] [CrossRef] [Green Version]
  20. Lipsit, S.W.L.; Wilkinson, J.; Scruten, E.; Facciuolo, A.; Denomy, C.; Griebel, P.J.; Kausalik, A.; Plastow, G.; Napper, S. Kinome profiling of peripheral blood mononuclear cells collected prior to vaccination reveals biomarkers and potential mechanisms of vaccine unresponsiveness in pigs. Sci. Rep. 2020, 10, 11546. [Google Scholar] [CrossRef]
  21. Diks, S.H.; Kok, K.; O’Toole, T.; Hommes, D.W.; van Dijken, P.; Joore, J.; Peppelenbosch, M.P. Kinome profiling for studying lipopolysaccharide signal transduction in human peripheral blood mononuclear cells. J. Biol. Chem. 2004, 279, 49206–49213. [Google Scholar] [CrossRef] [PubMed] [Green Version]
  22. Arsenault, R.; Jalal, S.; Babiuk, L.A.; Potter, A.; Griebel, P.; Napper, S. Kinome analysis of Toll-like receptor signaling in bovine monocytes, J. Recept. Signal Transduct. Res. 2009, 29, 299–311. [Google Scholar] [CrossRef] [PubMed]
  23. Trost, B.; Kindrachuk, J.; Scruten, E.; Griebel, P.J.; Kausalik, A.; Napper, S. Kinotypes: Stable species- and individual-specific profiles of cellular kinase activity. BMC Genom. 2013, 14, 854. [Google Scholar] [CrossRef] [PubMed] [Green Version]
  24. Määttänen, P.; Trost, B.; Scruten, E.; Potter, A.; Kusalik, A.; Griebel, P.J.; Napper, S. Divergent immune responses to Mycobacterium avium subsp. paratuberculosis infection correlate with kinome responses at the site of intestinal infection. Infect. Immun. 2013, 81, 2861–2872. [Google Scholar] [CrossRef] [Green Version]
  25. Robertson, A.; Trost, B.; Scruten, E.; Robertson, T.; Mostajeran, M.; Connor, W.; Kusalik, A.; Griebel, P.; Napper, S. Identification of developmentally-specific kinotypes and mechanisms of Varroa mite resistance through whole-organism, kinome analysis of honeybee. Front. Genet. 2014, 5, 139. [Google Scholar] [CrossRef] [Green Version]
  26. Mutwiri, G.; Gerdts, V.; Lopez, M.; Babiuk, L.A. Innate immunity and new adjuvants. Rev. Sci. Tech. 2007, 1, 147–156. [Google Scholar] [CrossRef]
  27. Eng, N.F.; Garlapati, S.; Gerdts, V.; Babiuk, L.A.; Mutwiri, G.K. PCEP enhances IgA mucosal immune responses in mice following different immunization routes with influenza virus antigens. J. Immune Based Ther. Vaccines 2010, 8, 4. [Google Scholar] [CrossRef] [Green Version]
  28. Andrianov, A.K.; Svirkin, Y.Y.; LeGolvan, M.P. Synthesis and biologically relevant properties of polyphosphazene polyacids. Biomacromolecules 2004, 5, 1999–2006. [Google Scholar] [CrossRef]
  29. Andrianov, A.K.; Marin, A.; Chen, J. Synthesis, properties, and biological activity of poly[di(sodium carboxylatoethylphenoxy)phosphazene]. Biomacromolecules 2006, 7, 394–399. [Google Scholar] [CrossRef]
  30. Payne, L.G.; Jenkins, S.A.; Woods, A.L.; Grund, E.M.; Geribo, W.E.; Loebelenz, J.R.; Andrianov, A.K.; Roberts, B.E. Poly[di(carboxylatophenoxy)phosphazene] (PCPP) is a potent immunoadjuvant for an influenza vaccine. Vaccine 1998, 16, 92–98. [Google Scholar] [CrossRef]
  31. Payne, L.G.; Van Nest, G.; Barchfeld, G.L.; Siber, G.R.; Gupta, R.K.; Jenkins, S.A. PCPP as a parenteral adjuvant for diverse antigens. Dev. Biol. Stand. 1998, 92, 79–87. [Google Scholar] [PubMed]
  32. Chaffey, A.; Hamonic, G.; Chand, D.; Mutwiri, G.K.; Wilson, H.L. The Adjuvants Polyphosphazene (PCEP) and a Combination of Curdlan Plus Leptin Promote a Th17-Type Immune Response to an Intramuscular Vaccine in Mice. Vaccines 2021, 9, 507. [Google Scholar] [CrossRef] [PubMed]
  33. Wu, J.; Taylor, R.K.; Wade, W.F. Anti-class II monoclonal antibody-targeted Vibrio cholerae TcpA pilin: Modulation of serologic response, epitope specificity, and isotype. Infect. Immun. 2001, 69, 7679–7686. [Google Scholar] [CrossRef] [PubMed] [Green Version]
  34. Chand, D.J.; Magiri, R.B.; Wilson, H.L.; Mutwiri, G.K. Polyphosphazenes as Adjuvants for Animal Vaccines and Other Medical Applications. Front. Bioeng. Biotechnol. 2021, 9, 625482. [Google Scholar] [CrossRef]
  35. Andrianov, A.K.; Marin, A.; Roberts, B.E. Polyphosphazene polyelectrolytes: A link between the formation of noncovalent complexes with antigenic proteins and immunostimulating activity. Biomacromolecules 2005, 6, 1375–1379. [Google Scholar] [CrossRef]
  36. Awate, S.; Eng, N.F.; Gerdts, V.; Babiuk, L.A.; Mutwiri, G. Caspase-1 Dependent IL-1β Secretion and Antigen-Specific T-Cell Activation by the Novel Adjuvant, PCEP. Vaccines 2014, 2, 500–514. [Google Scholar] [CrossRef] [Green Version]
  37. Awate, S.; Wilson, H.L.; Singh, B.; Babiuk, L.A.; Mutwiri, G. The adjuvant PCEP induces recruitment of myeloid and lymphoid cells at the injection site and draining lymph node. Vaccine 2014, 32, 2420–2427. [Google Scholar] [CrossRef]
  38. Awate, S.; Wilson, H.L.; Lai, K.; Babiuk, L.A.; Mutwiri, G. Activation of adjuvant core response genes by the novel adjuvant PCEP. Mol. Immunol. 2012, 51, 292–303. [Google Scholar] [CrossRef]
  39. Trost, B.; Kindrachuk, J.; Määttänen, P.; Napper, S.; Kusalik, A. PIIKA 2: An expanded, web-based platform for analysis of kinome microarray data. PLoS ONE 2013, 8, e80837. [Google Scholar] [CrossRef] [Green Version]
  40. Breuer, K.; Foroushani, A.K.; Laird, M.R.; Chen, C.; Sribnaia, A.; Lo, R.; Winsor, G.L.; Hancock, R.E.W.; Brinkman, F.S.L.; Lynn, D.J. InnateDB: Systems biology of innate immunity and beyond-recent updates and continuing curation. Nucleic Acids Res. 2013, 41, D1228–D1233. [Google Scholar] [CrossRef]
  41. Régnier, M.; Gourbeyre, P.; Pinton, P.; Napper, S.; Laffite, J.; Cossalter, A.-M.; Bailly, J.-D.; Lippi, Y.; Bertrand-Michel, J.; Bracarense, P.F.R.L.; et al. Identification of Signaling Pathways Targeted by the Food Contaminant FB1: Transcriptome and Kinome Analysis of Samples from Pig Liver and Intestine. Mol. Nutr. Food Res. 2017, 61, 1700433. [Google Scholar] [CrossRef] [PubMed] [Green Version]
  42. O’Hagan, D.T.; Fox, C.B. Are we entering a new age for human vaccine adjuvants? Expert Rev. Vaccines 2015, 14, 909–911. [Google Scholar] [CrossRef] [PubMed] [Green Version]
  43. O’Hagan, D.; Lodaya, R.; Lofano, G. The continued advance of vaccine adjuvants—“we can work it out”. Semin. Immunol. 2020, 50, 101426. [Google Scholar] [CrossRef] [PubMed]
  44. Pulendran, B.; Arunachalam, P.S.; O’Hagan, D.T. Emerging concepts in the science of vaccine adjuvants. Nat. Rev. Drug Discov. 2021, 20, 454–475. [Google Scholar] [CrossRef]
  45. Katz, O.; Gil, L.; Lifshitz, L.; Prutchi-Sagiv, S.; Gassmann, M.; Mittelman, M.; Neumann, D. Erythropoietin enhances immune responses in mice. Eur. J. Immunol. 2007, 37, 1584–1593. [Google Scholar] [CrossRef]
  46. Hassan, K.; Shternberg, L.; Alhaj, M.; Giron, R.; Reshef, R.; Barak, M.; Kristal, B. The effect of erythropoietin therapy and hemoglobin levels on the immune response to Engerix-B vaccination in chronic kidney disease. Ren. Fail. 2003, 25, 471–478. [Google Scholar] [CrossRef]
  47. Oster, H.S.; Prutchi-Sagiv, S.; Halutz, O.; Shabtai, E.; Hoffman, M.; Neumann, D.; Mittelman, M. Erythropoietin treatment is associated with an augmented immune response to the influenza vaccine in hematologic patients. Exp. Hematol. 2013, 41, 167–171. [Google Scholar] [CrossRef]
Figure 1. Kinome Responses to PCEP and Alum at Site of Injection and Lymph Node. (A) Clustering of Kinome Responses at Site of Injection and in Draining Lymph Nodes. Hierarchical clustering of kinome datasets. (1−Pearson correlation) was used as the distance metric, while McQuitty linkage was used as the linkage method. Colors indicate the average (over nine intra-array replicates) normalized phosphorylation intensity of each target, with red indicating greater amounts of phosphorylation and green indicating lesser amounts of phosphorylation. (B) Venn Diagram of Differentially Phosphorylated Peptides in Lymph Nodes to PCEP and Alum. Comparison of peptides consistently and significantly (p < 0.05) phosphorylated in lymph in response to either PCEP or Alum relative to PBS control. (C) Venn Diagram of Differentially Phosphorylated Peptides in Lymph Nodes and Muscle to PCEP. Comparison of peptides consistently and significantly (p < 0.05) phosphorylated in lymph and muscle in response to PCEP relative to PBS control.
Vaccines 10 00927 g001
Figure 2. Patterns of Gene Expression at Site of PCEP Injection. Cytokine and chemokine gene expression profiles elicited by PCEP at the site of injection after intramuscular injection in mice. Mice were injected with PBS or PCEP intramuscularly. Muscle tissue at the site of injection were collected at 24 h and analyzed for cytokine and chemokine genes by quantitative real-time PCR. (A) Increased expression of cytokine genes including IFNγ, TNFα and TLRs at the injection site. (B) Substantial increase in proinflammatory gene, IL-6. (C) Increased expression of chemokine receptor family genes at the injection site. Results shown are the mean ± SE of six replicates at each time point. Relative fold changes (y-axis) for each gene were normalized to mouse GAPDH. Fold changes are calculated by the Ct method and are relative to the gene expression in PBS injected muscle tissue. (reprinted with modifications from Awate et al. 2012, Copyright 2012, with permission from Elsevier).
Vaccines 10 00927 g002
Figure 3. Patterns of Cell Recruitment to the Site of Injection in Response to Adjuvants. PCEP stimulates increased immune cell numbers at the site of injection. BALB/c mice (n = 5 per group) were injected i.m. with either PBS, PCEP (50 ug) or alum (0.5 mg). The site of injection muscle tissue was dissected at 24 h time point and processed. Single cell suspensions were analyzed by flow cytometry. (A) Kinetics of myeloid cells (neutrophils, macrophages, monocytes and dendritic cells) 24 h post-injection of adjuvants at the site of injection. (B) Kinetics of lymphoid cells (CD4+, CD8+ and B cells) 24 h post-injection of adjuvants at the site of injection. Differences in the cell numbers were analyzed by two-way ANOVA and the significant differences between the treatments were compared by Bonferroni multiple-comparison test where **** p < 0.0001, *** p < 0.001, ** p < 0.005, * p < 0.05. (reprinted with modifications from Awate et al. 2014, Copyright 2014, with permission from Elsevier).
Vaccines 10 00927 g003
Figure 4. Patterns of Cell Recruitment to the Draining Lymph Nodes in Response to Adjuvants. PCEP stimulates increased immune cell numbers in the draining lymph nodes. BALB/c mice (n = 5 per group) were injected i.m. with either PBS, PCEP (50 ug) or alum (0.5 mg). The draining inguinal lymph nodes were collected at 24 h post-injection and the cell suspensions were analyzed by flow cytometry. (A) Kinetics of myeloid cells (neutrophils, macrophages, monocytes and dendritic cells) 24 h post-injection of adjuvants at the draining lymph nodes. (B) Kinetics of lymphoid cells (CD4+, CD8+ and B cells) 24 h post-injection of adjuvants at the draining lymph nodes. Differences in the cell numbers were analyzed by two-way ANOVA and the significant differences between the treatments were compared by Bonferroni multiple-comparison test where **** p < 0.0001. (reprinted with modifications from Awate et al. 2014, Copyright 2014, with permission from Elsevier).
Vaccines 10 00927 g004
Table 1. Primer Sequences.
S. NoGene SymbolForward PrimerReverse Primer
1IL-2CCTGGAGCAGCTGTTGATGGCAGAACATGCCGCAGAGGTC
2IL-4ATGGGTCTCAACCCCCAGCGCTCTTTAGGCTTTCCAGG
3IL-6TGTCTATACCACTTCACAAGTCGCACAACTCTTTTCTCATTTCCA
4IL-10TAGTTCCCAGAAGCCATGTGAGAGGGAGCAGTTTGTAAGC
5IL-12TGCCAGCCTGCCTTATATTGTCCACCAGGACCACTAAATG
6IL-13CAGCAGCTTGAGCACATTTC CATAGGCAGCAAACCATGTC
7IL-17ACCTCAACCGTTCCACGTCACAGGGTCTTCATTGCGGTG
8IFN-γTGAACGCTACACACTGCAT CGACTCCTTTTCCGCTTCCT
9TNF-αGACCCTCACACTCAGATCATCT CCACTTGGTGGTTTGCTACGA
10NFκBAGAAGACACGAGGCTACAAC TCACAGACGCTGTCACTATC
11TLR-4TCCCAGTGATGGCTGATTAG GCACCCAACATTGTGTTACC
12TLR-9GAAGGGACAGCAATGGAAAG GCCAAGTGCTACCATTAACC
13CCL-2TCACCTGCTGCTACTCATTCTCTGGACCCATTCCTTCTTG
14CCL-4CCAGCTGTGGTATTCCTGAC GAGCTGCTCAGTTCAACTCC
15CCL-5CTCCCTGCTGCTTTGCCTACCACACTTGGCGGTTCCTTCG
16CCL-12TGCCTCCTGCTCATAGCTACGGCTGCTTGTGATTCTCCTG
17CXCL-10GTCACATCAGCTGCTACTCCCGCACCTCCACATAGCTTAC
Table 2. Differentially Phosphorylated Peptides in Muscle is Response to PCEP.
Increased PhosphorylationDecreased Phosphorylation
IDP SiteAccessionFCpIDP SiteAccessionFCp
Shc1Y439P293531.590.02LynY396P07948−1.50.05
PLCG2Y759P168851.490.05IRF-3S402Q14653−1.370.04
Smad3S423P840221.470.03IKK-gS43Q9Y6K9−1.350.01
SykY352P434051.440.01IKK-bY188O14920−1.30.03
SykY525P434051.430.01MDM2S166Q00987−1.30.004
Ck2-BS228Q5SRQ61.350.04ACTA1Y55P68133−1.290.02
Cdk4S150P118021.340.02MAVSS233Q7Z434−1.280.04
p300S2279Q094721.340.05Keap1S293Q14145−1.280.02
EP300S2366Q094721.330.0001MK2Y132P16389−1.270.05
CTNNB1Y654P352221.310.005IKK-aS180O15111−1.260.0002
TAK1T178O433181.30.02p38-aY322Q16539−1.250.04
SEK1T261P459851.30.04IRAK1T100P51617−1.250.02
TAK1T187O433181.290.04IL7RY449P16871−1.250.004
Grb10S150Q133221.280.01PDK1S241O15530−1.240.001
K8S74P057871.270.02FosS362P01100−1.230.05
Sek1S80P459851.270.03MEK1Y385Q02750−1.230.03
EGFRT693P005331.260.007CREBS133P16220−1.230.02
SOC3Y221O145431.260.02JunS63P05412−1.220.05
TBK1S172Q9UHD21.250.02HSP70Y525P08107−1.220.04
Smad6S435O435411.240.02MetY1003P08581−1.220.01
Cdc42Y32P609531.240.03ACC1S29Q13085−1.220.004
XIAPS87P981701.230.02Akt1T308P31749−1.210.05
IRAK4T208P516171.210.01JNK2T183P45984−1.20.03
SMAD3S204Q157961.210.03PDK1Y373O15530−1.20.01
STMN1S24P169491.210.05Casp3S150P42574−1.190.05
CDK2Y14P249411.20.006Mapk14T122Q16539−1.190.03
TrKAY496P046291.20.02AuraT287O14965−1.180.04
P27kip1Y74P465271.20.03JNK1T183P45983−1.180.02
CrkY221P461081.190.02BimS69O43521−1.170.02
IRAK1T387P516171.180.01p70S6KS447P23443−1.160.005
TNIKT181Q9UKE51.180.02Mnk1T255Q9BUB5−1.150.05
Tyk2Y1054P295971.180.03CHOPS79P35638−1.150.05
EGFRY869P005331.180.05Mek1S217Q02750−1.150.02
TrKAY757P046291.170.008CDK2T160P24941−1.150.02
gp130Y767P401891.170.02MSK2S360O75676−1.140.02
CREBS117P162201.170.02NFkB p65S536Q04206−1.140.01
SHC3Y341Q925291.170.03CREBS111P16220−1.130.05
PI3K p85Y605O004591.170.05FynY420P06241−1.130.02
Smad3T179P840221.170.05MetY1234P08581−1.110.02
IFNAR1Y466P171811.150.03
STAT6Y641P422261.140.03
HSP60S70P108091.140.03
GIT2Y592Q141611.130.01
STMN1S37P169491.120.03
IFNGR1S495P152601.110.02
SOC3Y204O145431.090.003
CTNNB1S33P352221.070.02
Table 3. Pathway Over-Representation Analysis PCEP Site of Injection.
Pathway NamePathway IDSource NamePathway Uploaded Pathway p-Value
JAK STAT pathway and regulation16125INOH275.04 × 1023
RANKL15925NETPATH191.20 × 1022
Fc epsilon receptor signaling17802REACTOME232.07 × 1022
Innate Immune System17476REACTOME333.51 × 1022
IL-7 signaling16106INOH233.54 × 1022
Pathways in cancer4397KEGG271.98 × 1021
EPO signaling pathway16151INOH228.75 × 1021
VEGF signaling pathway16190INOH221.01 × 1020
Immune System18444REACTOME402.63 × 1020
BCR signaling pathway15384PID NCI163.06 × 1020
IL215918NETPATH174.59 × 1020
Toll-like receptor signaling pathway564KEGG188.14 × 1020
Table 4. Differentially Phosphorylated Peptides in Node in Response to PCEP.
Increased PhosphorylationDecreased Phosphorylation
IDP SiteAccessionFCpIDP SiteAccessionFCp
p47phoxS370P145981.710.003PKACaS10P17612−1.740.03
NFAT3S676Q149341.690.009P300S89Q09472−1.610.007
P27kip1T157P465271.640.004PKACaS338P17612−1.540.04
SHC3Y341Q925291.620.004IKK-betaY188O14920−1.540.03
K8S74P057871.580.02LynY396P07948−1.530.01
STAT1S708P422241.570.006p70S6KS447P23443−1.50.02
Mek2S226P365071.570.04MyD88Y257Q99836−1.490.04
IKK-alphaS473O151111.550.02Jak2Y813O60674−1.480.02
Rack1Y194P632441.520.0004PKACaT197P17612−1.460.005
CHOPS79P356381.510.02p67phoxS208P19878−1.460.0008
STAT1S727P422241.490.02MSK2S360O75676−1.430.01
MK2Y415P163891.480.01IKK-aS180O15111−1.420.02
Rab5AS123P203391.470.01LynY507P07948−1.420.02
DVL1S679O146401.460.0002PPARGS112P37231−1.410.04
PI3K p85 bY464O004591.460.05Jak2Y119O60674−1.410.04
ACC1S80Q130851.450.02Mnk1T250Q9BUB5−1.410.03
Smad6S435O435411.410.02p67phoxT233P19878−1.410.01
EP300S2366Q094721.40.007MAPK14T179Q16539−1.410.007
4E-BP1T46Q135411.390.04PPP2CAT304P67775−1.40.05
Flt3Y842P368881.370.05Pyk2S213Q14289−1.380.01
Rab5AY205P203391.360.01Mnk1T255Q9BUB5−1.370.008
IRAK4T208P516171.340.01NFAT1S326Q13469−1.360.01
CrkY221P461081.340.04STMN1S15P16949−1.340.02
IFNGR1S495P152601.330.006NFAT1S110Q13469−1.320.01
Grb10S150Q133221.330.02IL4RY713P24394−1.320.01
Cdc42Y64P609531.320.02MEK1T385Q02750−1.310.04
MetY1003P085811.320.02STAT5BS731P51692−1.30.01
TGFBR1T204P368971.310.03IKK-gS43Q9Y6K9−1.290.03
Sek1S80P459851.30.02SMAD3S416Q15796−1.280.01
CTNNB1Y654P352221.30.05Tgfbr2S409P37173−1.270.005
CalmodulinY99P621581.270.03Keap1S293Q14145−1.260.03
Cdc2T161P064931.270.05STAT4S722Q14765−1.250.05
BRAF1S579P150561.260.02JunS63P05412−1.250.04
IKK-alphaT23O151111.250.02PIK3R1Y528P27986−1.20.05
Cdk4S150P118021.250.02PDGFRbY686P09619−1.20.004
NFkB-p65S276Q042061.240.01PDK1Y376O15530−1.190.05
Rab4Y189P203381.240.03Pyk2S399Q14289−1.190.05
Rack1Y52P632441.210.03PDGFRbY740P09619−1.170.004
TBK1S172Q9UHD21.20.02Jak1Y220P23458−1.160.04
TrKAY680P046291.190.04PDK1S241O15530−1.150.02
Grb2Y37P629931.180.02MAPK14T122Q16539−1.140.04
caveolin-1Y6Q031351.180.03TAB1S423Q15750−1.120.05
Shc1Y349P293531.180.03ACC1S1263Q13085_−1.110.04
TRAF6Y353Q9Y4K31.180.03Rab4S199P20338−1.060.03
EGFRT693P005331.160.03
PI3Kp85 BY605O004591.160.04
PAK4S474O960131.160.04
p38 deltaY182O152641.150.01
IRAK4T235P516171.150.03
gp130Y676P401891.150.04
KitY568P107211.150.05
MEK1S297Q027501.140.03
4E-BP1S64Q135411.10.004
Mlk3T277Q165841.10.03
PTENY315P604841.10.04
TAK1T187O433181.030.04
Table 5. Differentially Phosphorylated Peptides in Node in Response to Alum.
Increased PhosphorylationDecreased Phosphorylation
IDP SiteAccessionFCpIDP SiteAccessionFCp
ACC1S29Q130851.070.0007SHC3Y341Q92529−1.190.04
NFkB-p65S536Q04206−1.170.02
NFAT3S676Q14934−1.160.02
IKK-alphaS180O15111−1.150.02
TAK1S192O43318−1.10.04
P27kip1T1576P46527−1.080.01
Table 6. Pathway Overrepresentation Analysis PCEP in Draining Lymph Node.
Pathway NamePathway IDSource NameGene Countp-Value (Corrected)
EPO signaling pathway16151INOH321.12 × 1033
IL-7 signaling16106INOH311.45 × 1032
JAK STAT pathway 16125INOH351.60 × 1032
VEGF signaling pathway16190INOH293.32 × 1029
Pathways in cancer4397KEGG333.74 × 1027
Signaling by Interleukins18744REACTOME231.14 × 1025
TGF_beta_Receptor15911NETPATH274.49 × 1024
IL215918NETPATH209.23 × 1024
BCR15916NETPATH241.41 × 1023
IL615922NETPATH202.16 × 1023
Signaling by NGF16818REACTOME283.77 × 1023
MAPK signaling pathway487KEGG271.87 × 1022
Osteoclast differentiation10367KEGG222.19 × 1022
Publisher’s Note: MDPI stays neutral with regard to jurisdictional claims in published maps and institutional affiliations.

