Abstract
The influenza virus continually evolves because of the high mutation rate, resulting in dramatic changes in its pathogenicity and other biological properties. This study aimed to evaluate the evolution of certain essential properties, understand the connections between them, and find the molecular basis for the manifestation of these properties. To that end, 21 A(H1N1)pdm09 influenza viruses were tested for their pathogenicity and toxicity in a mouse model with a ts/non-ts phenotype manifestation and HA thermal stability. The results demonstrated that, for a strain to have high pathogenicity, it must express a toxic effect, have a non-ts phenotype, and have a thermally stable HA. The ancestor A/California/07/2009 (H1N1)pdm influenza virus expressed the non-ts phenotype, after which the cycling trend of the ts/non-ts phenotype was observed in new strains of A(H1N1)pdm09 influenza viruses, indicating that the ratio of the ts phenotype will increase in the coming years. Of the 21 tested viruses, A/South Africa/3626/2013 had the high pathogenicity in the mouse model. Sequence alignment analysis showed that this virus has three unique mutations in the polymerase complex, two of which are in the PB2 gene and one that is in the PB1 gene. Further study of these mutations might explain the distinguishing pathogenicity.
1. Introduction
The influenza virus is a worldwide disease that affects up to 5–15% of the global population. The mortality from influenza-associated respiratory disease is estimated to be more than half a million each year, and that number significantly increases when a new strain emerges to cause a pandemic [1]. The first known influenza pandemic was the Spanish flu (1918–1920, death toll ~17.4 million) [2], the second was the Asian flu (1957–1958, death toll 1–4 million), the third was the Hong Kong flu (1968–1969, death toll 1–4 million), [3] and after that came the Russian flu (1977–1979, over 700,000 deaths) [4]. The last pandemic was influenza A(H1N1) in 2009–2010, which is estimated to have caused about 400,000 deaths in 2009 alone [5]. To date, it is impossible to know when influenza pandemics are going to arise, which makes evolutionary studies of the influenza virus highly important. Influenza is an RNA virus that is part of the Orthomyxoviruses family, which is divided into four subfamilies: A, B, C, and D. Influenza A is also divided into several subtypes depending on the combination of the hemagglutinin protein (HA), which has 18 subtypes, and the neuraminidase protein (NA), which has 11 subtypes [6]. This study will focus on the evolution of the H1N1pdm09 pandemic of the virus.
There are three essential properties that an influenza virus strain must have to cause a pandemic: firstly, the strain must not be previously recognized by human immunity; secondly, the strain should have high pathogenicity for the human, and finally, the virus strain should be transmissible and able to cause infection on person-to-person interaction [7]. In 2009, a new A(H1N1)pdm09 influenza virus strain appeared that had all of the three previously mentioned properties. The new pandemic influenza virus had numerous biological features typical of pandemic viruses; in particular, it had pronounced non-ts and non-ca phenotypes and resistance to sera non-specific inhibitors [8].
The influenza virus has a high mutation rate, which is the basis for the evolutionary variability of the influenza virus [9]. One cycle of virus replication may lead to a new strain with significant changes in its viral biocharacteristics and pathogenicity. A comparative analysis of essential biological properties of evolving H1 viruses has not yet been carried out. Of these characteristics, the HA thermal stability, toxicity, and non-ts phenotype warrant the most attention. A Non-ts phenotype is the virus’ ability to reproduce at elevated temperatures of the low respiratory tract [10,11,12,13]. For human influenza A viruses, this ability might be inherited from their ancestor that replicated in animal hosts (birds or pigs) that have higher physiological body temperatures (40–42 °C) [14]. Some of the influenza viruses are characterized as lethal in animal models two to four days after inoculation with a high dose of the viral particles [15,16,17]; this characteristic is referred to as viral toxicity. HA stability is the ability of the hemagglutinin protein to resist denaturation and maintain its function in stress conditions such as elevated temperature [18]. The evolution of and changes in these characteristics result from mutations acquired in the viral genome.
The influenza A virus contains eight negative-sense, single-stranded viral RNA gene segments, which encode the 10 essential viral proteins (HA, NA, M2, M1, NP, NS1, NS2, PB1, PB2, and PA). A mutation in any of these proteins might change the viral characteristic and thus affect its pathogenicity. The heterotrimeric polymerase complex, consisting of three subunits—PB1 (polymerase basic protein 1), PB2 (polymerase basic protein 2), and PA (polymerase acidic protein)—has gained the most interest [19]. Each of these subunits contributes to polymerase function: the PA snitches the Cap of cellular mRNA through its endonuclease domain [20], while the PB2’s functions are mRNA recognition and binding of “cap” structures and the PB1 participates in transcriptase primer elongation and endonuclease activity [21]. In addition, the polymerase complex has a significant effect on the manifestation of the ts/non-ts phenotype. Several studies showed that mutations in the complex can dramatically affect and change the properties of the virus [22,23,24,25].
In this study, we focused on the evolution of these characteristics and the contribution of each of these to the viral pathogenicity; furthermore, we attempted to explain the relationships between the viral properties and determine how they are connected to the evolution of the viral genome.
2. Materials and Methods
Viruses. The following 21 A(H1N1)pdm09 influenza viruses that circulated in 2009–2020 and four control A(H1N1) influenza viruses, which are currently considered antigenically obsolete, were used in this work, as indicated in Table 1.

Table 1.
A list of influenza A(H1N1)pdm09 viruses used in this study.
The viruses were inoculated in the chorioallantoic cavity of 10–11-day-old chicken eggs purchased from the Sinyavino poultry farm (Kirovsk Area, Leningrad region, Russia). After 48 h of incubation at 32 °C, the viruses were harvested and stored at −70 °C. Following biosafety instructions, the influenza viruses were handled in a biosafety level-2 (BSL-2) laboratory.
Temperature sensitivity (non-ts phenotype). The phenotype of virus reproduction was evaluated in developing chicken eggs (10–11 days old) by comparing the virus infectivity at 32 °C and 40 °C, as described in [8]. The log10 EID50/mL calculation was based on the Reed and Muench method [27]. In this study, data are presented as the relative % titer. Optimal growth was measured at 32 °C (nominal value of 100%) for each virus. Titers for the temperature of 40 °C were calculated as a percentage relative to the 100% maximal value. The reduction of viral infectivity at 40 °C compared to 32 °C was calculated according to the following formula:
where M40 and M32 are infection titers of the virus expressed in log10 EID50/mL at the 40 °C and 32 °C temperatures of incubation, respectively. The titers of the viruses were calculated based on [27].
Relative % titer = (M40/M32) × 100
Non-ts-phenotype viruses have a relative % titer above 60%, while ts-phenotype viruses have a relative % titer under 40%. The range from 40% to 60% is an intermediate phase where viruses do not have a clear phenotype.
Thermal stability of HA. To measure the thermal stability of HA, infectious allantoic fluid was diluted 1:5 by phosphate-buffered saline (PBS), as described in [18,28]. The viruses were incubated in a Thermo block for inactivation for 20 min at temperatures ranging from 37 to 70 °C. Subsequently, a hemagglutination assay using 1% chicken RBCs was performed. In parallel, control samples were incubated at RT for 20 min. HA was considered to have low stability when it lost activity below 58 °C, above which HA has been considered highly stable as it keeps its activity.
Mice. The study population (880 female CBA mice, aged 8–12 weeks, body mass 18–22 g) was purchased from the laboratory breeding nursery Rappolovo (Leningrad region, Russia). The animals were kept at room temperature (23–25 °C) in cages with wood shavings, the humidity was maintained at 60%, the day-night cycle was 12 h each, and the animals had free access to food and water.
Toxicity study in mice (development of acute pulmonary edema). Study groups of 10 mice each were lightly anesthetized with ether, after which a high dose of fresh, non-diluted virus was administered into the nasal fossae. The mice were observed daily during the first six days post-infection to detect mortality from acute pulmonary edema, as previously described in [29]. To consider the virus capable of causing high toxicity, the mortality should be over 50%. However, if the virus causes mortality of 50% or less, it is considered low-level toxic, and if it does not cause mortality, then it is a non-toxic virus.
Pathogenicity study in mice. For each tested virus, 10-fold serial dilutions were prepared using PBS. Study groups of 10 mice each were lightly anesthetized with ether, then inoculated with 50 μL of PBS, divided equally into the nasal fossae. Mice mortality from pneumonia was observed for the first 14 days post-infection and the LD50 for each virus was calculated by the routine Reed and Muench method [27] and expressed as the log EID50/mL required to give 1 LD50. Viruses with an LD50 < 1.5 were considered non-pathogenic, whereas viruses with an LD50 ≥ 4 were considered to have high pathogenicity, and viruses in the interval between 1.5 and 4 were considered capable of causing low pathogenicity. The parameters based on which the toxicological or pathogenic capabilities of the tested viruses were evaluated are given in Table 2.

Table 2.
Assessment of the level of manifestation of signs of toxicity and pathogenicity in mice.
In addition, for the A/South Africa/3626/2013 virus, on day 3 post-infection, viral RNA was extracted from mice lung tissue to be sequenced.
The mice and chicken embryos were handled according to the guidelines of the Declaration of Helsinki, European Union legislation, and the Russian Manual for Laboratory Animals [30,31,32]. At the end of the study, the animals were humanely euthanized. The fertilized eggs used for virus propagation were discarded appropriately, according to the Russian Sanitary and Epidemiological Requirements for the Prevention of Infectious Diseases SP 3.3686-21 (approved 28 January 2021) [33].
Genetic analysis and phylogenetic trees. The multiple alignment method (MUSCLE algorithm) was used to perform the genetic analysis, and the PHYLIP neighbor-joining method was used to build the phylogenetic trees. Both methods were carried out using the Unipro UGENE v1.12.1 program (https://doi.org/10.1093/bioinformatics/bts091, accessed on 2 December 2021), and all protein sequences were obtained from the GISAID platform.
Full genome sequencing was performed using an ABI Prism 3031xl Genetic Analyzer (Applied Biosystems, Applera Corporation|Foster City, CA 94404, USA) with a BigDye™ Terminator v3.1 Cycle Sequencing Kit (Applied Biosystems, Life Technologies Corporation|Carlsbad, CA 92008, USA ), according to the manufacturer’s instructions.
Pyrosequencing detection of a single nucleotide polymorphism was carried out using a PyroMark Q24 (QIAGEN, MD, USA) genetic analysis system according to the manufacturer’s instructions. The oligonucleotide ACGGGCAATCTCCAAACA was used for the pyrosequencing reaction.
Statistics were analyzed using GraphPad Prism 7. A p-value < 0.05 was considered statistically significant.
3. Results
3.1. Toxicity for Mice
The ancestor of all A(H1N1)pdm09 viruses—the A/California/7/2009 strain—was non-toxic and non-pathogenic for mice. Of the 21 viruses, 11 (52.4%) were highly toxic, where the toxicity results of these viruses were as follows: virus 2, A/Bolivia/559/2013 was 100%; virus 5, A/South Africa/3626/2013 was 80%; virus 6, A/Florida/62/2014 was 80%; virus 7, A/Laos/1187/2014 was 100%; virus 8, A/New York/61/2015 was 60%; virus 10, A/Bangladesh/3002/2015 was 100%; virus 11, A/Newcastle/67/2017 was 80%; virus 12, A/South Australia/272/2017 was 90%; virus 17, A/lowa/12/2019 was 100%; virus 19, A/Guangdong-Maonan/SWL1536/2019 was 90%; and virus 20, A/Arkansas/08/2020 was 80%. Besides this, 10 (47.6%) were non-toxic or slightly toxic (Table 3).

Table 3.
The main characteristics of 21 A(H1N1)pdm09 influenza viruses tested in vivo.
3.2. Pathogenicity for Mice
Of the 21 viruses, only one (4.8%) turned out to be highly pathogenic for mice (A/South Africa/3626/2013). Five of the remaining viruses (23.8%) were slightly pathogenic (virus 2, A/Bolivia/559/2013; virus 4, A/New Hampshire/04/2013; virus 6, A/Florida/62/2014; virus 7, A/Laos/1187/2014; virus 10, A/Bangladesh/3002/2015). Fifteen (71.4%) were non-pathogenic (virus 1, A/California/07/2009; virus 3, A/Mississippi/10/2013; virus 8, A/New York/61/2015; virus 9, A/Slovenia/2903/2015; virus 11, A/Newcastle/67/2017; virus 12, A/South Australia/272/2017; virus 13, A/New Jersey/13/2018; virus 14, A/Darwin/123/2018; virus 15, A/Brisbane/02/2018; virus 16, A/lowa/59/2018; virus 17, A/lowa/12/2019; virus 18, A/Victoria/2570/2019; virus 19, A/Guangdong-Maonan/SWL1536/2019; virus 20, A/Arkansas/08/2020; virus 21, A/Indiana/02/2020; Table 3).
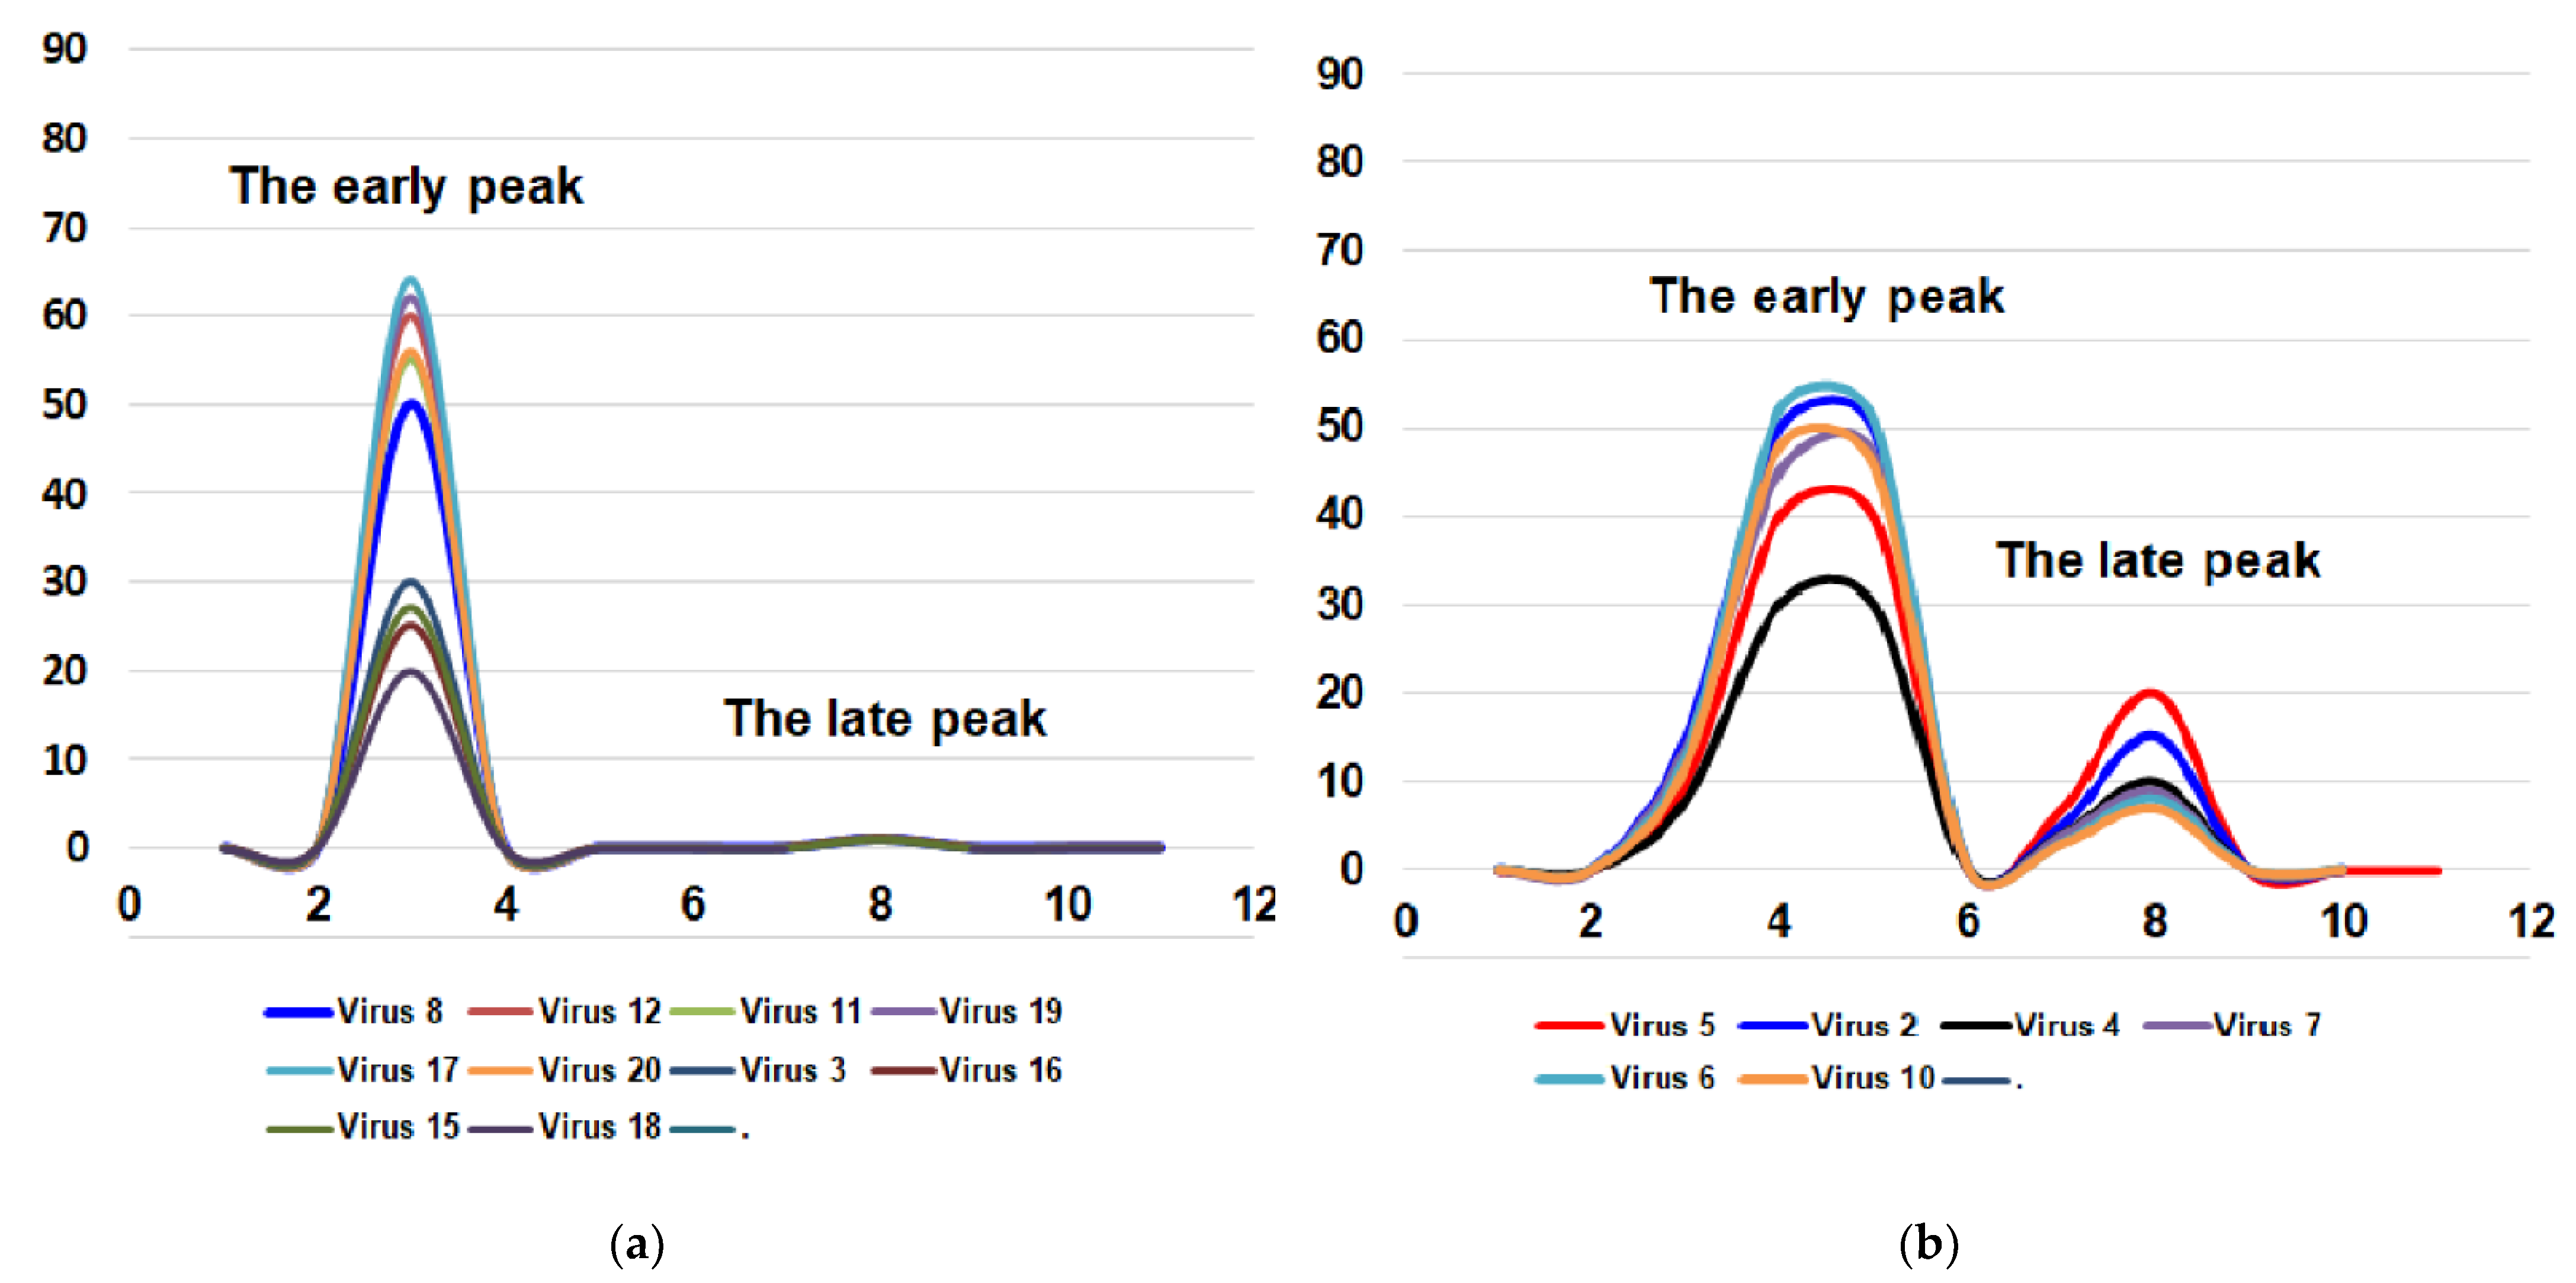
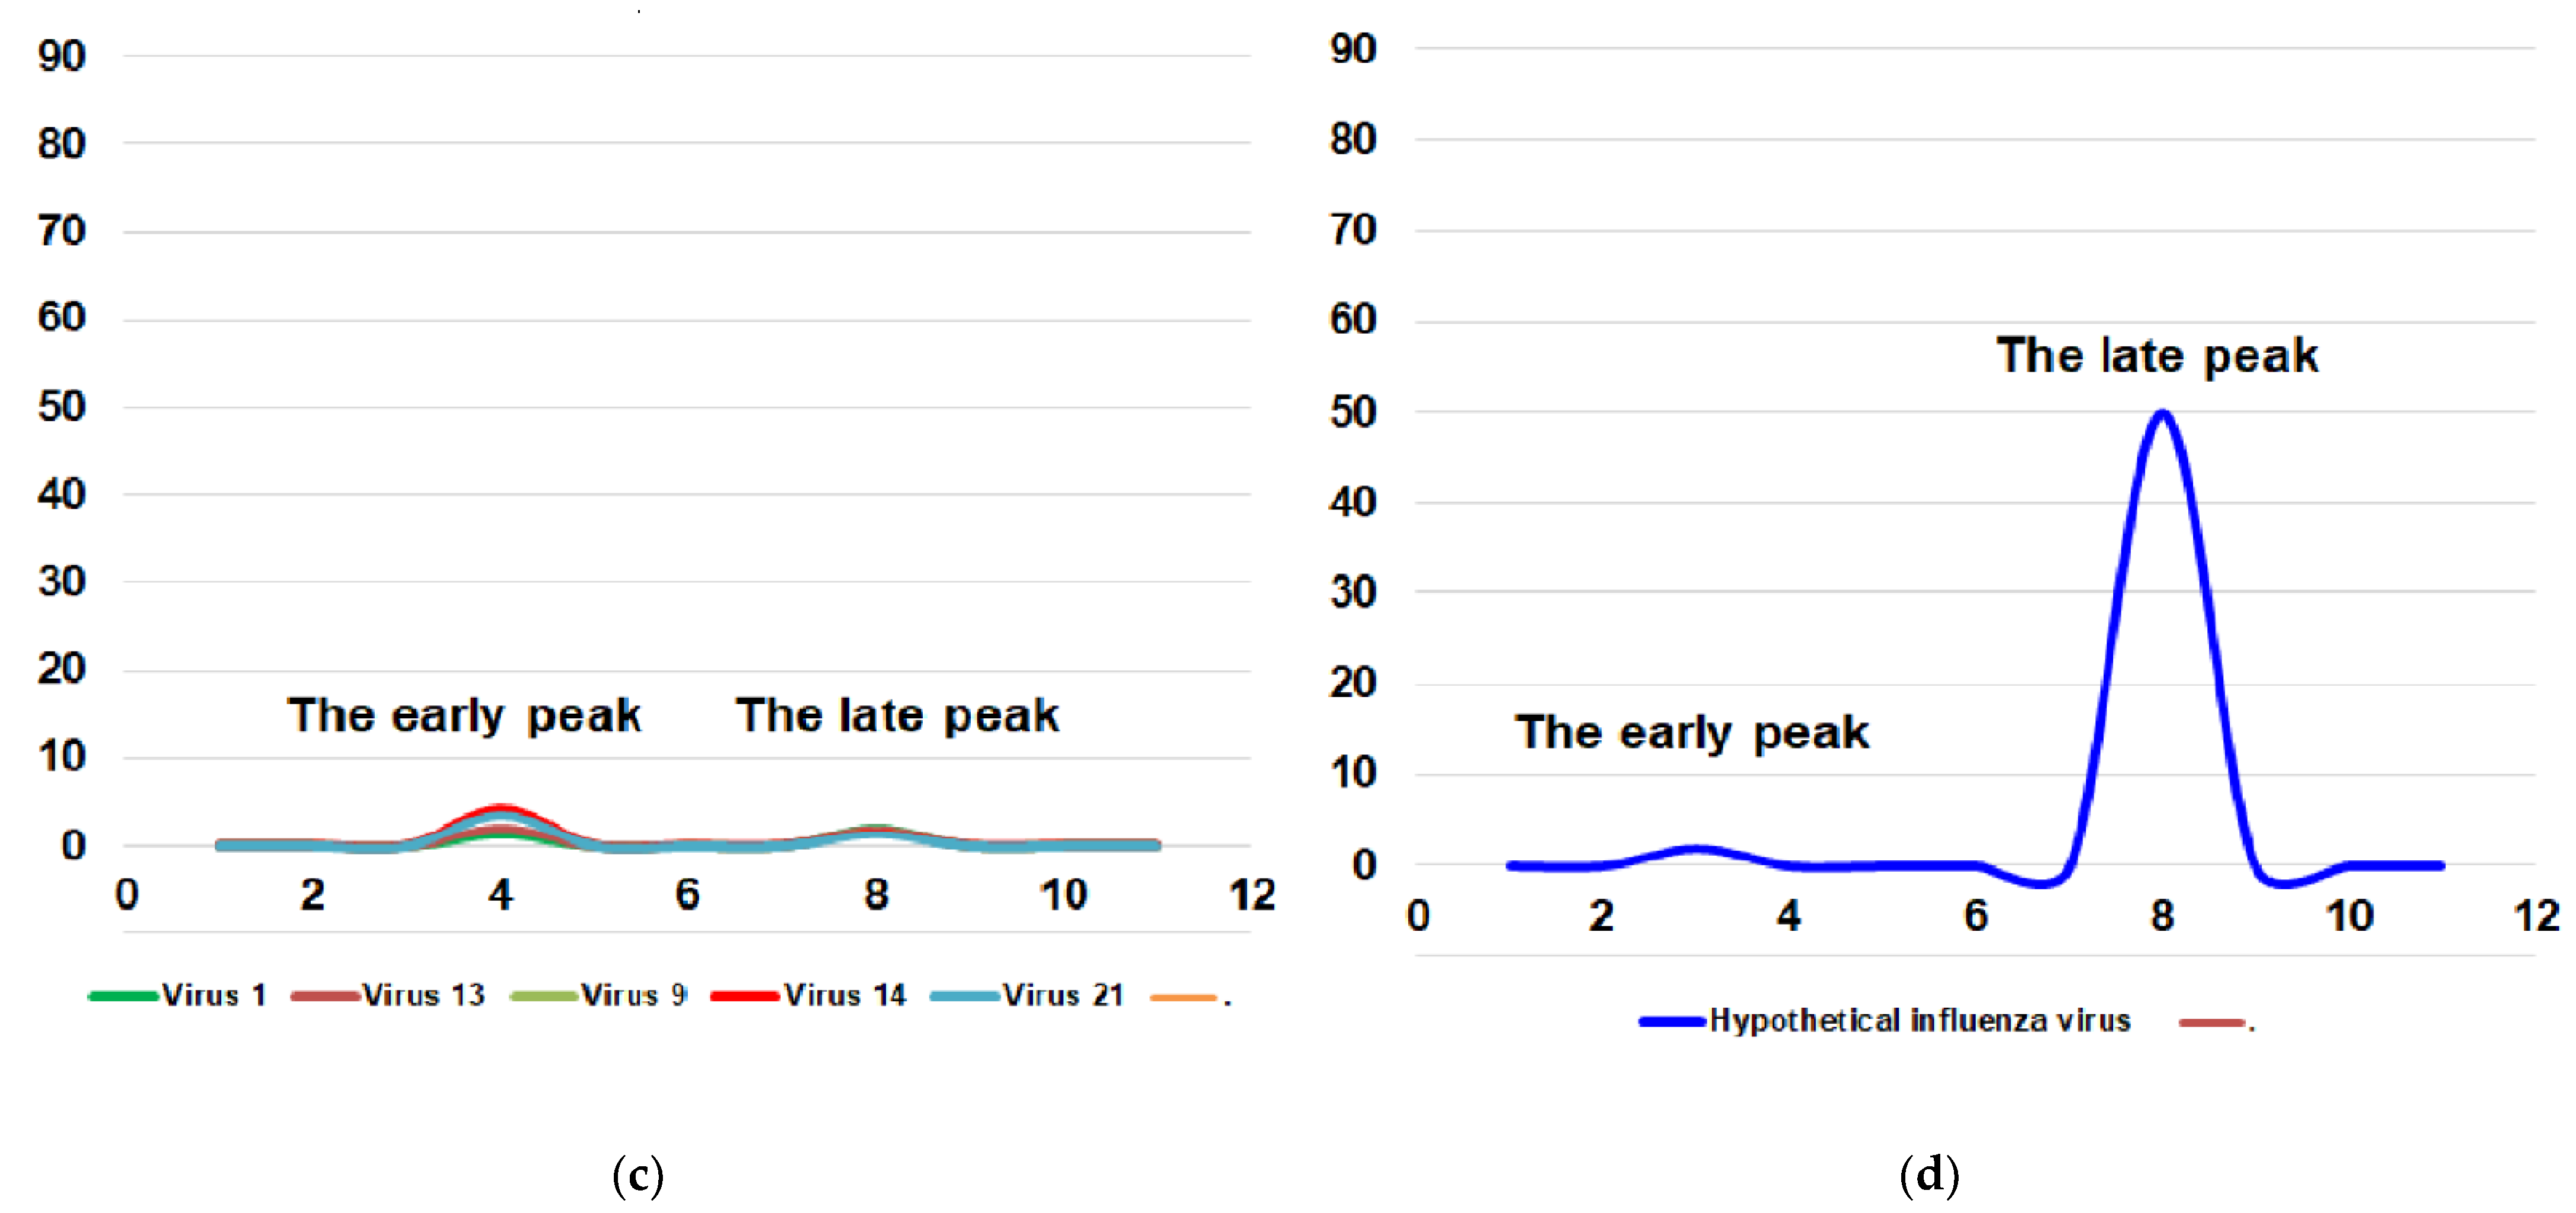
For these two important biological features of the influenza virus (toxicity and pathogenicity for mice), it is possible to imagine four combinations: (i) the virus is toxic but non-pathogenic for mice (the most common variant); (ii) the virus is toxic and pathogenic for mice; (iii) the virus is non-toxic and non-pathogenic for mice; (iv) the virus is non-toxic or very slightly toxic and pathogenic for mice (Figure 1).
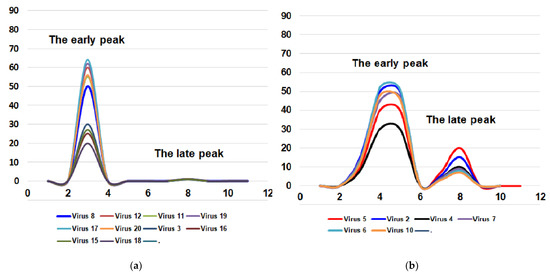
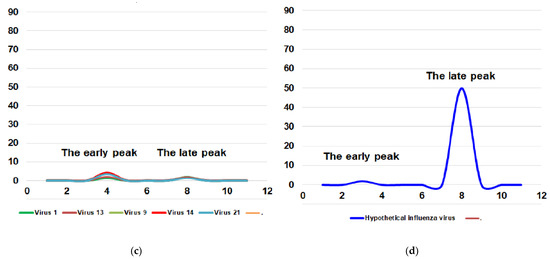
Figure 1.
Four possible combinations of toxicity and pathogenicity of influenza virus for mice. Virus 1—A/California/07/2009; virus 2—A/Bolivia/559/2013; virus 3—A/Mississippi/10/2013; virus 4—A/New Hampshire/04/2013; virus 5—A/South Africa/3626/2013; virus 6—A/Florida/62/2014; virus 7—A/Laos/1187/2014; virus 8—A/New York/61/2015; virus 9—A/Slovenia/2903/2015; virus 10—A/Bangladesh/3002/2015; virus 11—A/Newcastle/67/2017; virus 12—A/South Australia/272/2017; virus 13—A/New Jersey/13/2018; virus 14—A/Darwin/123/2018; virus 15—A/Brisbane/02/2018; virus 16—A/lowa/59/2018; virus 17—A/lowa/12/2019; virus 18—A/Victoria/2570/2019; virus 19—A/Guangdong-Maonan/SWL1536/2019; virus 20—A/Arkansas/08/2020; virus 21—A/Indiana/02/2020. X-axis—days post-infection. Y-axis—lethality, %. (a) the virus is toxic but not pathogenic for mice; (b) the virus is toxic and pathogenic for mice; (c) the virus is non-toxic and non-pathogenic for mice; (d) the virus is non-toxic but pathogenic for mice. The fourth variant is possible only theoretically. So far, we have not encountered strains with a similar combination of features. As for the other three variants, all the viruses studied were distributed as follows. Group (iii) includes five viruses: A/California/7/2009, A/Slovenia/2903/2015, A/New Jersey/13/2018, A/Darwin/123/2018, and A/Indiana/02/20. Group (ii) included six viruses: A/South Africa/3626/2013, A/Bolivia/559/2013, A/New Hampshire/04/2013, A/Laos/1187/2014, A/Florida/62/2014 and A/Bangladesh/3002/2015 and the first group (i) which has most of the viruses (consisted of ten viruses): A/Mississippi/10/2013, A/New York/61/2015, A/South Australia/272/2017, A/Newcastle/67/2017, A/Iowa/59/2018, A/Brisbane/02/2018, A/Victoria/2570/2019, A/Guangdong-Maonan/SWL1536/2019, A/Iowa/12/2019 and A/Arkansas/08/2020.
3.3. Temperature Sensitivity of Reproduction of A(H1N1)pdm09 Influenza Viruses (ts Phenotype)
The viral titer at the optimum temperature of 32 °C varied from 6.9 log10 EID50/mL (A/lowa/12/2019) to 9.2 log10 EID50/mL (A/South Africa/3626/2013). To normalize this disparity, the optimal titer value was given the nominal value of 100%. For each virus, the titer at 40 °C was then calculated as a percentage relative to this nominal value, as described in the Materials and Methods Section.
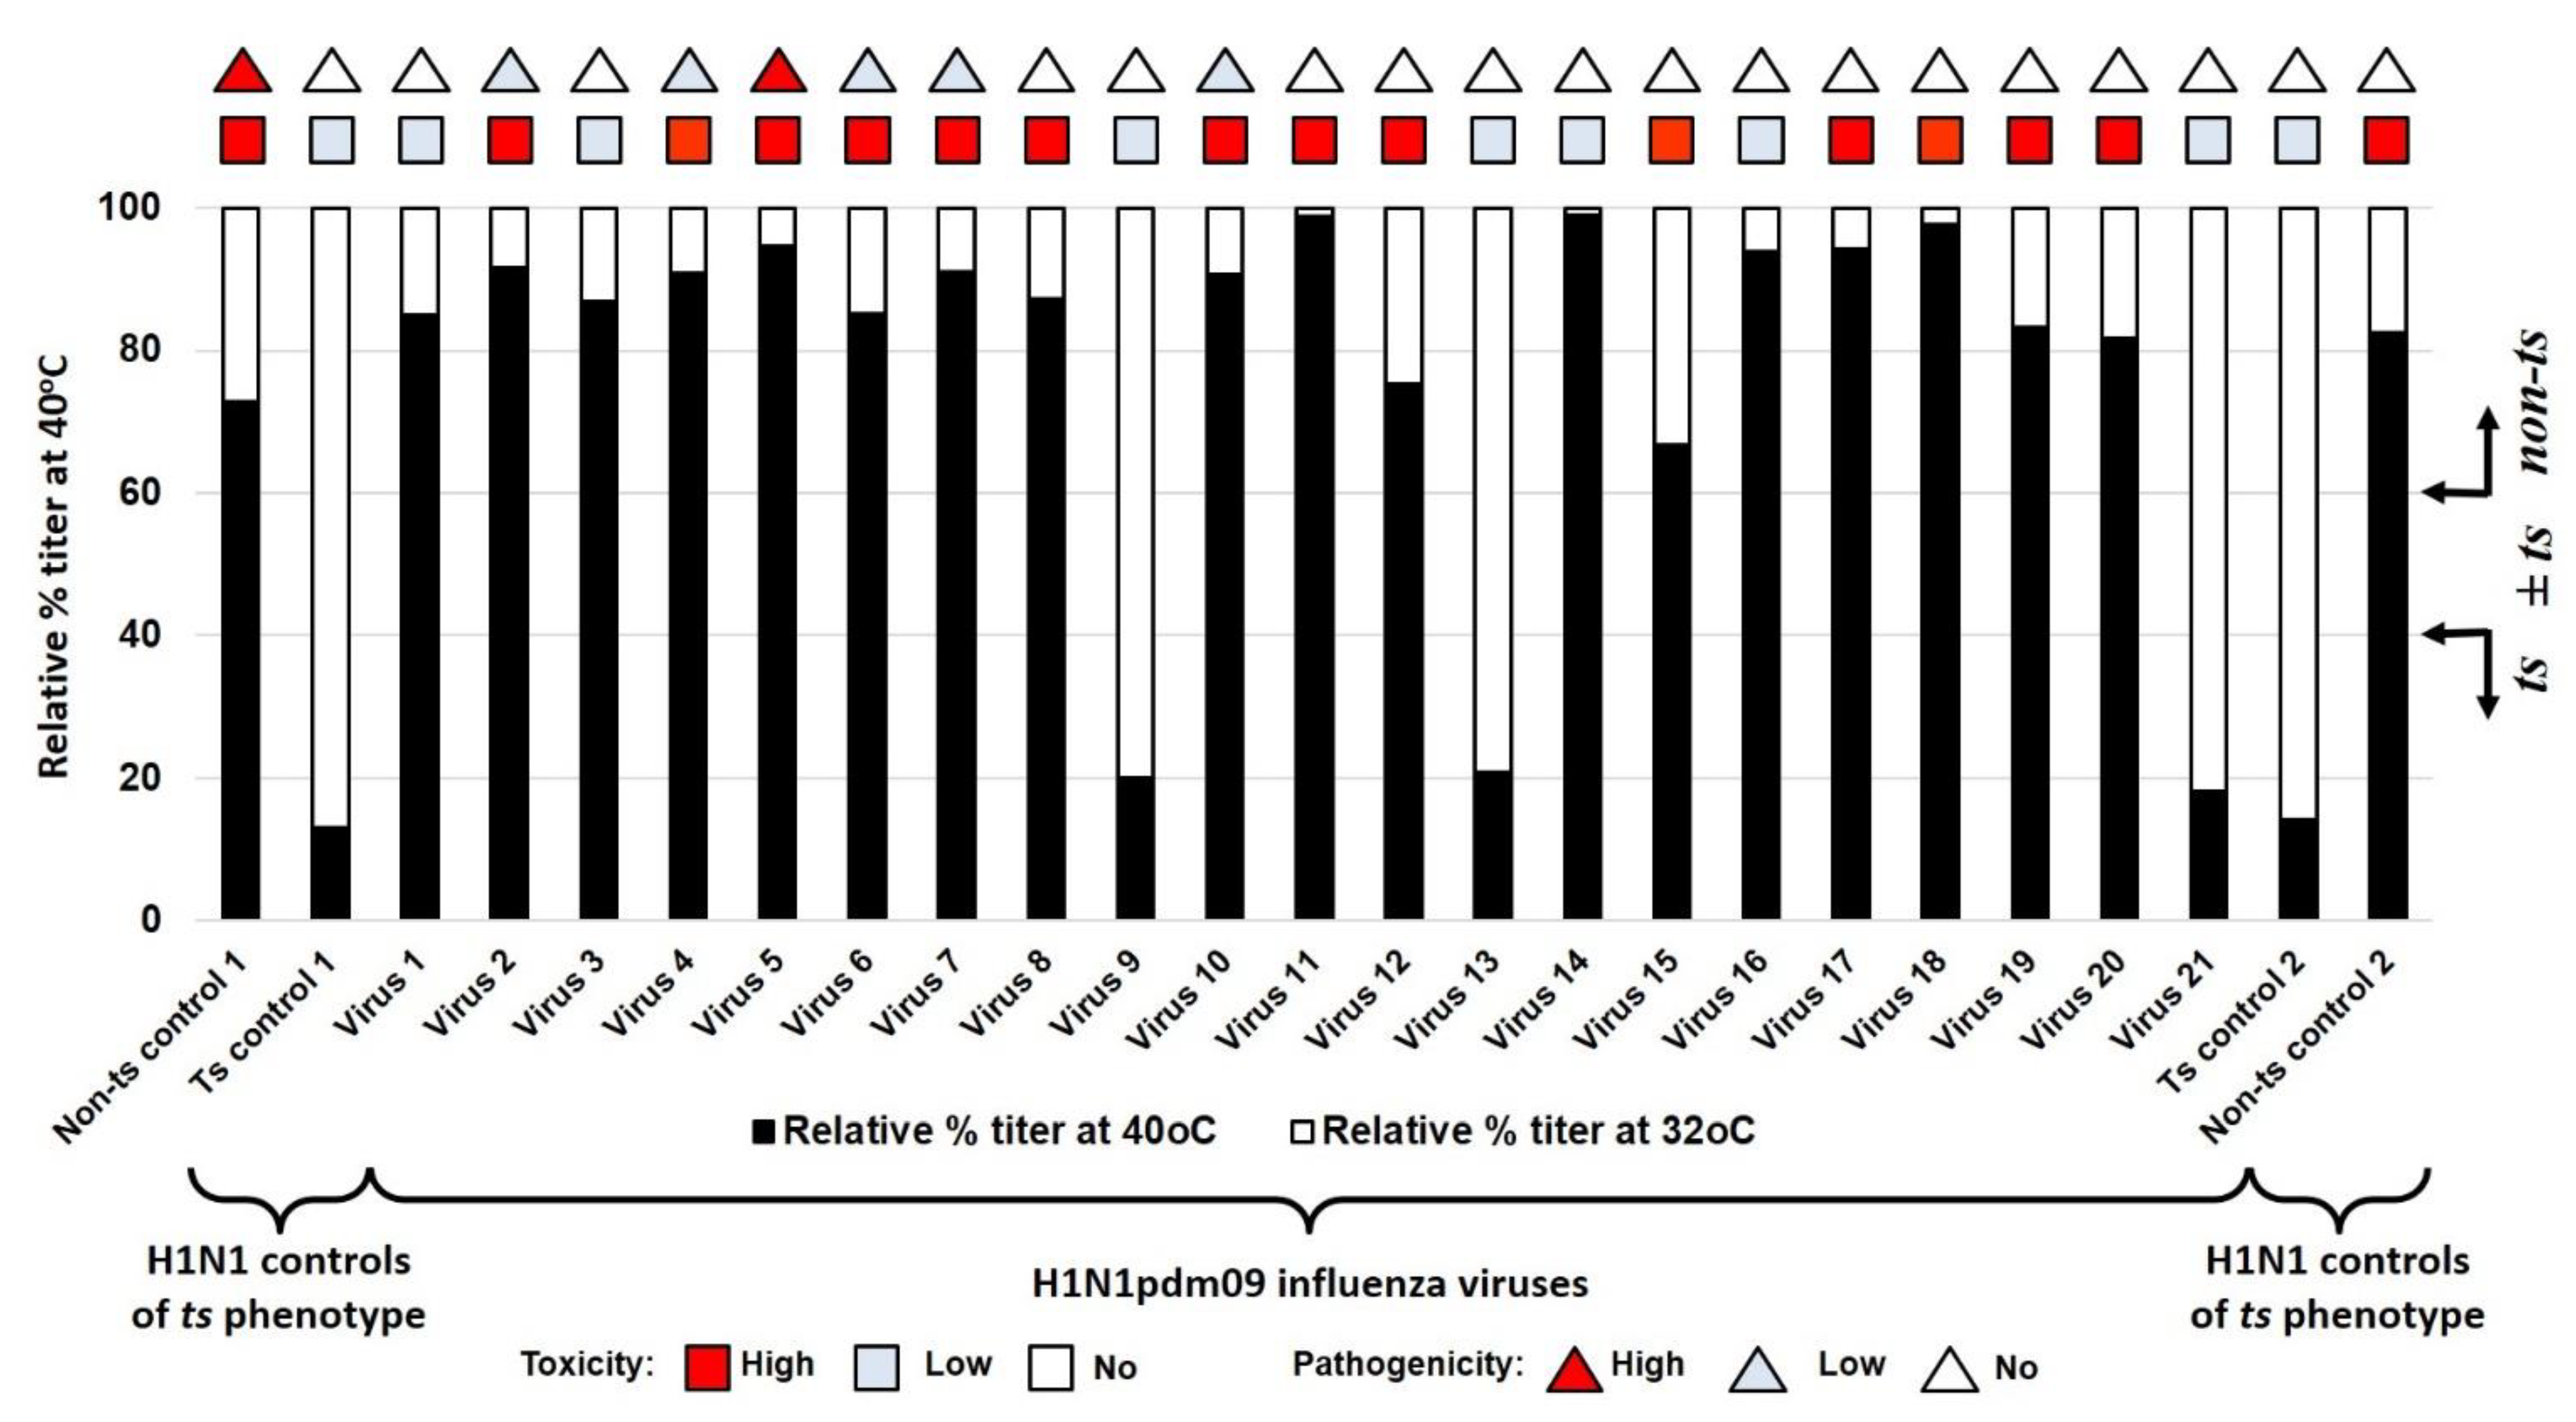
Of the 21 studied viruses, none fell in the intermediate phase and they all had a clear phenotype; only three viruses had a ts phenotype (9, A/Slovenia/2903/2015; 13, A/New Jersey/13/2018; 21, A/Indiana/02/2020), whereas the rest of them had a non-ts phenotype. The studied virus kept a non–ts phenotype from 2009 until 2015 when the first ts strain (9, A/Slovenia/2903/2015) appeared, and after that, the phenotype fluctuated between ts and non-ts. The ts phenotype appeared in two other strains (13, A/New Jersey/13/2018; 21, A/Indiana/02/2020) in 2018 and 2020, respectively (Figure 2).
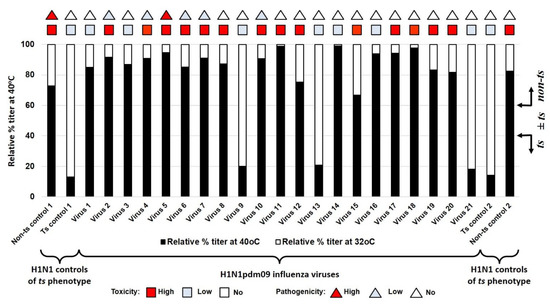
Figure 2.
Sensitivity of reproduction of A(H1N1)pdm09 influenza viruses to the elevated temperature of 40 °C. Black bars—relative percentage titer at 40 °C compare to infectivity at 32 °C. triangles—pathogenicity for mice. Square—toxicity for mice. Non–ts control 1—A/PR/8/1934; ts control 1—A/Florida/3/2006; virus 1—A/California/07/2009; virus 2—A/Bolivia/559/2013; virus 3—A/Mississippi/10/2013; virus 4—A/New Hampshire/04/2013; virus 5—A/South Africa/3626/2013; virus 6—A/Florida/62/2014; virus 7—A/Laos/1187/2014; virus 8—A/New York/61/2015; virus 9—A/Slovenia/2903/2015; virus 10—A/Bangladesh/3002/2015; virus 11—A/Newcastle/67/2017; virus 12—A/South Australia/272/2017; virus 13—A/New Jersey/13/2018; virus 14—A/Darwin/123/2018; virus 15—A/Brisbane/02/2018; virus 16—A/lowa/59/2018; virus 17—A/lowa/12/2019; virus 18—A/Victoria/2570/2019; virus 19—A/Guangdong-Maonan/SWL1536/2019; virus 20—A/Arkansas/08/2020; virus 21—A/Indiana/02/2020; ts control 2—A/Solomon Islands/3/2006; non–ts control 2—A/New Caledonia/20/1999. The red square indicates a strain of high toxicity. The red triangle indicates strain of high pathogenicity. The pale blue square indicates a strain of low or no toxicity. The pale blue triangle indicates strain of low or no pathogenicity.
3.4. Thermal Stability of the Hemagglutinin of A(H1N1)pdm09 Viruses
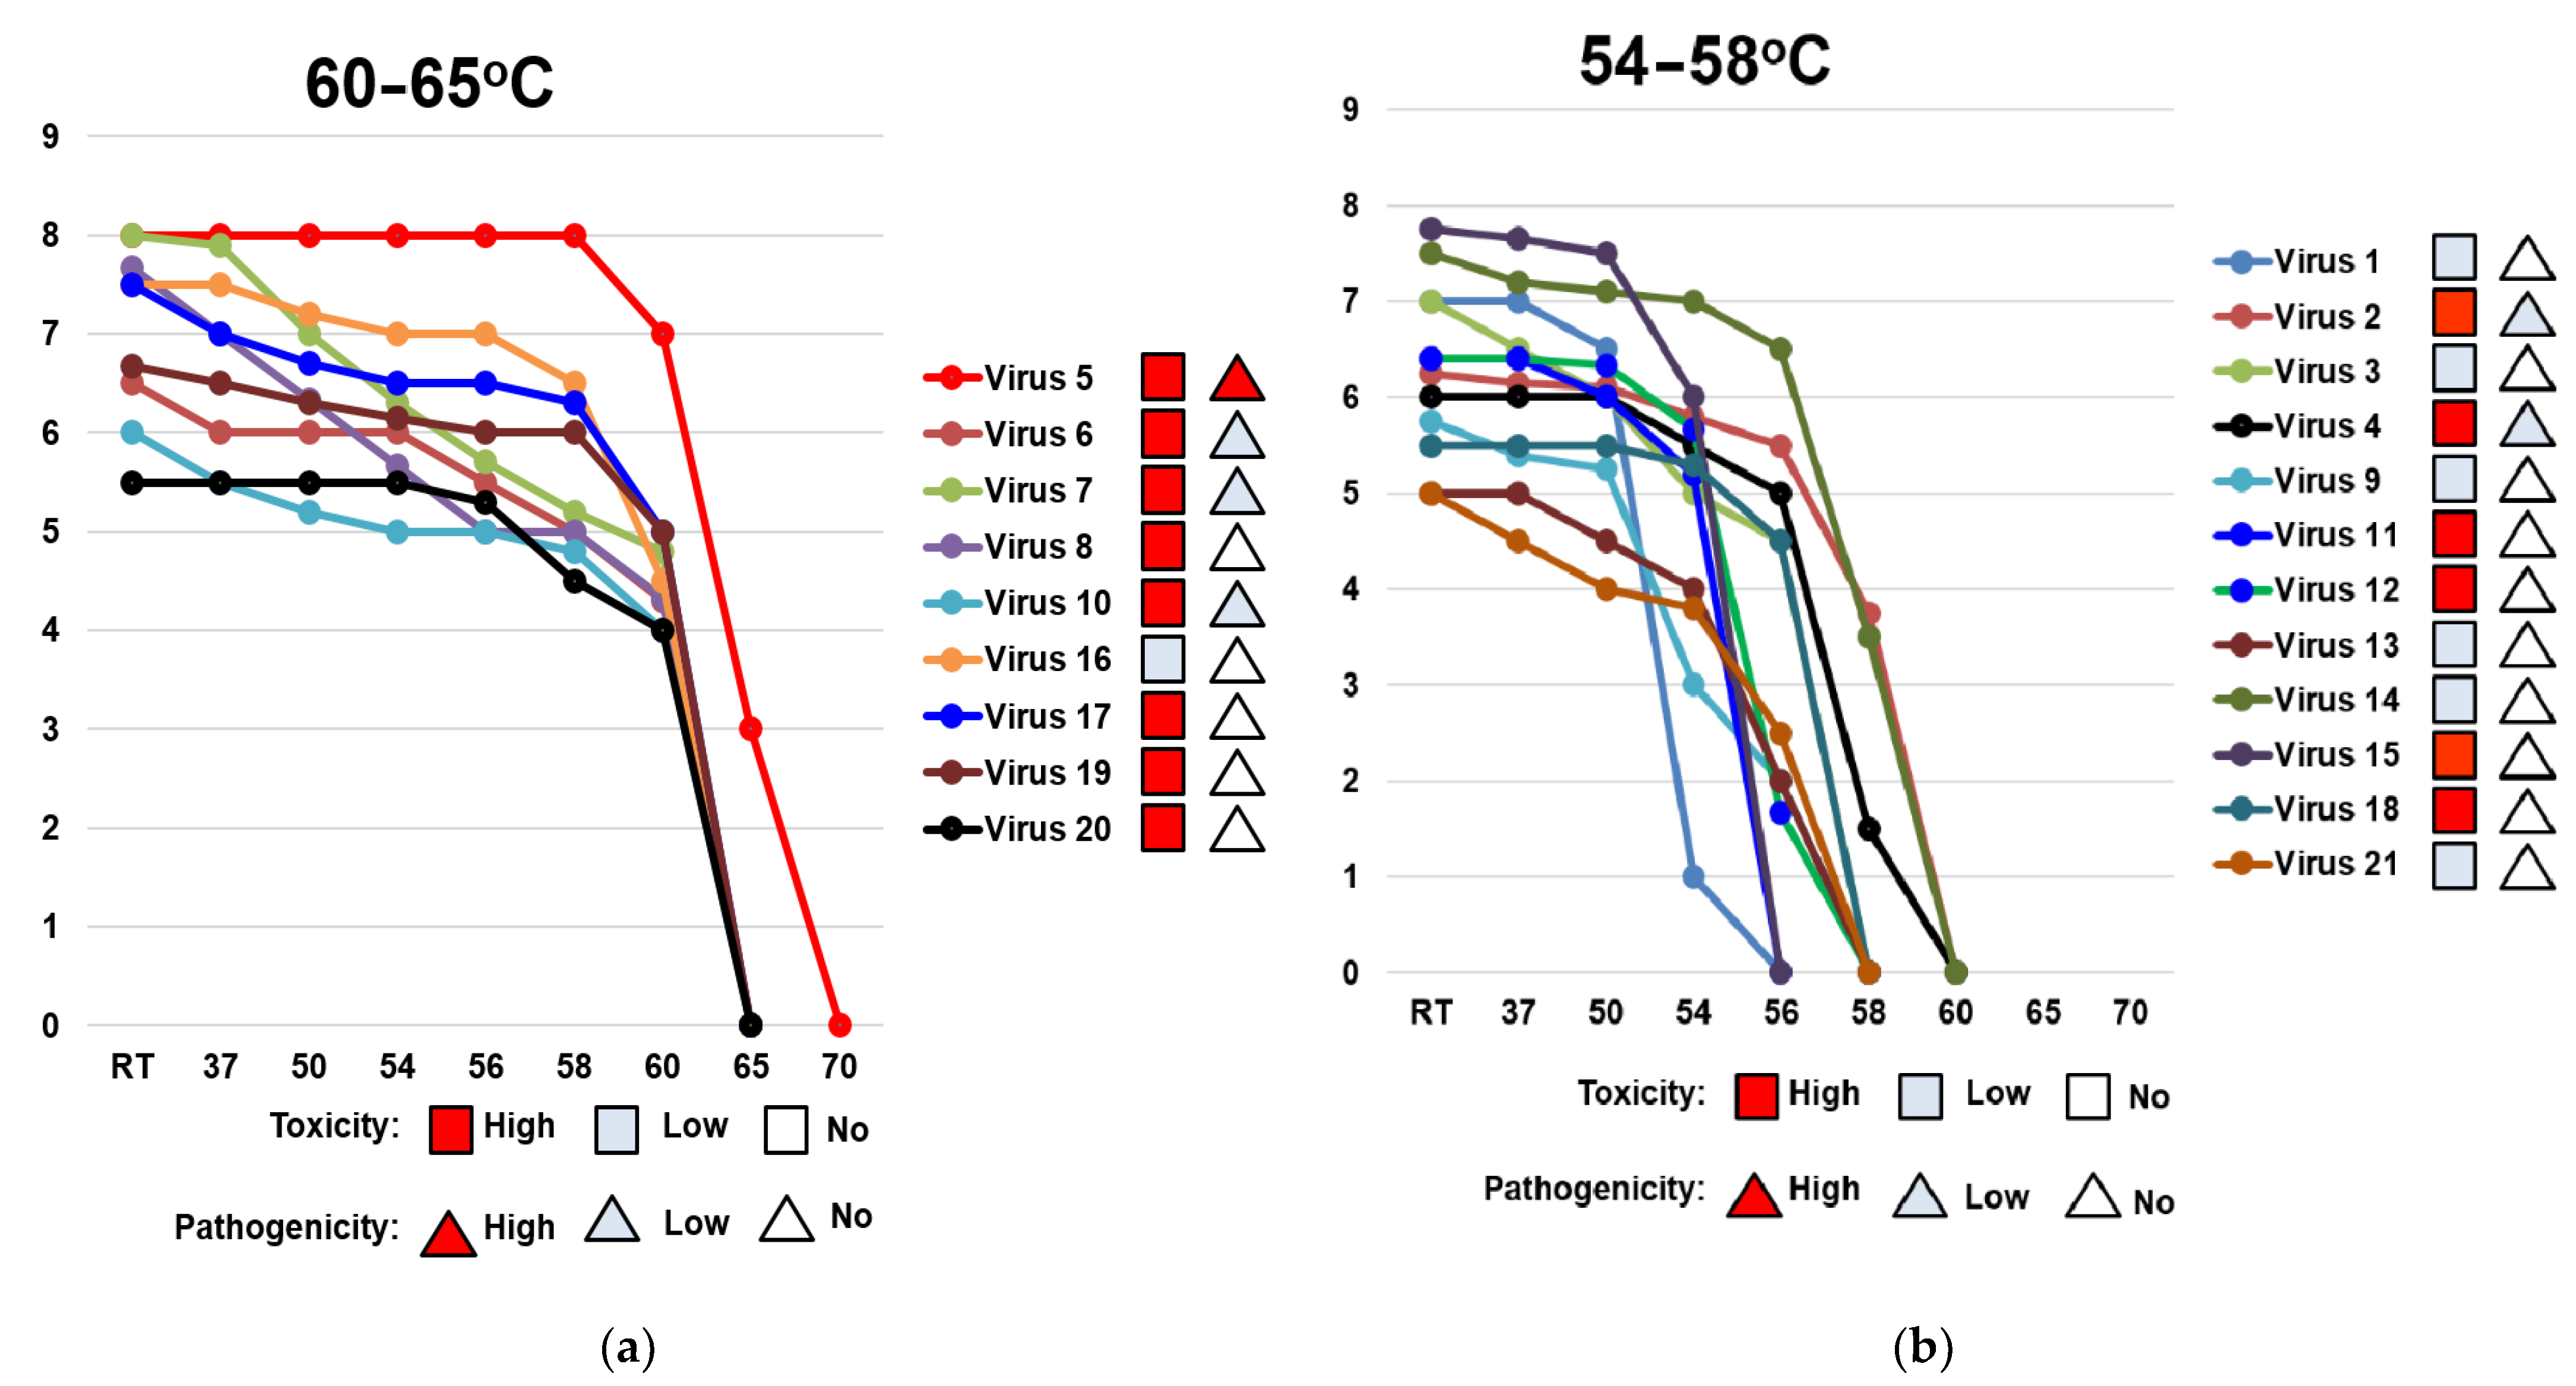
In this study, nine of the studied viruses (virus 5, A/South Africa/3626/2013; virus 6, A/Florida/62/2014; virus 7, A/Laos/1187/2014; virus 8, A/New York/61/2015; virus 10, A/Bangladesh/3002/2015; virus 16, A/lowa/59/2018; virus 17, A/lowa/12/2019; virus 19, A/Guangdong-Maonan/SWL1536/2019; virus 20, A/Arkansas/08/2020) had a highly stable HA, while 12 of them (virus 1, A/California/07/2009; virus 2, A/Bolivia/559/2013; virus 3, A/Mississippi/10/2013; virus 4, A/New Hampshire/04/2013; virus 9, A/Slovenia/2903/2015; virus 11, A/Newcastle/67/2017; virus 12, A/South Australia/272/2017; virus 13, A/New Jersey/13/2018; virus 14, A/Darwin/123/2018; virus 15, A/Brisbane/02/2018; virus 18, A/Victoria/2570/2019; virus 21, A/Indiana/02/2020) had low thermal stability of HA (Table 4). The HA of the A/South Africa/3626/2013 virus recorded the highest activity temperature threshold, losing its activity at 65 °C (Table 4).

Table 4.
The lowest temperature destroying the hemagglutinin activity.
The dynamics of how losses of HA activity are affected by increasing the temperature from the room temperature (25 °C) up to 70 °C are shown in Figure 3. The studied viruses were separated into two groups depending on their HA activity temperature threshold. The first group had high HA stability (HA activity temperature threshold 60–65 °C; Figure 3a) and the second group had low HA stability (HA activity temperature threshold 54–58 °C; (Figure 3b).
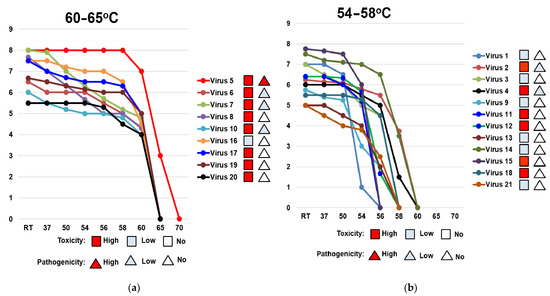
Figure 3.
Comparison of the dynamic of losses of thermal stability of the hemagglutinin of A(H1N1)pdm09 viruses circulating in 2009–2020. HA activity temperature threshold is (a) 60–65 °C (high thermal stability); (b) 54–58 °C (low thermal stability). RT—room temperature. X-axis—temperature (°C). Y-axis—log2 HA titer. Virus 1—A/California/07/2009; virus 2—A/Bolivia/559/2013; virus 3—A/Mississippi/10/2013; virus 4—A/New Hampshire/04/2013; virus 5—A/South Africa/3626/2013; virus 6—A/Florida/62/2014; virus 7—A/Laos/1187/2014; virus 8—A/New York/61/2015; virus 9—A/Slovenia/2903/2015; virus 10—A/Bangladesh/3002/2015; virus 11—A/Newcastle/67/2017; virus 12—A/South Australia/272/2017; virus 13—A/New Jersey/13/2018; virus 14—A/Darwin/123/2018; virus 15—A/Brisbane/02/2018; virus 16—A/lowa/59/2018; virus 17—A/lowa/12/2019; virus 18—A/Victoria/2570/2019; virus 19—A/Guangdong-Maonan/SWL1536/2019; virus 20—A/Arkansas/08/2020; virus 21—A/Indiana/02/2020. The red square indicates a strain of high toxicity. The red triangle indicates strain of high pathogenicity. The pale blue square indicates a strain of low or no toxicity. The pale blue triangle indicates strain of low or no pathogenicity.
3.5. Phylogenetic Trees of A(H1N1)pdm09 Influenza Viruses Genes
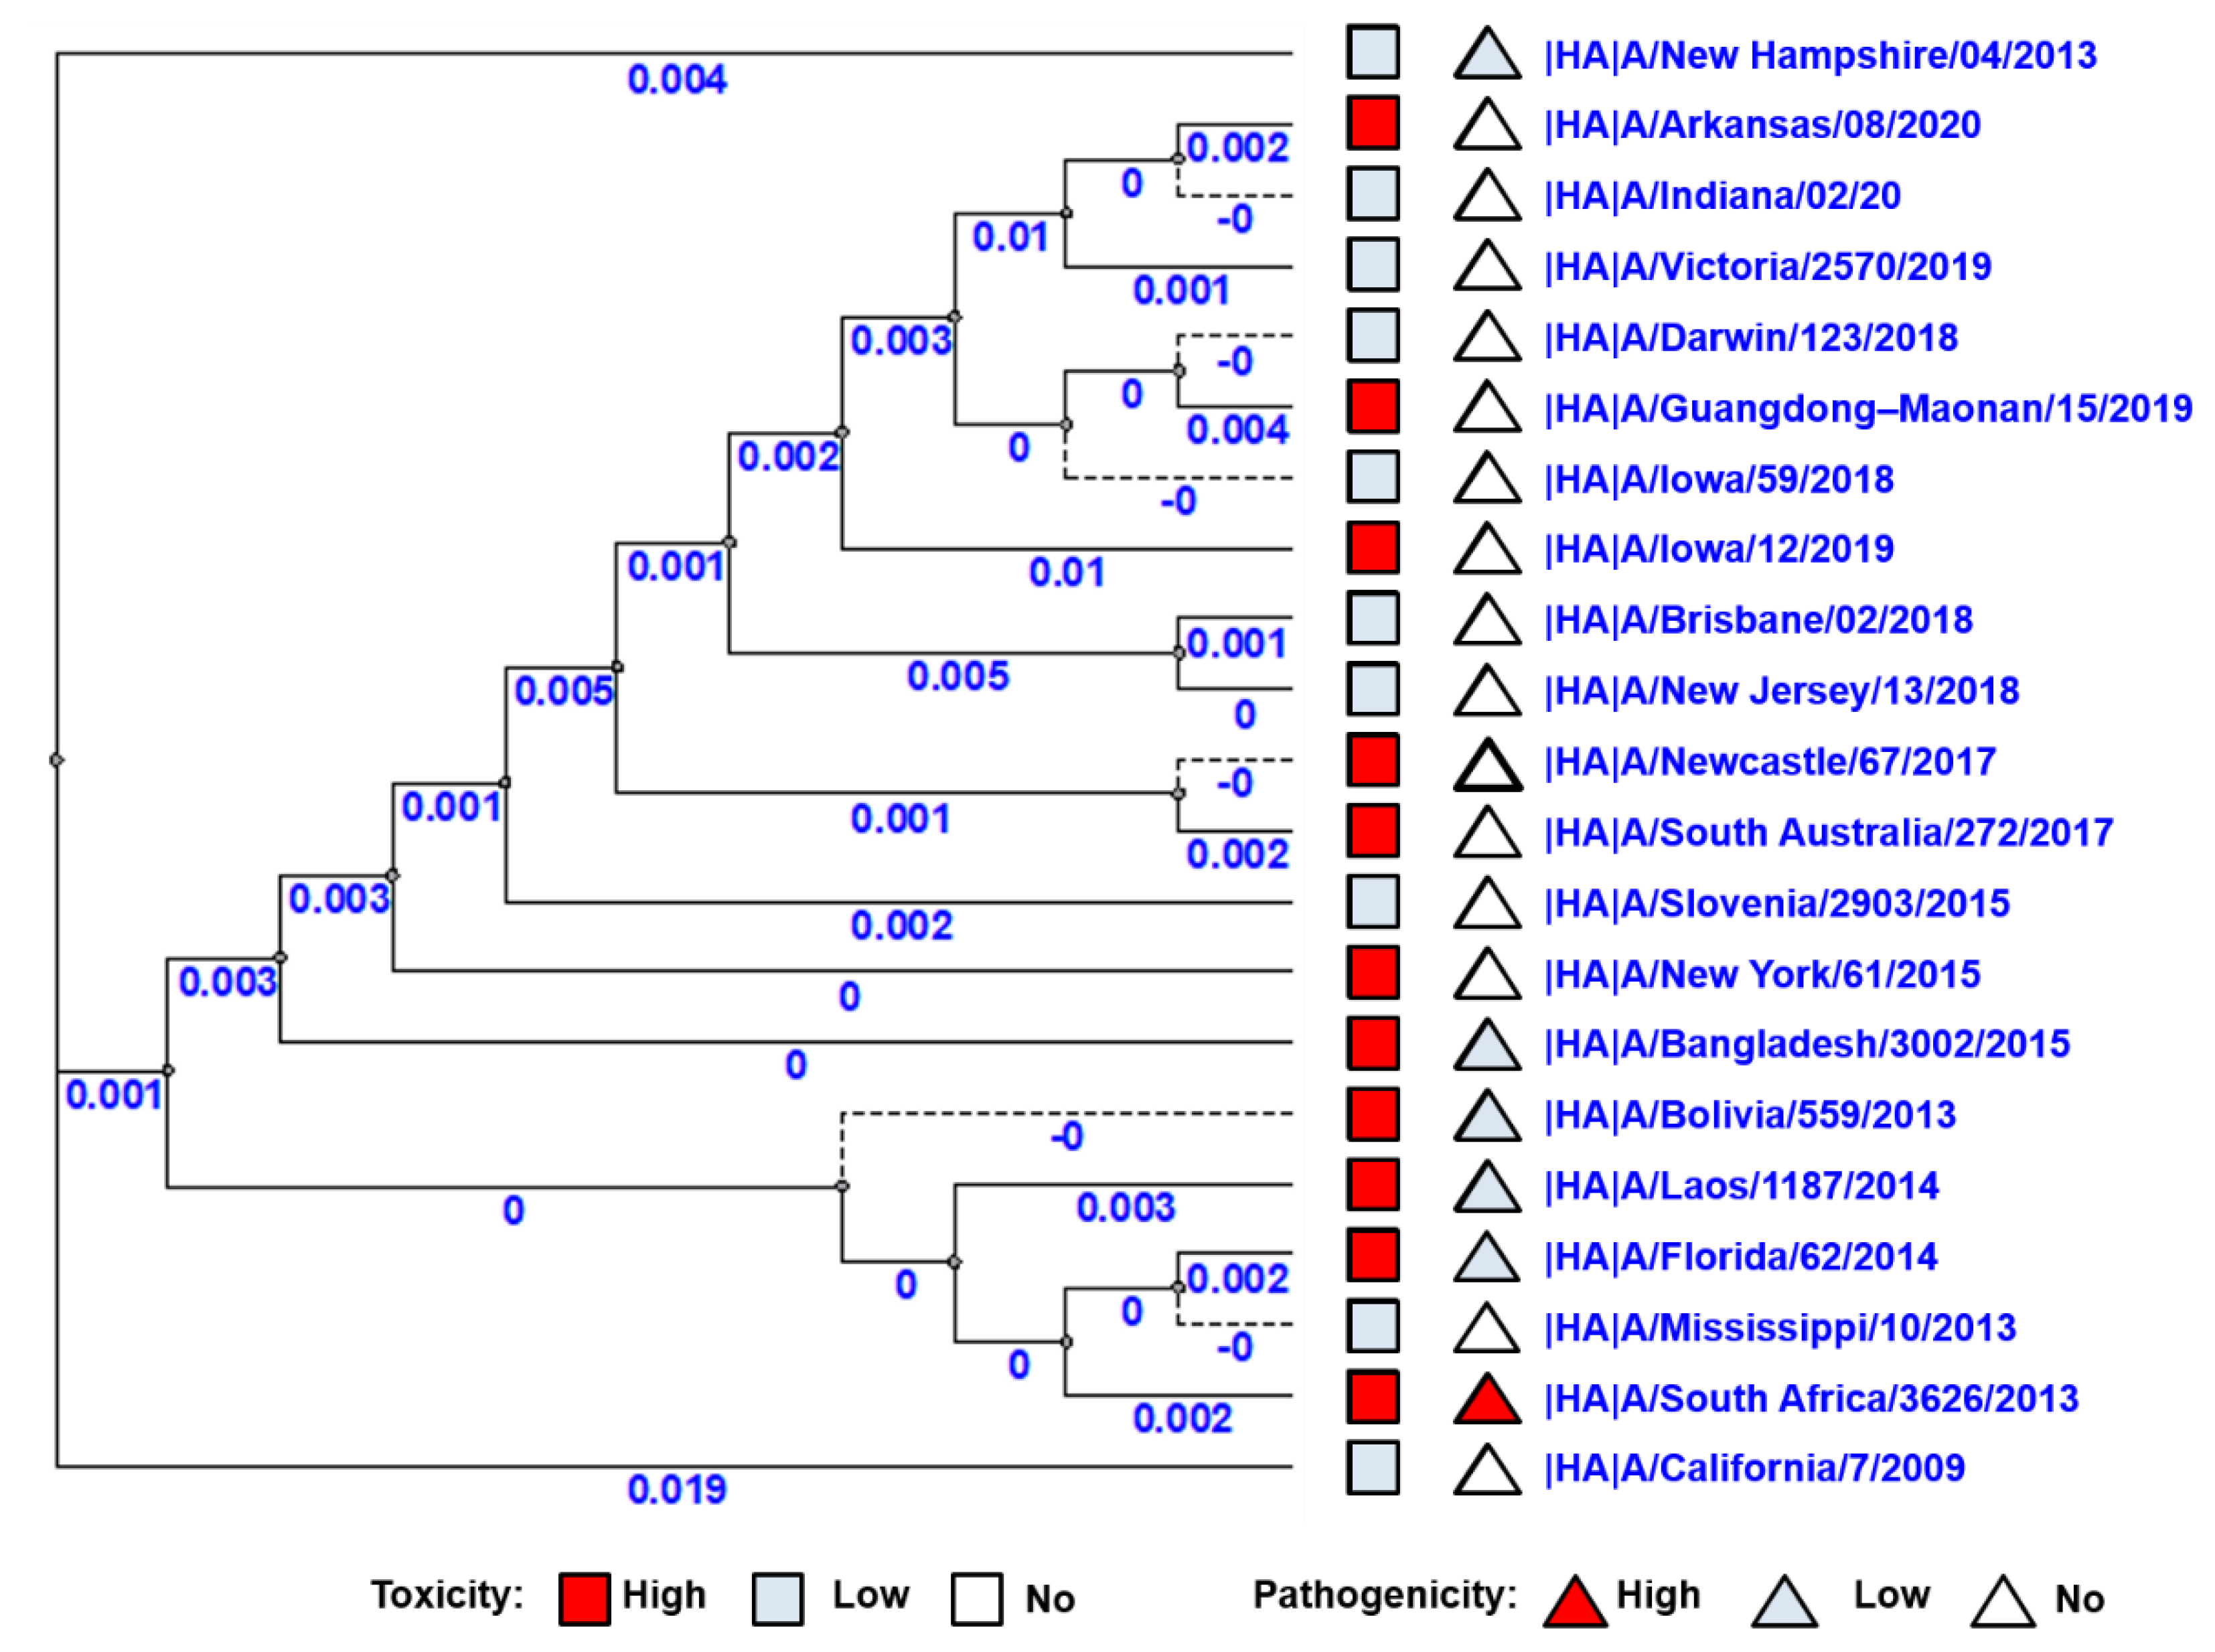
Phylogenetic trees of all 10 viral proteins were built to study the possible correlation between the viral toxic and pathological properties and their gene sequence. No correlation was observed between virus distributions on the phylogenetic tree of HA genes and toxic/pathological properties (Figure 4). Thus, to identify the possible role of other genes (NA, PA, PB1, PB2, M1, M2, NP, NEP, NS1) in the manifestation of pathogenicity and toxicity, phylogenetic trees for the remaining nine viral proteins were constructed; again, no clear correlation was detected (Supplemental Figures S1–S9).
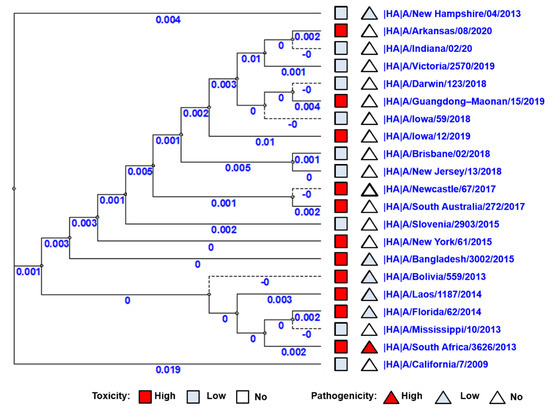
Figure 4.
Phylogenetic tree of HA genes of A(H1N1)pdm09 influenza viruses used in this study. The red square indicates a strain of high toxicity. The red triangle indicates a strain of high pathogenicity. The pale blue square indicates a strain of low or no toxicity. The pale blue triangle indicates a strain of low or no pathogenicity.
3.6. Presumed Molecular Basis for High Pathogenicity and Toxicity as A(H1N1)pdm09 Viral Properties
Since the distribution of viruses on phylogenetic trees did not provide clear explanations for viral pathogenicity and toxicity, we sought more detailed information at the molecular level. Amino acid sequence alignment was performed for all viral protein sequences of the 21 studied viruses. We found no one mutation or amino acid substitution in all eight genes, coding for both HA and NA and internal proteins, which could explain the different levels of toxicity of the studied viruses.
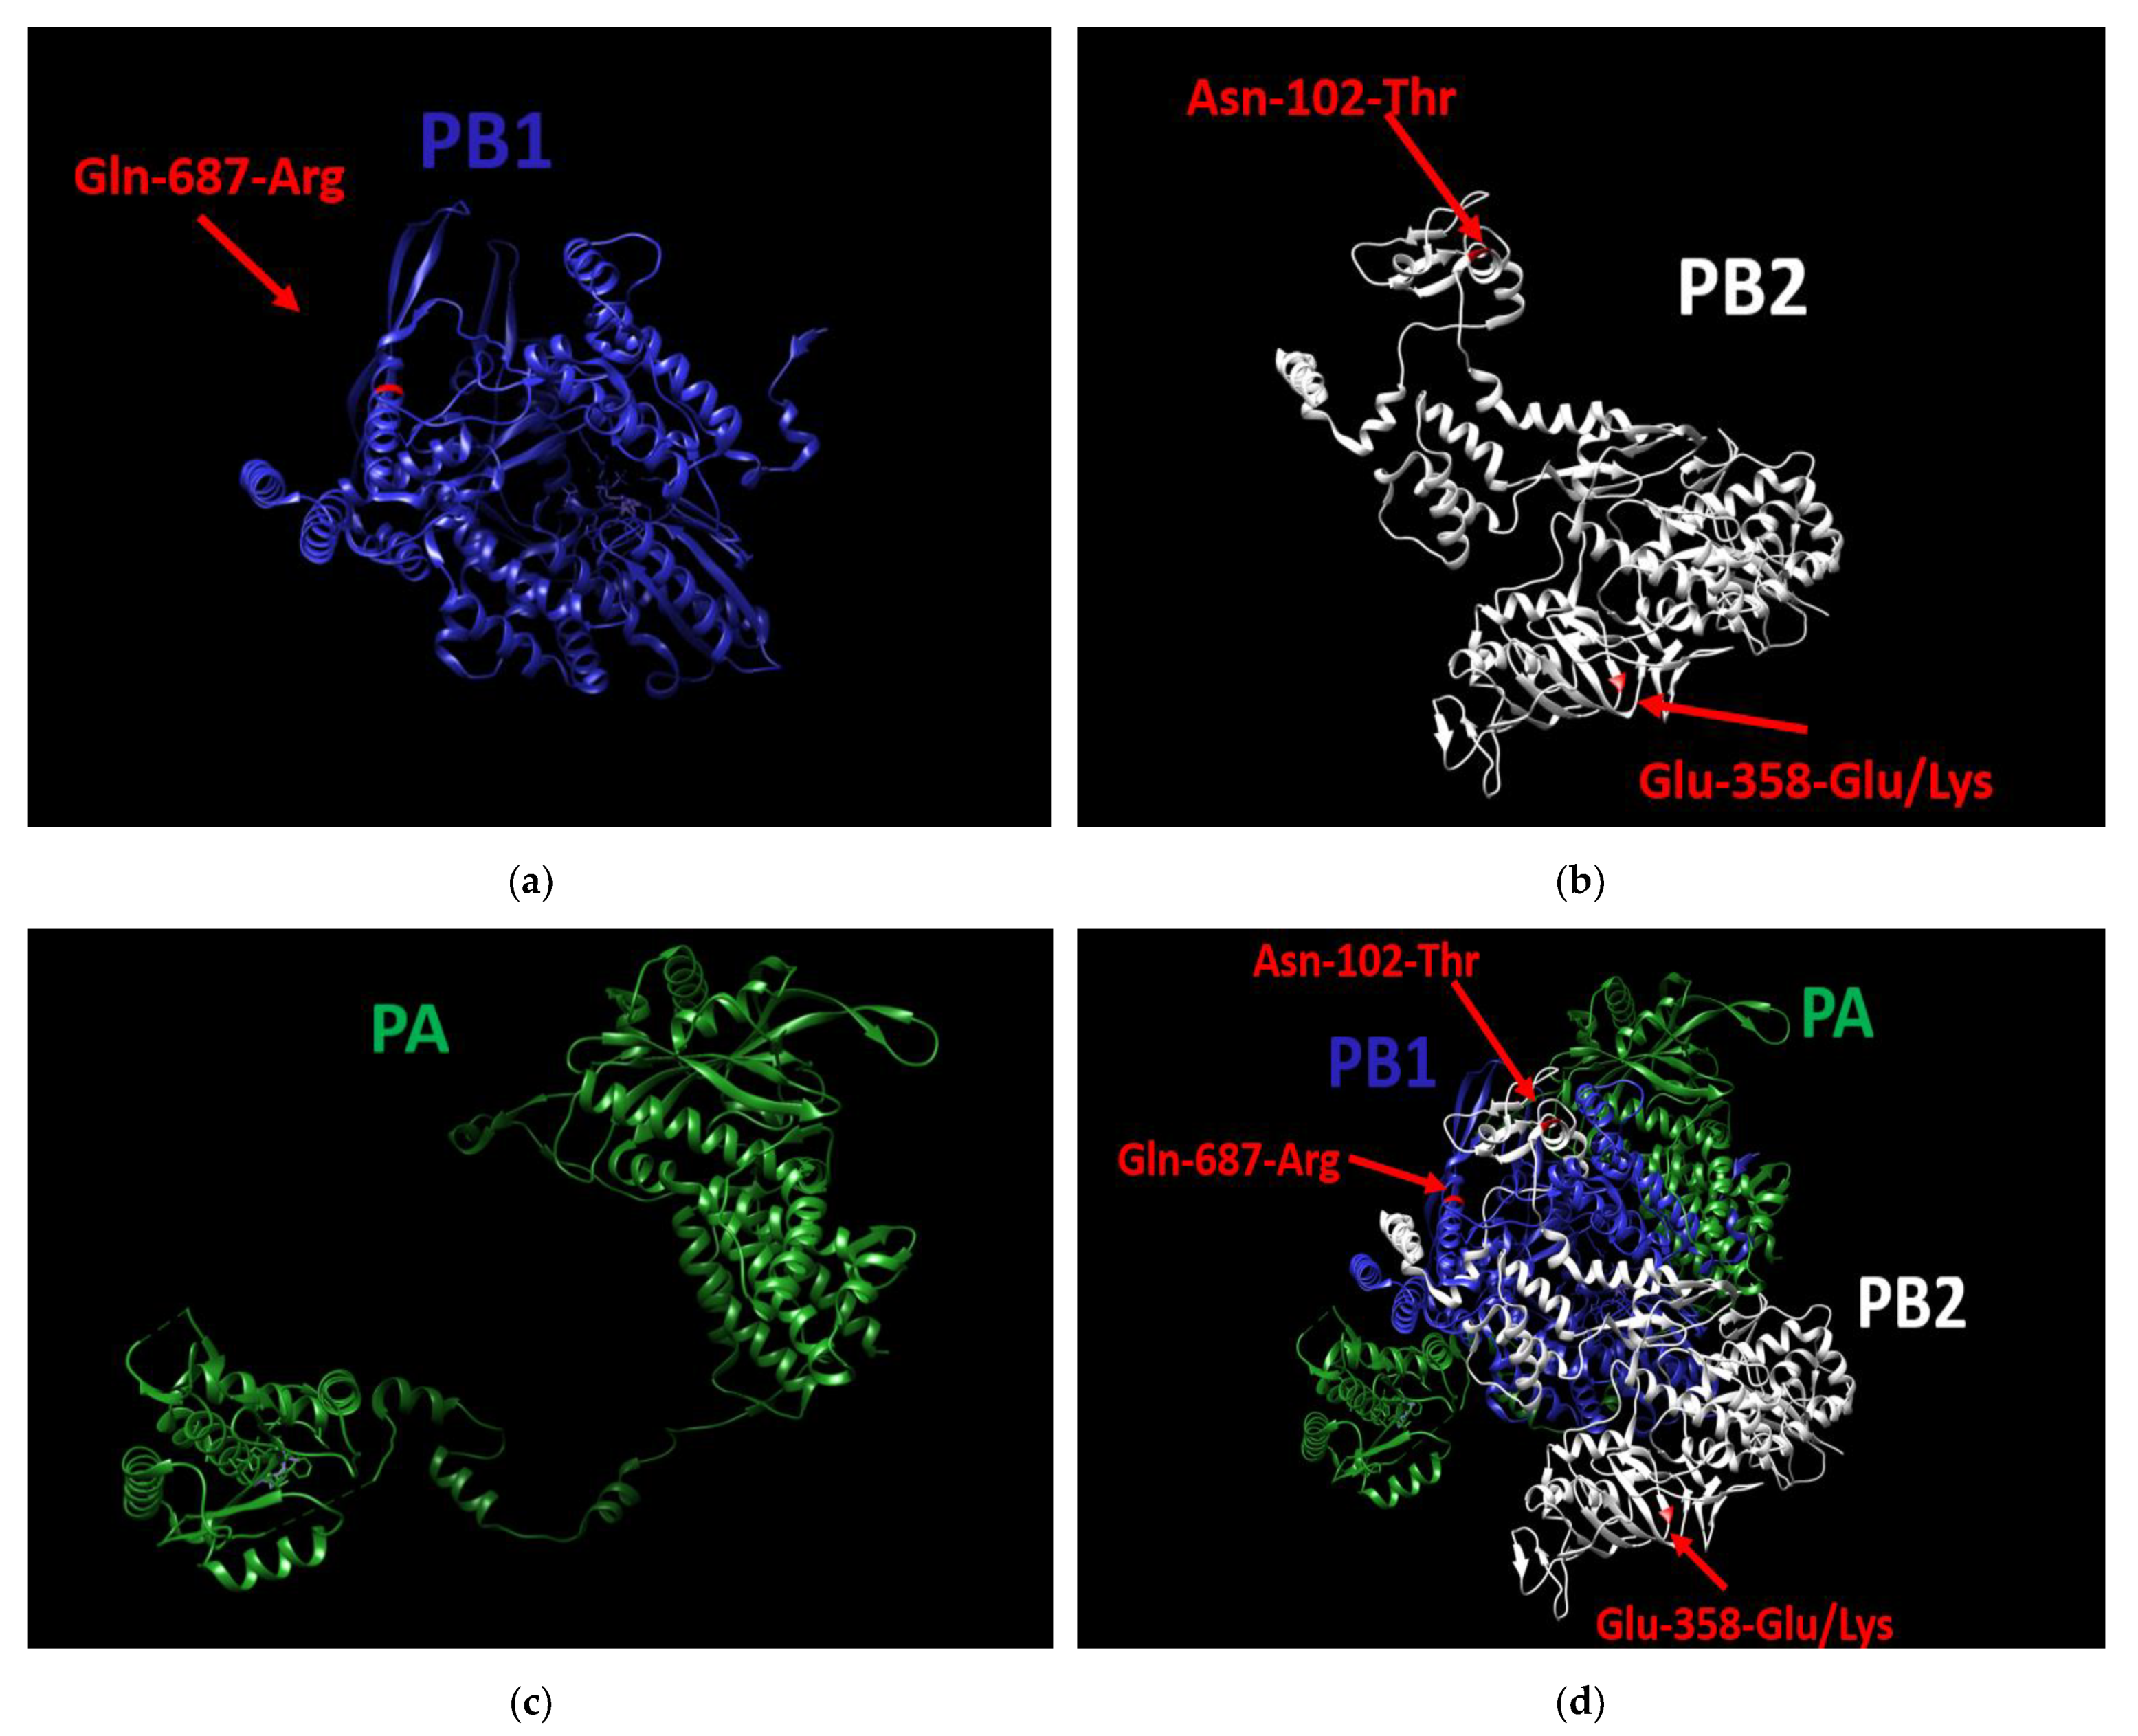
As for pathogenicity, in the previous step of the study we demonstrated that of the 21 tested viruses, only A/South Africa/3626/2013 demonstrated a high pathogenicity level (see Section “Pathogenicity for Mice”). It was shown that A/South Africa/3626/2013 used in our experiments had no unique mutations in HA, NA, M1, M2, NP, NEP, or NS1. On the other hand, in two out of three genes coding for the polymerase complex, three unique substitutions were found (Figure 5d); specifically, these were the Asn-102-Thr substitution in PB2, Glu-358-Glu/Lys heterogeneity substitution also in PB2 (Figure 5b), and Gln-687-Arg substitution in PB1 (Figure 5a). The PA gene does not contain unique substitutions (Figure 5c).
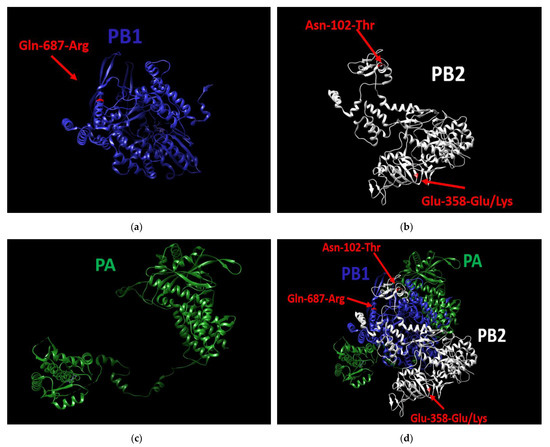
Figure 5.
3D structure of the polymerase complex of A/South Africa/3626/2013 virus. (a) the PB1 protein contains the unique substitution (Gln-687-Arg), (b): the PB2 protein contains two unique substitutions (Asn-102-Thr, Glu-358-Glu/Lys), (c) the PA protein does not contain unique mutations, (d) Structure of the entire polymerase complex with the three substitutions. UCSF Chimera 1.15, was used to build the 3D structure.
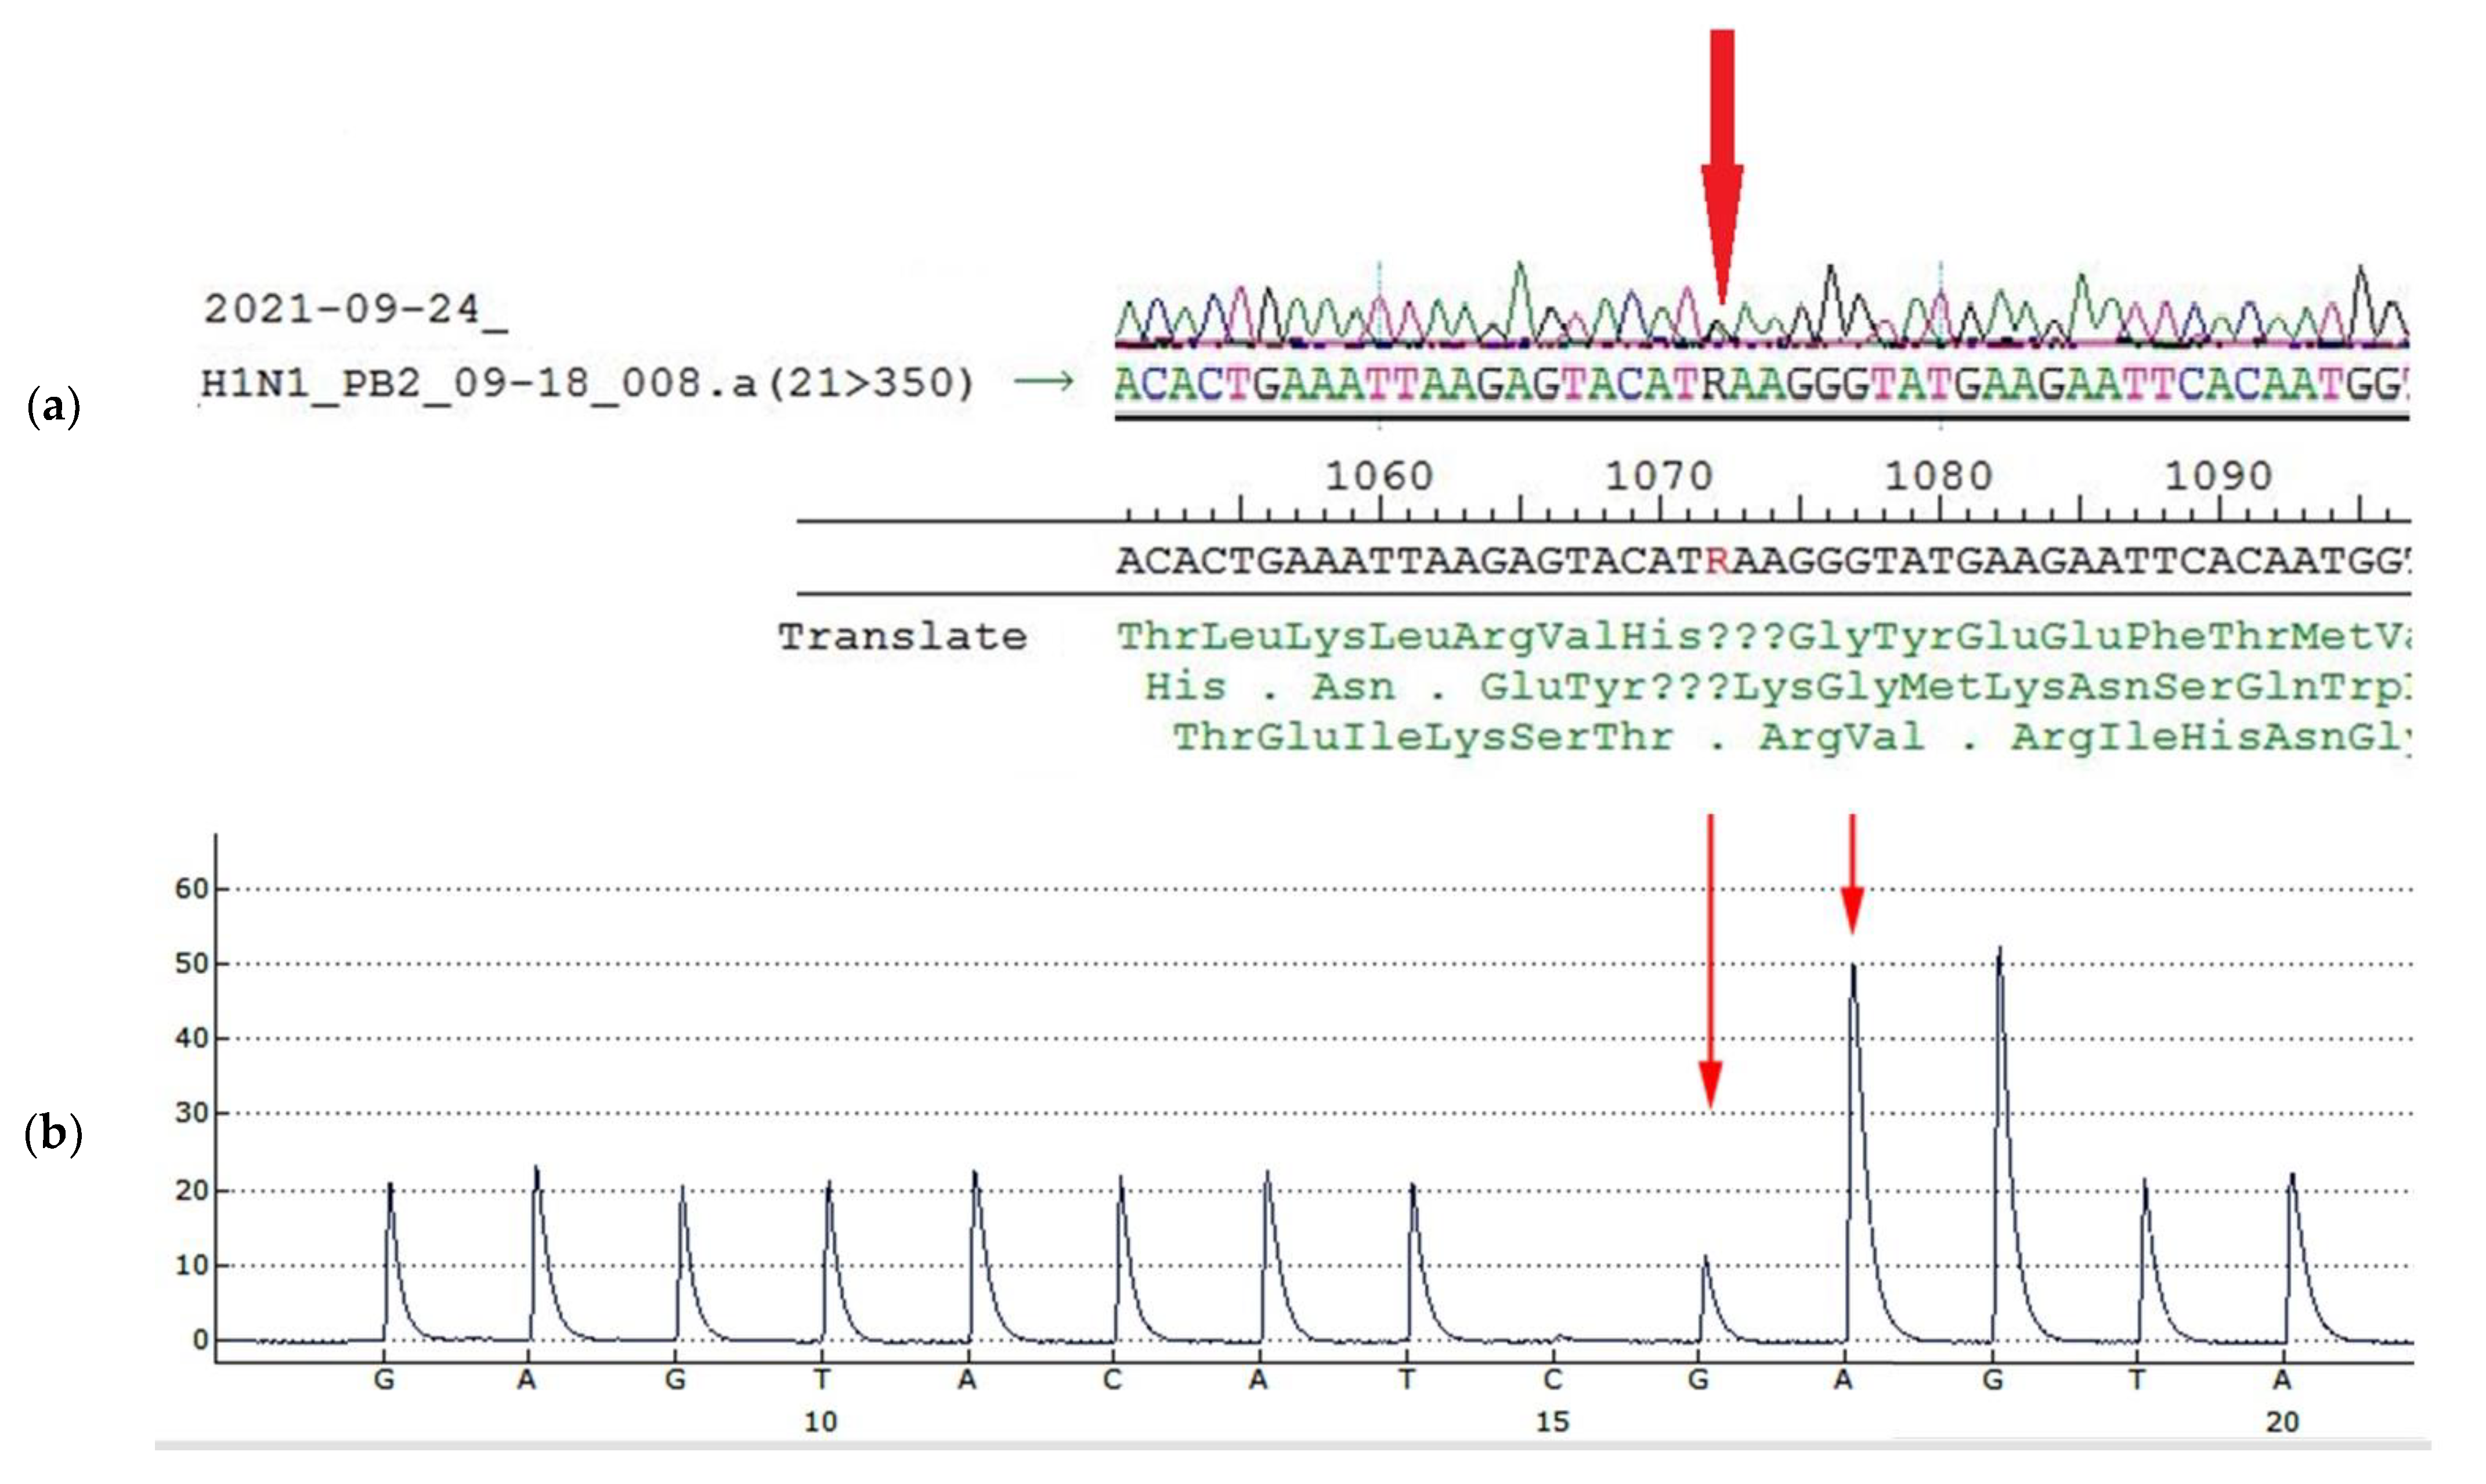
Glu-358-Glu/Lys heterogeneity in PB2 results from heterogeneity A/G in the 1072 nucleotide position of the PB2 gene segment (Figure 6a, Table 5). To detect the ratio of each component in the population, pyrosequencing of this position was performed. According to pyrosequencing reaction results, the ratio of variants was about 1: (Figure 6b, Table 5).
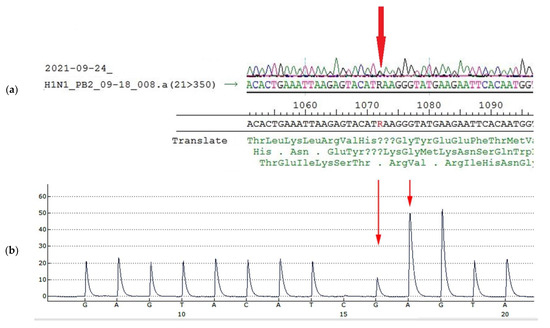
Figure 6.
Sanger sequencing and pyrosequencing of A/South Africa/3626/2013 virus used for mice infection (egg passage E4) (a): Sanger sequencing of PB2 gene fragment, (b): Detection of the nucleotide sequence in PB2 fragment 1064–1079 of A/South Africa/3626/2013 virus used for mice infection (egg passage E4) by pyrosequencing. The peak highness in G position (b, long arrow) is half-height, peak A (b, short arrow) is less than 3 height, (in case of AAA sequence the peak would be higher than 3, because of slightly higher fluorescent of A due to protocol peculiarities). The approximate ratio of G/A components in the 1072 position is equal.

Table 5.
Unique substitutions in amino acid sequence of A/South Africa/3626/2013 (H1N1)pdm09 influenza virus proteins.
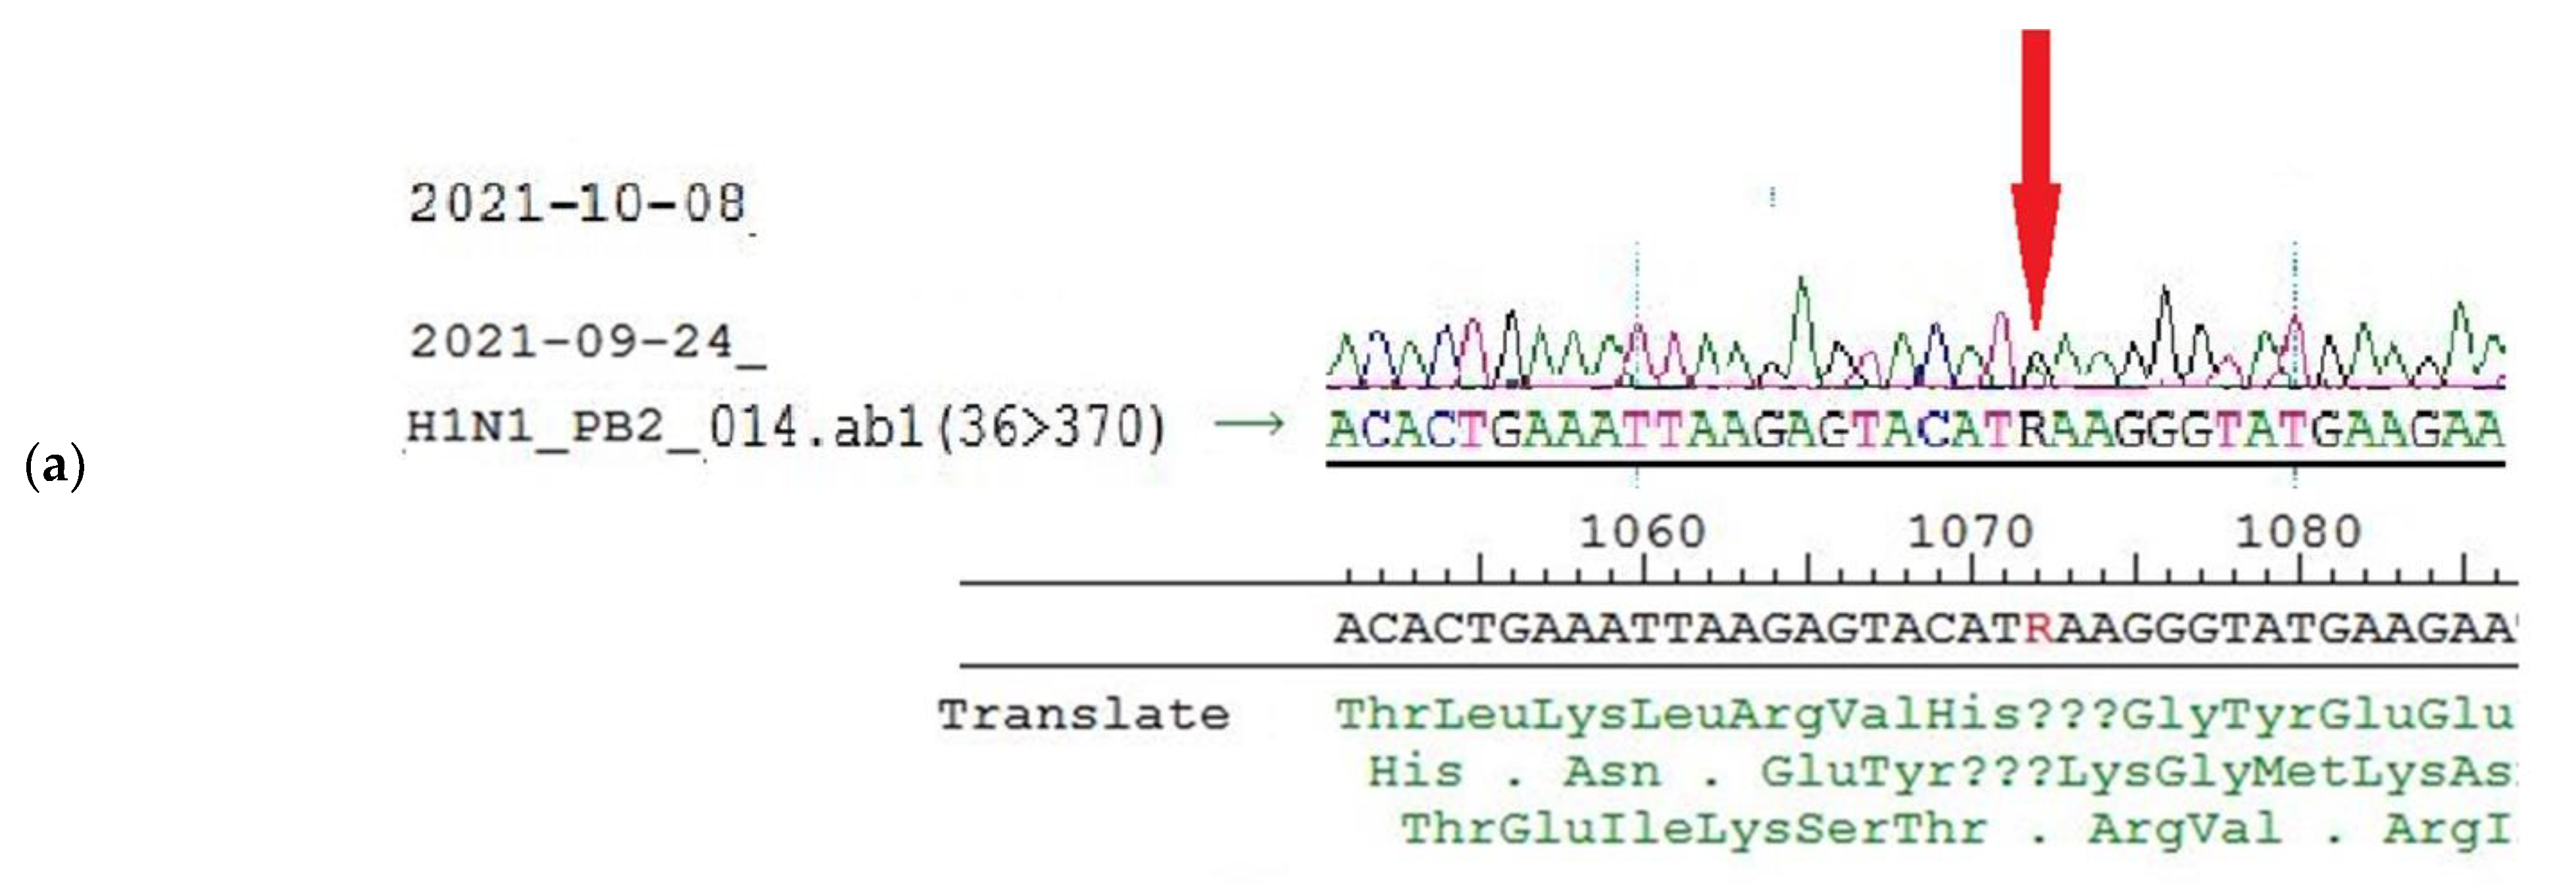
Further investigations into the heterogeneity A/G in 1072 nucleotide position in PB2 gene segment were conducted, including sequencing of viral RNA extracted from mice lung tissue on the third day after the infection (E4 + one passage in mice). Sanger sequencing and pyrosequencing of virus population isolated from mice lungs revealed the persistence of 1072 A/G heterogeneity (Figure 7a,b).
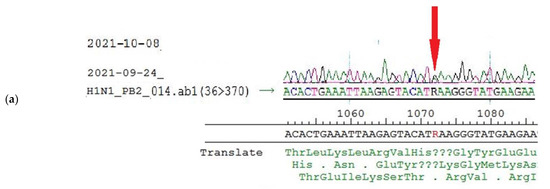

Figure 7.
Sanger sequencing and pyrosequencing of A/South Africa/3626/2013 virus of mice isolates (a): Sanger sequencing of PB2 gene fragment, (b): Detection of the nucleotide sequence in PB2 fragment 1064–1079 by pyrosequencing. Arrows show the peaks of interest.
Interestingly, the sequence of the PB2 segment for the A/South Africa/3626/2013 virus E1E2/E3 passage (GISAID isolate ID EPI_ISL_175880) also contained 1072 A/G heterogeneity (Table 5). In the light of previous results, the alignment study was expanded to include an additional 134 influenza A (H1N1)pdm09 viruses isolated from 2009 to 2021 and available on the GISAID platform (the GISAID isolates’ IDs are listed in Supplemental Table S1), where the three abovementioned substitutions remained unique for A/South Africa/3626/2013 (Table 5).
4. Discussion
The primary objective of this work was to study the evolutionary variability of certain biological traits of influenza A(H1N1)pdm09 virus strains that have been circulating since 2009 in order to determine how their biological properties have been changing during their circulation. We analyzed 21 A(H1N1)pdm09 viruses—starting from A/California/07/2009 and ending with last year’s strains—according to a variety of parameters, in particular, the pathogenicity and toxicity for mice, the temperature sensitivity of their reproduction in developing chicken embryos, and the thermal stability of hemagglutinin. We sought to detect any relationship between these traits and possible mutational changes.
Non-ts phenotype viruses can infect lower respiratory tracts as they can replicate at temperatures higher than 37 °C, which increases their pathogenicity and allows them to resist the organism’s response [35,36]. For this reason, temperature-sensitive (ts) viruses are much less virulent [35]. Temperature sensitivity is also an essential property required for the development of attenuated reassortant strains for live influenza vaccines [37,38]. It has been suggested that the circulation of only temperature-sensitive viruses for several years can be considered as a sign of the coming appearance of a new virus that is antigenically distant from the circulating strains [39].
This suggestion is supported by the observation that the evolutionary variability of the ts/non-ts phenotype has a fluctuating trend where the non-ts phenotype is dominant at the beginning of the pandemic cycle. Subsequently, the percentage of ts viruses after the emergence of a new strain increases stably over the years [14,39]. For instance, in 1949–1957, ts isolates accounted for 8.3% of all investigated A(H1N1) viruses, whereas they made up 76.5% in 1977–1978 [35], which provided the opportunity for new non-ts strains (A/Khabarovsk/90/77 “Russian flu”) to appear and circulate, causing the 1977 pandemic [14].
The same phenomenon was observed just before the 2009 influenza pandemic. All influenza A (H1N1), influenza A (H3N2), and influenza B viruses isolated from 2006 to 2009 had a ts phenotype [14]. In other words, the ts viruses circulated until 2009, when they were replaced by the viciously spreading non-ts A/California/07/09 (H1N1)pdm influenza virus, causing the 2009 pandemic. The A/California/07/09 (H1N1)pdm virus has begun another wave of circulation of non-ts viruses.
Although there were only 21 viruses in our study group, the fluctuating trend persevered, whereby drift variants of the A/California/07/09 (H1N1)pdm virus kept the non-ts phenotype until 2015, after which the first ts strain (9, A/Slovenia/2903/2015) appeared and the proportion of the ts phenotype started to increase gradually, indicating that the ts phenotype will dominate in the coming years.
The newly emerged human influenza A viruses might have kept two of the three genes, as a minimum, of the polymerase complex from their progenitor, which could explain the ability of these viruses to withstand and produce new copies in temperatures over 37 °C since these progenitors used to replicate in animals that have a higher physiological body temperature than humans, such as birds or pigs [14]. In addition, a variety of studies showed that the ts/non-ts phenotype of influenza viruses is connected with mutations in the protein PB2 [40,41,42].
The phenomenon of influenza viral toxicity has been known since the 1940s [16,43]. However, the mechanism of viral toxicity is still poorly studied. Most works were published in the 1990s [44,45,46]. The idea was that the toxicity of the influenza virus is probably caused by viral dsRNA, produced during viral replication, either directly because it shares many biological and physical properties of bacterial toxins or as a result of the interferon (IFN) it induces [46,47]. The direct mechanism theory is supported by the antitoxic effect of rimantadine, which works as an M2 ion channel membrane protein blocker, preventing detachment of the viral RNP from the matrix, which blocks influenza A virus entry into the cells [37,38]. However, rimantadine did not show specific activity against influenza B viruses’ primary pneumonia [48]. Furthermore, though rimantadine created a significant reduction in the mortality of mice from toxic effects caused by influenza A viruses, influenza B viruses, or exotoxin of Staphylococcus aureus, it did not prevent the toxic effect of adrenaline [48]. This suggests that bacterial toxins and influenza viruses might have the same toxic mechanism that can be eliminated by rimantadine even if the strain is resistant to it [48]. Moreover, viral dsRNA causes cytotoxic effects through two mechanisms: either it inhibits protein synthesis indirectly through its induction of 2’–5’ oligo (A) synthetase and/or a dsRNA-dependent protein kinase, or it enhances degradation of ssRNA through activation of the endonuclease RNase. These cellular effects may cause local tissue necrosis in addition to the classical antiviral effect of IFN. During cell lysis, dsRNA, which can resist degradation by intracellular nucleases [47], is released into the extracellular environment and interacts with macrophages, invoking cytokine production [46,47] and triggering the toxic effect [44,45]. These toxicity mechanisms might explain why there is no one mutation or amino acid substitution that can be associated with the different levels of toxicity of the studied viruses.
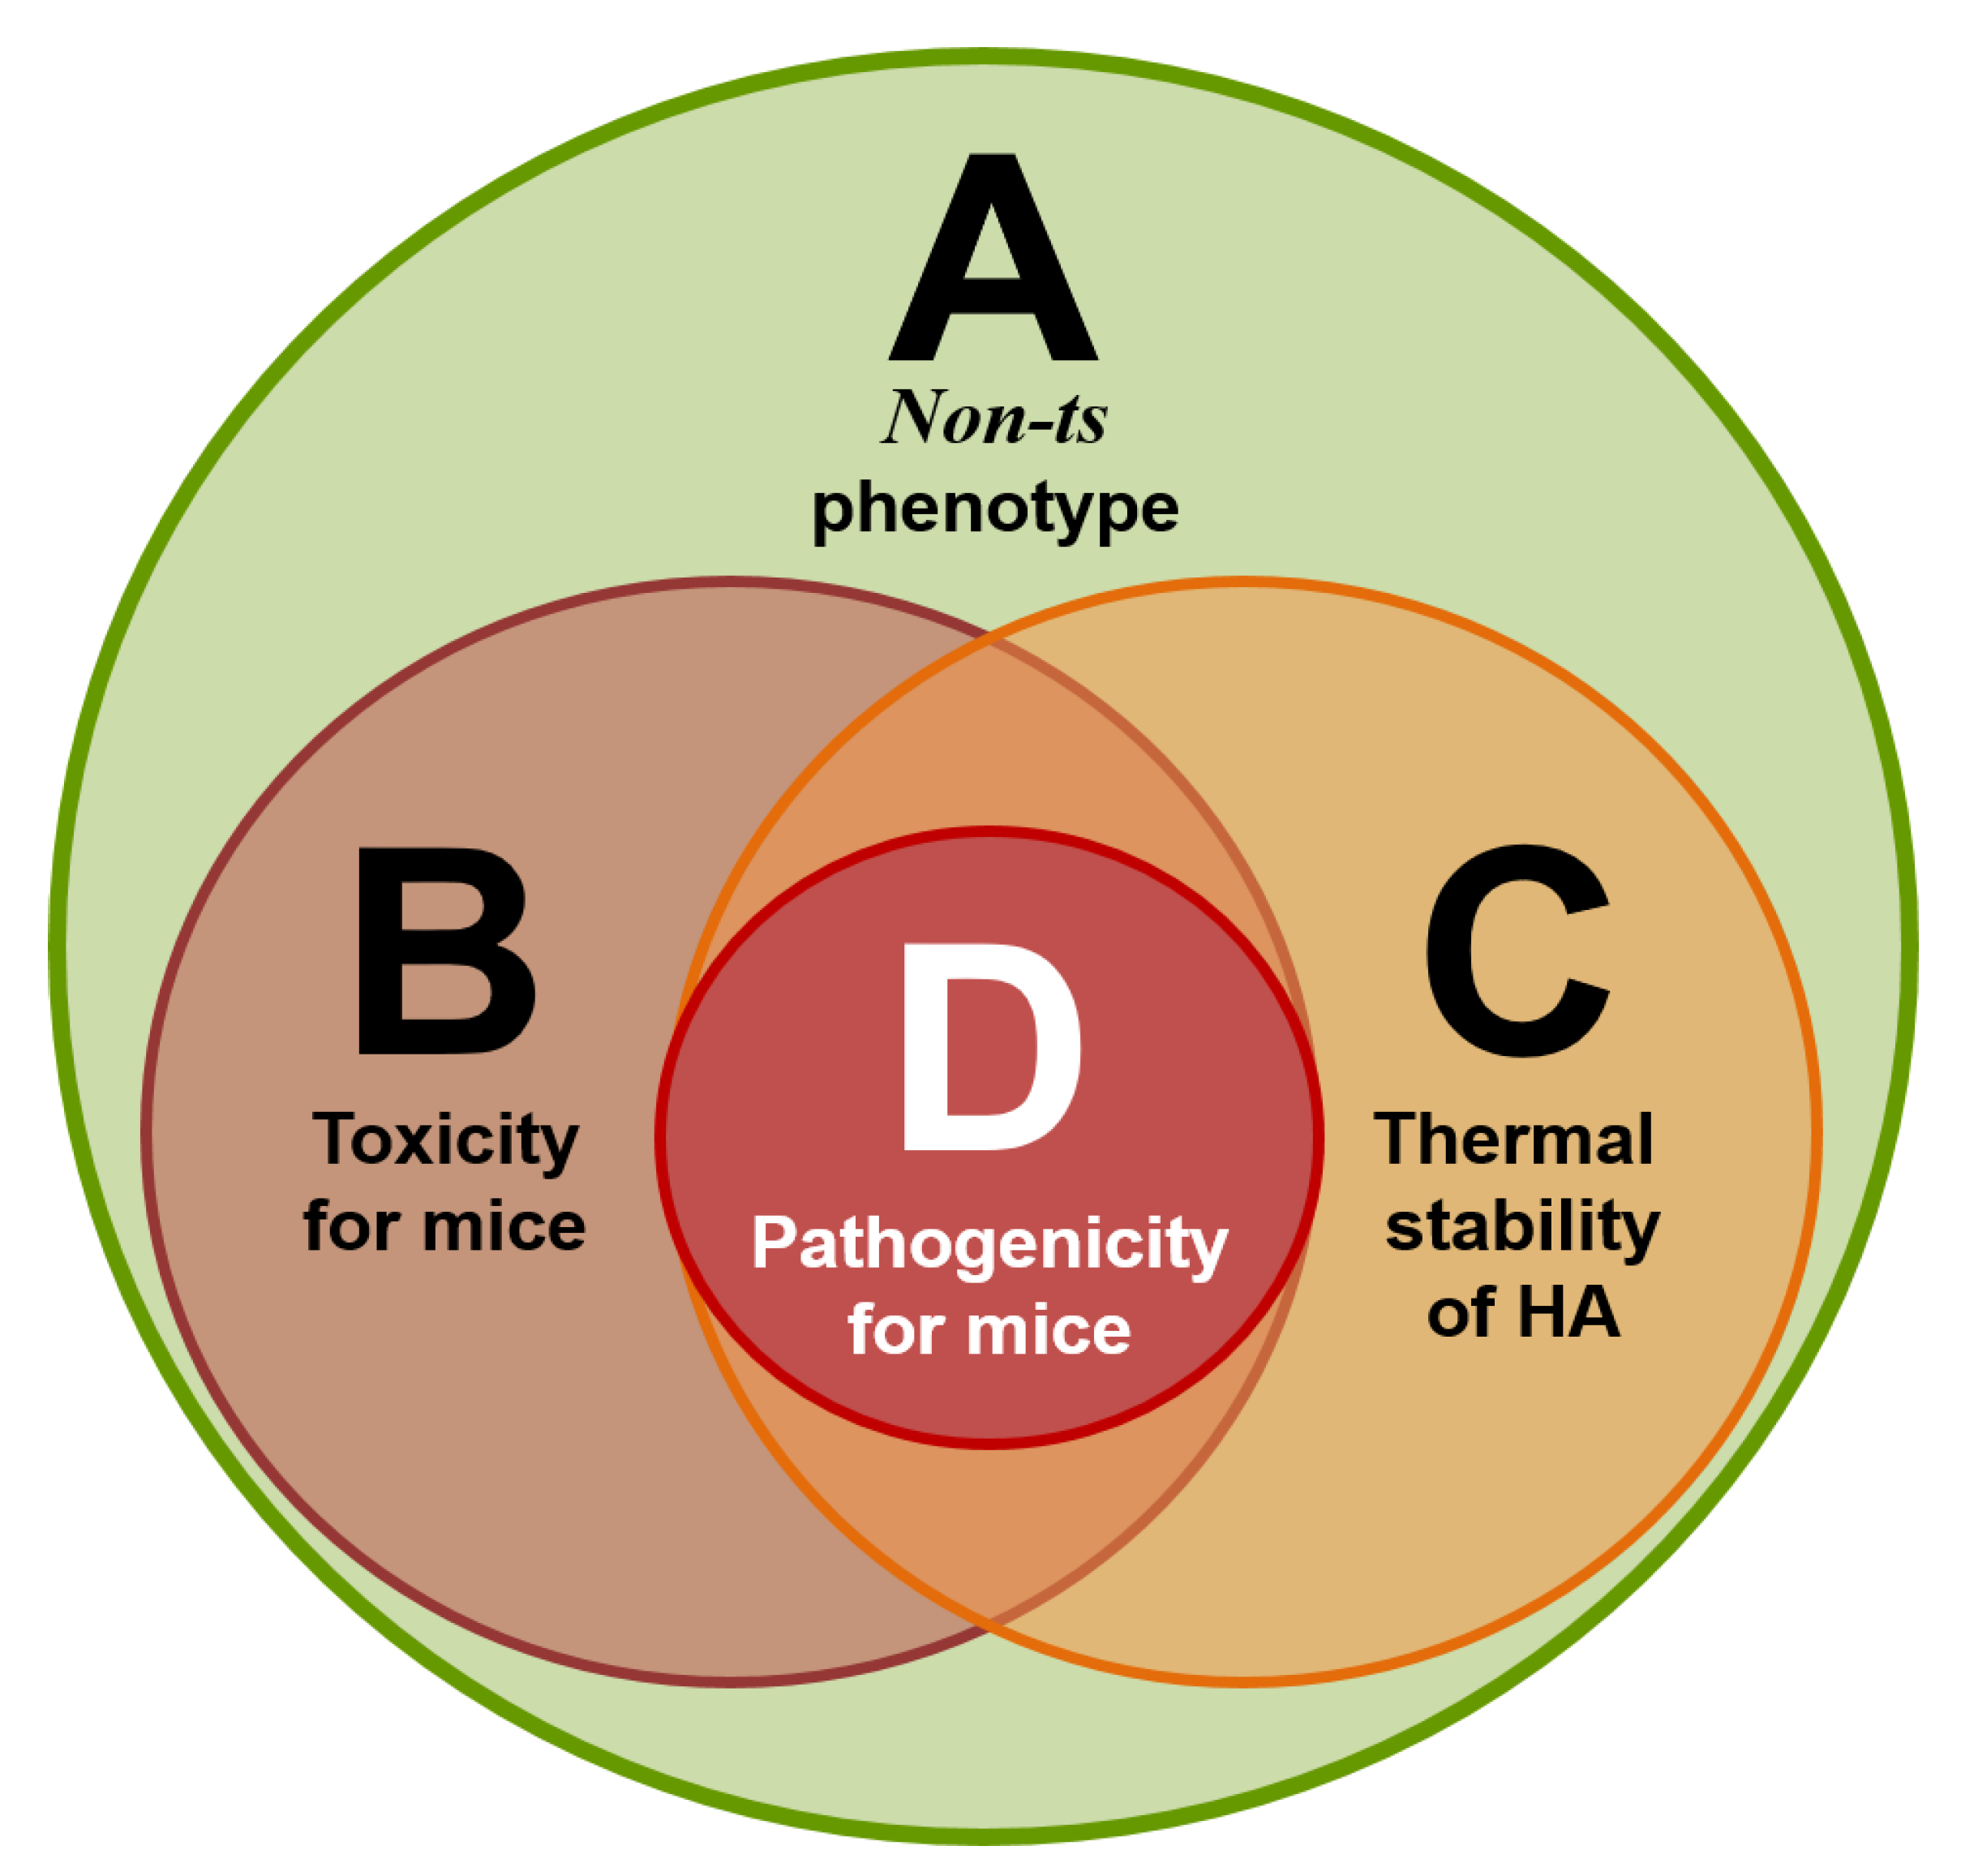
Our research concluded that for a virus to have properties such as toxicity, or the thermal stability of the hemagglutinin, it is necessary but not sufficient to be characterized as a non-ts phenotype. In other words, if the virus has a toxic effect or thermally stable hemagglutinin, it is adequate evidence that the virus has a non-ts phenotype but it is not the other way around. Furthermore, having a non-ts phenotype, toxicity and thermally stable hemagglutinin are necessary but not sufficient for the virus to become pathogenic for laboratory animals, indicating that there are still some properties that might also contribute to the degree of pathogenicity. The strongest candidates are the virus transmissibility and resistance to sera non-specific inhibitors. However, if the virus is pathogenic for laboratory animals, that means that it has all of the other three properties (Figure 8).
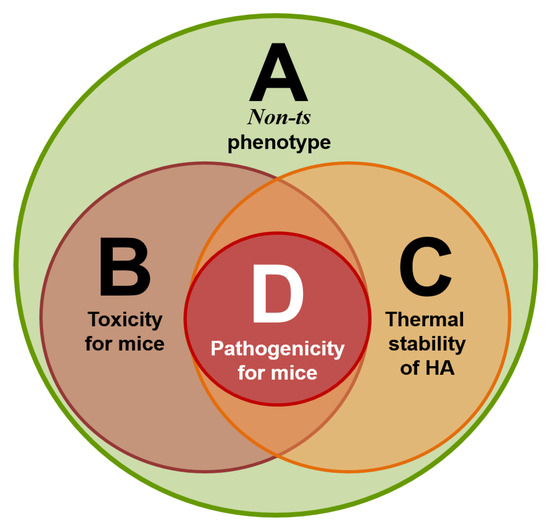
Figure 8.
Four circle diagram: correlations of four sets of virus properties—A (non-ts phenotype), B (toxicity for mice), C (thermal stability of the hemagglutinin), and D (pathogenicity for mice).
Earlier, we showed that the A/South Africa/3626/2013 influenza virus has the unique property of high pathogenicity for mice without preliminary adaptation to them, but the ancestor virus A/California/07/2009 does not have such a property [29]. The interaction between the influenza virus and the host cells on the molecular level defined the viral virulence and its ability to infect this particular host. In addition, the virus has different methods of avoiding the antiviral response of the host. The process of the adaptation of the influenza virus to a new host requires mutations and/or the reassortment of the viral genome, and these events present themselves as a level of pathogenicity [49].
Practically all of the viral genes participate in virus pathogenicity; this fact was established in numerous studies [50,51,52,53,54,55,56,57,58,59,60,61]. HA and NA always work in harmony, are responsible for tissue tropism and interspecies transmission [49], and strongly affect transmissibility between humans [62], while NS1 virus proteins increase the viral pathogenicity by working as interferon antagonists and inhibiting the interferon transcription factors [63], which give the virus the ability to escape from the immune system. The polymerase complex also plays an essential role in viral pathogenicity. For instance, to adapt to mammals, one of the avian influenza viral strategies is increasing the activity of the viral polymerase complex [10]. Moreover, the polymerase complex plays a special role in the pathogenicity or attenuation of influenza viruses. Attenuation may be considered as the reverse of pathogenicity [18]. In particular, mutations in PB2 and PB1 can convert the non-ts phenotype to ts, resulting in the attenuation of the strain. For instance, the modification of a cold-adapted attenuated influenza virus model and its wild-type (WT) progenitor using different methods (classical reassortment or plasmid-based reverse genetics system) demonstrated how replacing PB2 mutant genes in the attenuated model with PB2 from its WT progenitor results in a non-ts reassortant. On the other hand, replacing PB2 genes in the WT progenitor with mutant PB2 from the attenuated model results in a ts attenuated reassortant. The same results were obtained with a PB1 substitution [22,23,24,25].
Our molecular study showed that the A/South Africa/3626/2013 virus has three unique mutations in the polymerase complex (two in PB2 Asn-102-Thr, Glu-358-Glu/Lys and one in PB1 Gln-687-Arg). Gln-687-Arg localized in the C-terminus of PB1 [64]. Residues 678–757 in the C-terminus of PB1 form a binding site, which is required for tight-binding with PB2 through its N-terminus. Mutations in this position strongly affect polymerase activity [65]. Asn-102-Thr falls in the (PB2-N1) subdomain of the N-terminal third, and this subdomain acts as a support for the PB1 thumb domain [64]. Due to these data, we can assume that the two mutations might increase the polymerase stability and thus its activity, which could explain the high pathogenicity of the A/South Africa/3626/2013 virus.
Regarding the Glu-358-Glu/Lys substitution in PB2, Glu in this position is highly conservative among different influenza subtypes (in the alignment of 517 PB2 protein sequences of H1N1, H3N2, H2N2, H5N1, H5N8, H7N7, H7N9, and H9N2 animal and human influenza isolates; see Table 4). The Lys variant was detected in only one A/northern shoveler/Mississippi/11OS202/2011 (H7N7) influenza virus (GISAID sequence ID EPI419570) [34]. This amino acid position is part of the cap-binding domain of the PB2 protein [64], which suggests that this mutation might directly affect the polymerase activity. However, in our study, the heterogeneity persisted with an equal ratio even after passage in mice, demonstrating that the two variants had been replicated equally in mice’s lungs, which indicates that this substitution might not sufficiently affect the viral pathogenicity. Nevertheless, further investigation—including the reassortment of the gene fragments containing these three mutations—is required to affirm the roles of these three mutations in viral pathogenicity.
5. Conclusions
For the first time, a comparative analysis of modern A(H1N1)pdm09 influenza viruses, according to their essential biological characteristics and how are they associated with changes at the molecular level, was conducted. We know that viral pathogenicity results from the contributions of many properties. In this study, we focused on the roles of the non-ts phenotype, toxicity, and HA thermal stability in the manifestation of pathogenicity. For high pathogenicity, the virus must have all three properties. Each of these properties is indispensable and plays a key role in viral pathogenicity in a mice model.
An alignment analysis was carried out to answer the question of what the causes are of high or low pathogenicity of influenza viruses A(H1N1)pdm09 at the molecular level. It was previously shown that genes coding for the polymerase complex play a key role in the influenza A virus pathogenicity. In this study, three unique mutations were found in the polymerase complex of the A/South Africa/3626/2013 influenza virus that might contribute to its function, thus explaining the high pathogenicity of this virus.
6. Limitations
In the genome analysis of the study the sample size included 154 influenza A H1N1 viruses from which only 21 reference viruses were available for the authors to perform a comparative analysis of the main biological characteristics of the viruses.
Supplementary Materials
The following are available online at https://www.mdpi.com/article/10.3390/vaccines10030395/s1, Figure S1: Phylogenetic tree of NA genes of A(H1N1)pdm09 influenza viruses used in this study, Figure S2: Phylogenetic tree of PA genes of A(H1N1)pdm09 influenza viruses used in this study, Figure S3: Phylogenetic tree of PB1 genes of A(H1N1)pdm09 influenza viruses used in this study, Figure S4: Phylogenetic tree of PB2 genes of A(H1N1)pdm09 influenza viruses used in this study, Figure S5: Phylogenetic tree of M1 genes of A(H1N1)pdm09 influenza viruses used in this study, Figure S6: Phylogenetic tree of M2 genes of A(H1N1)pdm09 influenza viruses used in this study, Figure S7: Phylogenetic tree of NP genes of A(H1N1)pdm09 influenza viruses used in this study, Figure S8: Phylogenetic tree of NEP genes of A(H1N1)pdm09 influenza viruses used in this study, Figure S9: Phylogenetic tree of NS1 genes of A(H1N1)pdm09 influenza viruses used in this study, Table S1: IDs of 150 available in GISAID sequences of A(H1N1)pdm09 influenza viruses.
Author Contributions
Conceptualization, I.K., L.P. and L.R.; Data curation, M.A.F.; Formal analysis, M.A.F., I.K., E.B. and E.S.; Investigation, M.A.F., E.B. and E.S.; Methodology, M.A.F. and I.K.; Project administration, L.R.; Resources, L.P. and L.R.; Supervision, I.K., L.P. and L.R.; Validation, E.B. and E.S.; Writing—original draft, M.A.F. and I.K.; Writing—review & editing, M.A.F. and I.K. All authors have read and agreed to the published version of the manuscript.
Funding
This research received no external funding.
Institutional Review Board Statement
The study was conducted according to the guidelines of the Declaration of Helsinki, and approved by the Institutional Local Ethical Committee of IEM, St. Petersburg, Russia (the mice use protocol No. 1/20 from 27 February 2020).
Informed Consent Statement
Not applicable.
Data Availability Statement
All relevant data are within the manuscript.
Acknowledgments
The authors gratefully acknowledge the Institute of Experimental Medicine Administration for the administrative and technical support to fulfill this research. The authors are grateful to Andrey Rekstin for his expert assistance in animal work and Natalie Larionova for helpful discussions during the progression of this study.
Conflicts of Interest
The authors declare that they have no conflict of interest.
References
- WHO. Seasonal Ifluenza. Available online: https://www.euro.who.int/en/health-topics/communicable-diseases/influenza/seasonal-influenza (accessed on 1 February 2022).
- Spreeuwenberg, P.; Kroneman, M.; Paget, J. Reassessing the global mortality burden of the 1918 influenza pandemic. Am. J. Epidemiol. 2018, 187, 2561–2567. [Google Scholar] [CrossRef] [PubMed]
- WHO. Pandemic Influenza Risk Management Interim Guidance. Available online: https://www.icao.int/APAC/Meetings/2014%20CAPSCAAP7/Pandemic%20Influenza_Risk%20Management_Interim%20Guidance_Jun%202013%20WHO.pdf (accessed on 1 February 2022).
- Michaelis, M.; Doerr, H.W.; Cinatl, J., Jr. Novel swine-origin influenza A virus in humans: Another pandemic knocking at the door. Med. Microbiol. Immunol. 2009, 198, 175–183. [Google Scholar] [CrossRef] [PubMed]
- WHO. Pandemic Influenza. Available online: https://www.euro.who.int/en/health-topics/communicable-diseases/influenza/pandemic-influenza (accessed on 1 February 2022).
- Petrova, V.N.; Russell, C.A. The evolution of seasonal influenza viruses. Nat. Rev. Microbiol. 2018, 16, 47–60. [Google Scholar] [CrossRef] [PubMed]
- Lowen, A.C.; Mubareka, S.; Tumpey, T.M.; Garcia-Sastre, A.; Palese, P. The guinea pig as a transmission model for human influenza viruses. Proc. Natl. Acad. Sci. USA 2006, 103, 9988–9992. [Google Scholar] [CrossRef]
- Kiseleva, I.; Larionova, N.; Kuznetsov, V.; Rudenko, L. Phenotypic characteristics of novel swine-origin influenza A/California/07/2009 (H1N1) virus. Influenza Other Respir. Viruses 2010, 4, 1–5. [Google Scholar] [CrossRef]
- Lyons, D.M.; Lauring, A.S. Mutation and epistasis in influenza virus evolution. Viruses 2018, 10, 407. [Google Scholar] [CrossRef]
- Cox, N.J.; Kitame, F.; Kendal, A.P.; Maassab, H.F.; Naeve, C. Identification of sequence changes in the cold-adapted, live attenuated influenza vaccine strain, A/Ann Arbor/6/60 (H2N2). Virology 1988, 167, 554–567. [Google Scholar] [CrossRef]
- Herlocher, M.L.; Maassab, H.F.; Webster, R.G. Molecular and biological changes in the cold-adapted “master strain” A/AA/6/60 (H2N2) influenza virus. Proc. Natl. Acad. Sci. USA 1993, 90, 6032–6036. [Google Scholar] [CrossRef]
- Reeve, P.; Almond, J.W.; Felsenreich, V.; Pibermann, M.; Maassab, H.F. Studies with a cold-recombinant A/Victoria/3/75 (H3N2) virus. I. biologic, genetic, and biochemical characterization. J. Infect. Dis. 1980, 142, 850–856. [Google Scholar] [CrossRef]
- Larionova, N.; Kiseleva, I.; Isakova, I.; Litvinova, O.; Klimov, A.; Rudenko, L. Naturally occurring temperature-sensitive strains of influenza B virus. In Proceedings of the IVW-2004 Conference, Lisbon, Portugal, 24–26 May 2004; pp. 92–97. [Google Scholar]
- Kiseleva, I.; Larionova, N. Influenza virus ecology and evolution. In Influenza: A Century of Research; Kiseleva, I., Larionova, N., Eds.; Bentham Science Publisher: Sharjah, United Arab Emirates, 2021; pp. 63–97. [Google Scholar] [CrossRef]
- Henle, G.; Henle, W. Studies on the toxicity of influenza viruses: I. The effect of intracerebral injection of influenza viruses. J. Exp. Med. 1946, 84, 623–637. [Google Scholar] [CrossRef][Green Version]
- Henle, W.; Henle, G. Studies on the toxicity of influenza viruses. J Bacteriol. 1946, 51, 632. [Google Scholar] [PubMed]
- Henle, W.; Henle, G. Studies on the toxicity of influenza viruses. II. The effect of intra-abdominal and intravenous injection of influenza viruses. J. Exp. Med. 1946, 84, 639–660. [Google Scholar] [CrossRef] [PubMed]
- Nakowitsch, S.; Wolschek, M.; Morokutti, A.; Ruthsatz, T.; Krenn, B.M.; Ferko, B.; Ferstl, N.; Triendl, A.; Muster, T.; Egorov, A.; et al. Mutations affecting the stability of the haemagglutinin molecule impair the immunogenicity of live attenuated H3N2 intranasal influenza vaccine candidates lacking NS1. Vaccine 2011, 29, 3517–3524. [Google Scholar] [CrossRef] [PubMed]
- Pflug, A.; Lukarska, M.; Resa-Infante, P.; Reich, S.; Cusack, S. Structural insights into RNA synthesis by the influenza virus transcription-replication machine. Virus Res. 2017, 234, 103–117. [Google Scholar] [CrossRef] [PubMed]
- De Vlugt, C.; Sikora, D.; Pelchat, M. Insight into influenza: A virus cap-snatching. Viruses 2018, 10, 641. [Google Scholar] [CrossRef]
- Bouvier, N.M.; Palese, P. The biology of influenza viruses. Vaccine 2008, 26, D49–D53. [Google Scholar] [CrossRef]
- Isakova-Sivak, I.; Chen, L.M.; Matsuoka, Y.; Voeten, J.T.; Kiseleva, I.; Heldens, J.G.; den Bosch, H.; Klimov, A.; Rudenko, L.; Cox, N.J.; et al. Genetic bases of the temperature-sensitive phenotype of a master donor virus used in live attenuated influenza vaccines: A/Leningrad/134/17/57 (H2N2). Virology 2011, 412, 297–305. [Google Scholar] [CrossRef]
- Kiseleva, I.V.; Larionova, N.V.; Voeten, J.T.; Teley, L.C.; Drieszen-van der Cruijsen, S.K.; Heldens, J.G.; van den Bosch, J.F.; Rudenko, L.G. Leading role of genes coding polymerase complex in attenuation of domestic donor viruses for A and B live influenza vaccine. Zhurnal Mikrobiol. Epidemiol. Immunobiol. 2010, 6, 41–47. [Google Scholar]
- Kiseleva, I.V.; Voeten, J.T.; Teley, L.C.; Larionova, N.V.; Drieszen-van der Cruijsen, S.K.; Basten, S.M.; Heldens, J.G.; van den Bosch, H.; Rudenko, L.G. PB2 and PA genes control the expression of the temperature-sensitive phenotype of cold-adapted B/USSR/60/69 influenza master donor virus. J. Gen. Virol. 2010, 91, 931–937. [Google Scholar] [CrossRef]
- Klimov, A.I.; Kiseleva, I.V.; Alexandrova, G.I.; Cox, N.J. Genes coding for polymerase proteins are essential for attenuation of the cold–adapted A/Leningrad/134/17/57 (H2N2) influenza virus. In Proceedings of the Options for the Control of Influenza IV, Crete, Greece, 23–28 September 2000; pp. 955–959. [Google Scholar]
- IRD. Influenza Research Database. Available online: https://www.fludb.org/brc/home.spg?decorator=influenza (accessed on 2 December 2021).
- Reed, L.J.; Muench, H. A simple method of estimating fifty per cent endpoints. Am. J. Epidemiol. 1938, 27, 493–497. [Google Scholar] [CrossRef]
- Scholtissek, C. Stability of infectious influenza A viruses at low pH and at elevated temperature. Vaccine 1985, 3, 215–218. [Google Scholar] [CrossRef]
- Kiseleva, I.; Rekstin, A.; Al Farroukh, M.; Bazhenova, E.; Katelnikova, A.; Puchkova, L.; Rudenko, L. Non-mouse-adapted H1N1pdm09 virus as a model for influenza research. Viruses 2020, 12, 590. [Google Scholar] [CrossRef] [PubMed]
- Karkishenko, N.N.; Grachev, C.V. Manual for Laboratory Animals and Alternative Models in Biomedical Research. Moscow, Russia: Profile-2S. 2010. Available online: http://www.scbmt.ru/mag/rukovodstvo.pdf (accessed on 4 December 2021).
- European_Council. Directive 2010/63/EU of the European Parliament and of the Council of September 22, 2010, on the Protection of Animals Used for Scientific Purposes. Available online: http://eur-lex.europa.eu/legal-content/EN/TXT/?uri=celex%3A32010L0063 (accessed on 2 December 2021).
- World Medical Association. World Medical Association Declaration of Helsinki: Ethical principles for medical research involving human subjects. Jama 2013, 310, 2191–2194. [Google Scholar] [CrossRef] [PubMed]
- Russian Sanitary and Epidemiological Requirements for the Prevention of Infectious Diseases SP 3.3686-21 (approved 28 January 2021). Available online: https://www.rospotrebnadzor.ru/files/news/SP_infections_compressed.pdf (accessed on 2 December 2021).
- Isakova-Sivak, I.; Stepanova, E.; Mezhenskaya, D.; Matyushenko, V.; Prokopenko, P.; Sychev, I.; Wong, P.F.; Rudenko, L. Influenza vaccine: Progress in a vaccine that elicits a broad immune response. Expert Rev. Vaccines 2021, 20, 1097–1112. [Google Scholar] [CrossRef]
- Chu, C.M.; Tian, S.F.; Ren, G.F.; Zhang, Y.M.; Zhang, L.X.; Liu, G.Q. Occurrence of temperature-sensitive influenza A viruses in nature. J. Virol. 1982, 41, 353–359. [Google Scholar] [CrossRef]
- Yamaya, M.; Nishimura, H.; Lusamba Kalonji, N.; Deng, X.; Momma, H.; Shimotai, Y.; Nagatomi, R. Effects of high temperature on pandemic and seasonal human influenza viral replication and infection-induced damage in primary human tracheal epithelial cell cultures. Heliyon 2019, 5, e01149. [Google Scholar] [CrossRef]
- Kiseleva, I.V.; Klimov, A.I.; Grigor’eva, E.P.; Larionova, N.V.; Aleksandrova, G.I.; Rudenko, L.G. Genetic and phenotypic analysis of heterogeneous population of a cold-adapted donor of the A/Leningrad/134/17/57 (H2N2) attenuation and of the donor-based reassortant influenza vaccine strains. Vopr. Virusol. 2005, 50, 14–18. [Google Scholar]
- Maassab, H.F.; DeBorde, D.C. Development and characterization of cold-adapted viruses for use as live virus vaccines. Vaccine 1985, 3, 355–369. [Google Scholar] [CrossRef]
- Rudenko, L.G.; Kiseleva, I.V.; Larionova, N.V.; Grigorieva, E.P.; Naikhin, A.N. Analysis of some factors influencing immunogenicity of live cold–adapted reassortant influenza vaccines. In Proceedings of the Options for the Control of Influenza V, Okinawa, Japan, 6–9 October 2003; pp. 542–546. [Google Scholar]
- Massin, P.; van der Werf, S.; Naffakh, N. Residue 627 of PB2 is a determinant of cold sensitivity in RNA replication of avian influenza viruses. J. Virol. 2001, 75, 5398–5404. [Google Scholar] [CrossRef]
- Giles, B.M.; Ross, T.M. A computationally optimized broadly reactive antigen (COBRA) based H5N1 VLP vaccine elicits broadly reactive antibodies in mice and ferrets. Vaccine 2011, 29, 3043–3054. [Google Scholar] [CrossRef]
- McCauley, J.W.; Penn, C.R. The critical cut-off temperature of avian influenza viruses. Virus Res. 1990, 17, 191–198. [Google Scholar] [CrossRef]
- Mims, C.A. An analysis of the toxicity for mice of influenza virus. II. Intravenous toxicity. Br. J. Exp. Pathol. 1960, 41, 593–598. [Google Scholar] [PubMed]
- Fang, J.; Bredow, S.; Taishi, P.; Majde, J.A.; Krueger, J.M. Synthetic influenza viral double-stranded RNA induces an acute-phase response in rabbits. J. Med Virol. 1999, 57, 198–203. [Google Scholar] [CrossRef]
- Kimura-Takeuchi, M.; Majde, J.A.; Toth, L.A.; Krueger, J.M. The role of double-stranded RNA in induction of the acute-phase response in an abortive influenza virus infection model. J. Infect. Dis. 1992, 166, 1266–1275. [Google Scholar] [CrossRef] [PubMed]
- Majde, J.A.; Brown, R.K.; Jones, M.W.; Dieffenbach, C.W.; Maitra, N.; Krueger, J.M.; Cady, A.B.; Smitka, C.W.; Maassab, H.F. Detection of toxic viral-associated double-stranded RNA (dsRNA) in influenza-infected lung. Microb. Pathog. 1991, 10, 105–115. [Google Scholar] [CrossRef]
- Majde, J.A. Viral double-stranded RNA, cytokines, and the flu. J. Interferon. Cytokine Res. 2000, 20, 259–272. [Google Scholar] [CrossRef] [PubMed]
- Kiseleva, I.; Larionova, N. Influenza prophylaxis and treatment. In Influenza: A Century of Research; Kiseleva, I., Larionova, N., Eds.; Bentham Science Publisher: Sharjah, United Arab Emirates, 2021; pp. 98–141. [Google Scholar] [CrossRef]
- Kiseleva, I.; Larionova, N. Life cycle of influenza virus. In Influenza: A Century of Research; Kiseleva, I., Larionova, N., Eds.; Bentham Science Publisher: Sharjah, United Arab Emirates, 2021; pp. 26–62. [Google Scholar] [CrossRef]
- Choi, E.J.; Lee, Y.J.; Lee, J.M.; Kim, Y.J.; Choi, J.H.; Ahn, B.; Kim, K.; Han, M.G. The effect of mutations derived from mouse-adapted H3N2 seasonal influenza A virus to pathogenicity and host adaptation. PLoS ONE 2020, 15, e0227516. [Google Scholar] [CrossRef]
- Gabriel, G.; Czudai-Matwich, V.; Klenk, H.D. Adaptive mutations in the H5N1 polymerase complex. Virus Res. 2013, 178, 53–62. [Google Scholar] [CrossRef]
- Gabriel, G.; Fodor, E. Molecular determinants of pathogenicity in the polymerase complex. Curr. Top. Microbiol. Immunol. 2014, 385, 35–60. [Google Scholar] [CrossRef]
- Hu, M.; Yuan, S.; Zhang, K.; Singh, K.; Ma, Q.; Zhou, J.; Chu, H.; Zheng, B.J. PB2 substitutions V598T/I increase the virulence of H7N9 influenza A virus in mammals. Virology 2017, 501, 92–101. [Google Scholar] [CrossRef]
- Manz, B.; Schwemmle, M.; Brunotte, L. Adaptation of avian influenza A virus polymerase in mammals to overcome the host species barrier. J. Virol. 2013, 87, 7200–7209. [Google Scholar] [CrossRef] [PubMed]
- Mok, C.K.; Lee, H.H.; Lestra, M.; Nicholls, J.M.; Chan, M.C.; Sia, S.F.; Zhu, H.; Poon, L.L.; Guan, Y.; Peiris, J.S. Amino acid substitutions in polymerase basic protein 2 gene contribute to the pathogenicity of the novel A/H7N9 influenza virus in mammalian hosts. J. Virol. 2014, 88, 3568–3576. [Google Scholar] [CrossRef] [PubMed]
- Ping, J.; Dankar, S.K.; Forbes, N.E.; Keleta, L.; Zhou, Y.; Tyler, S.; Brown, E.G. PB2 and hemagglutinin mutations are major determinants of host range and virulence in mouse-adapted influenza A virus. J. Virol. 2010, 84, 10606–10618. [Google Scholar] [CrossRef] [PubMed]
- Rodriguez-Frandsen, A.; Alfonso, R.; Nieto, A. Influenza virus polymerase: Functions on host range, inhibition of cellular response to infection and pathogenicity. Virus Res. 2015, 209, 23–38. [Google Scholar] [CrossRef] [PubMed]
- Song, H.; Qi, J.; Khedri, Z.; Diaz, S.; Yu, H.; Chen, X.; Varki, A.; Shi, Y.; Gao, G.F. An open receptor-binding cavity of hemagglutinin-esterase-fusion glycoprotein from newly-identified influenza D virus: Basis for its broad cell tropism. PLoS pathogens 2016, 12, e1005411. [Google Scholar] [CrossRef]
- Tan, L.; Su, S.; Smith, D.K.; He, S.; Zheng, Y.; Shao, Z.; Ma, J.; Zhu, H.; Zhang, G. A combination of HA and PA mutations enhances virulence in a mouse-adapted H6N6 influenza A virus. J. Virol. 2014, 88, 14116–14125. [Google Scholar] [CrossRef] [PubMed]
- Watanabe, T.; Tisoncik-Go, J.; Tchitchek, N.; Watanabe, S.; Benecke, A.G.; Katze, M.G.; Kawaoka, Y. 1918 influenza virus hemagglutinin (HA) and the viral RNA polymerase complex enhance viral pathogenicity, but only HA induces aberrant host responses in mice. J. Virol. 2013, 87, 5239–5254. [Google Scholar] [CrossRef]
- Yamayoshi, S.; Yamada, S.; Fukuyama, S.; Murakami, S.; Zhao, D.; Uraki, R.; Watanabe, T.; Tomita, Y.; Macken, C.; Neumann, G.; et al. Virulence-affecting amino acid changes in the PA protein of H7N9 influenza A viruses. J. Virol. 2014, 88, 3127–3134. [Google Scholar] [CrossRef]
- Yen, H.L.; Liang, C.H.; Wu, C.Y.; Forrest, H.L.; Ferguson, A.; Choy, K.T.; Jones, J.; Wong, D.D.; Cheung, P.P.; Hsu, C.H.; et al. Hemagglutinin-neuraminidase balance confers respiratory-droplet transmissibility of the pandemic H1N1 influenza virus in ferrets. Proc. Natl. Acad. Sci. USA 2011, 108, 14264–14269. [Google Scholar] [CrossRef]
- Hale, B.G.; Randall, R.E.; Ortín, J.; Jackson, D. The multifunctional NS1 protein of influenza A viruses. J. Gen. Virol. 2008, 89, 2359–2376. [Google Scholar] [CrossRef]
- Pflug, A.; Guilligay, D.; Reich, S.; Cusack, S. Structure of influenza A polymerase bound to the viral RNA promoter. Nature 2014, 516, 355–360. [Google Scholar] [CrossRef] [PubMed]
- Sugiyama, K.; Obayashi, E.; Kawaguchi, A.; Suzuki, Y.; Tame, J.R.; Nagata, K.; Park, S.Y. Structural insight into the essential PB1-PB2 subunit contact of the influenza virus RNA polymerase. EMBO J. 2009, 28, 1803–1811. [Google Scholar] [CrossRef] [PubMed]
Publisher’s Note: MDPI stays neutral with regard to jurisdictional claims in published maps and institutional affiliations. |
© 2022 by the authors. Licensee MDPI, Basel, Switzerland. This article is an open access article distributed under the terms and conditions of the Creative Commons Attribution (CC BY) license (https://creativecommons.org/licenses/by/4.0/).

