
Genomic Transcriptome Benefits and Potential Harms of COVID-19 Vaccines Indicated from Optimized Genomic Biomarkers

Abstract
:1. Introduction
2. Method
3. Data Descriptions, Results, and Interpretations
3.1. The Data and Our Earlier Results
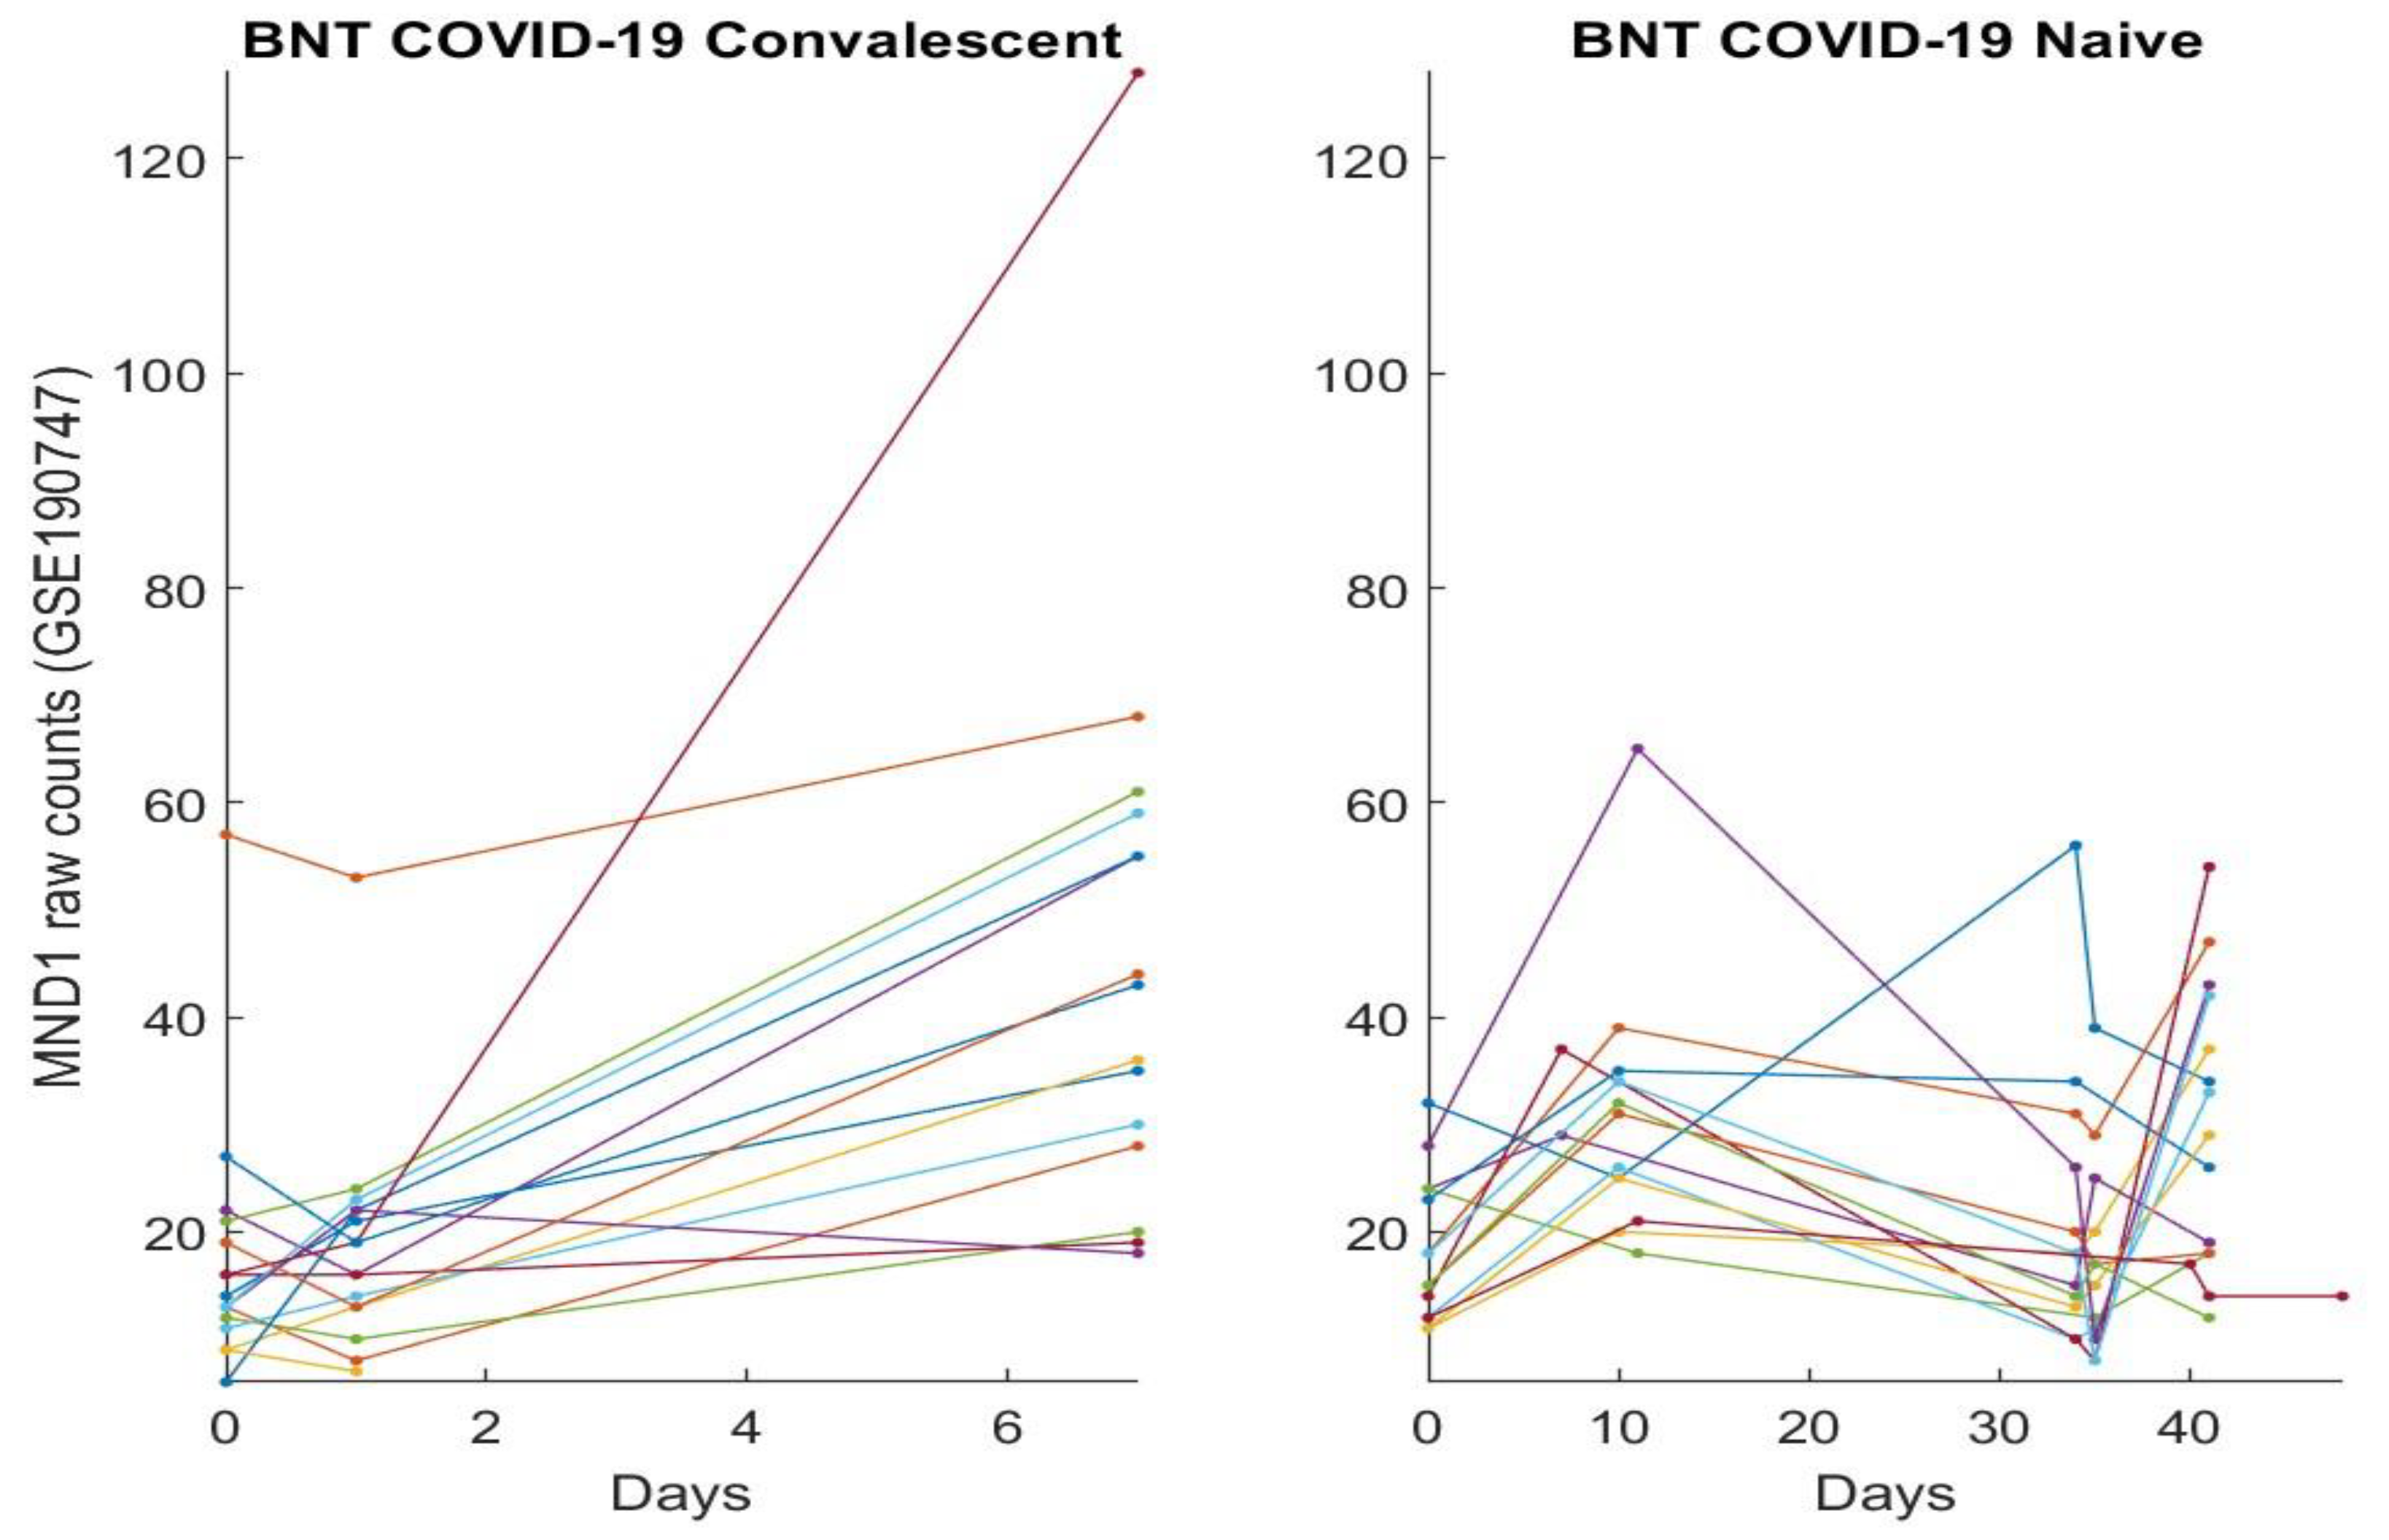
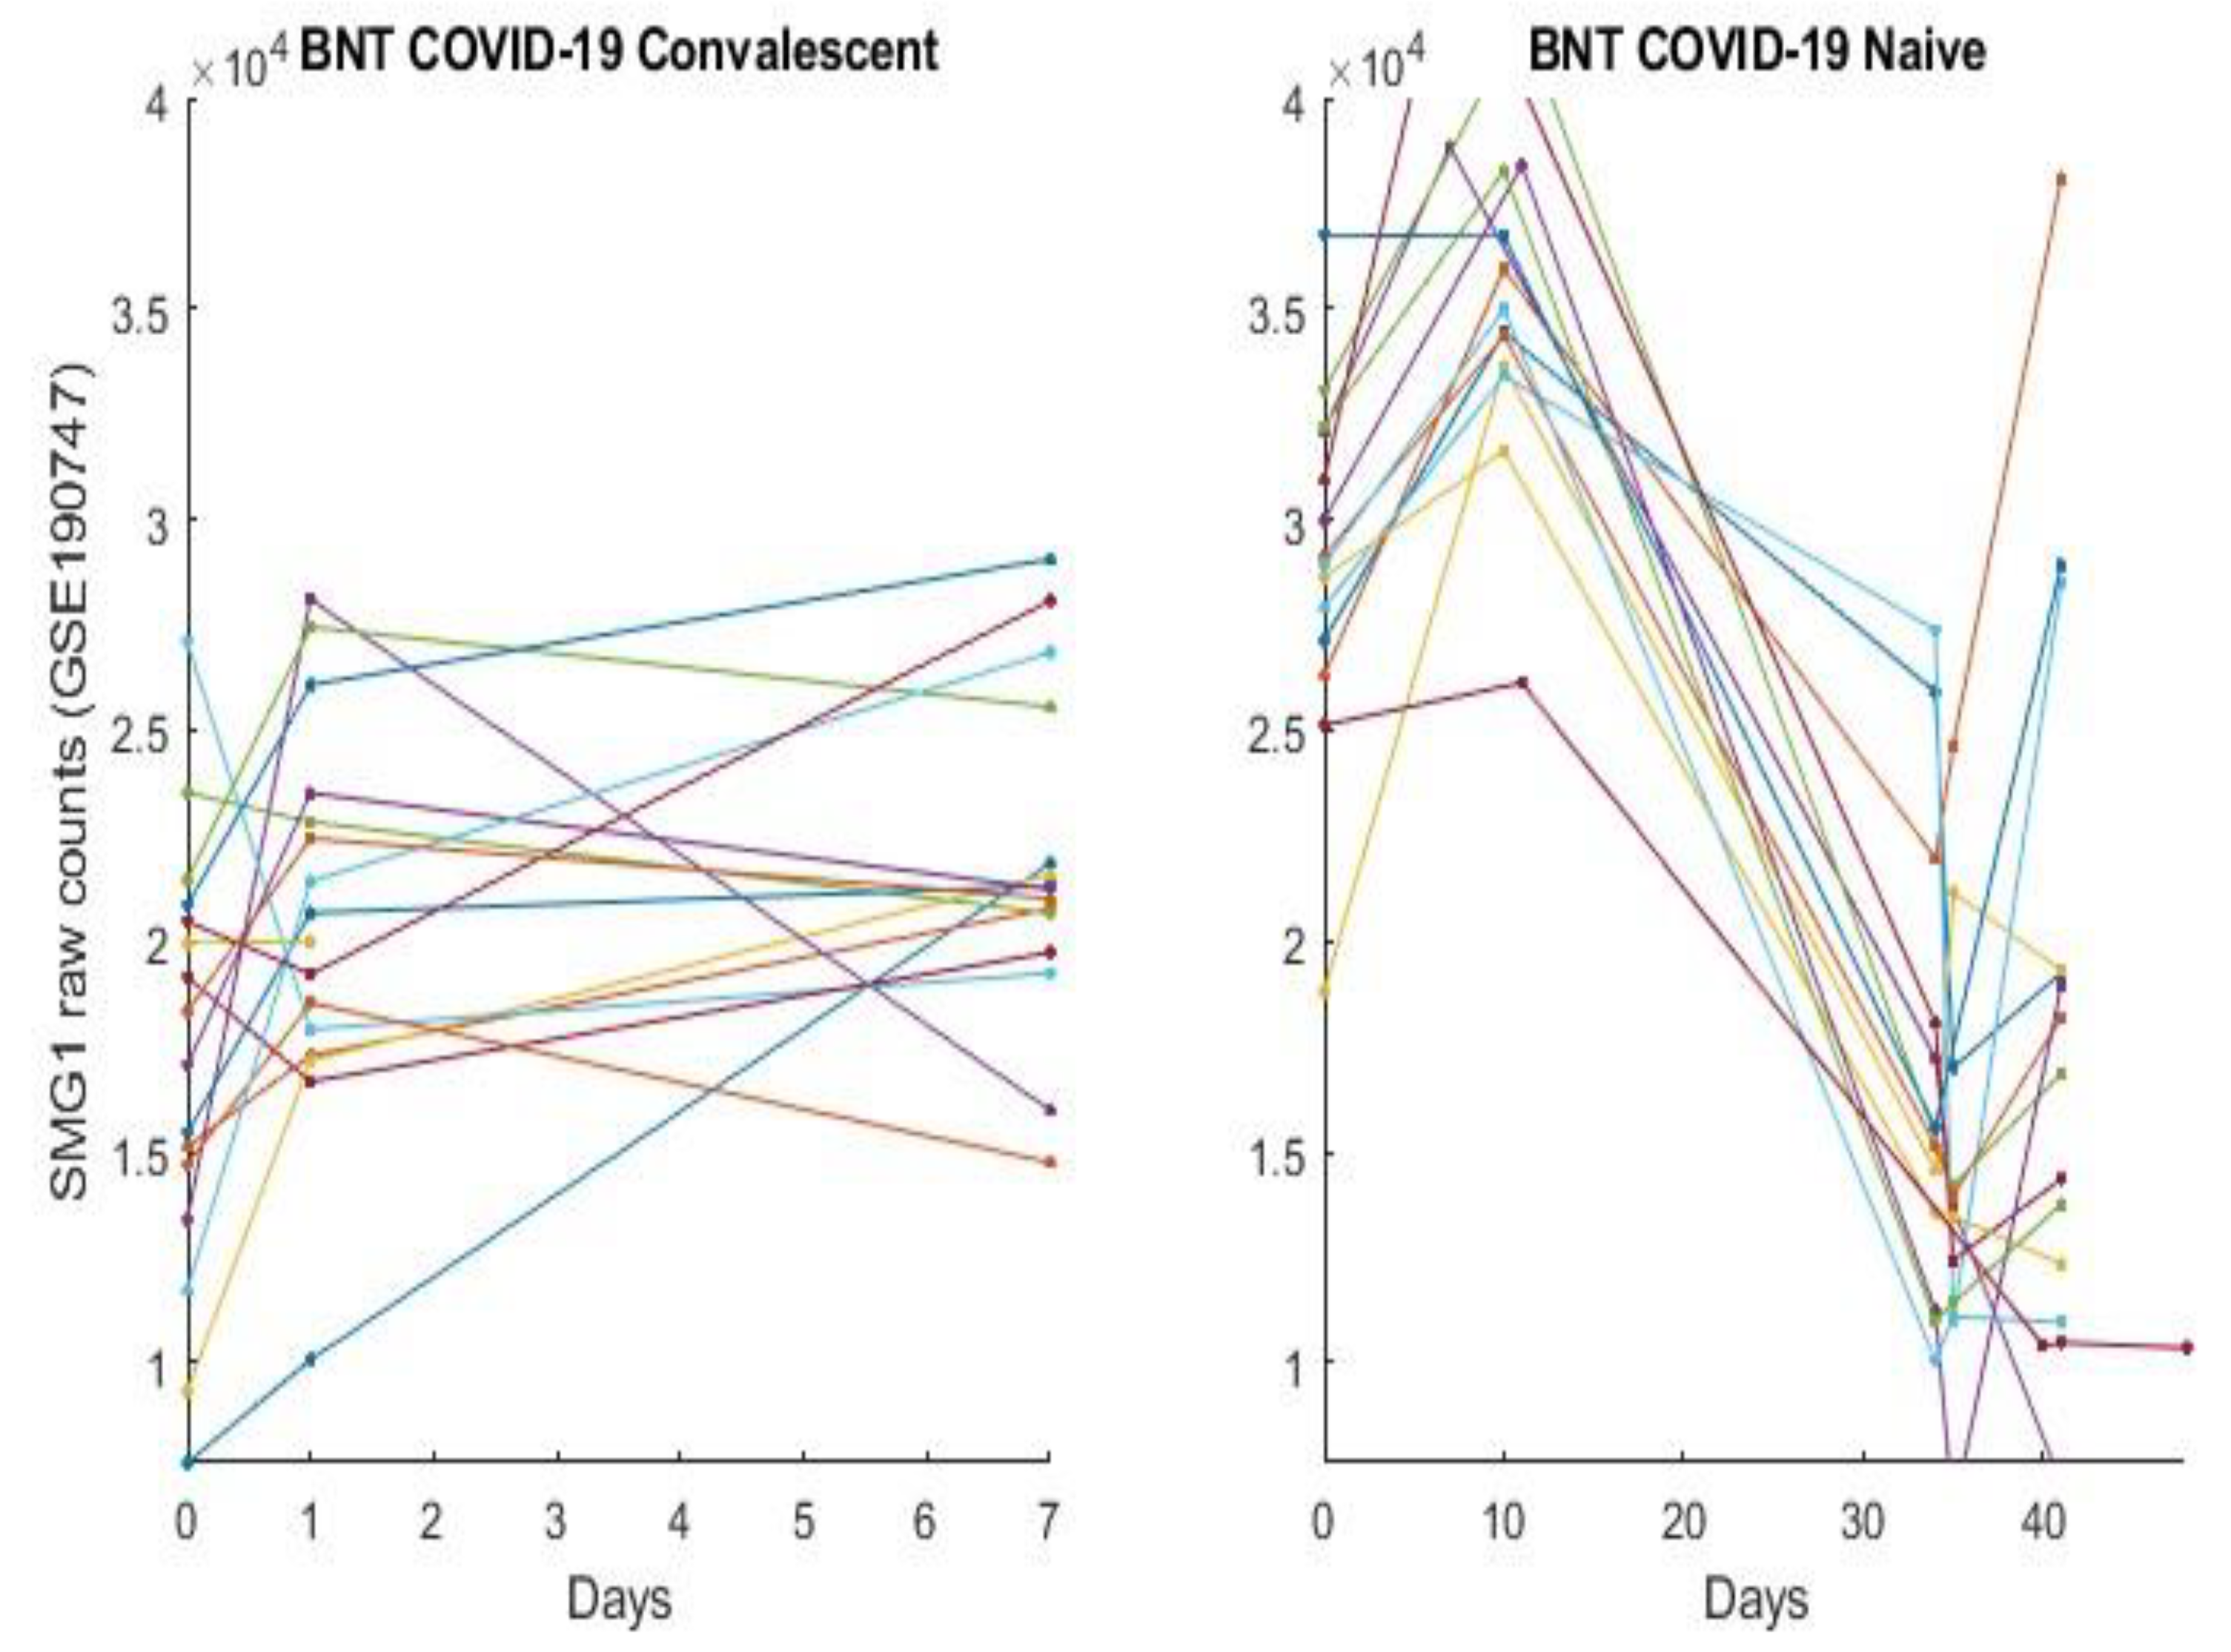
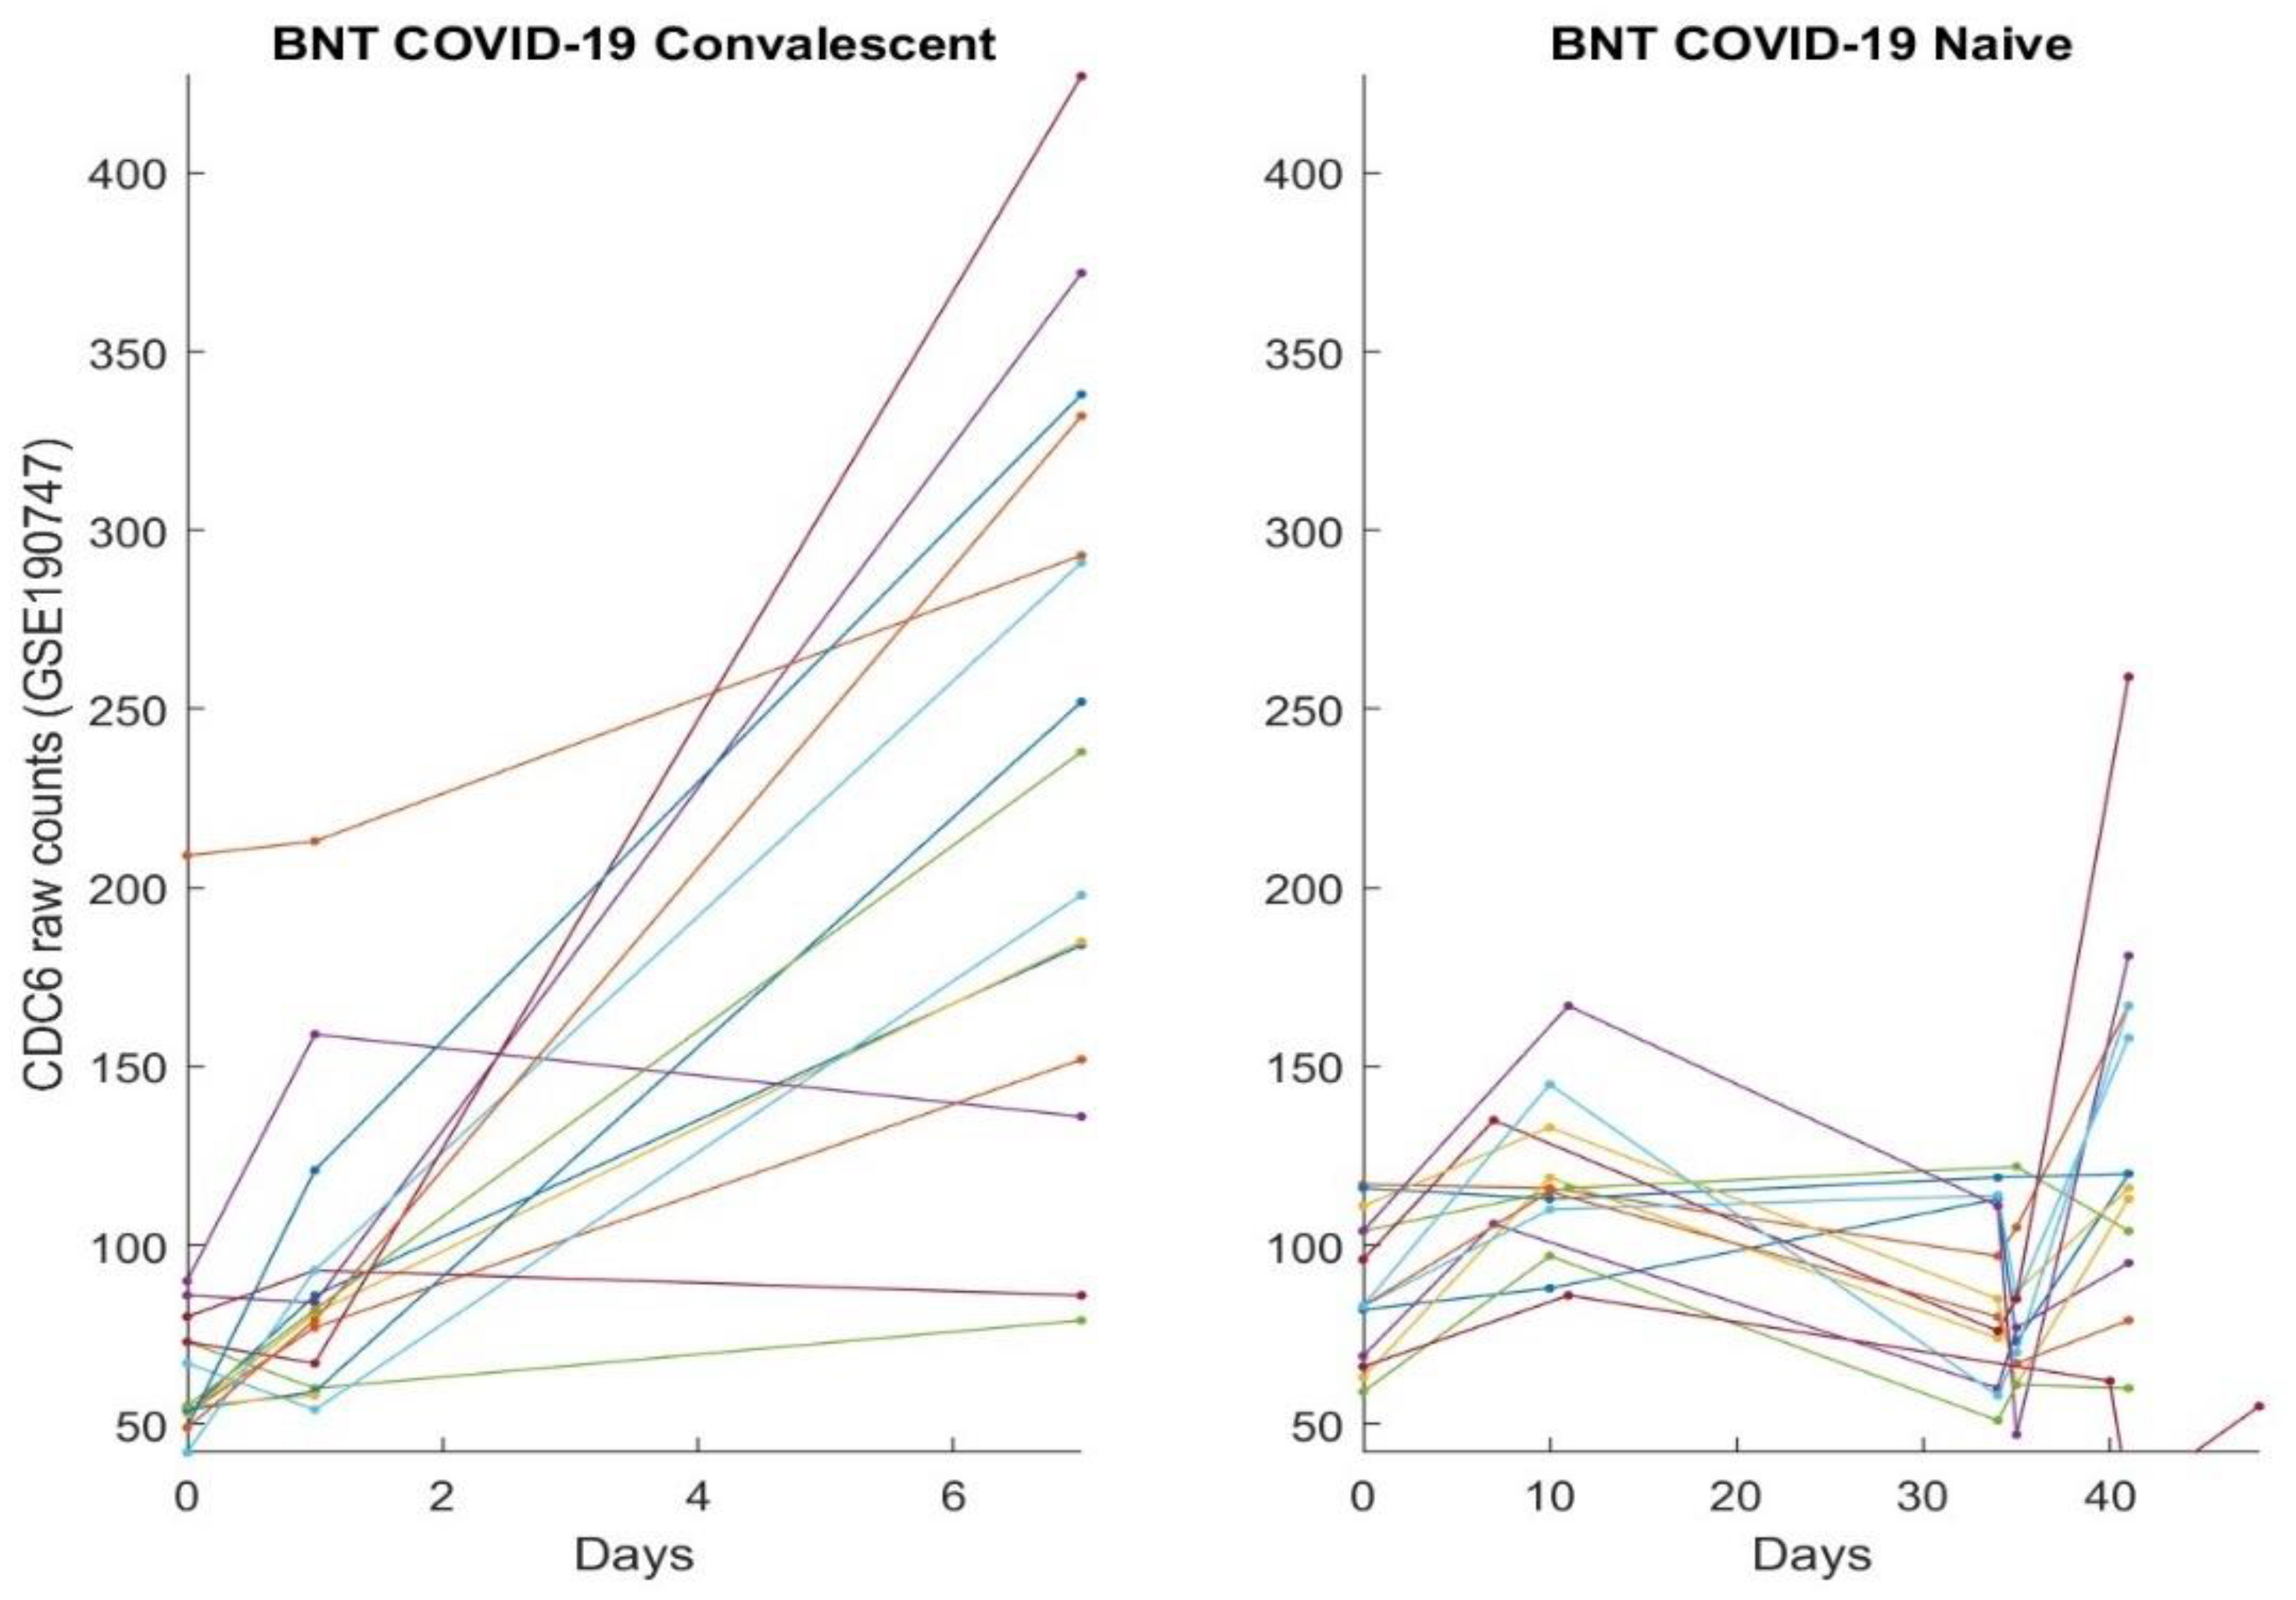
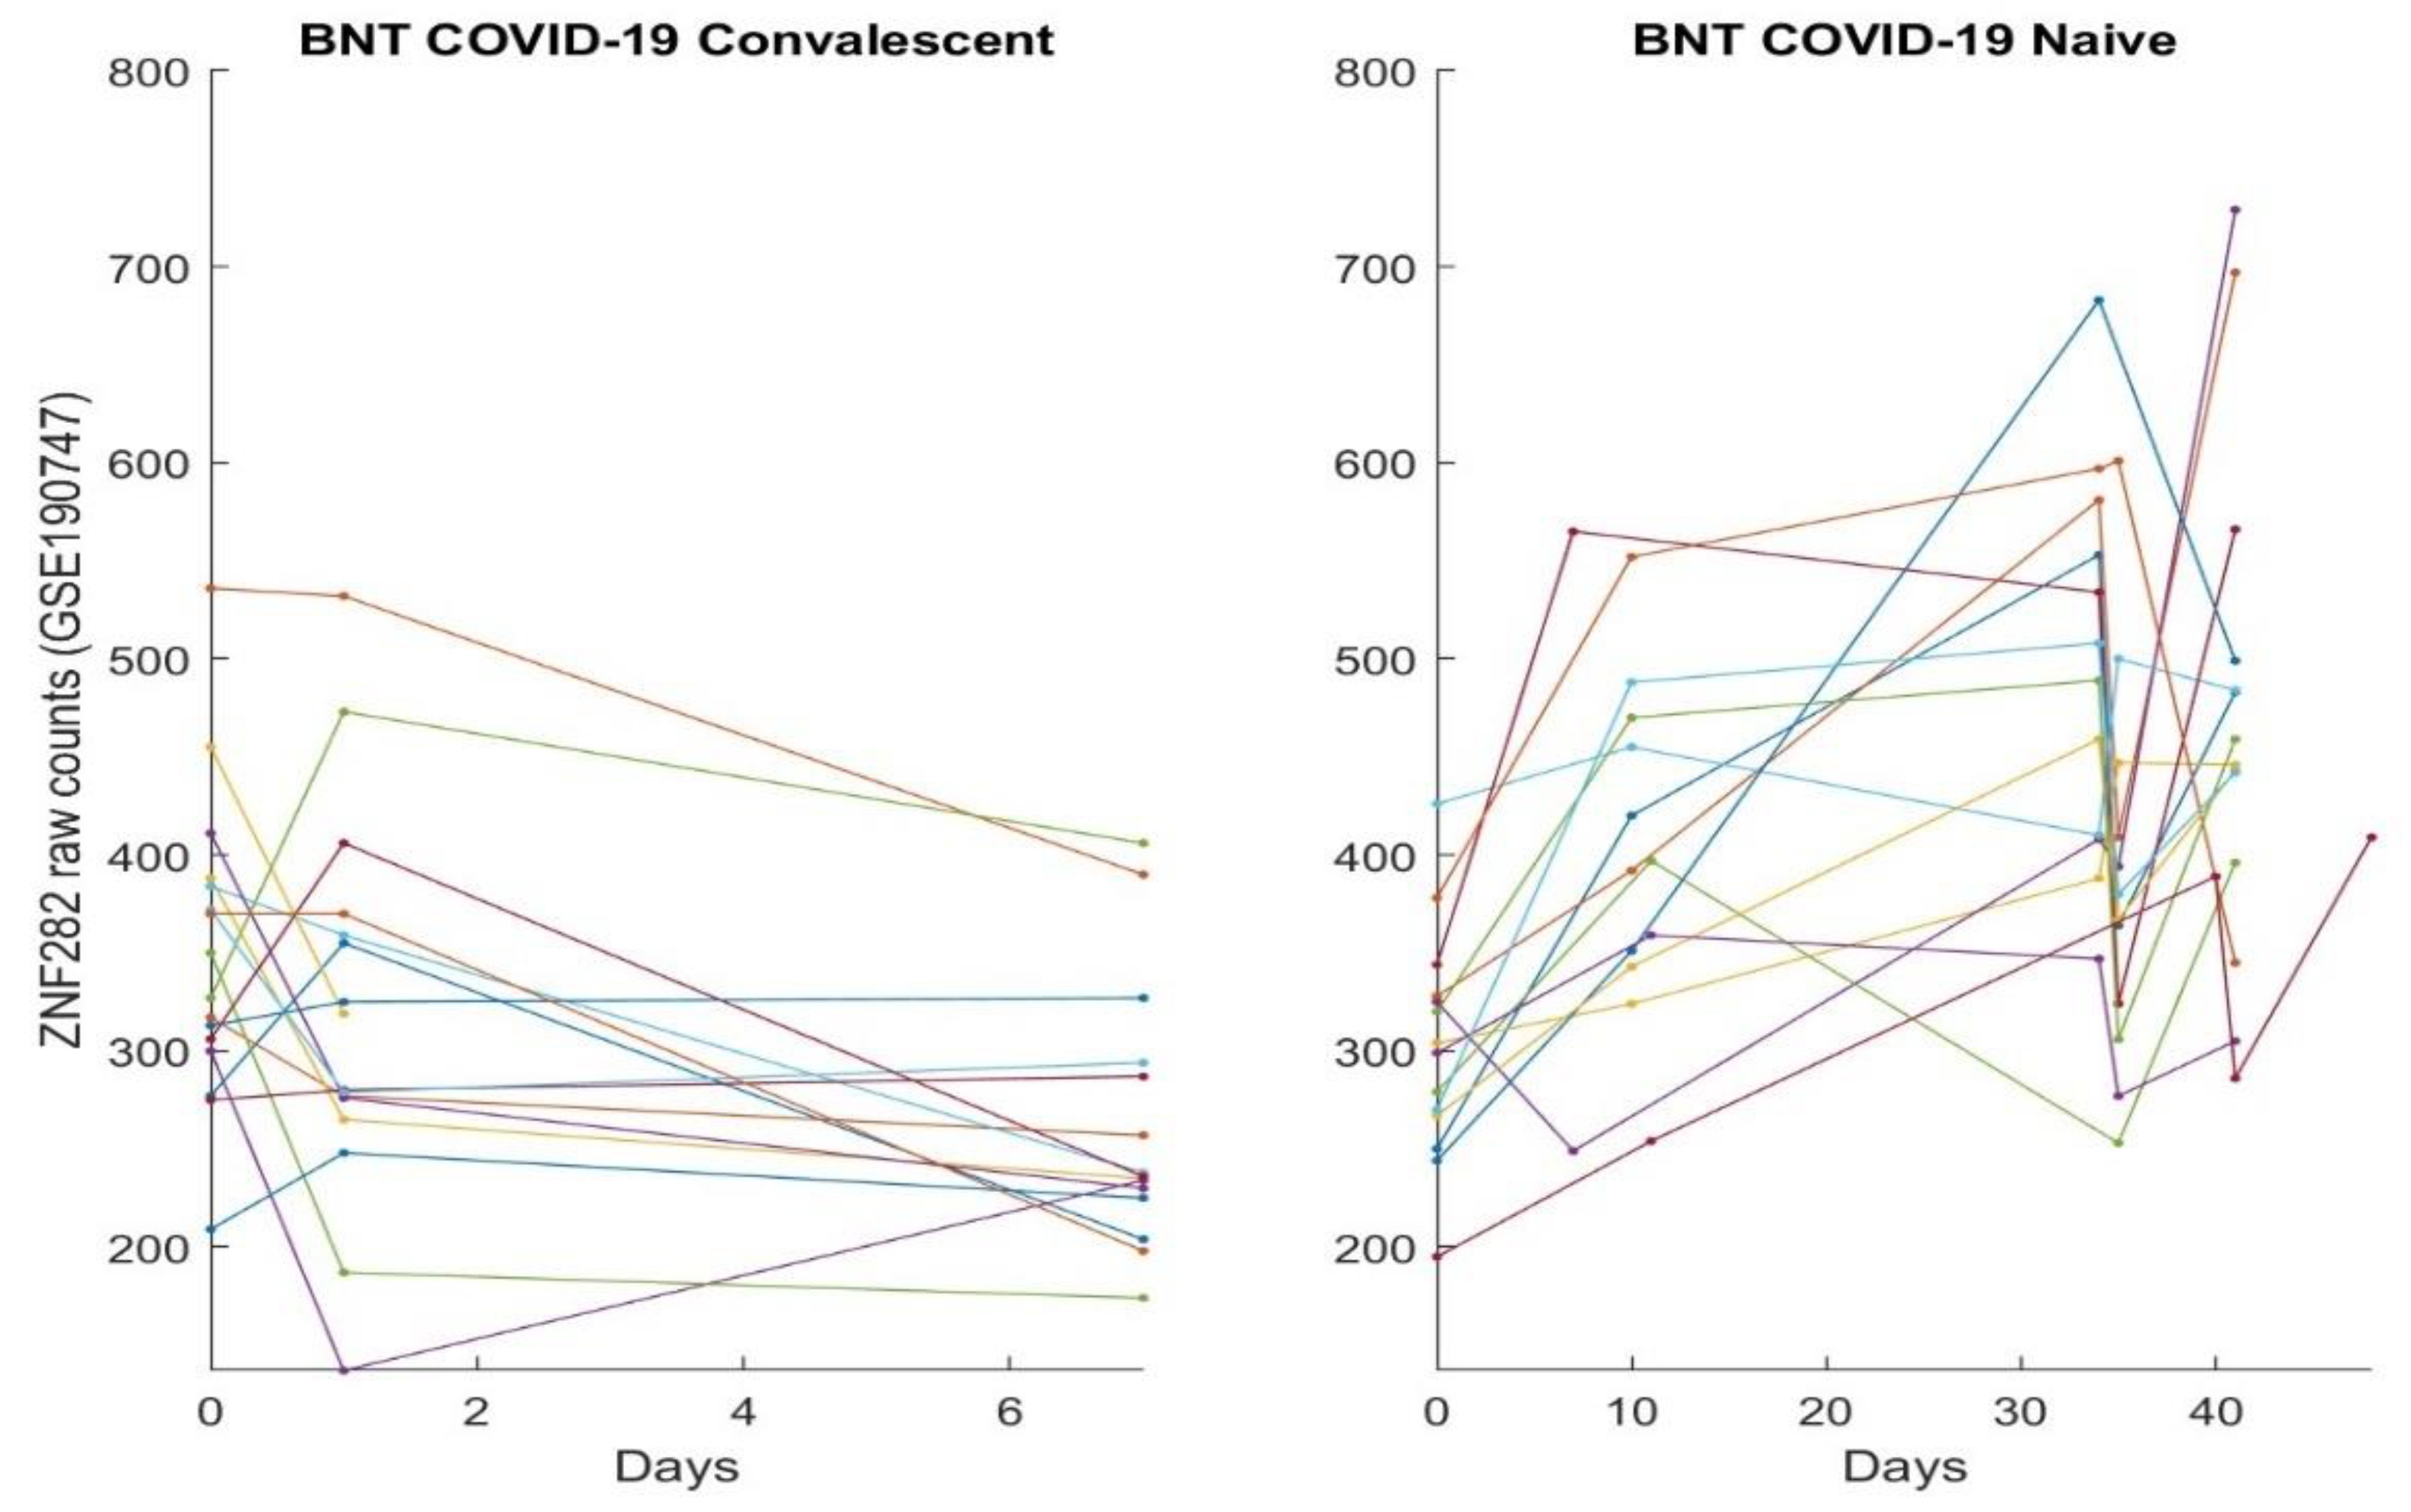
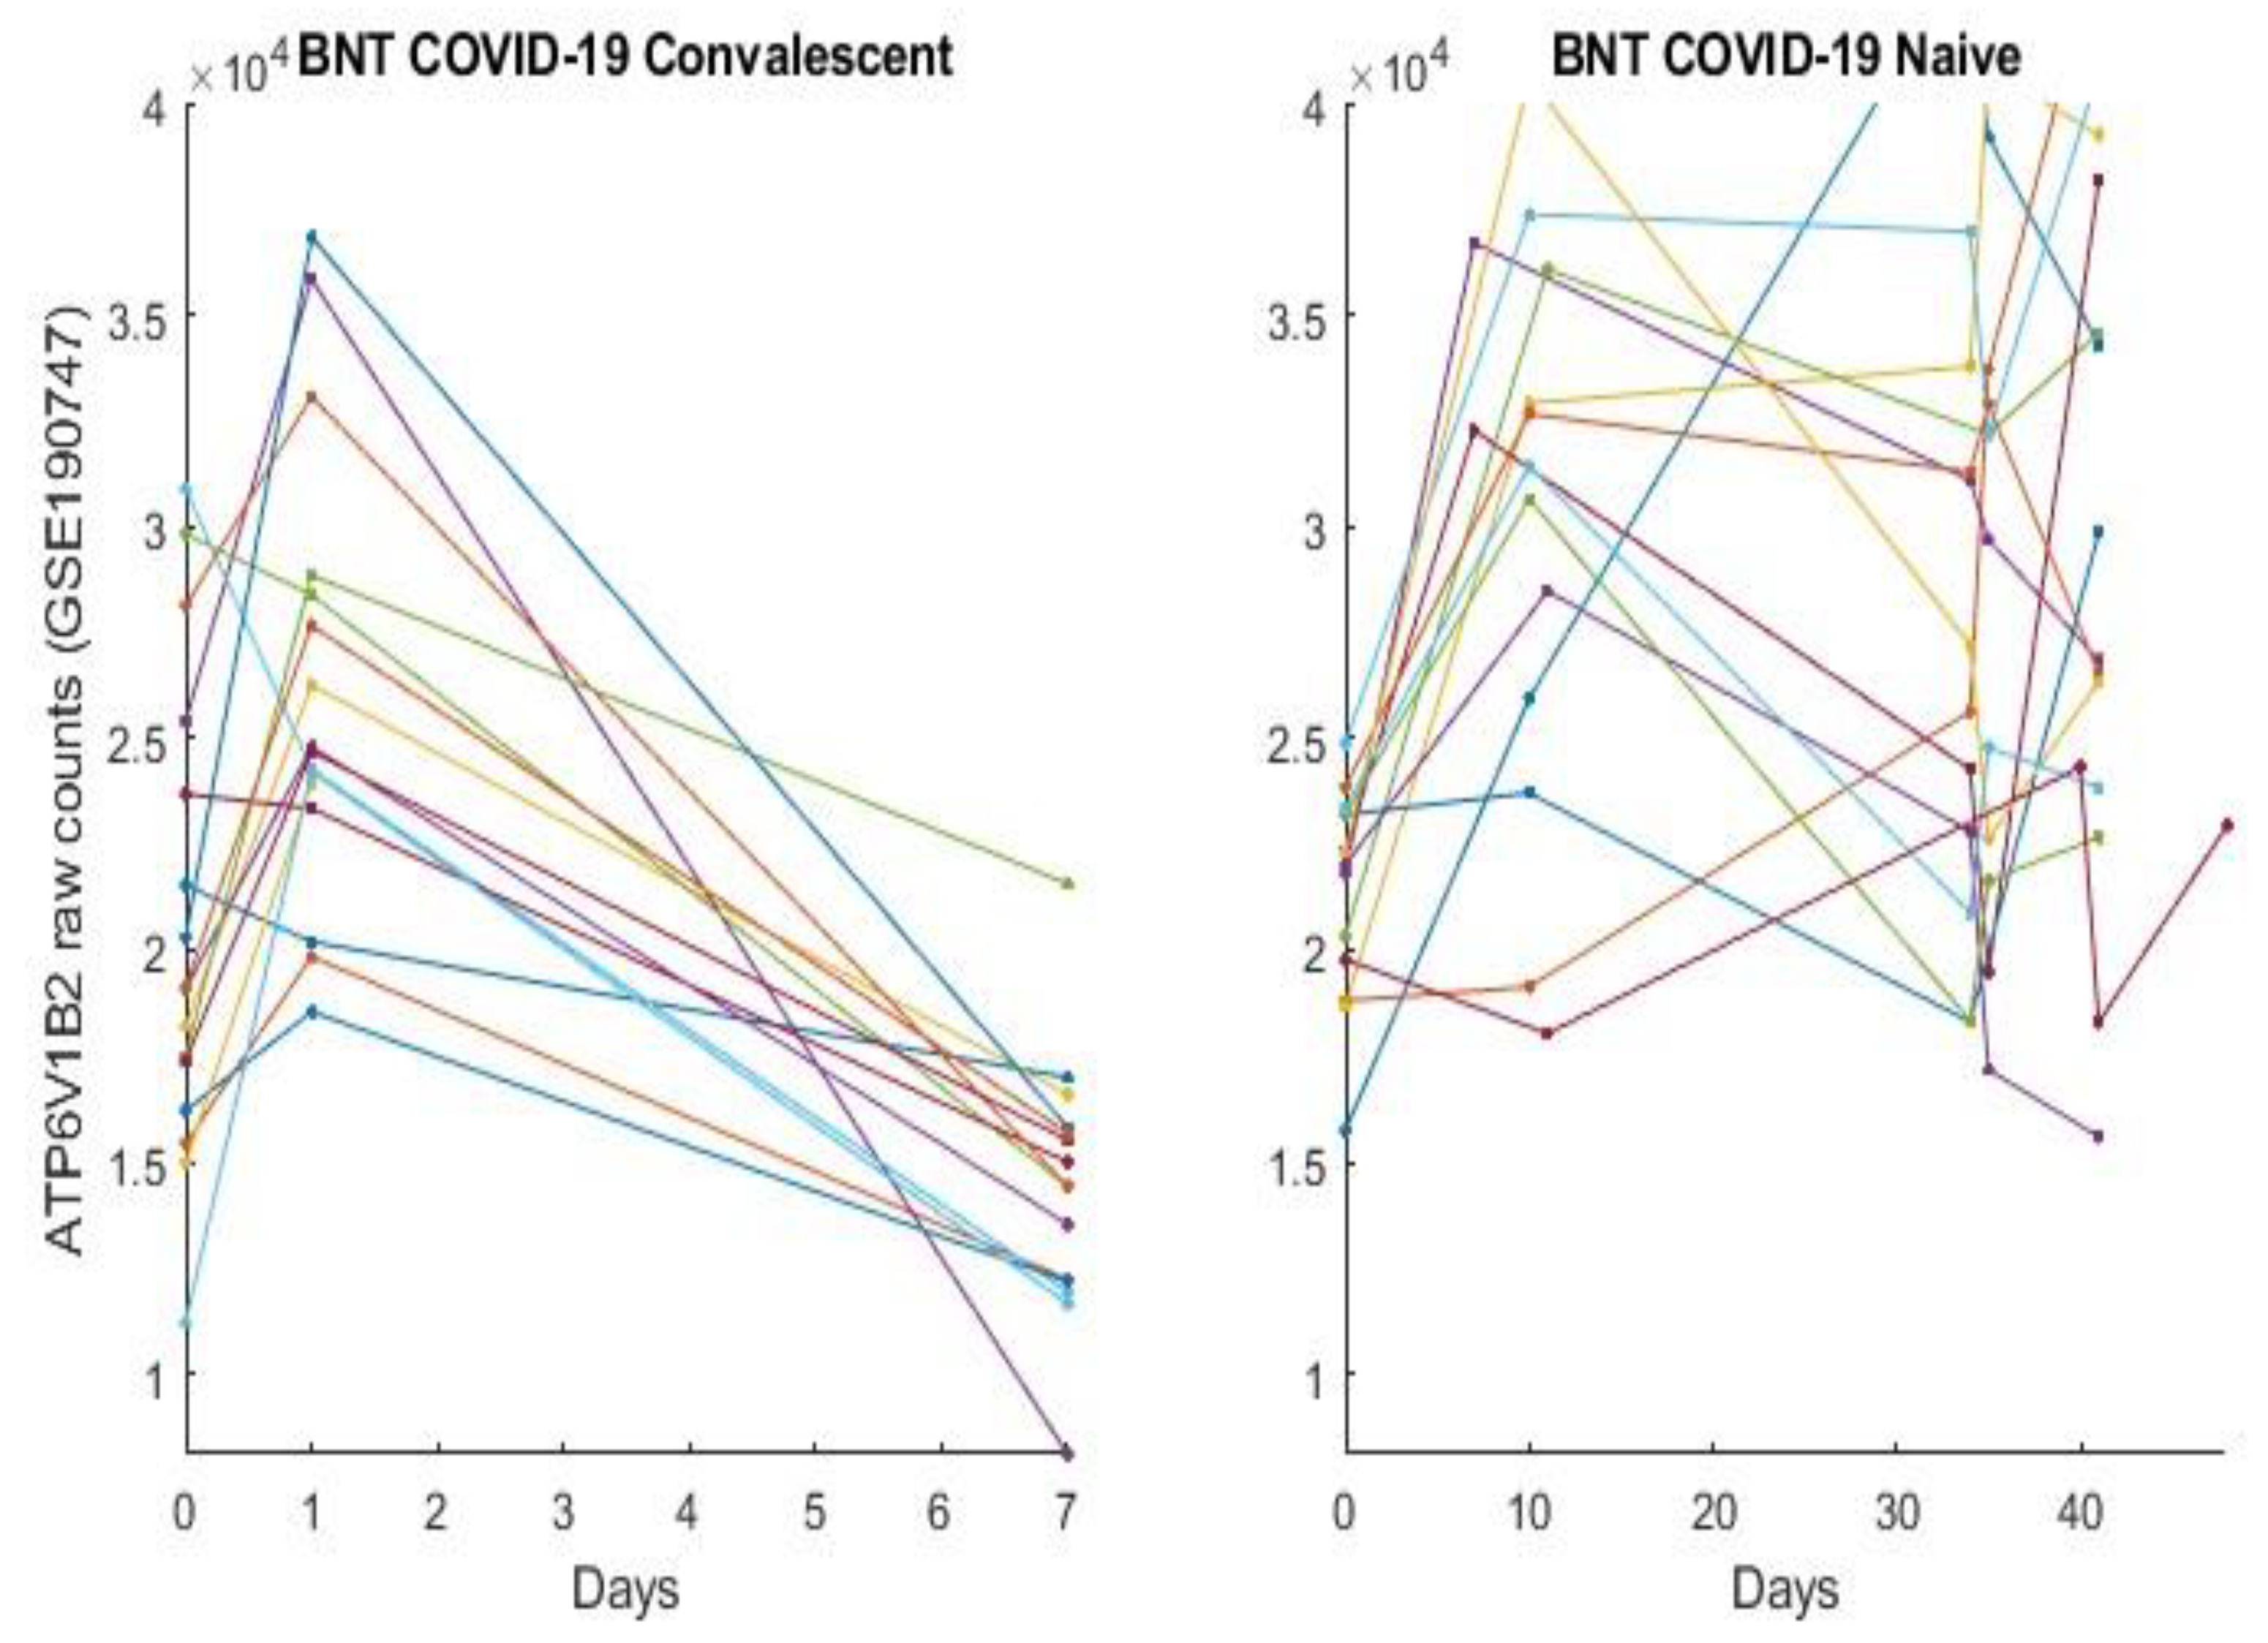
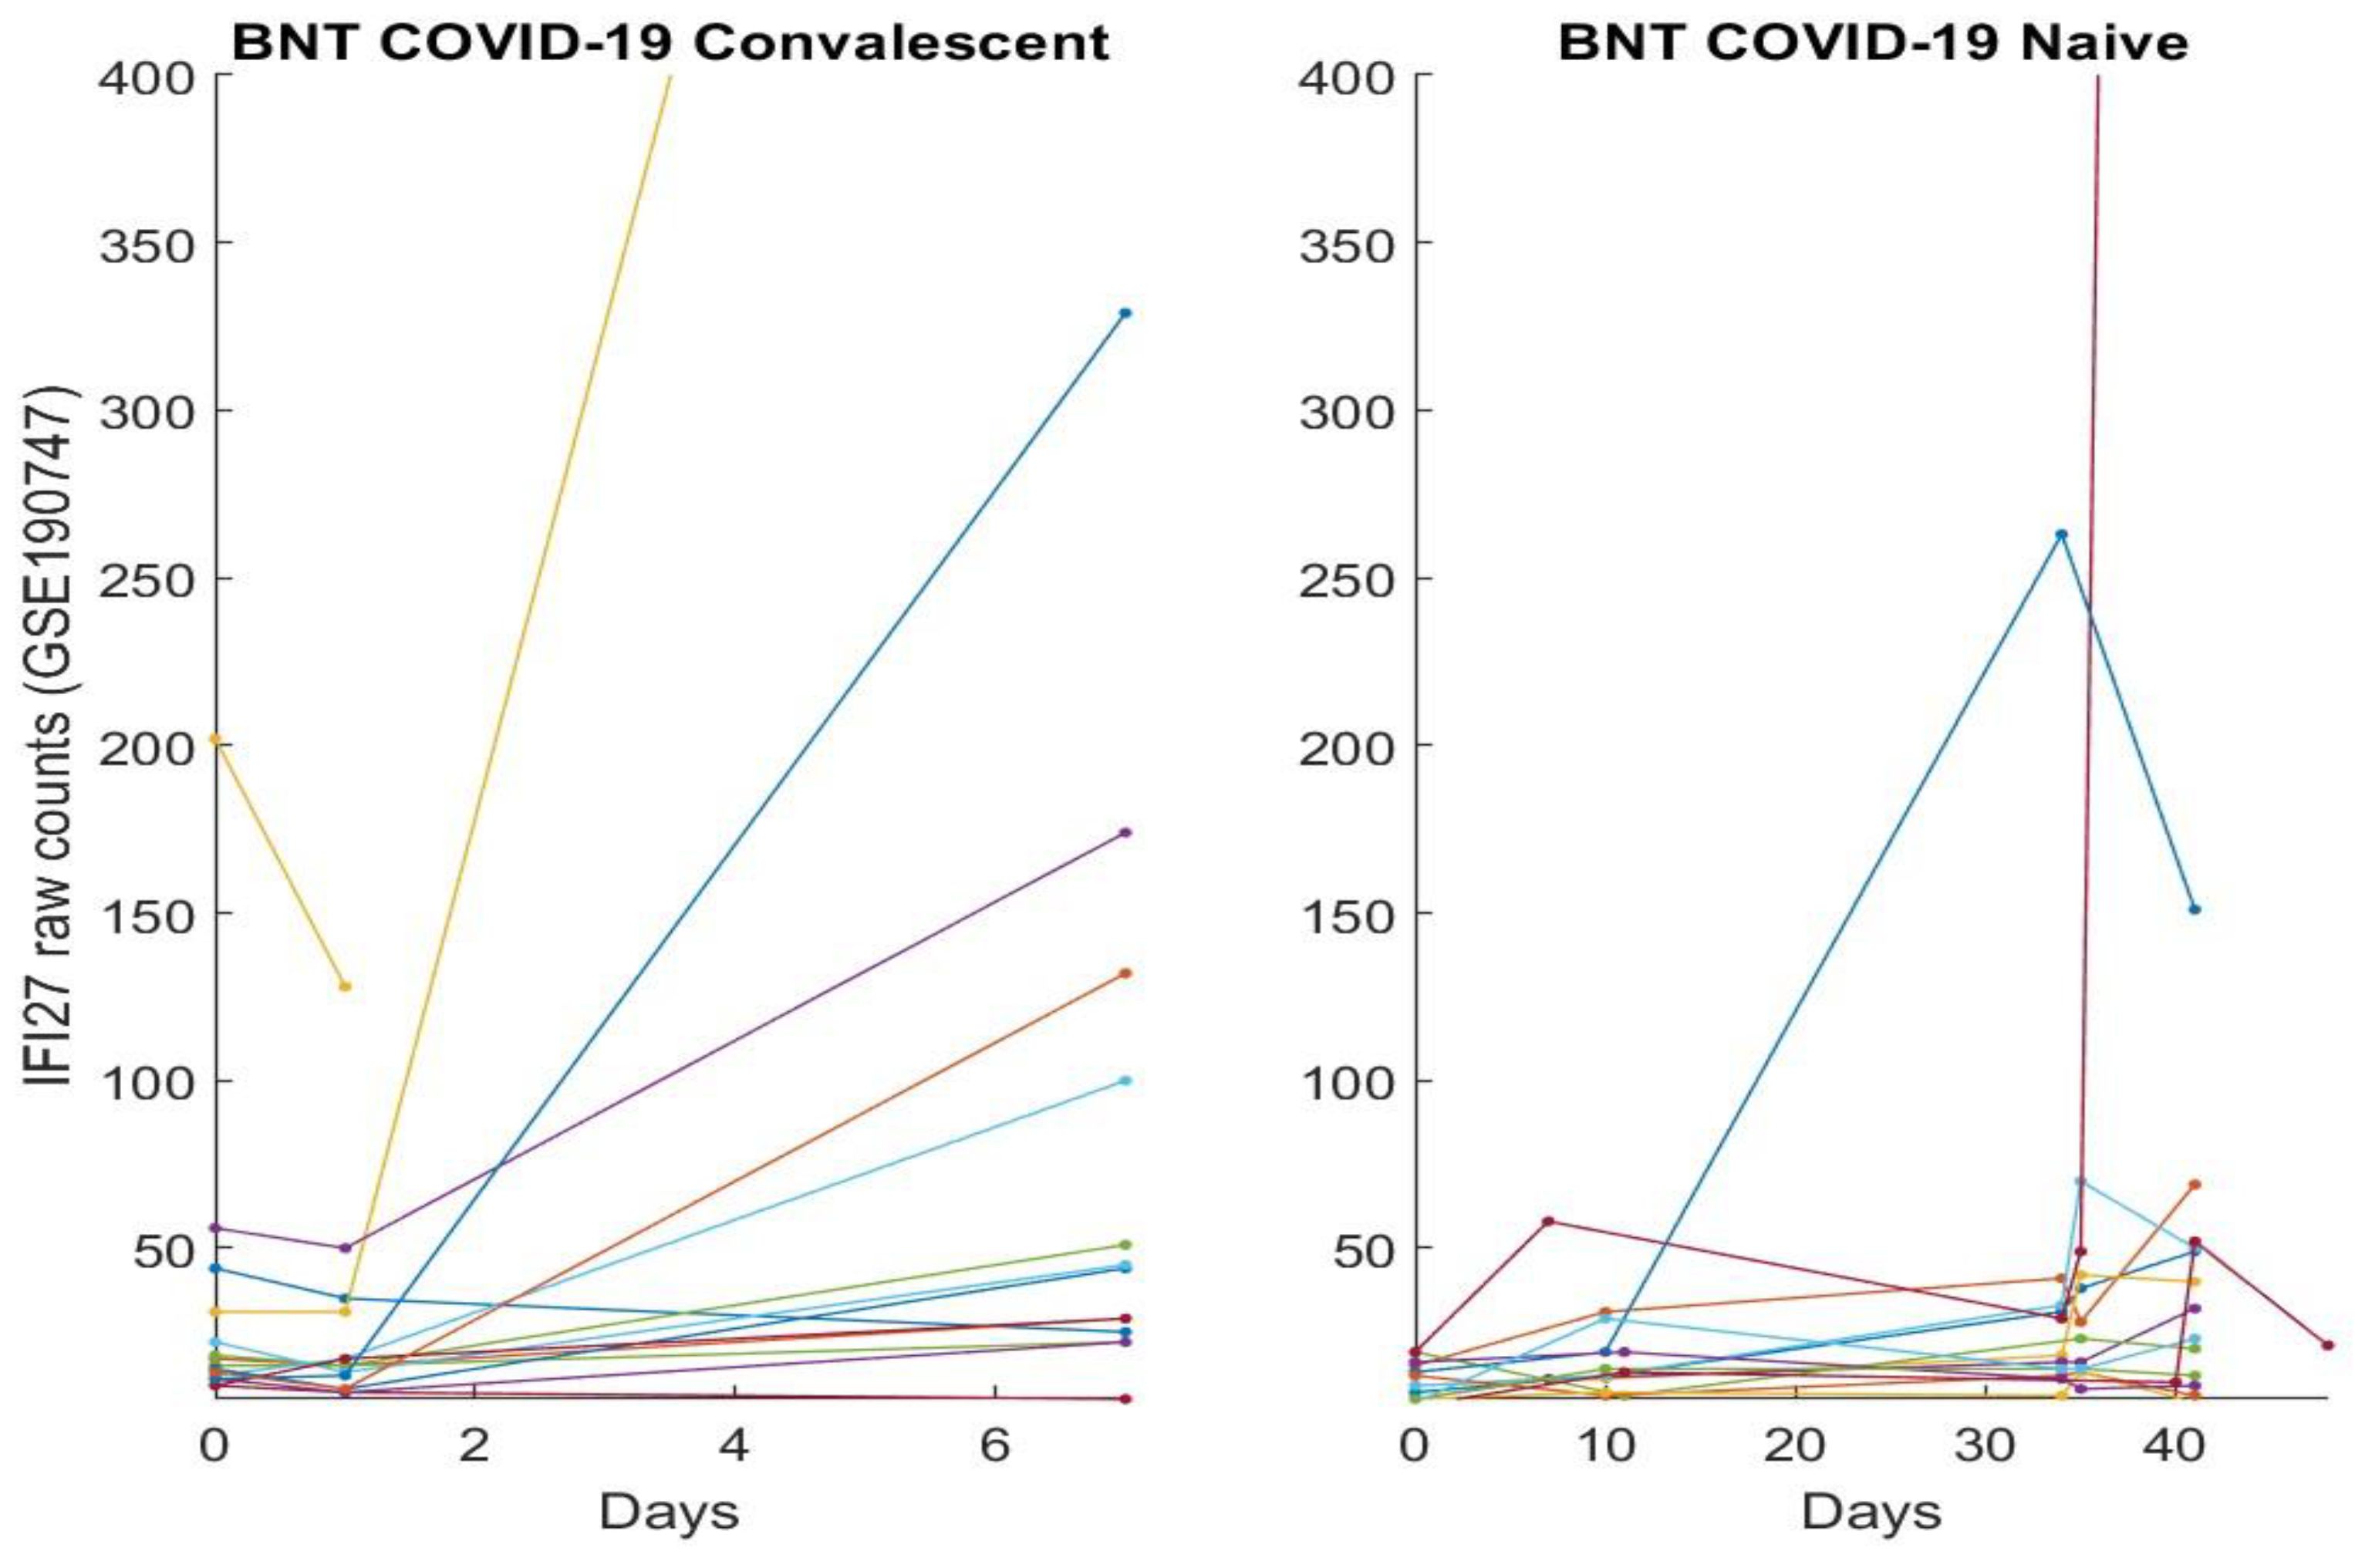
3.2. The Clinic Evidence Directly Observed Using Graphical Approach and Results
3.3. Separability between COVID-19-Naïve Individuals and COVID-19-Convalescent Octogenarians Using the High-Performance Biomarkers
4. Discussions
Supplementary Materials
Funding
Institutional Review Board Statement
Informed Consent Statement
Data Availability Statement
Acknowledgments
Conflicts of Interest
Limitation Statements
References
- Wang, Q.; Guo, Y.; Iketani, S.; Nair, M.S.; Li, Z.; Mohri, H.; Wang, M.; Yu, J.; Bowen, A.D.; Chang, J.Y.; et al. Antibody evasion by SARS-CoV-2 Omicron subvariants BA.2.12.1, BA.4, & BA.5. Nature 2022, 608, 603–608. [Google Scholar] [CrossRef] [PubMed]
- Kumar, S.; Thambiraja, T.S.; Karuppanan, K.; Subramaniam, G. Omicron and Delta variant of SARS-CoV-2: A comparative computational study of spike protein. J. Med. Virol. 2022, 94, 1641–1649. [Google Scholar] [CrossRef] [PubMed]
- Reynolds, C.J.; Pade, C.; Gibbons, J.M.; Otter, A.D.; Lin, K.-M.; Sandoval, D.M.; Pieper, F.P.; Butler, D.K.; Liu, S.; Joy, G.; et al. Immune boosting by B.1.1.529 (Omicron) depends on previous SARS-CoV-2 exposure. Science 2022, 377, eabq1841. [Google Scholar] [CrossRef] [PubMed]
- Callaway, E. The quest to find genes that drive severe covid. Nature 2021, 595, 346–348. [Google Scholar] [CrossRef] [PubMed]
- COVID-19 Host Genetics Initiative. Mapping the human genetic architecture of COVID-19. Nature 2021, 600, 474–477. [Google Scholar] [CrossRef]
- Pairo-Castineira, E.; Clohisey, S.; Klaric, L.; Bretherick, A.D.; Rawlik, K.; Pasko, D.; Walker, S.; Parkinson, N.; Fourman, M.H.; Russell, C.D.; et al. Genetic mechanisms of critical illness in COVID-19. Nature 2021, 591, 92–98. [Google Scholar] [CrossRef] [PubMed]
- The RECOVERY Collaborative Group. Dexamethasone in hospitalized patients with COVID-19. N. Engl. J. Med. 2021, 384, 693–704. [Google Scholar] [CrossRef] [PubMed]
- Dite, G.S.; Murphy, N.M.; Allman, R. Development and validation of a clinical and genetic model for predicting risk of severe COVID-19. Epidemiol. Infect. 2021, 149, e162. [Google Scholar] [CrossRef] [PubMed]
- Zhang, Q.; Bastard, P.; Liu, Z.; Le Pen, J.; Moncada-Velez, M.; Chen, J.; Ogishi, M.; Sabli, I.K.D.; Hodeib, S.; Korol, C.; et al. Inborn errors of type i ifn immunity in patients with life-threatening COVID-19. Science 2020, 370, eabd4570. [Google Scholar] [CrossRef]
- Bastard, P.; Rosen, L.B.; Zhang, Q.; Michailidis, E.; Hoffmann, H.-H.; Zhang, Y.; Dorgham, K.; Philippot, Q.; Rosain, J.; Béziat, V.; et al. Autoantibodies against type i ifns in patients with life-threatening COVID-19. Science 2020, 370, eabd4585. [Google Scholar] [CrossRef] [PubMed]
- Povysil, G.; Butler-Laporte, G.; Shang, N.; Weng, C.; Khan, A.; Alaamery, M.; Nakanishi, T.; Zhou, S.; Forgetta, V.; Kiryluk, K.; et al. Failure to replicate the association of rare loss-of-function variants in type IIFN immunity genes with severe COVID-19. medRxiv. 2020. Available online: https://www.medrxiv.org/content/early/2020/12/21/2020.12.18.20248226 (accessed on 21 December 2020). [CrossRef]
- Kosmicki, J.A.; Horowitz, J.E.; Banerjee, N.; Lanche, R.; Marcketta, A.; Maxwell, E.; Bai, X.; Sun, D.; Backman, J.D.; Ferreira, M.; et al. Genetic association analysis of SARS-CoV-2 infection in 455,838 UK biobank participants. medRxiv 2020. Available online: https://www.medrxiv.org/content/early/2020/11/03/2020.10.28.2022180420248226 (accessed on 3 November 2020). [CrossRef]
- Fallerini, C.; Daga, S.; Mantovani, S.; Benetti, E.; Picchiotti, N.; Francisci, D.; Paciosi, F.; Schiaroli, E.; Baldassarri, M.; Fava, F.; et al. Association of toll-like receptor 7 variants with life-threatening COVID-19 disease in males: Findings from a nested case-control study. eLife 2021, 10, e67569. [Google Scholar] [CrossRef] [PubMed]
- Rhea, E.M.; Logsdon, A.F.; Hansen, K.M.; Williams, L.M.; Reed, M.J.; Baumann, K.K.; Holden, S.J.; Raber, J.; Banks, W.A.; Erickson, M.A. The S1 protein of SARS-CoV-2 crosses the blood–brain barrier in mice. Nat. Neurosci. 2021, 24, 368–378. [Google Scholar] [CrossRef] [PubMed]
- Rowland, C. Doctors and Nurses Want More Data before Championing Vaccines to End the Pandemic: Health Systems Are Launching Bids to Assure Their Medical Workers that Vaccines Will Be Safe and Effective. CNN. p. 21. Available online: https://www.washingtonpost.com/business/2020/11/21/vaccines-advocates-nurses-doctorscoronavirus/ (accessed on 21 November 2020).
- COVID-19 Vaccines Complicate Mammograms. Cancer Discov. 2021, 11, 1868. Available online: https://cancerdiscovery.aacrjournals.org/content/11/8/1868.1 (accessed on 1 August 2021). [CrossRef] [PubMed]
- Becker, J.H.; Lin, J.J.; Doernberg, M.; Stone, K.; Navis, A.; Festa, J.R.; Wisnivesky, J.P. Assessment of Cognitive Function in Patients After COVID-19 Infection. JAMA Netw. Open 2021, 4, e2130645. [Google Scholar] [CrossRef]
- Chertow, D.; Stein, S.; Ramelli, S.; Grazioli, A.; Chung, J.Y.; Singh, M.; Yinda, C.K.; Winkler, C.; Dickey, J.; Kleiner, D.; et al. SARS-CoV-2 infection and persistence throughout the human body and brain. Res. Sq. 2021. [Google Scholar] [CrossRef]
- Lin, D.-Y.; Gu, Y.; Wheeler, B.; Young, H.; Holloway, S.; Sunny, S.-K.; Moore, Z.; Zeng, D. Effectiveness of COVID-19 Vaccines over a 9-Month Period in North Carolina. N. Engl. J. Med. 2022, 386, 933–941. [Google Scholar] [CrossRef] [PubMed]
- Thorne, L.G.; Bouhaddou, M.; Reuschl, A.-K.; Zuliani-Alvarez, L.; Polacco, B.; Pelin, A.; Batra, J.; Whelan, M.V.X.; Hosmillo, M.; Fossati, A.; et al. Evolution of enhanced innate immune evasion by SARS-CoV-2. Nature 2022, 602, 487–495. [Google Scholar] [CrossRef]
- Uraki, R.; Kiso, M.; Iida, S.; Imai, M.; Takashita, E.; Kuroda, M.; Halfmann, P.J.; Loeber, S.; Maemura, T.; Yamayoshi, S.; et al. Characterization and antiviral susceptibility of SARS-CoV-2 Omicron BA.2. Nature 2022, 607, 119–127. [Google Scholar] [CrossRef]
- Khan, K.; Karim, F.; Ganga, Y.; Bernstein, M.; Jule, Z.; Reedoy, K.; Cele, S.; Lustig, G.; Amoako, D.; Sigal, A.; et al. Omicron BA.4/BA.5 escape neutralizing immunity elicited by BA.1 infection. Nat. Commun. 2022, 13, 4686. [Google Scholar] [CrossRef]
- Li, D.; Edwards, R.J.; Manne, K.; Martinez, D.R.; Schäfer, A.; Alam, S.M.; Wiehe, K.; Lu, X.; Parks, R.; Sutherland, L.L.; et al. In vitro and in vivo functions of SARS-CoV-2 infection- enhancing and neutralizing antibodies. Cell 2021, 184, 4203–4219.e32. [Google Scholar] [CrossRef] [PubMed]
- Yahi, N.; Chahinian, H.; Fantini, J. Infection-enhancing anti-SARS-CoV-2 antibodies recognize both the original Wuhan/D614G strain and Delta variants. A potential risk for mass vaccination? J. Infect. 2021, 83, 619–620. [Google Scholar] [CrossRef] [PubMed]
- Zhang, Z. Five critical genes related to seven COVID-19 subtypes: A data science discovery. J. Data Sci. 2021, 19, 142–150. [Google Scholar] [CrossRef]
- Zhang, Z. The existence of at least three genomic signature patterns and at least seven subtypes of COVID-19 and the end of the disease. Vaccines 2022, 10, 761. [Google Scholar] [CrossRef] [PubMed]
- Zhang, Z. Genomic Biomarker Heterogeneities Between SARS-CoV-2 and COVID-19. Vaccines 2022, 10, 1657. [Google Scholar] [CrossRef]
- Zhang, Z. Lift the veil of breast cancers using 4 or fewer critical genes. Cancer Inform. 2022, 21, 1–11. [Google Scholar] [CrossRef]
- Zhang, Z. Functional effects of four or fewer critical genes linked to lung cancers and new sub-types detected by a new machine learning classifier. J. Clin. Trials 2021, 11, S14:100001. Available online: https://www.longdom.org/open-access/functional-effects-of-four-or-fewer-critical-genes-linked-to-lung-cancers-and-new-subtypes-detected-by-a-new-machine-learning-clas-88321.html (accessed on 30 November 2021).
- Zhang, Z.; Xu, Y.; Li, X.; Chen, M.; Wang, X.; Zhang, N.; Liu, Y. PSMC2 and CXCL8-Modulated Four Critical Gene-Based High-Performance Biomarkers for Colorectal Cancers. 2022; submitted. [Google Scholar]
- Liu, Y.; Zhang, H.; Xu, Y.; Liu, Y.Z.; Yeh, M.M.; Zhang, Z. The Interaction Effects of GMNN and CXCL12 Built in Five Critical Gene-based High-Performance Biomarkers for Hepatocellular Carcinoma. 2022; submitted. [Google Scholar]
- Lee, H.K.; Knabl, L.; Moliva, J.I.; Werner, A.P.; Boyoglu-Barnum, S.; Kapferer, S.; Pateter, B.; Walter, M.; Sullivan, N.J.; Furth, P.A.; et al. mRNA vaccination in octogenarians 15 and 20 months after recovery from COVID-19 elicits robust immune and antibody responses that include Omicron. Cell Rep. 2022, 39, 110680. [Google Scholar] [CrossRef]
- Overmyer, K.A.; Shishkova, E.; Miller, I.J.; Balnis, J.; Bernstein, M.N.; Peters-Clarke, T.M.; Meyer, J.G.; Quan, Q.; Muehlbauer, L.K.; Trujillo, E.A.; et al. Large-scale multi-omic analysis of COVID-19 severity. Cell Syst. 2020, 12, 23–40.e7. [Google Scholar] [CrossRef]
- Arunachalam, P.S.; Wimmers, F.; Mok, C.K.P.; Perera, R.A.P.M.; Scott, M.; Hagan, T.; Sigal, N.; Feng, Y.; Bristow, L.; Tsang, O.T.-Y.; et al. Systems biological assessment of immunity to mild versus severe COVID-19 infection in humans. Science 2020, 369, 1210–1220. [Google Scholar] [CrossRef]
- Mick, E.; Kamm, J.; Pisco, A.O.; Ratnasiri, K.; Babik, J.M.; Castañeda, G.; DeRisi, J.L.; Detweiler, A.M.; Hao, S.L.; Kangelaris, K.N.; et al. Upper airway gene expression reveals suppressed immune responses to SARS-CoV-2 compared with other respiratory viruses. Nat. Commun. 2020, 11, 5854. [Google Scholar] [CrossRef] [PubMed]
- Lieberman, N.A.; Peddu, V.; Xie, H.; Shrestha, L.; Huang, M.L.; Mears, M.C.; Cajimat, M.N.; Bente, D.A.; Shi, P.Y.; Bovier, F.; et al. In vivo antiviral host transcriptional response to SARS-CoV-2 by viral load, sex, and age. PLoS Biol. 2020, 18, e3000849. [Google Scholar] [CrossRef] [PubMed]
- Lee, H.K.; Knabl, L.; Walter, M.; Knabl, S.L.; Dai, Y.; Füßl, M.; Caf, Y.; Jeller, C.; Knabl, P.; Hennighausen, L.; et al. Prior Vaccination Exceeds Prior Infection in Eliciting Innate and Humoral Immune Responses in Omicron Infected Outpatients. Front. Immunol. 2022, 13, 916686. [Google Scholar] [CrossRef] [PubMed]
- Klein, J.; Wood, J.; Jaycox, J.; Lu, P.; Dhodapkar, R.M.; Gehlhausen, J.R.; Tabachnikova, A.; Tabacof, A.; Malik, A.A.; Iwasaki, A.; et al. Distinguishing features of Long COVID identified through immune profiling. medRxiv 2022. [Google Scholar] [CrossRef]
- Couzin-Frankel, J. Blood Abnormalities Found in People with Long COVID Study: Implicates Lack of Key Hormone, Battle-weary Immune Cells, and Reawakened Viruses. Available online: https://www.science.org/content/article/blood-abnormalities-found-people-long-covid (accessed on 16 August 2022).


| Classifiers | Intercept | ABCB6 | KIAA1614 | MND1 | RIPK3 | SMG1 | Accuracy | Sensitivity | Specificity |
|---|---|---|---|---|---|---|---|---|---|
| CF-I (TPM) | −0.3303 | 3.4153 | 0.2177 | −0.1248 | 69.84% | 62% | 100% | ||
| CF-II (TPM) | −0.7378 | −0.462 | 0.9093 | 0.0654 | 80.16% | 75% | 100% | ||
| CF-III (TPM) | 6.9282 | −0.3921 | 34.13% | 17% | 100% | ||||
| CFmax | 100% | 100% | 100% | ||||||
| CF-I (EC) | −0.7877 | 0.0351 | 0.0181 | −0.0008 | 59.52% | 49% | 100% | ||
| CF-II (EC) | −4.6701 | −0.0408 | 0.2134 | 0.0014 | 73.02% | 66% | 100% | ||
| CF-III (EC) | 3.1584 | −0.0042 | 58.73% | 48% | 100% | ||||
| CFmax | 100% | 100% | 100% |
| Classifiers | Intercept | ABCB6 | KIAA1614 | MND1 | RIPK3 | SMG1 | Accuracy | Sensitivity | Specificity |
|---|---|---|---|---|---|---|---|---|---|
| CF-I (Raw) | 9.0357 | −0.0611 | 0.1628 | −0.0089 | 97.06% | 94.12% | 100% | ||
| CF-II (Raw) | 9.2613 | −0.2191 | 0.1963 | –0.0081 | 97.06% | 94.12% | 100% | ||
| CFmax | 100% | 100% | 100% |
| Classifiers | Intercept | ABCB6 | MND1 | RIPK3 | SMG1 | CDC6 | ZNF282 | CEP72 | Accuracy | Sensitivity | Specificity |
|---|---|---|---|---|---|---|---|---|---|---|---|
| CF1 (Raw) | −1.6909 | 0.0001 | 2.0352 | −0.6842 | 50.91% | 42.55% | 100% | ||||
| CF2 (Raw) | −7.5469 | −0.9264 | 5.8238 | 1.9166 | 80% | 76.60% | 100% | ||||
| CF3 (Raw) | 1.466 | 0.4688 | −1.4305 | −0.0862 | 20% | 6.38% | 100% | ||||
| CF4 (Raw) | 3.0641 | −0.8549 | 0.0001 | 0.6613 | 70.91% | 65.96% | 100% | ||||
| CFmax | 100% | 100% | 100% |
| Classifier | Intercept | ATP6V1B2 | IFI27 | BTN3A1 | SERTAD4 | EPSTI1 | Accuracy | Sensitivity | Specificity |
|---|---|---|---|---|---|---|---|---|---|
| CF1 | 9.193 | −1.8935 | 1.5774 | −4.3303 | 87.61% | 81.72% | 91.49% | ||
| CF2 | −7.2786 | −5.2993 | 3.2572 | 2.34 | 86.32% | 76.34% | 92.91% | ||
| CFmax | 91.88% | 94.62% | 90.07% | ||||||
| Classifier | Intercept | ATP6V1B2 | SERTAD4 | EPSTI1 | Accuracy | Sensitivity | Specificity |
|---|---|---|---|---|---|---|---|
| CF1 | −10.9845 | −3.2959 | −0.4205 | 7.6279 | 83.47% | 83.49% | 83.33% |
| Classifiers | Intercept | MND1 | SMG1 | CEP72 | APT6V1B2 | Accuracy | Sensitivity | Specificity |
|---|---|---|---|---|---|---|---|---|
| CF-I | −7.2068 | −0.0001 | 0.0761 | 0.0001 | 85.22% | 82.35% | 89.36% | |
| CF-II | −8.0074 | −0.0251 | 0.0663 | 0.0001 | 83.48% | 80.88% | 87.23% | |
| CFmax | 88.70% | 89.71% | 87.23% |
Publisher’s Note: MDPI stays neutral with regard to jurisdictional claims in published maps and institutional affiliations. |
© 2022 by the author. Licensee MDPI, Basel, Switzerland. This article is an open access article distributed under the terms and conditions of the Creative Commons Attribution (CC BY) license (https://creativecommons.org/licenses/by/4.0/).
Share and Cite
Zhang, Z. Genomic Transcriptome Benefits and Potential Harms of COVID-19 Vaccines Indicated from Optimized Genomic Biomarkers. Vaccines 2022, 10, 1774. https://doi.org/10.3390/vaccines10111774
Zhang Z. Genomic Transcriptome Benefits and Potential Harms of COVID-19 Vaccines Indicated from Optimized Genomic Biomarkers. Vaccines. 2022; 10(11):1774. https://doi.org/10.3390/vaccines10111774
Chicago/Turabian StyleZhang, Zhengjun. 2022. "Genomic Transcriptome Benefits and Potential Harms of COVID-19 Vaccines Indicated from Optimized Genomic Biomarkers" Vaccines 10, no. 11: 1774. https://doi.org/10.3390/vaccines10111774
APA StyleZhang, Z. (2022). Genomic Transcriptome Benefits and Potential Harms of COVID-19 Vaccines Indicated from Optimized Genomic Biomarkers. Vaccines, 10(11), 1774. https://doi.org/10.3390/vaccines10111774