Influence of Long-Term Fasting on Blood Redox Status in Humans


 and
and 
Abstract
1. Introduction
2. Materials and Methods
2.1. Ethics Statement
2.2. Participants
2.3. The Fasting Protocol
2.4. Clinical Data
2.5. Blood Collection and Handling for the Measurement of Redox Biomarkers
2.6. Protocols for the Measurement of Redox Biomarkers
2.7. Statistical Analysis
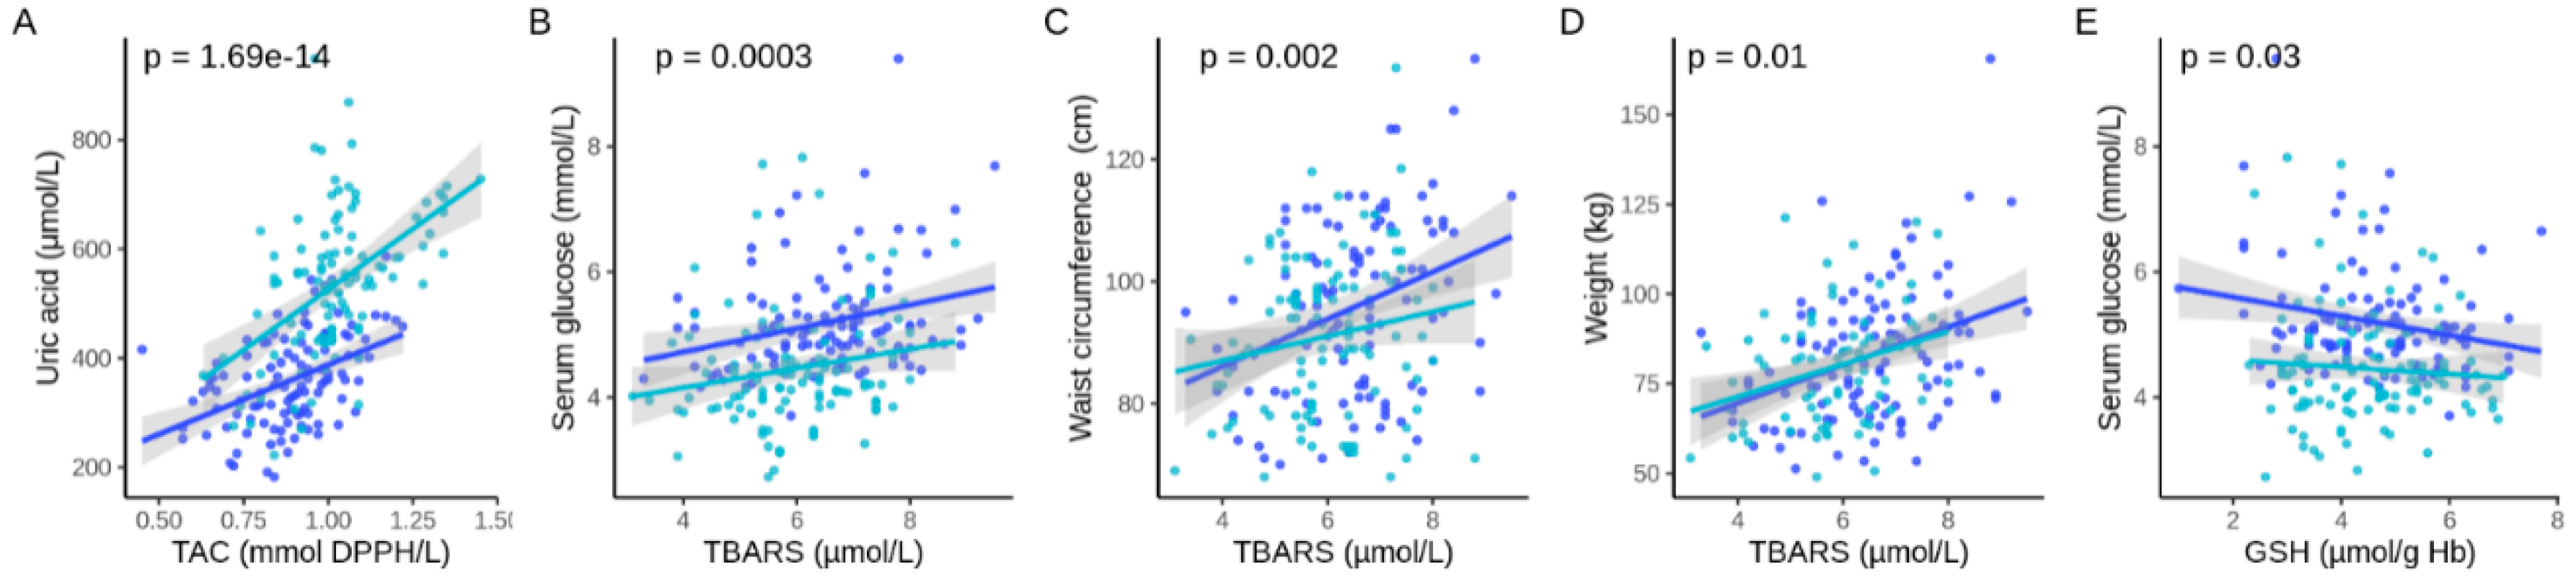
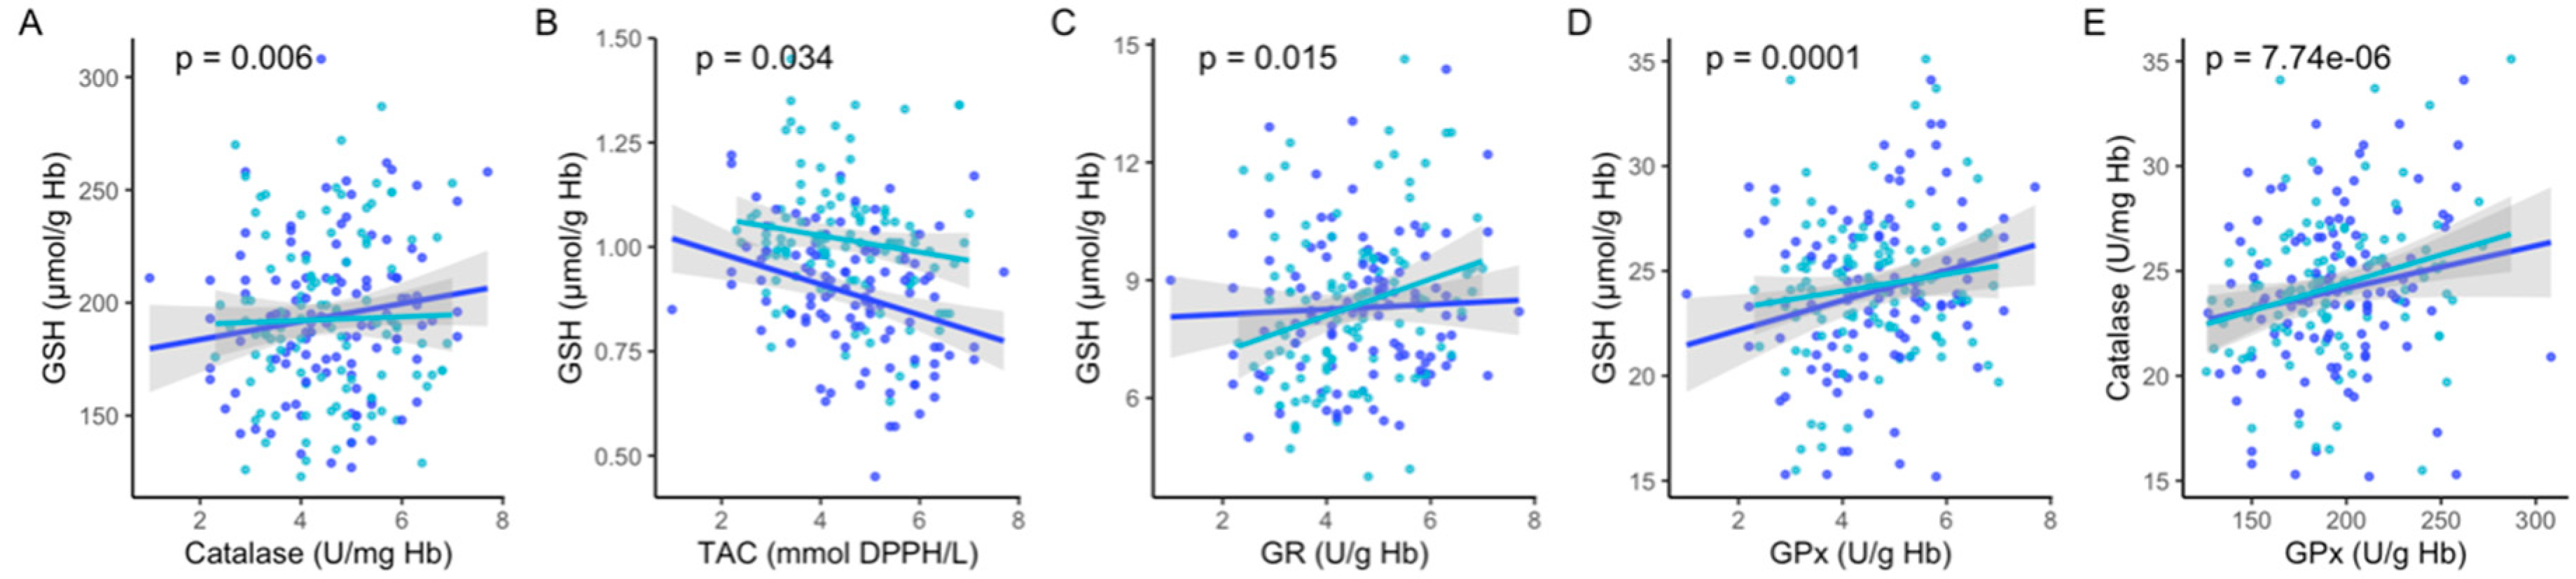
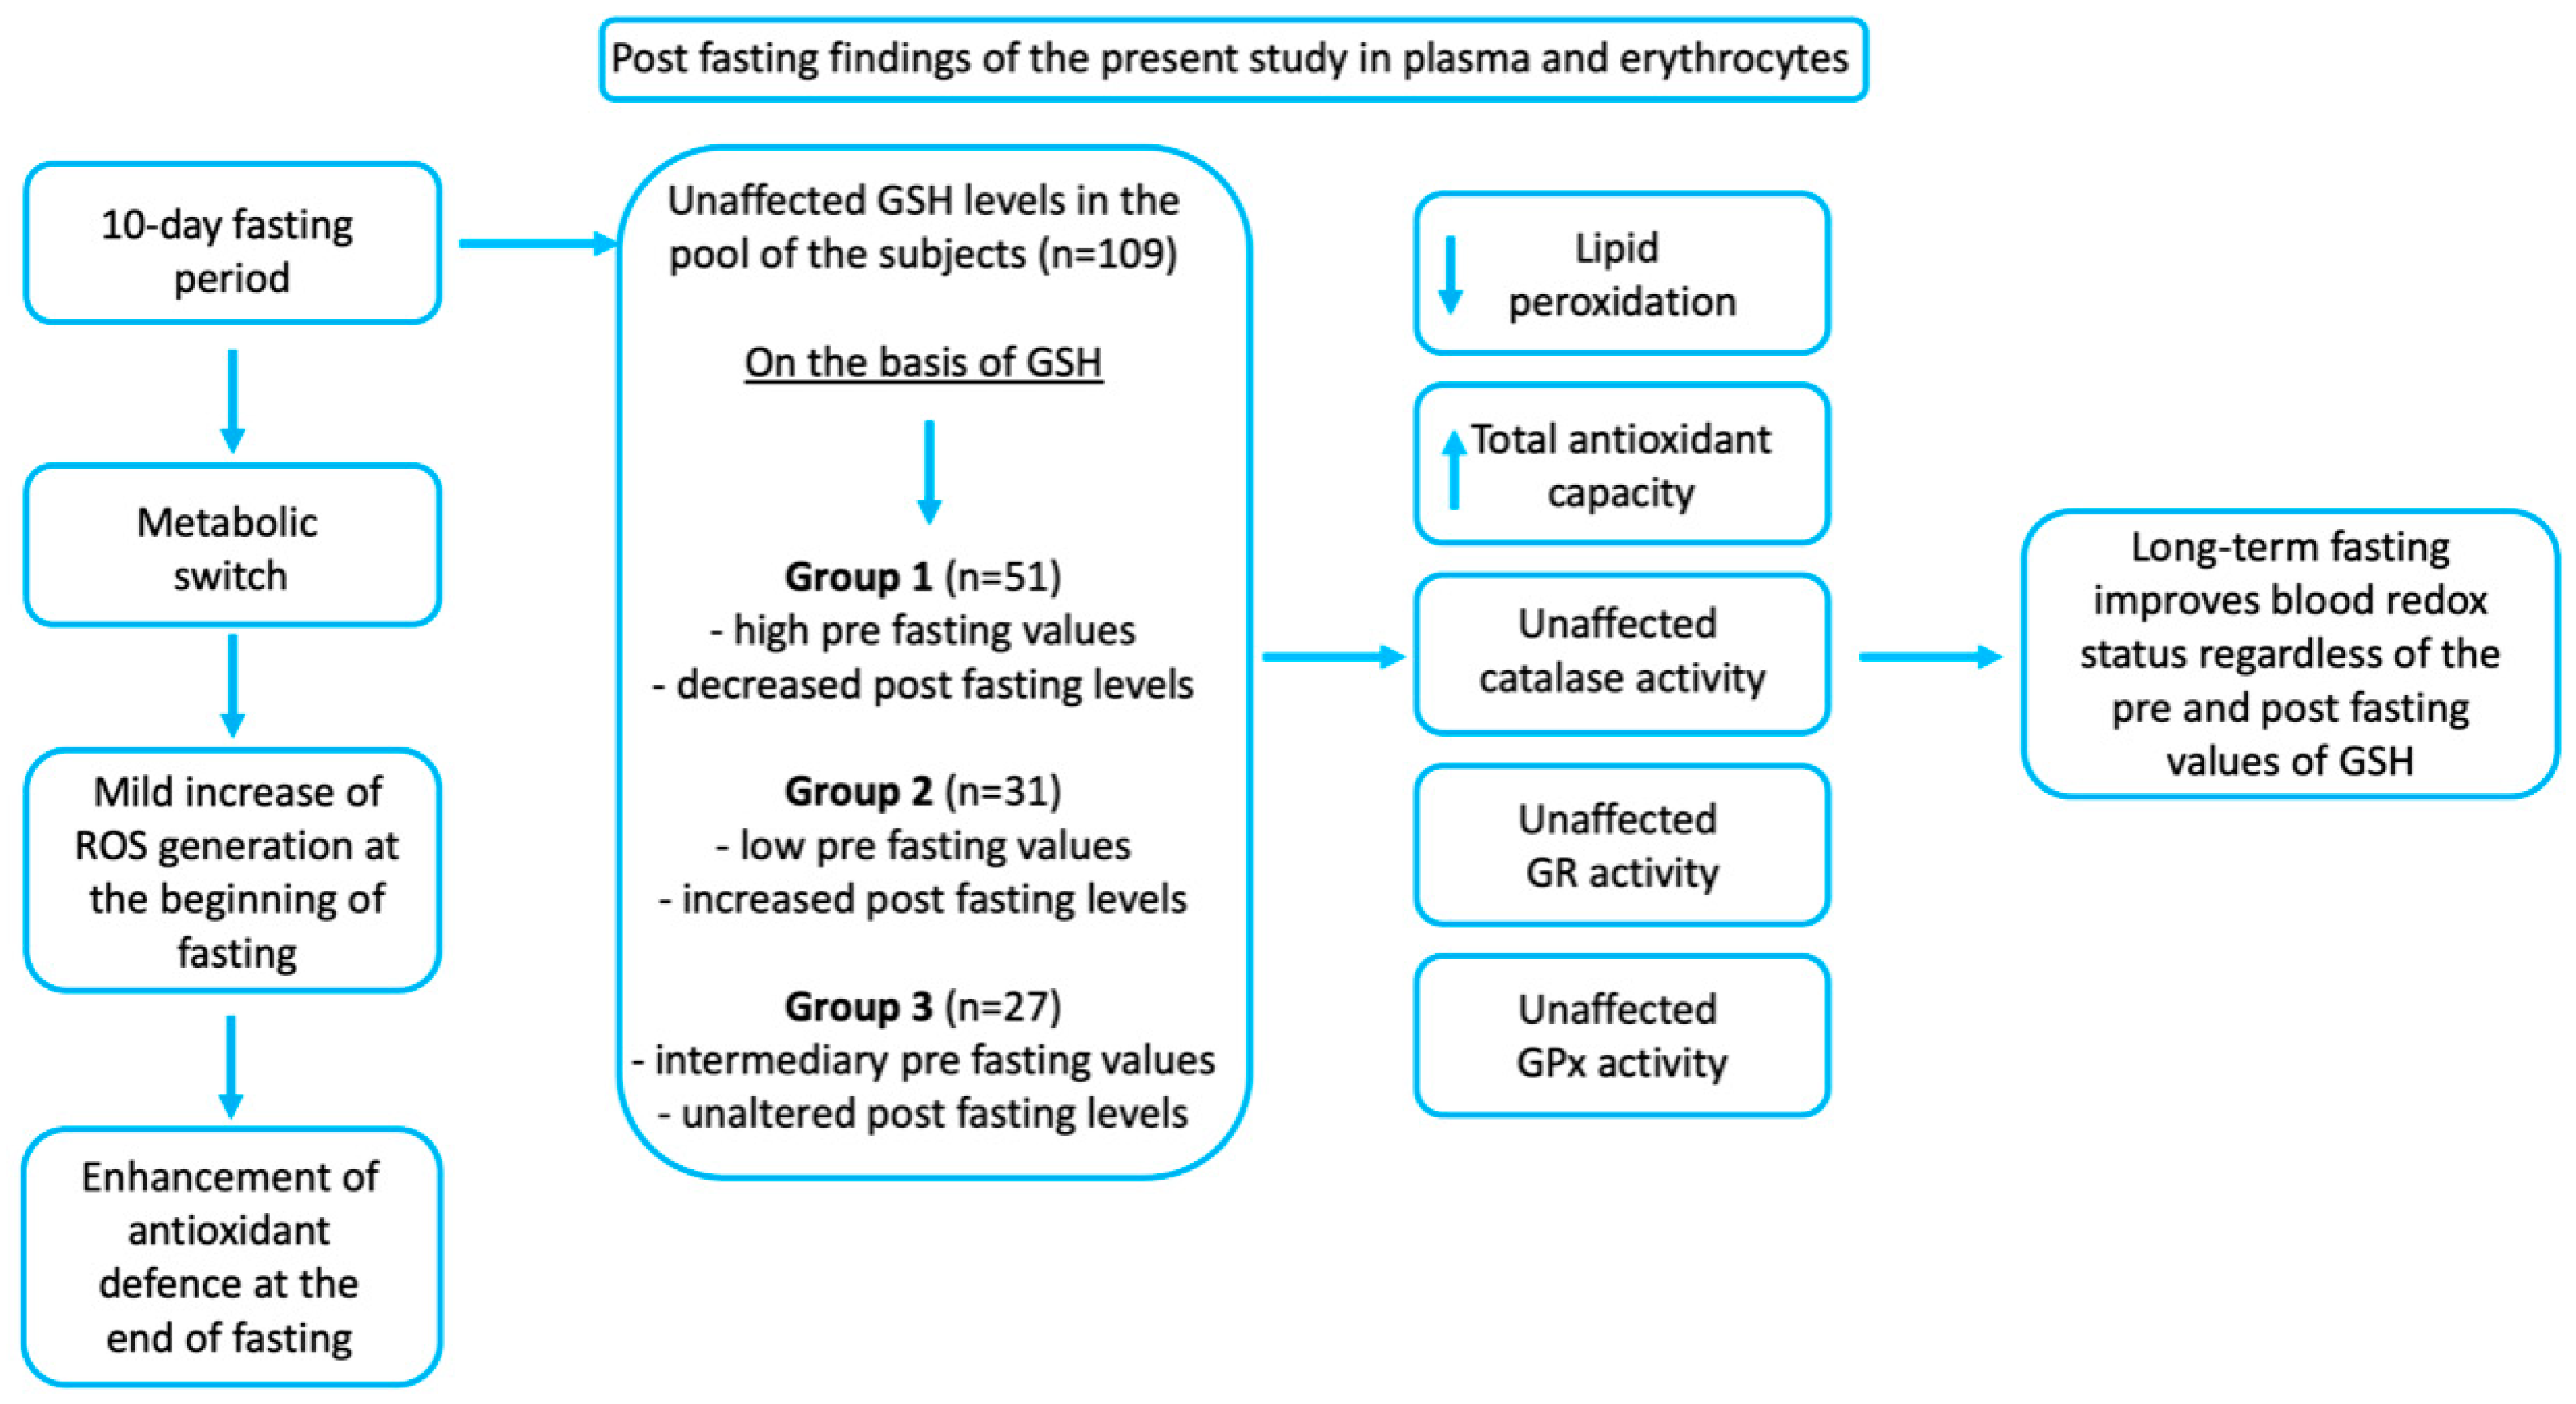
3. Results
4. Discussion
5. Conclusions
Author Contributions
Funding
Acknowledgments
Conflicts of Interest
References
- Cahill, G.J. Starvation in man. Clin. Endocrinol. Metab. 1976, 5, 397–415. [Google Scholar] [CrossRef]
- Prentice, A.M. Starvation in humans: Evolutionary background and contemporary implications. Mech. Ageing Dev. 2005, 126, 976–981. [Google Scholar] [CrossRef] [PubMed]
- Di Francesco, A.; Di Germanio, C.; Bernier, M.; de Cabo, R. A time to fast. Science 2018, 362, 770–775. [Google Scholar] [CrossRef] [PubMed]
- Lignot, J.-H.; LeMaho, Y. A history of modern research into fasting, starvation, and inanition. In Comparative Physiology of Fasting, Starvation, and Food Limitation; Springer: Berlin/Heidelberg, Germany, 2012; pp. 7–23. [Google Scholar]
- Wilhelmi de Toledo, F.; Grundler, F.; Bergouignan, A.; Drinda, S.; Michalsen, A. Safety, health improvement and well-being during a 4 to 21-day fasting period in an observational study including 1422 subjects. PLoS ONE 2019, 14, e0209353. [Google Scholar] [CrossRef]
- Drinda, S.; Grundler, F.; Neumann, T.; Lehmann, T.; Steckhan, N.; Michalsen, A.; Wilhelmi de Toledo, F. Effects of Periodic Fasting on Fatty Liver Index—A Prospective Observational Study. Nutrients 2019, 11, 2601. [Google Scholar] [CrossRef]
- Wilhelmi de Toledo, F.; Grundler, F.; Sirtori, C.R.; Ruscica, M. Unravelling the health effects of fasting: A long road from obesity treatment to healthy life span increase and improved cognition. Ann. Med. accepted.
- Stirling, I.; Derocher, A.E. Effects of climate warming on polar bears: A review of the evidence. Glob. Chang. Biol. 2012, 18, 2694–2706. [Google Scholar] [CrossRef]
- Le Maho, Y.; Delclitte, P.; Chatonnet, J. Thermoregulation in fasting emperor penguins under natural conditions. Am. J. Physiol.-Leg. Content 1976, 231, 913–922. [Google Scholar] [CrossRef]
- Wilhelmi de Toledo, F.; Buchinger, A.; Burggrabe, H.; Hölz, G.; Kuhn, C.; Lischka, E.; Lischka, N.; Lützner, H.; May, W.; Ritzmann-Widderich, M. Fasting therapy-an expert panel update of the 2002 consensus guidelines. Forsch. Komplementärmedizin/Res. Complementary Med. 2013, 20, 434–443. [Google Scholar] [CrossRef]
- Chaix, A.; Manoogian, E.N.; Melkani, G.C.; Panda, S. Time-restricted eating to prevent and manage chronic metabolic diseases. Annu. Rev. Nutr. 2019, 381, 2541–2551. [Google Scholar] [CrossRef]
- De Cabo, R.; Mattson, M.P. Effects of Intermittent Fasting on Health, Aging, and Disease. N. Engl. J. Med. 2019, 381, 2541–2551. [Google Scholar] [CrossRef] [PubMed]
- Mattson, M.P.; Longo, V.D.; Harvie, M. Impact of intermittent fasting on health and disease processes. Ageing Res. Rev. 2017, 39, 46–58. [Google Scholar] [CrossRef] [PubMed]
- Suzuki, Y.J.; Forman, H.J.; Sevanian, A. Oxidants as stimulators of signal transduction. Free Radic. Biol. Med. 1997, 22, 269–285. [Google Scholar] [CrossRef]
- Anton, S.D.; Moehl, K.; Donahoo, W.T.; Marosi, K.; Lee, S.A.; Mainous, A.G.; Leeuwenburgh, C.; Mattson, M.P. Flipping the Metabolic Switch: Understanding and Applying the Health Benefits of Fasting. Obesity 2018, 26, 254–268. [Google Scholar] [CrossRef] [PubMed]
- Mattson, M.P.; Moehl, K.; Ghena, N.; Schmaedick, M.; Cheng, A. Intermittent metabolic switching, neuroplasticity and brain health. Nat. Rev. Neurosci. 2018, 19, 80. [Google Scholar] [CrossRef] [PubMed]
- Sies, H. Oxidative Stress: Eustress and Distress in Redox Homeostasis. In Stress: Physiology, Biochemistry, and Pathology; Elsevier: Amsterdam, The Netherlands, 2019; pp. 153–163. [Google Scholar]
- Zhang, H.; Davies, K.J.; Forman, H.J. Oxidative stress response and Nrf2 signaling in aging. Free Radic. Biol. Med. 2015, 88, 314–336. [Google Scholar] [CrossRef] [PubMed]
- Fontana, L.; Partridge, L.; Longo, V.D. Extending healthy life span—From yeast to humans. Science 2010, 328, 321–326. [Google Scholar] [CrossRef]
- López-Otín, C.; Blasco, M.A.; Partridge, L.; Serrano, M.; Kroemer, G. The hallmarks of aging. Cell 2013, 153, 1194–1217. [Google Scholar] [CrossRef]
- Madkour, M.I.; El-Serafi, A.T.; Jahrami, H.A.; Sherif, N.M.; Hassan, R.E.; Awadallah, S. Ramadan diurnal intermittent fasting modulates SOD2, TFAM, Nrf2, and sirtuins (SIRT1, SIRT3) gene expressions in subjects with overweight and obesity. Diabetes Res. Clin. Pract. 2019, 155, 107801. [Google Scholar] [CrossRef]
- Cheng, C.-W.; Adams, G.B.; Perin, L.; Wei, M.; Zhou, X.; Lam, B.S.; Da Sacco, S.; Mirisola, M.; Quinn, D.I.; Dorff, T.B. Prolonged fasting reduces IGF-1/PKA to promote hematopoietic-stem-cell-based regeneration and reverse immunosuppression. Cell Stem Cell 2014, 14, 810–823. [Google Scholar] [CrossRef]
- Vázquez-Medina, J.P.; Zenteno-Savín, T.; Forman, H.J.; Crocker, D.E.; Ortiz, R.M. Prolonged fasting increases glutathione biosynthesis in postweaned northern elephant seals. J. Exp. Biol. 2011, 214, 1294–1299. [Google Scholar] [CrossRef] [PubMed]
- Vázquez-Medina, J.P.; Soñanez-Organis, J.G.; Rodriguez, R.; Viscarra, J.A.; Nishiyama, A.; Crocker, D.E.; Ortiz, R.M. Prolonged fasting activates Nrf2 in post-weaned elephant seals. J. Exp. Biol. 2013, 216, 2870–2878. [Google Scholar] [CrossRef] [PubMed]
- Weindruch, R.; Sohal, R.S. Caloric Intake and Aging. N. Engl. J. Med. 1997, 337, 986–994. [Google Scholar] [CrossRef] [PubMed]
- Teruya, T.; Chaleckis, R.; Takada, J.; Yanagida, M.; Kondoh, H. Diverse metabolic reactions activated during 58-hr fasting are revealed by non-targeted metabolomic analysis of human blood. Sci. Rep. 2019, 9, 1–11. [Google Scholar] [CrossRef] [PubMed]
- Miller, V.J.; Villamena, F.A.; Volek, J.S. Nutritional ketosis and mitohormesis: Potential implications for mitochondrial function and human health. J. Nutr. Metab. 2018, 2018, 5157645. [Google Scholar] [CrossRef]
- Tassone, B.; Saoncella, S.; Neri, F.; Ala, U.; Brusa, D.; Magnuson, M.A.; Provero, P.; Oliviero, S.; Riganti, C.; Calautti, E. Rictor/mTORC2 deficiency enhances keratinocyte stress tolerance via mitohormesis. Cell Death Differ. 2017, 24, 731–746. [Google Scholar] [CrossRef]
- Zhang, Y.-K.J.; Wu, K.C.; Klaassen, C.D. Genetic activation of Nrf2 protects against fasting-induced oxidative stress in livers of mice. PLoS ONE 2013, 8, e59122. [Google Scholar] [CrossRef]
- Veskoukis, A.; Kerasioti, E.; Priftis, A.; Kouka, P.; Spanidis, Y.; Makri, S.; Kouretas, D. A battery of translational biomarkers for the assessment of the in vitro and in vivo antioxidant action of plant polyphenolic compounds: The biomarker issue. Curr. Opin. Toxicol. 2019, 13, 99–109. [Google Scholar] [CrossRef]
- Veskoukis, A.S.; Kyparos, A.; Paschalis, V.; Nikolaidis, M.G. Spectrophotometric assays for measuring redox biomarkers in blood. Biomarkers 2016, 21, 208–217. [Google Scholar] [CrossRef]
- Aebi, H. [13] Catalase in vitro. In Methods in Enzymology; Elsevier: Amsterdam, The Netherlands, 1984; Volume 105, pp. 121–126. [Google Scholar]
- Janaszewska, A.; Bartosz, G. Assay of total antioxidant capacity: Comparison of four methods as applied to human blood plasma. Scand. J. Clin. Lab. Investig. 2002, 62, 231–236. [Google Scholar] [CrossRef]
- Keles, M.; Taysi, S.; Sen, N.; Aksoy, H.; Akcay, F. Effect of corticosteroid therapy on serum and CSF malondialdehyde and antioxidant proteins in multiple sclerosis. Can. J. Neurol. Sci. 2001, 28, 141–143. [Google Scholar] [CrossRef] [PubMed]
- Spanidis, Y.; Mpesios, A.; Stagos, D.; Goutzourelas, N.; Bar-Or, D.; Karapetsa, M.; Zakynthinos, E.; Spandidos, D.A.; Tsatsakis, A.M.; Leon, G. Assessment of the redox status in patients with metabolic syndrome and type 2 diabetes reveals great variations. Exp. Ther. Med. 2016, 11, 895–903. [Google Scholar] [CrossRef] [PubMed]
- Spanidis, Y.; Veskoukis, A.S.; Papanikolaou, C.; Stagos, D.; Priftis, A.; Deli, C.K.; Jamurtas, A.Z.; Kouretas, D. Exercise-induced reductive stress is a protective mechanism against oxidative stress in peripheral blood mononuclear cells. Oxidative Med. Cell. Longev. 2018. [Google Scholar] [CrossRef] [PubMed]
- Choi, I.Y.; Piccio, L.; Childress, P.; Bollman, B.; Ghosh, A.; Brandhorst, S.; Suárez, J.; Michalsen, A.; Cross, A.H.; Morgan, T.E.; et al. A Diet Mimicking Fasting Promotes Regeneration and Reduces Autoimmunity and Multiple Sclerosis Symptoms. Cell Rep. 2016, 15, 2136–2146. [Google Scholar] [CrossRef]
- Alves, A.C.; Glastonbury, C.A.; Moustafa, J.S.E.-S.; Small, K.S. Fasting and time of day independently modulate circadian rhythm relevant gene expression in adipose and skin tissue. BMC Genom. 2018, 19, 659. [Google Scholar]
- Kinouchi, K.; Magnan, C.; Ceglia, N.; Liu, Y.; Cervantes, M.; Pastore, N.; Huynh, T.; Ballabio, A.; Baldi, P.; Masri, S. Fasting imparts a switch to alternative daily pathways in liver and muscle. Cell Rep. 2018, 25, 3299–3314 e3296. [Google Scholar] [CrossRef]
- Goldstein, I.; Hager, G.L. Transcriptional and chromatin regulation during fasting–the genomic era. Trends Endocrinol. Metab. 2015, 26, 699–710. [Google Scholar] [CrossRef]
- Kogure, A.; Uno, M.; Ikeda, T.; Nishida, E. The microRNA machinery regulates fasting-induced changes in gene expression and longevity in Caenorhabditis elegans. J. Biol. Chem. 2017, 292, 11300–11309. [Google Scholar] [CrossRef]
- Cheng, C.-W.; Villani, V.; Buono, R.; Wei, M.; Kumar, S.; Yilmaz, O.H.; Cohen, P.; Sneddon, J.B.; Perin, L.; Longo, V.D. Fasting-Mimicking Diet Promotes Ngn3-Driven β-Cell Regeneration to Reverse Diabetes. Cell 2017, 168, 775–788.e712. [Google Scholar] [CrossRef]
- Yamaza, H.; Komatsu, T.; Wakita, S.; Kijogi, C.; Park, S.; Hayashi, H.; Chiba, T.; Mori, R.; Furuyama, T.; Mori, N. FoxO1 is involved in the antineoplastic effect of calorie restriction. Aging Cell 2010, 9, 372–382. [Google Scholar] [CrossRef]
- Fontana, L.; Partridge, L.; Longo, V.D. Dietary restriction, growth factors and aging: From yeast to humans. Science (New Yorkny) 2010, 328, 321–326. [Google Scholar] [CrossRef] [PubMed]
- Ozata, M.; Mergen, M.; Oktenli, C.; Aydin, A.; Sanisoglu, S.Y.; Bolu, E.; Yilmaz, M.I.; Sayal, A.; Isimer, A.; Ozdemir, I.C. Increased oxidative stress and hypozincemia in male obesity. Clin. Biochem. 2002, 35, 627–631. [Google Scholar] [CrossRef]
- Hatori, M.; Vollmers, C.; Zarrinpar, A.; DiTacchio, L.; Bushong, E.A.; Gill, S.; Leblanc, M.; Chaix, A.; Joens, M.; Fitzpatrick, J.A. Time-restricted feeding without reducing caloric intake prevents metabolic diseases in mice fed a high-fat diet. Cell Metab. 2012, 15, 848–860. [Google Scholar] [CrossRef] [PubMed]
- Shimokawa, I.; Komatsu, T.; Hayashi, N.; Kim, S.E.; Kawata, T.; Park, S.; Hayashi, H.; Yamaza, H.; Chiba, T.; Mori, R. The life-extending effect of dietary restriction requires F oxo3 in mice. Aging Cell 2015, 14, 707–709. [Google Scholar] [CrossRef] [PubMed]
- Menzies, F.M.; Fleming, A.; Caricasole, A.; Bento, C.F.; Andrews, S.P.; Ashkenazi, A.; Füllgrabe, J.; Jackson, A.; Sanchez, M.J.; Karabiyik, C. Autophagy and neurodegeneration: Pathogenic mechanisms and therapeutic opportunities. Neuron 2017, 93, 1015–1034. [Google Scholar] [CrossRef] [PubMed]
- Sherman, H.; Frumin, I.; Gutman, R.; Chapnik, N.; Lorentz, A.; Meylan, J.; le Coutre, J.; Froy, O. Long-term restricted feeding alters circadian expression and reduces the level of inflammatory and disease markers. J. Cell. Mol. Med. 2011, 15, 2745–2759. [Google Scholar] [CrossRef] [PubMed]
- Li, C.; Ostermann, T.; Hardt, M.; Lüdtke, R.; Broecker-Preuss, M.; Dobos, G.; Michalsen, A. Metabolic and psychological response to 7-day fasting in obese patients with and without metabolic syndrome. Complementary Med. Res. 2013, 20, 413–420. [Google Scholar] [CrossRef] [PubMed]
- Kerndt, P.R.; Naughton, J.L.; Driscoll, C.E.; Loxterkamp, D.A. Fasting: The history, pathophysiology and complications. West. J. Med. 1982, 137, 379–399. [Google Scholar]
- BaHammam, A.S.; Pandi-Perumal, S.R.; Alzoghaibi, M.A. The effect of Ramadan intermittent fasting on lipid peroxidation in healthy young men while controlling for diet and sleep: A pilot study. Ann. Thorac. Med. 2016, 11, 43. [Google Scholar] [CrossRef]
- Faris, M.E.A.-I.E.; Hussein, R.N.; Al-Kurd, R.a.A.; Al-Fararjeh, M.A.; Bustanji, Y.K.; Mohammad, M.K. Impact of Ramadan intermittent fasting on oxidative stress measured by urinary 15--isoprostane. J. Nutr. Metab. 2012, 2012, 802924. [Google Scholar] [CrossRef]
- Mrad, S.; Rejeb, H.; Ben Abdallah, J.; Graiet, H.; Ben Khelifa, M.; Abed, A.; Ferchichi, S.; Limem, K.; Ben Saad, H. The impacts of ramadan intermittent fasting on oxidant/antioxidant stress biomarkers of stable chronic obstructive pulmonary disease male patients. Am. J. Men’s Health 2019, 13, 1557988319848281. [Google Scholar] [CrossRef] [PubMed]
- Ron, D.; Harding, H.P. Protein-folding homeostasis in the endoplasmic reticulum and nutritional regulation. Cold Spring Harb. Perspect. Biol. 2012, 4, a013177. [Google Scholar] [CrossRef] [PubMed]
- Schoenmakers, E.; Agostini, M.; Mitchell, C.; Schoenmakers, N.; Papp, L.; Rajanayagam, O.; Padidela, R.; Ceron-Gutierrez, L.; Doffinger, R.; Prevosto, C. Mutations in the selenocysteine insertion sequence–binding protein 2 gene lead to a multisystem selenoprotein deficiency disorder in humans. J. Clin. Investig. 2010, 120, 4220–4235. [Google Scholar] [CrossRef]
- Scheuner, D.; Kaufman, R.J. The unfolded protein response: A pathway that links insulin demand with β-cell failure and diabetes. Endocr. Rev. 2008, 29, 317–333. [Google Scholar] [CrossRef]
- Hjort, L.; Jørgensen, S.W.; Gillberg, L.; Hall, E.; Brøns, C.; Frystyk, J.; Vaag, A.A.; Ling, C. 36 h fasting of young men influences adipose tissue DNA methylation of LEP and ADIPOQ in a birth weight-dependent manner. Clin. Epigenetics 2017, 9, 40. [Google Scholar] [CrossRef] [PubMed]
- Johnson, J.B.; Summer, W.; Cutler, R.G.; Martin, B.; Hyun, D.-H.; Dixit, V.D.; Pearson, M.; Nassar, M.; Tellejohan, R.; Maudsley, S. Alternate day calorie restriction improves clinical findings and reduces markers of oxidative stress and inflammation in overweight adults with moderate asthma. Free Radic. Biol. Med. 2007, 42, 665–674. [Google Scholar] [CrossRef]
- Gawron-Skarbek, A.; Prymont-Przymińska, A.; Sobczak, A.; Guligowska, A.; Kostka, T.; Nowak, D.; Szatko, F. A comparison of native and non-urate total antioxidant capacity of fasting plasma and saliva among middle-aged and older subjects. Redox Rep. 2018, 23, 57–62. [Google Scholar] [CrossRef]
- Goutzourelas, N.; Orfanou, M.; Charizanis, I.; Leon, G.; Spandidos, D.A.; Kouretas, D. GSH levels affect weight loss in individuals with metabolic syndrome and obesity following dietary therapy. Exp. Ther. Med. 2018, 16, 635–642. [Google Scholar] [CrossRef]
- Gerber, P.A.; Rutter, G.A. The role of oxidative stress and hypoxia in pancreatic beta-cell dysfunction in diabetes mellitus. Antioxid. Redox Signal. 2017, 26, 501–518. [Google Scholar] [CrossRef]
- Block, G.; Jensen, C.D.; Morrow, J.D.; Holland, N.; Norkus, E.P.; Milne, G.L.; Hudes, M.; Dalvi, T.B.; Crawford, P.B.; Fung, E.B. The effect of vitamins C and E on biomarkers of oxidative stress depends on baseline level. Free Radic. Biol. Med. 2008, 45, 377–384. [Google Scholar] [CrossRef]
- Stagos, D.; Goutzourelas, N.; Ntontou, A.-M.; Kafantaris, I.; Deli, C.K.; Poulios, A.; Jamurtas, A.Z.; Bar-Or, D.; Kouretas, D. Assessment of eccentric exercise-induced oxidative stress using oxidation-reduction potential markers. Oxidative Med. Cell. Longev. 2015, 2015, 204615. [Google Scholar] [CrossRef] [PubMed][Green Version]
- Jones, D.P. Redefining oxidative stress. Antioxid. Redox Signal. 2006, 8, 1865–1879. [Google Scholar] [CrossRef] [PubMed]
- Pearson, K.J.; Lewis, K.N.; Price, N.L.; Chang, J.W.; Perez, E.; Cascajo, M.V.; Tamashiro, K.L.; Poosala, S.; Csiszar, A.; Ungvari, Z. Nrf2 mediates cancer protection but not prolongevity induced by caloric restriction. Proc. Natl. Acad. Sci. USA 2008, 105, 2325–2330. [Google Scholar] [CrossRef] [PubMed]
- Ma, Q. Role of nrf2 in oxidative stress and toxicity. Annu. Rev. Pharmacol. Toxicol. 2013, 53, 401–426. [Google Scholar] [CrossRef] [PubMed]
- Watson, J.D. Type 2 diabetes as a redox disease. Lancet 2014, 383, 841–843. [Google Scholar] [CrossRef]
- Winterbourn, C.C.; Hampton, M.B. Thiol chemistry and specificity in redox signaling. Free Radic. Biol. Med. 2008, 45, 549–561. [Google Scholar] [CrossRef] [PubMed]


| Parameters | All (n = 109) | High GSH (n = 77) | Intermediate (n = 18) | Low GSH (n = 14) |
|---|---|---|---|---|
| Age, years | 57.0 (±10.5) | 56.4 (±10.4) | 56.2 (±11.0) | 60.5 (±9.8) |
| Female, n | 68 (62%) | 52 (68%) | 10 (56%) | 6 (43%) |
| Male, n | 41 (38%) | 25 (32%) | 8 (44%) | 8 (57%) |
| Waist circumference, cm | 95.8 (±14.2) | 95.1 (±14.8) | 94.1 (±13.2) | 102.5 (±10.4) |
| BMI, kg/m2 | 28.34 (±6.01) | 28.39 (±6.33) | 27.63 (±5.88) | 29.07 (±4.29) |
| Weight, kg | 82.9 (±18.8) | 81.6 (±19.0) | 84.3 (±21.3) | 88.6 (±13.4) |
| Physical activity, h/week | 4.6 (±4.6) | 4.7 (±4.7) | 4.1 (±4.6) | 4.8 (±3.7) |
| Emotional well-being | 6.4 (±1.9) | 6.3 (±1.9) | 6.2 (±1.8) | 7.3 (±2.0) |
| Physical well-being | 6.1 (±1.8) | 6.0 (±1.8) | 6.1 (±1.7) | 6.8 (±2.2) |
| Systolic BP, mmHg | 131.9 (±19.3) | 133.6 (±18.5) | 125.5 (±18.3) | 130.9 (±25.0) |
| Diastolic BP, mmHg | 83.8 (±10.4) | 84.3 (±10.3) | 80.8 (±12.5) | 84.8 (±8.1) |
| Glucose, mmol/L | 5.20 (±0.86) * | 5.13 (±0.74) | 5.05 (±0.59) | 5.78 (±1.41) |
| Triglycerides, mmol/L | 1.45 (±0.66) | 1.45 (±0.69) | 1.39 (±0.58) | 1.58 (±0.65) |
| Cholesterol, mmol/L | 5.77 (±1.16) | 5.82 (±1.16) | 5.47 (±1.03) | 5.85 (±1.29) |
| AP, µkat/L | 1.16 (±0.33) | 1.17 (±0.32) | 1.02 (±0.31) | 1.25 (±0.39) |
| GPT, µkat/L | 0.54 (±0.35) | 0.54 (±0.37) | 0.48 (±0.21) | 0.63 (±0.40) |
| GOT, µkat/L | 0.34 (±0.14) | 0.33 (±0.15) | 0.33 (±0.09) | 0.38 (±0.17) |
| GGT, µkat/L | 0.63 (±0.68) | 0.66 (±0.74) | 0.54 (±0.56) | 0.57 (±0.46) |
| GFR, mL/min/1.73 m2 | 92.8 (±13.7) | 93.7 (±12.5) | 92.3 (±18.7) | 88.2 (±14.2) |
| Creatinine, µmol/L | 69.09 (±13.47) | 67.36 (±11.51) | 72.02 (±16.29) | 75.08 (±18.06) |
| Urea, mmol/L | 4.731 (±1.222) * | 4.548 (±1.236) | 5.00 (±1.18) | 5.41 (±0.93) |
| Uric acid, µmol/L | 358.9 (±83.64) | 348.7 (±78.39) | 368.5 (±111.7) | 403.8 (±58.18) |
| GSH, µmol/g Hb | 4.63 (±1.3) *** | 5.2 (±0.9) | 3.64 (±0.3) | 2.50 (±0.52) |
| Catalase, U/mg Hb | 194.2 (±33.6) | 195.6 (±35.1) | 188.4 (±28.3) | 193.8 (±32.9) |
| TAC, mmol DPPH/L | 0.88 (±0.1) ** | 0.85 (±0.2) | 0.90 (±0.1) | 0.98 (±0.1) |
| TBARS, µmol/L | 6.5 (±1.3) | 6.4 (±1.2) | 6.9 (±1.3) | 6.5 (±1.4) |
| GR, U/g Hb | 8.3 (±1.8) | 8.3 (±1.8) | 8.4 (±1.6) | 8.4 (±2.1) |
| GPx, U/g Hb | 24.1 (±3.9) | 24.6 (±3.9) | 21.3 (±6.0) | 23.5 (±4.2) |
| Parameters | Pre-Fasting | Post-Fasting | p-Value |
|---|---|---|---|
| Waist circumference, cm | 95.8 (±14.2) | 91.0 (±13.1) | <2 × 10⁻¹⁶ |
| BMI, kg/m2 | 28.34 (±6.01) | 27.68 (±5.20) | <2 × 10⁻¹⁶ |
| Weight, kg | 82.9 (±18.8) | 79.9 (±16.1) | <2 × 10⁻¹⁶ |
| Emotional well-being | 6.4 (±1.9) | 7.9 (±1.6) | 2.7 × 10⁻¹³ |
| Physical well-being | 6.1 (±1.8) | 7.8 (±1.6) | 2.7 × 10⁻¹⁴ |
| Systolic BP, mmHg | 131.9 (±19.3) | 119.7 (±15.8) | 1.3 × 10⁻¹¹ |
| Diastolic BP, mmHg | 83.8 (±10.4) | 76.9 (±9.6) | 1.1 × 10⁻¹⁰ |
| Glucose, mmol/L | 5.20 (±0.86) | 4.46 (±0.93) | 3.54 × 10⁻¹⁰ |
| Triglycerides, mmol/L | 1.45 (±0.66) | 1.07 (±0.31) | 8.34 × 10⁻⁹ |
| Cholesterol, mmol/L | 5.77 (±1.16) | 5.09 (±1.16) | <2 × 10⁻¹⁶ |
| AP, µkat/L | 1.16 (±0.33) | 1.12 (±0.32) | 0.0025 |
| GPT, µkat/L | 0.54 (±0.35) | 0.71 (±0.45) | 1.71 × 10−08 |
| GOT, µkat/L | 0.34 (±0.14) | 0.54 (±0.26) | <2 × 10⁻¹⁶ |
| GGT, µkat/L | 0.63 (±0.68) | 0.44 (±0.38) | 2.41 × 10⁻⁸ |
| GFR, mL/min/1.73 m2 | 92.78 (±13.68) | 90.16 (±14.32) | 6.32 × 10⁻⁵ |
| Creatinine, µmol/L | 69.09 (±13.47) | 71.69 (±14.19) | 1.93 × 10⁻⁵ |
| Urea, mmol/L | 4.73 (±1.22) | 3.30 (±1.27) | <2 × 10⁻¹⁶ |
| Uric acid, µmol/L | 358.9 (±83.64) | 533.6 (±133.6) | <2 × 10⁻¹⁶ |
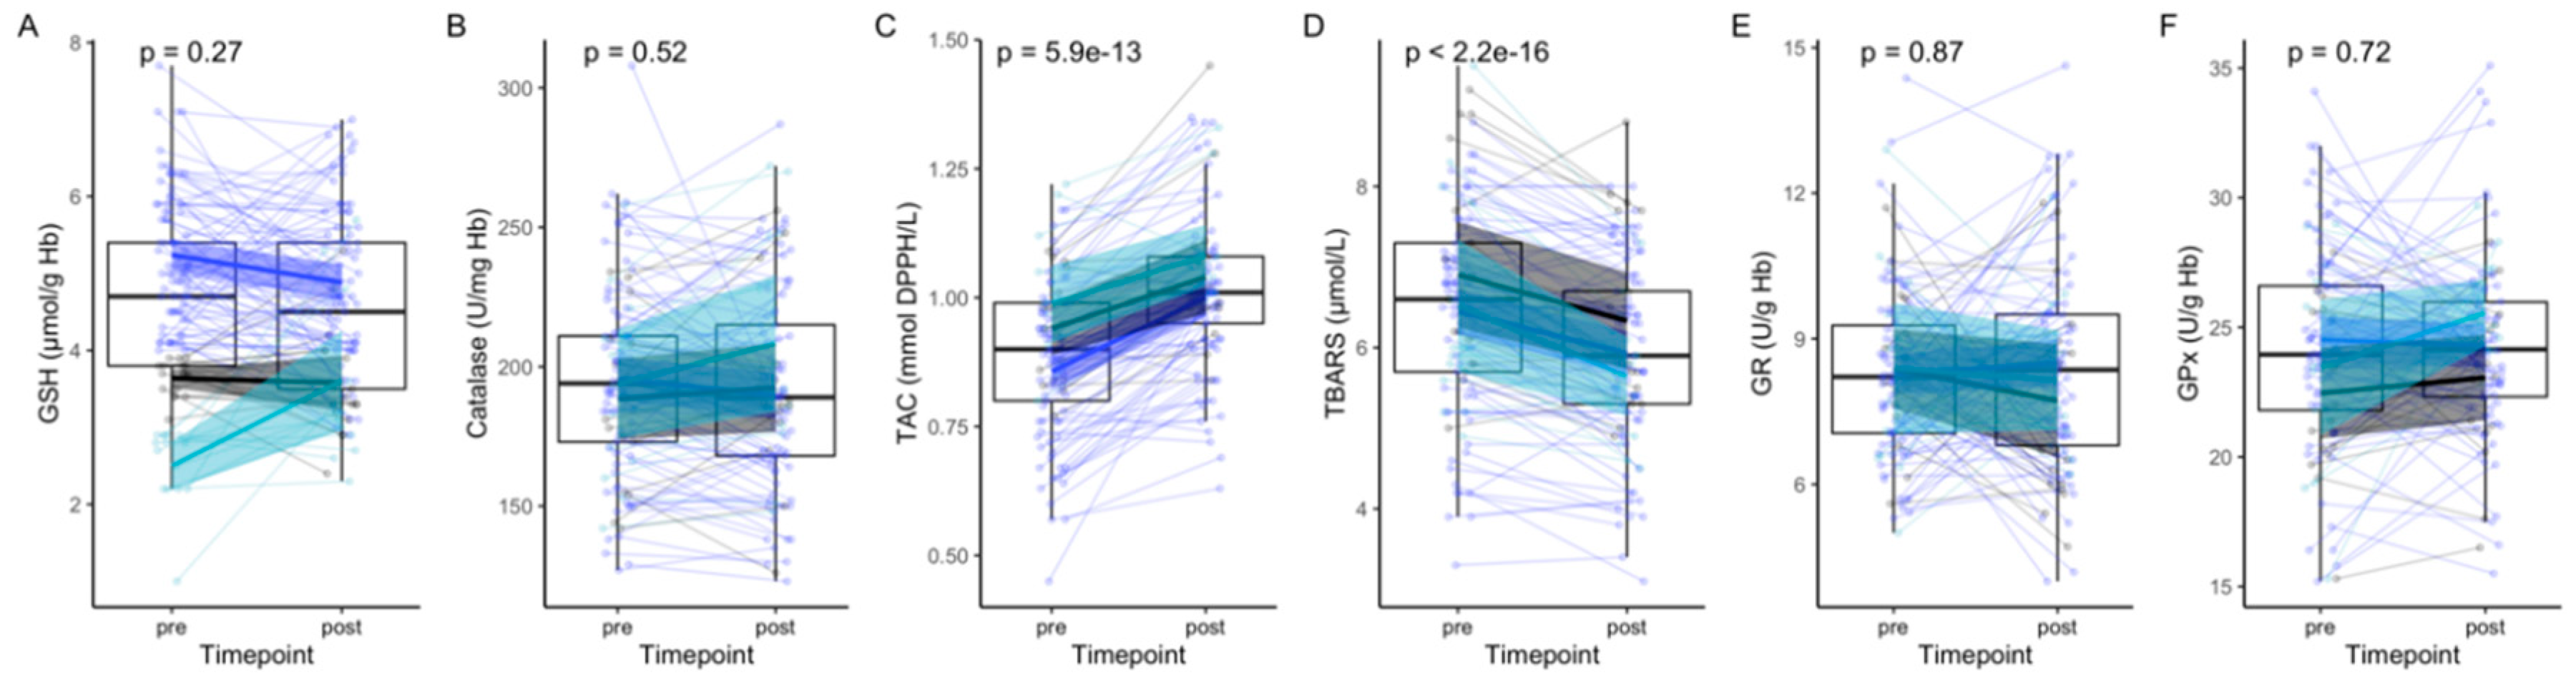
| GSH, µmol/g Hb | 4.63 (±1.3) | 4.50 (±1.2) | 0.27 |
| Catalase, U/mg Hb | 194.2 (±33.6) | 192.6 (±36.0) | 0.52 |
| TAC, mmol DPPH/L | 0.88 (±0.1) | 1.02 (±0.1) | <2 × 10⁻¹⁶ |
| TBARS, µmol/L | 6.5 (±1.3) | 6.0 (±1.1) | 5.9 × 10⁻¹³ |
| GR, U/g Hb | 8.3 (±1.8) | 8.3 (±2.1) | 0.87 |
| GPx, U/g Hb | 24.1 (±3.9) | 24.0 (±4.1) | 0.72 |
© 2020 by the authors. Licensee MDPI, Basel, Switzerland. This article is an open access article distributed under the terms and conditions of the Creative Commons Attribution (CC BY) license (http://creativecommons.org/licenses/by/4.0/).
Share and Cite
Wilhelmi de Toledo, F.; Grundler, F.; Goutzourelas, N.; Tekos, F.; Vassi, E.; Mesnage, R.; Kouretas, D. Influence of Long-Term Fasting on Blood Redox Status in Humans. Antioxidants 2020, 9, 496. https://doi.org/10.3390/antiox9060496
Wilhelmi de Toledo F, Grundler F, Goutzourelas N, Tekos F, Vassi E, Mesnage R, Kouretas D. Influence of Long-Term Fasting on Blood Redox Status in Humans. Antioxidants. 2020; 9(6):496. https://doi.org/10.3390/antiox9060496
Chicago/Turabian StyleWilhelmi de Toledo, Françoise, Franziska Grundler, Nikolaos Goutzourelas, Fotios Tekos, Eleni Vassi, Robin Mesnage, and Demetrios Kouretas. 2020. "Influence of Long-Term Fasting on Blood Redox Status in Humans" Antioxidants 9, no. 6: 496. https://doi.org/10.3390/antiox9060496
APA StyleWilhelmi de Toledo, F., Grundler, F., Goutzourelas, N., Tekos, F., Vassi, E., Mesnage, R., & Kouretas, D. (2020). Influence of Long-Term Fasting on Blood Redox Status in Humans. Antioxidants, 9(6), 496. https://doi.org/10.3390/antiox9060496