Role of Sirt3 in Differential Sex-Related Responses to a High-Fat Diet in Mice

 , , ,
, , ,  ,
,  and
and 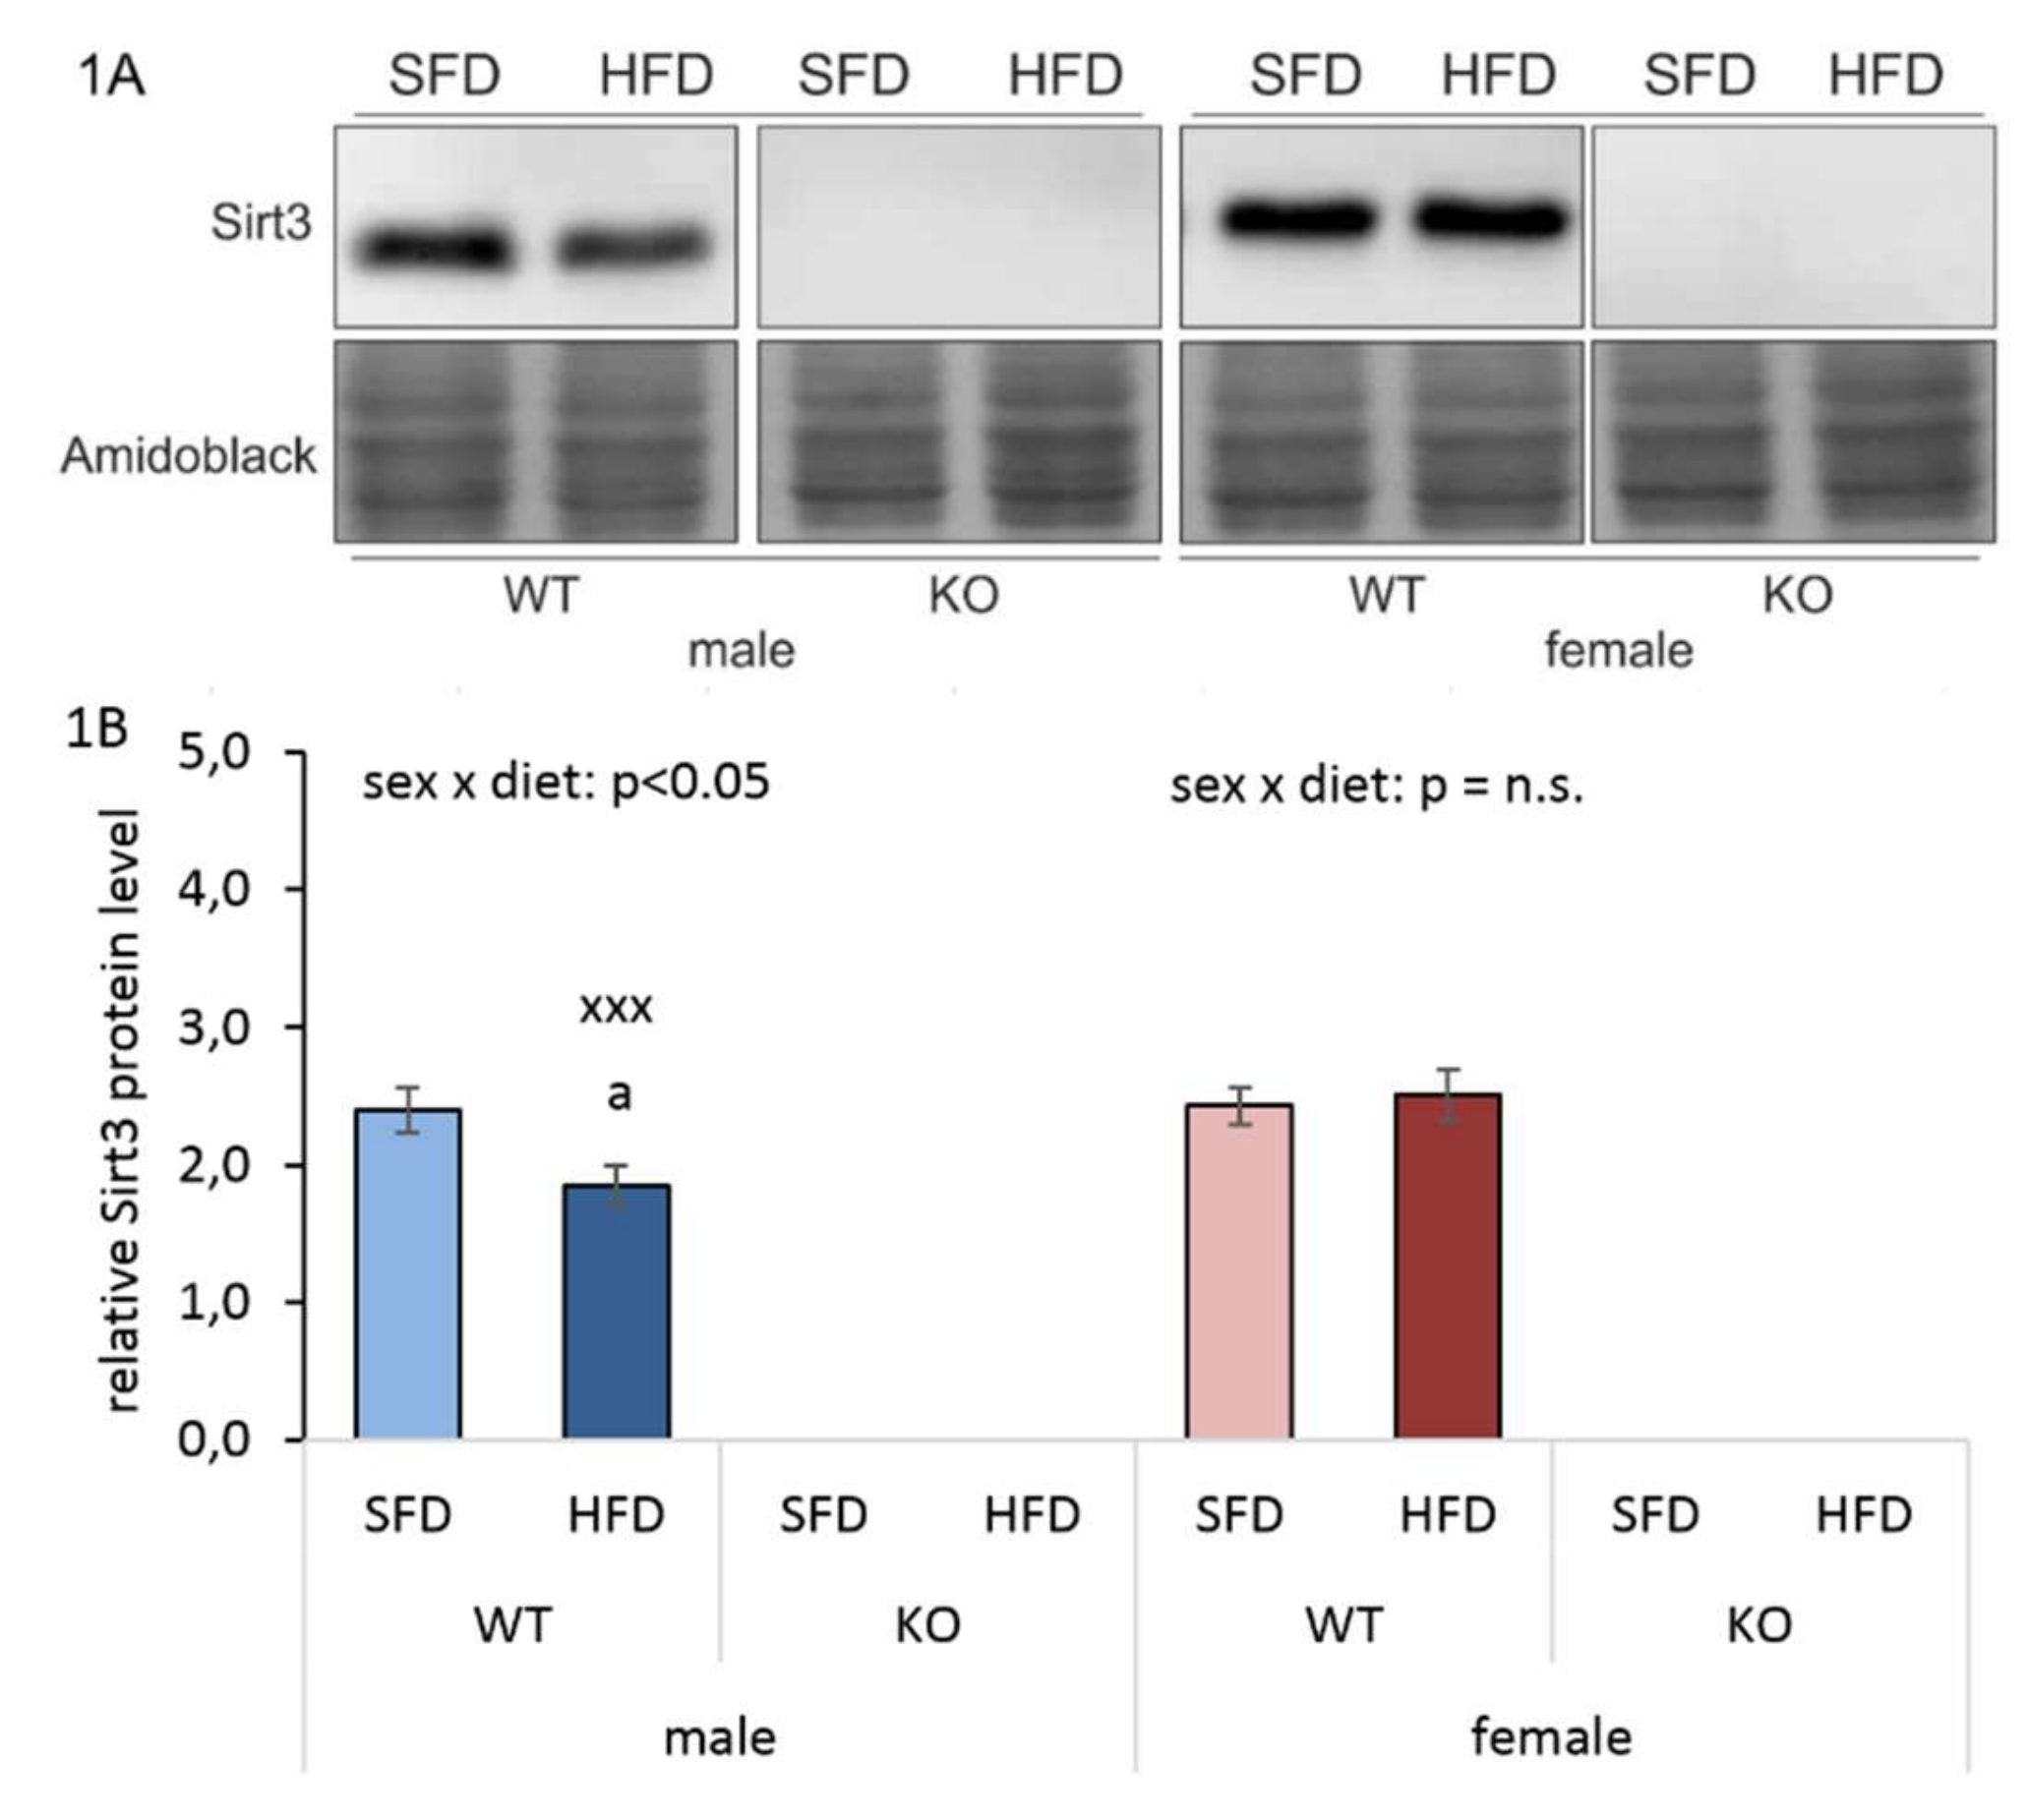
Abstract
1. Introduction
2. Materials and Methods
2.1. Animal Model and Experimental Design
2.2. Histology and Oil Red O Staining
2.3. Total Lipid Extraction
2.4. RNA Isolation and Quantitative Real-Time PCR Analysis
2.5. Protein Carbonylation
2.6. Analysis of Antioxidative Enzyme Activities
2.7. Protein Isolation and Western Blot Analysis
2.8. Mitochondria Isolation and Oxygen Consumption
2.9. PET Analysis
2.10. Statistical Analysis
3. Results
3.1. HFD Reduces Hepatic Sirt3 Protein Expression in Males Only
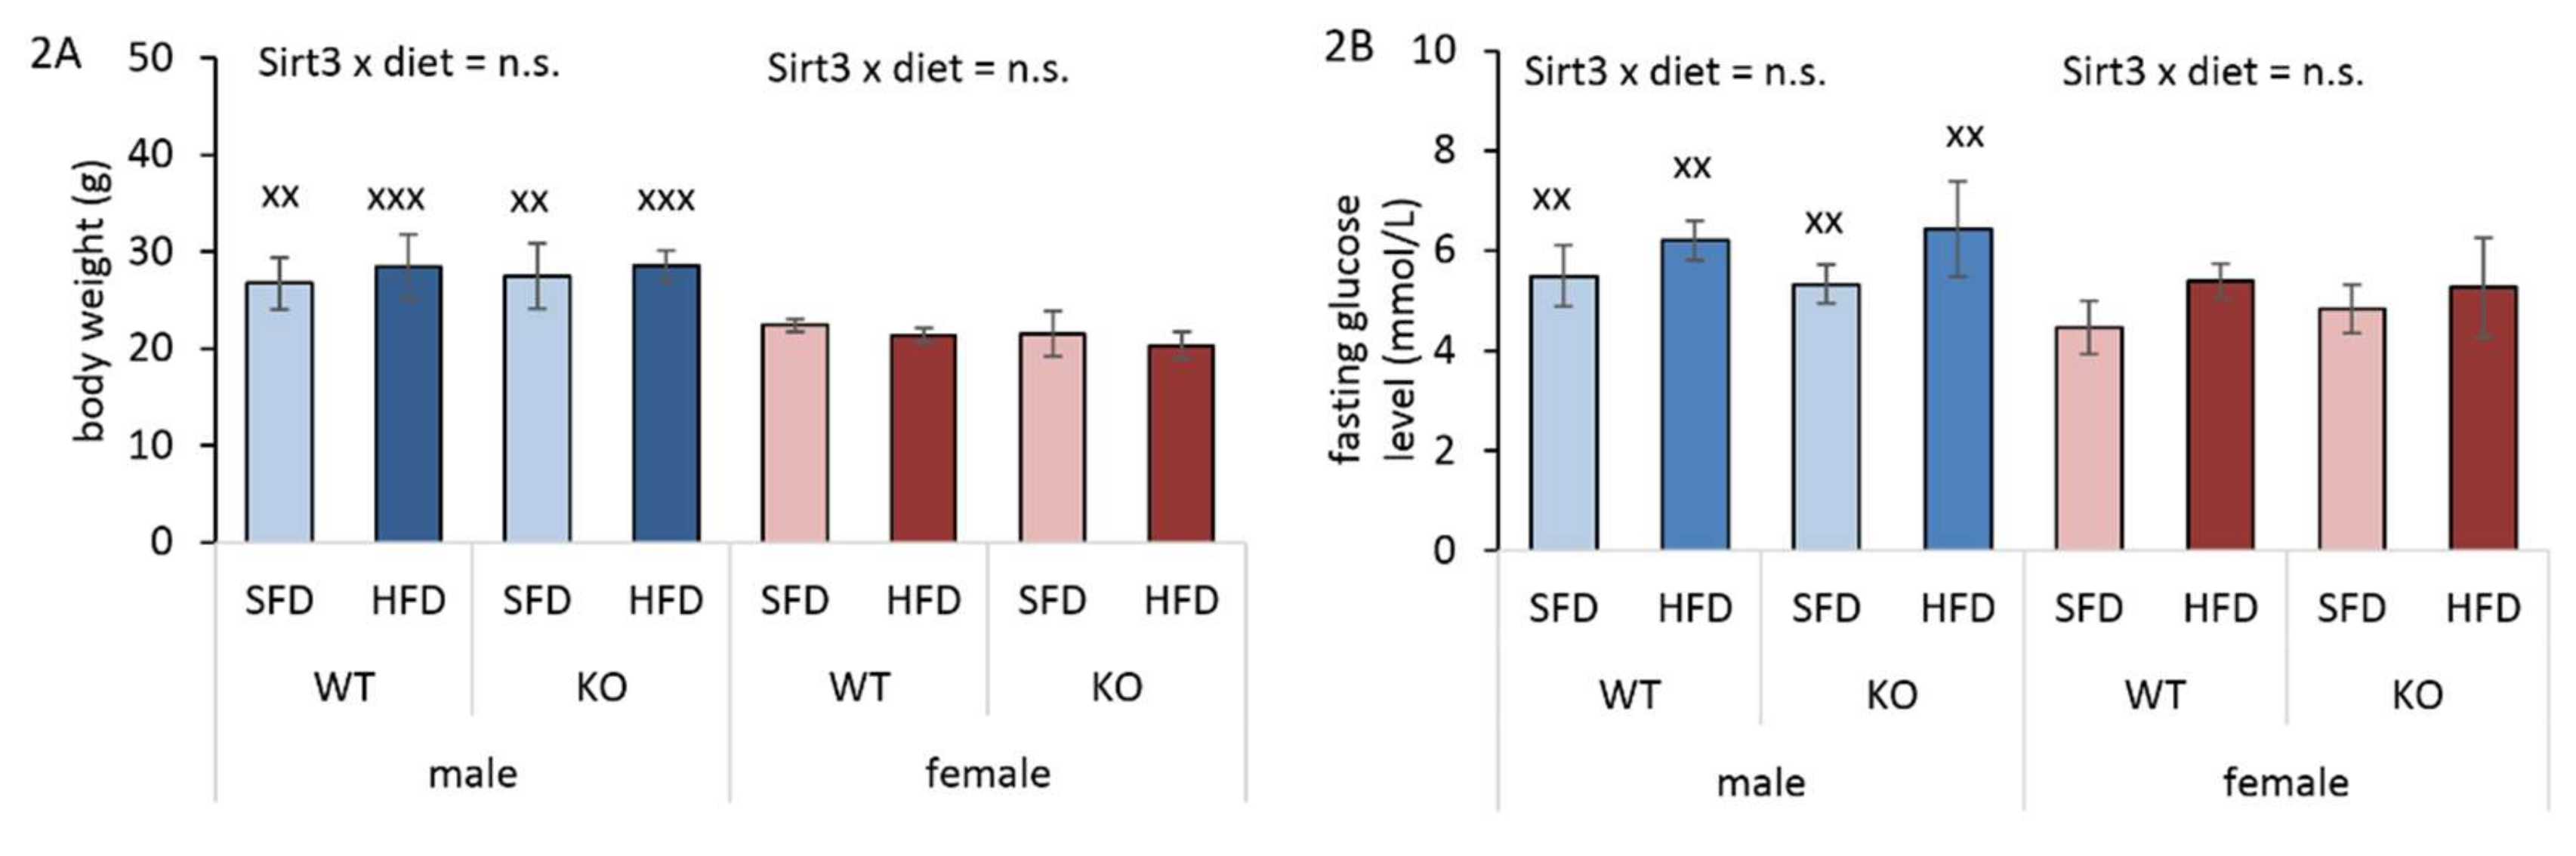
3.2. HFD Has no Infuence on Body Weight and Glucose Level
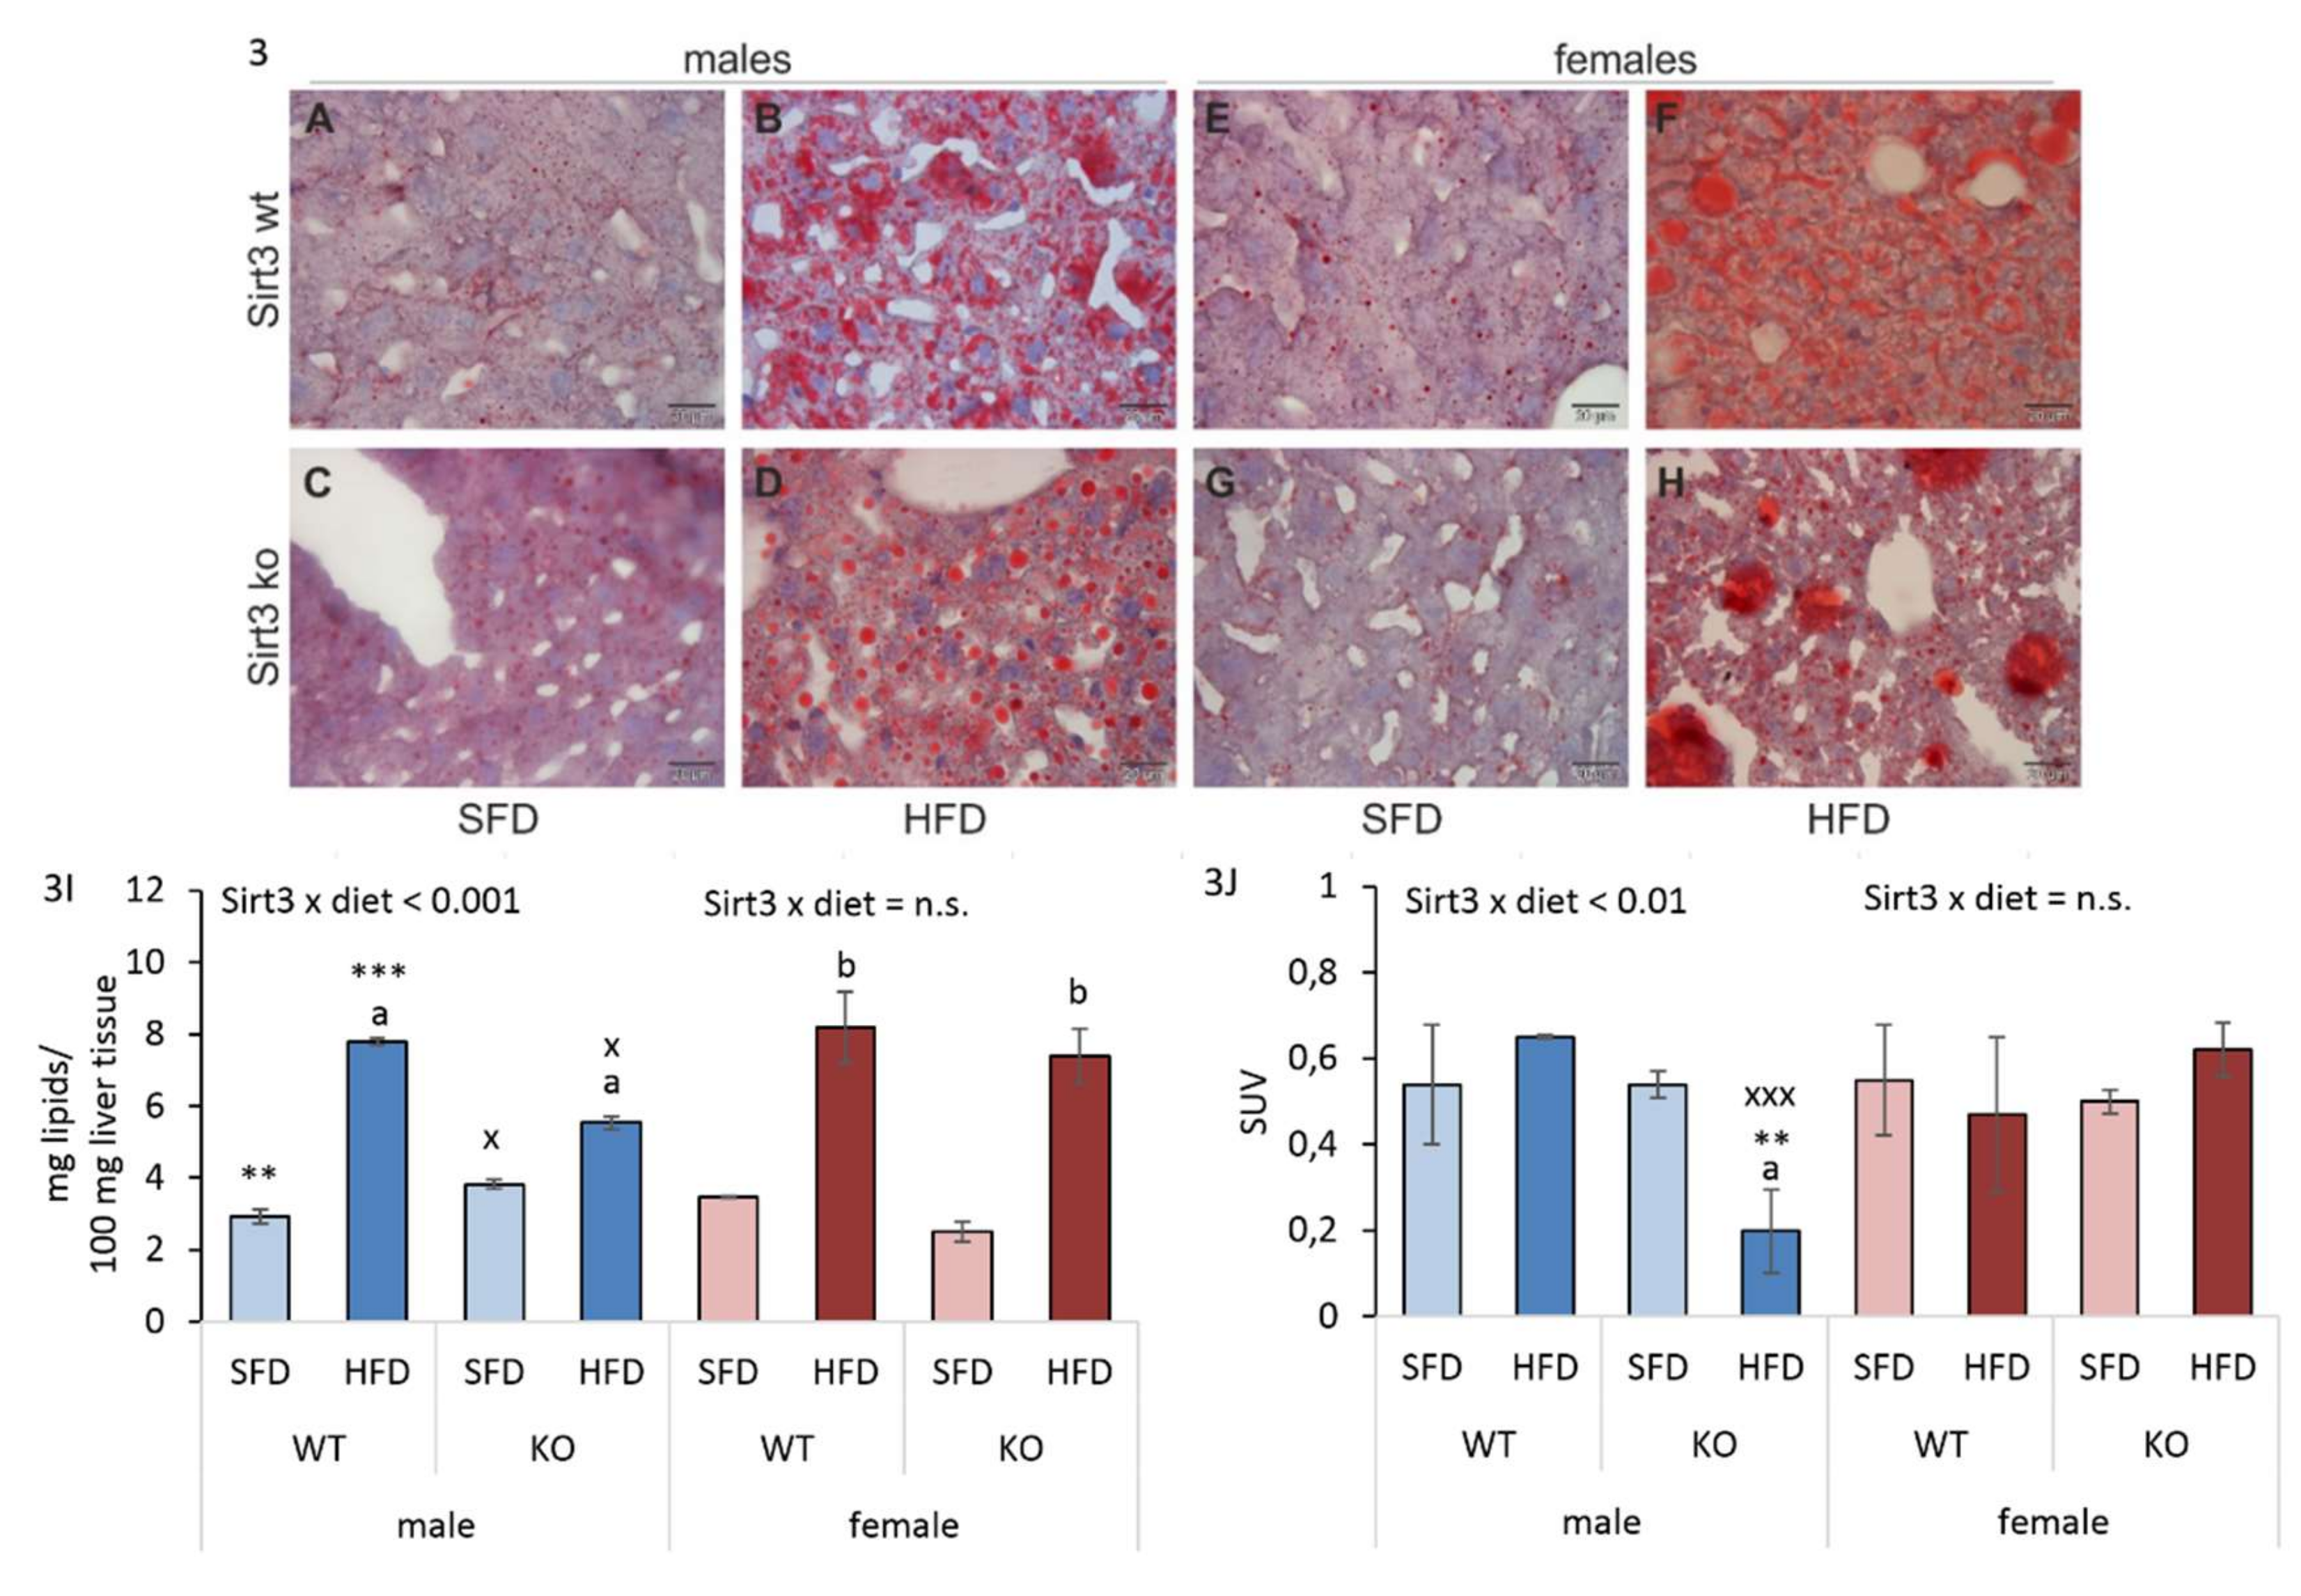
3.3. Differential Hepatic Fat Accumulation in Males Upon HFD Depends on Sirt3
3.4. HFD Reduces Hepatic Glucose Uptake in Sirt3 KO Males
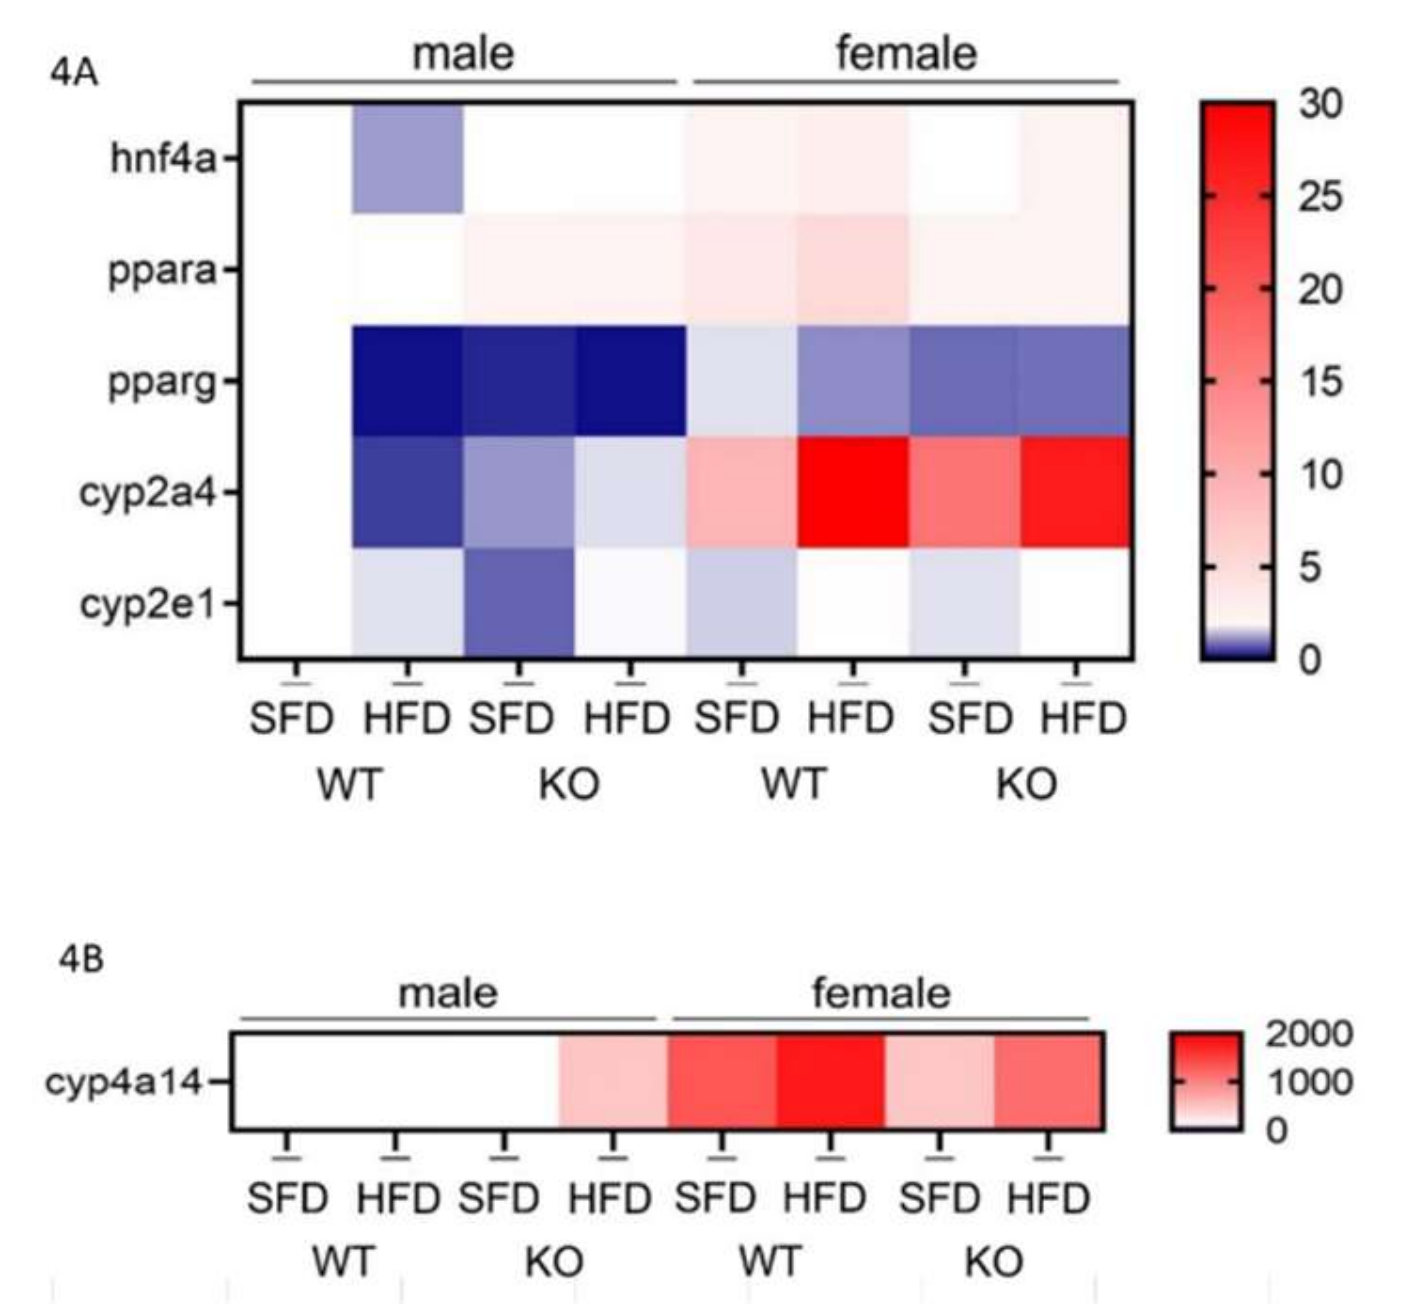
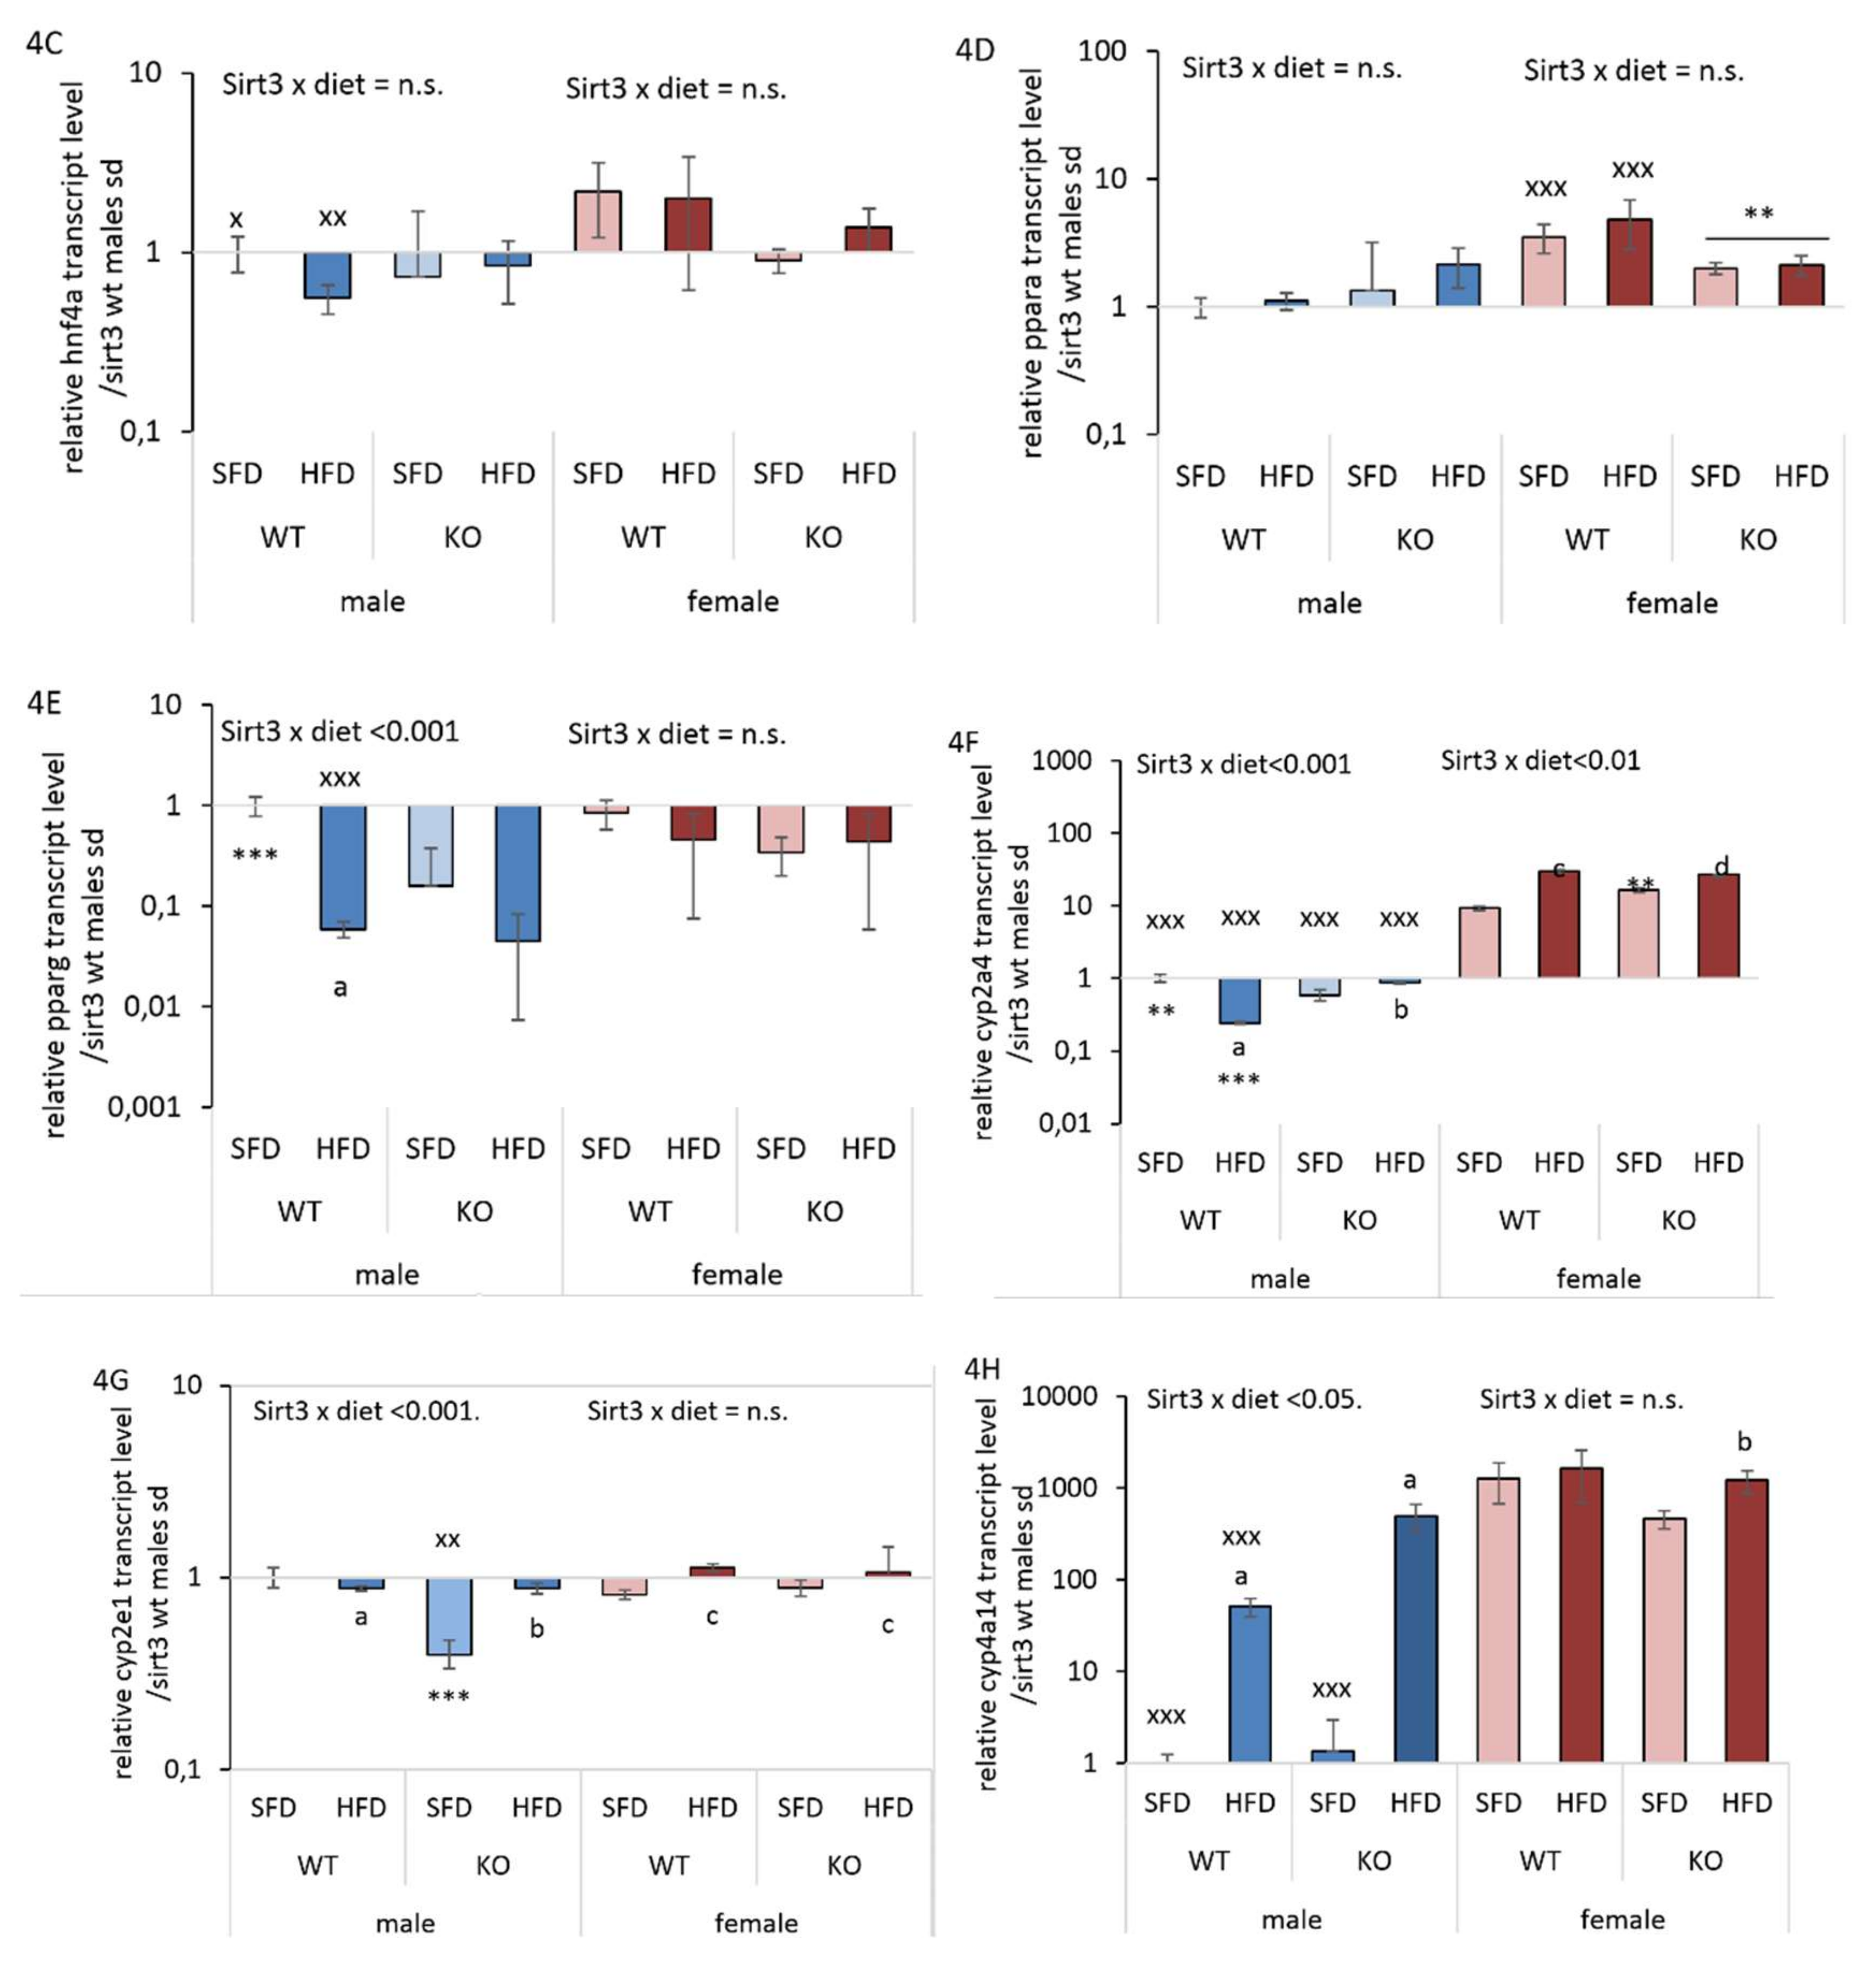
3.5. HFD Further Suppresses the Male-Specific Reduction of Hepatic hnf4α, pparα, pparγ, and cyp2a4 mRNA Level
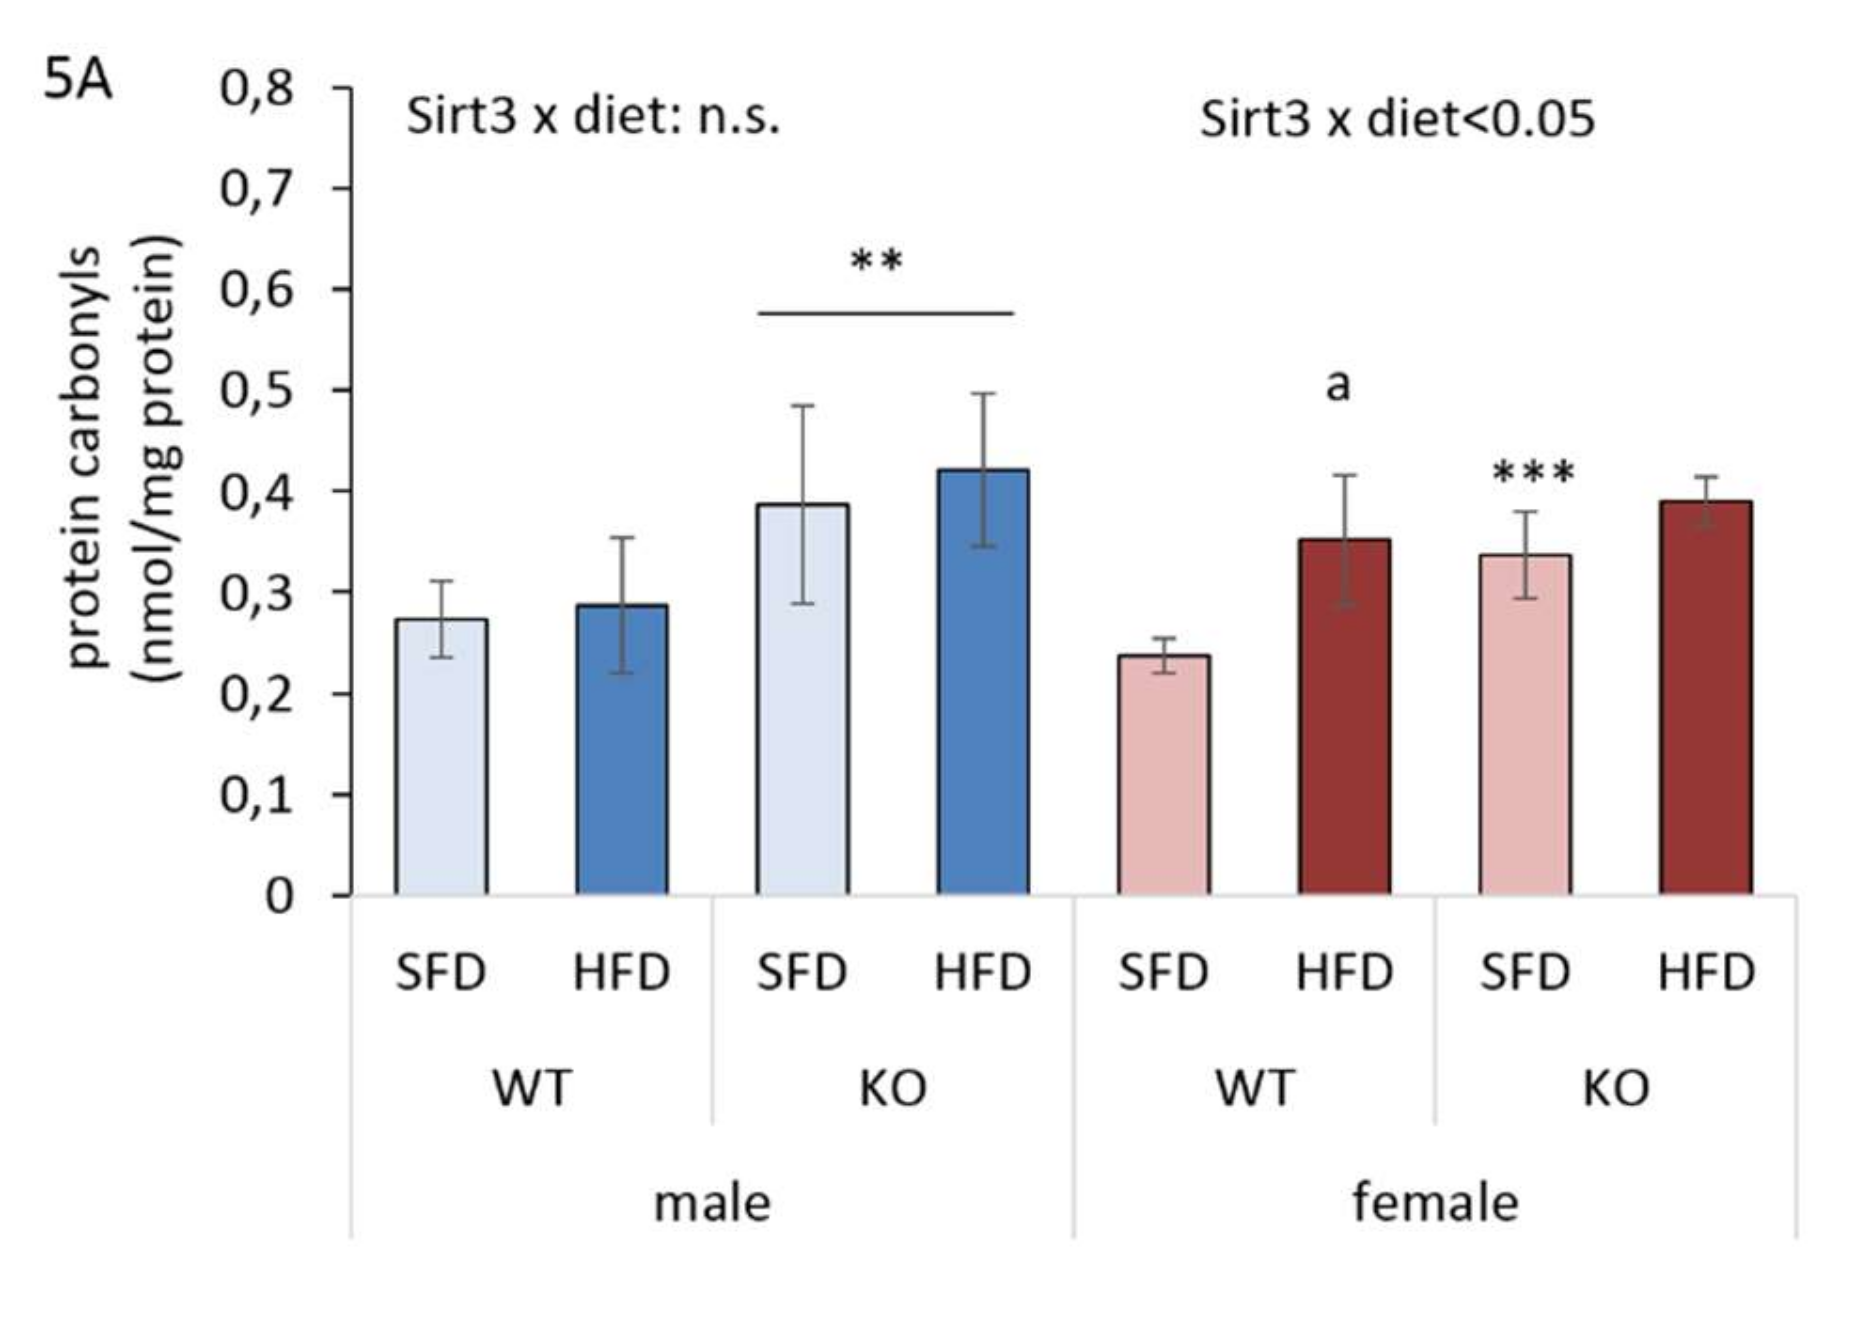
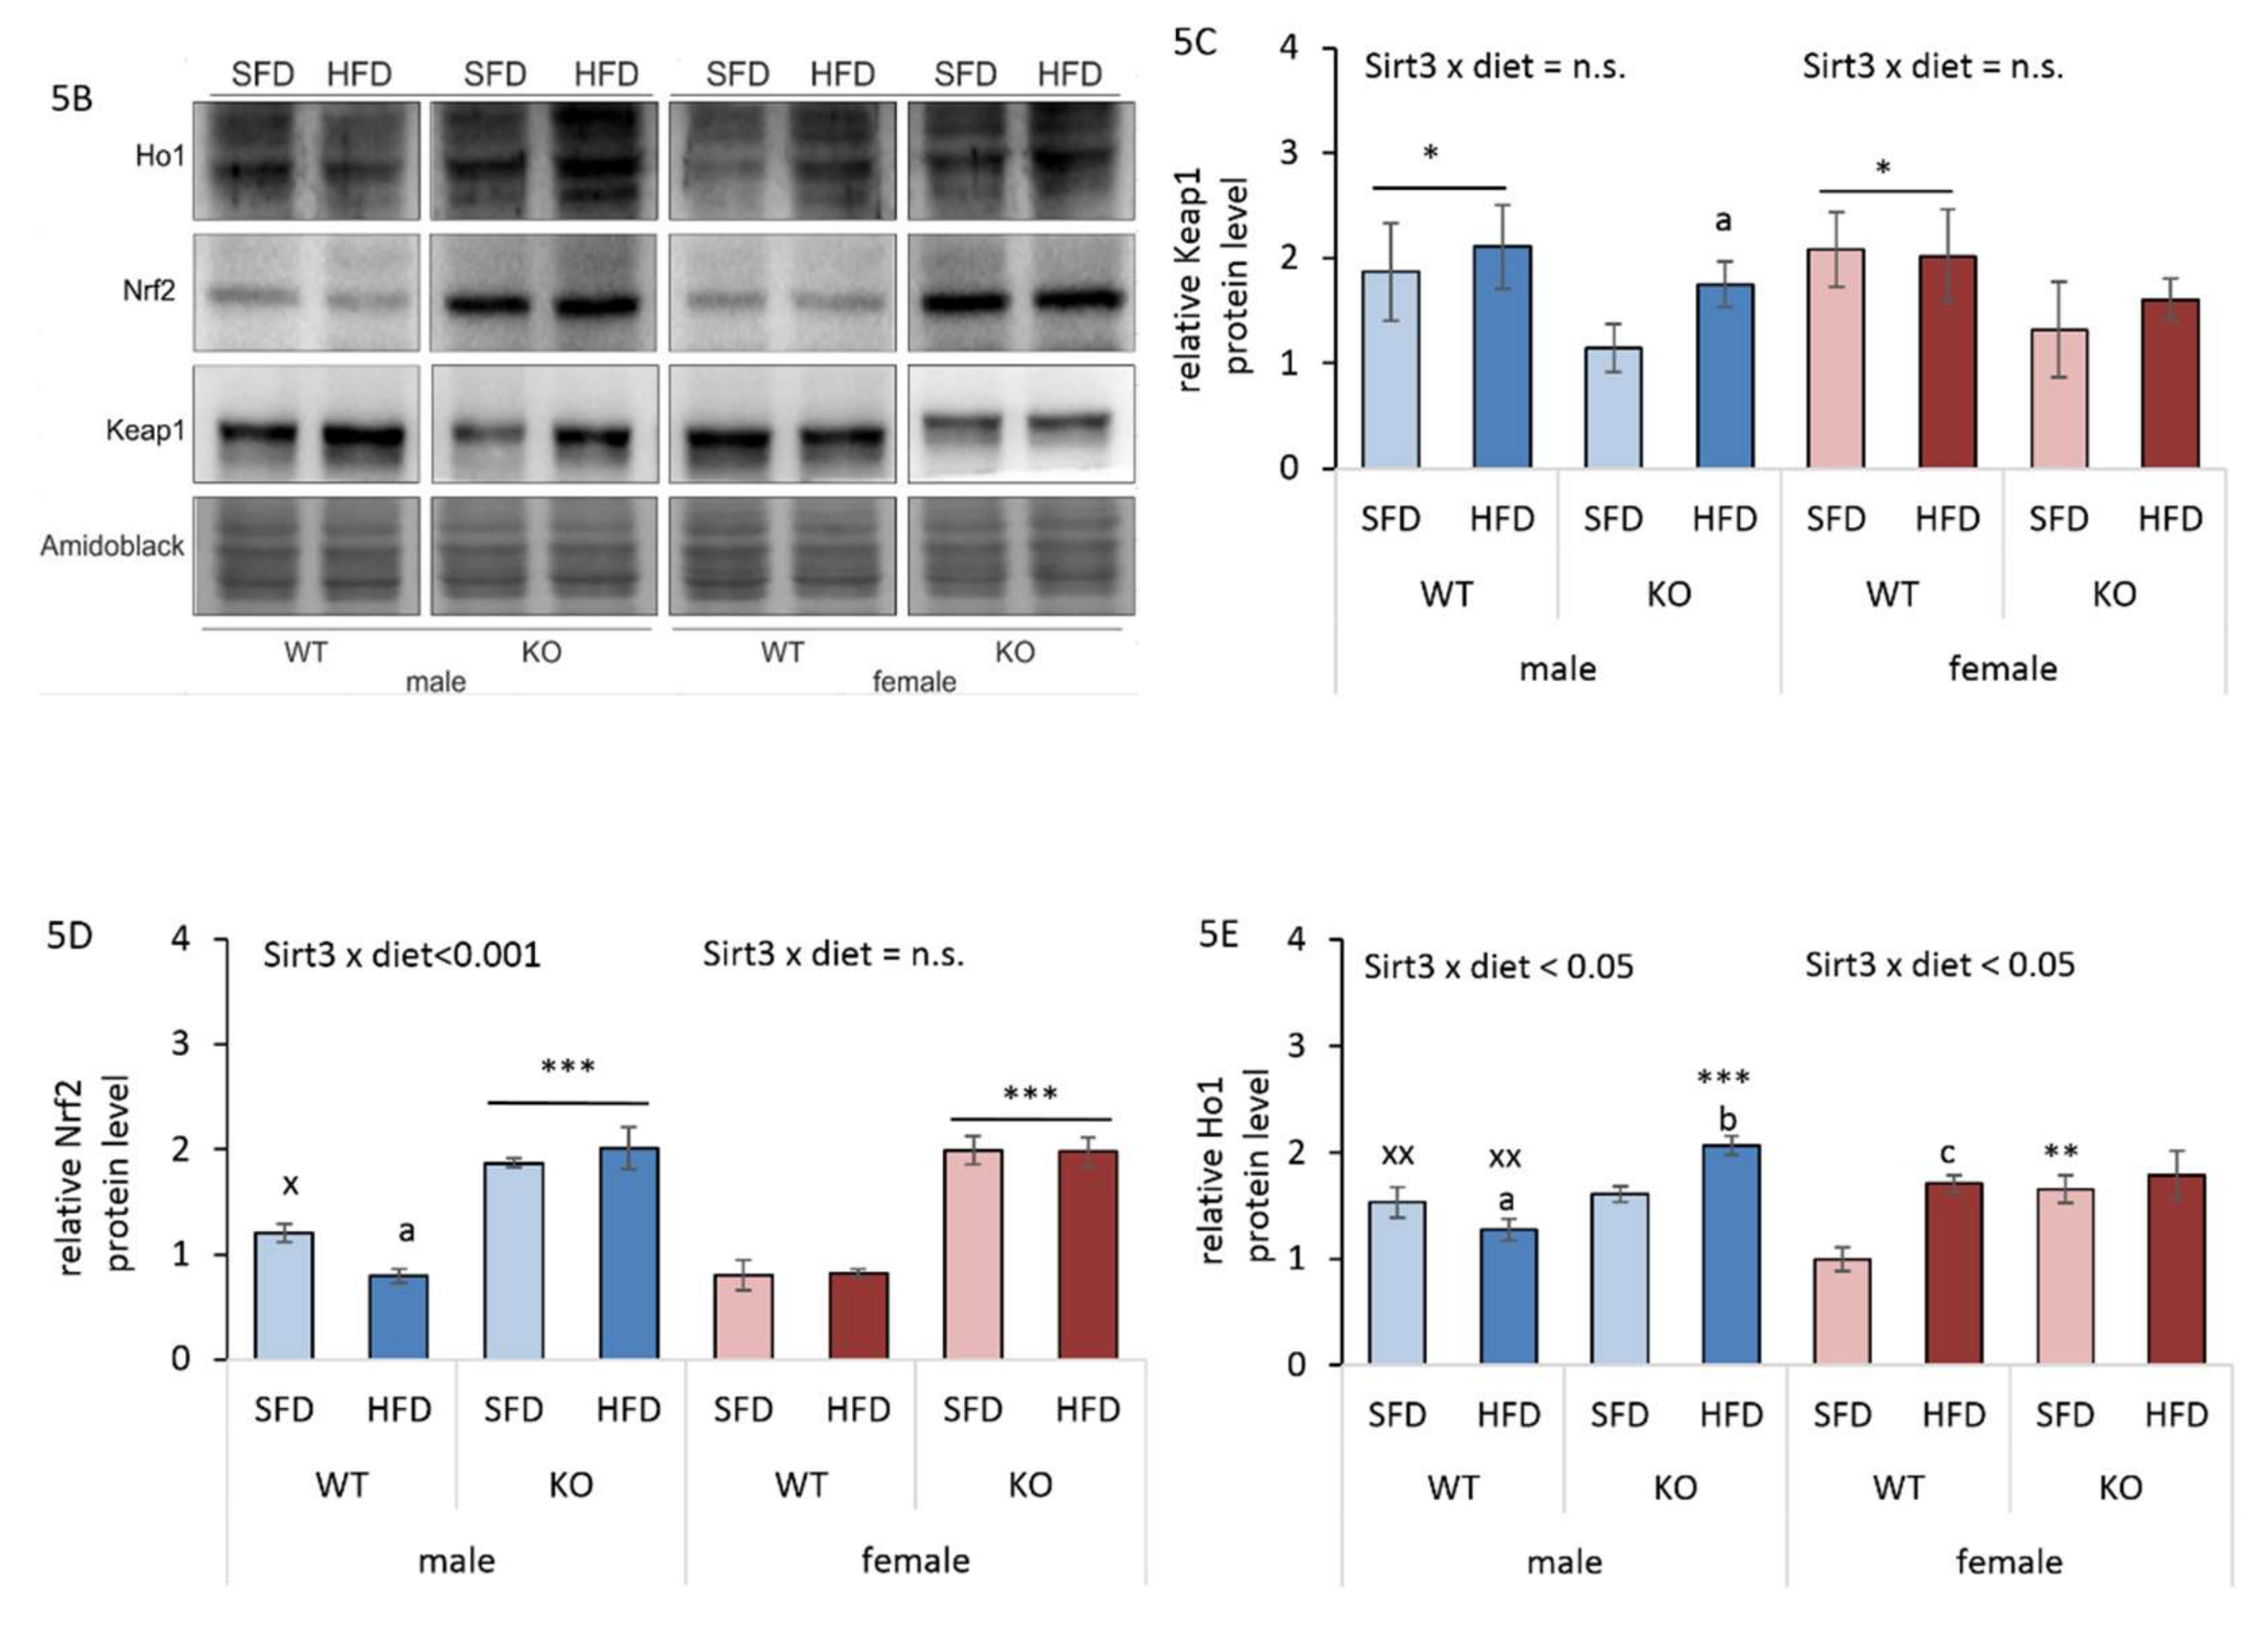
3.6. Sirt3 KO Mice Exhibit Increased Protein Oxidative Damage and Upregulated Keap1-Nrf2-Ho1 Axis in Liver
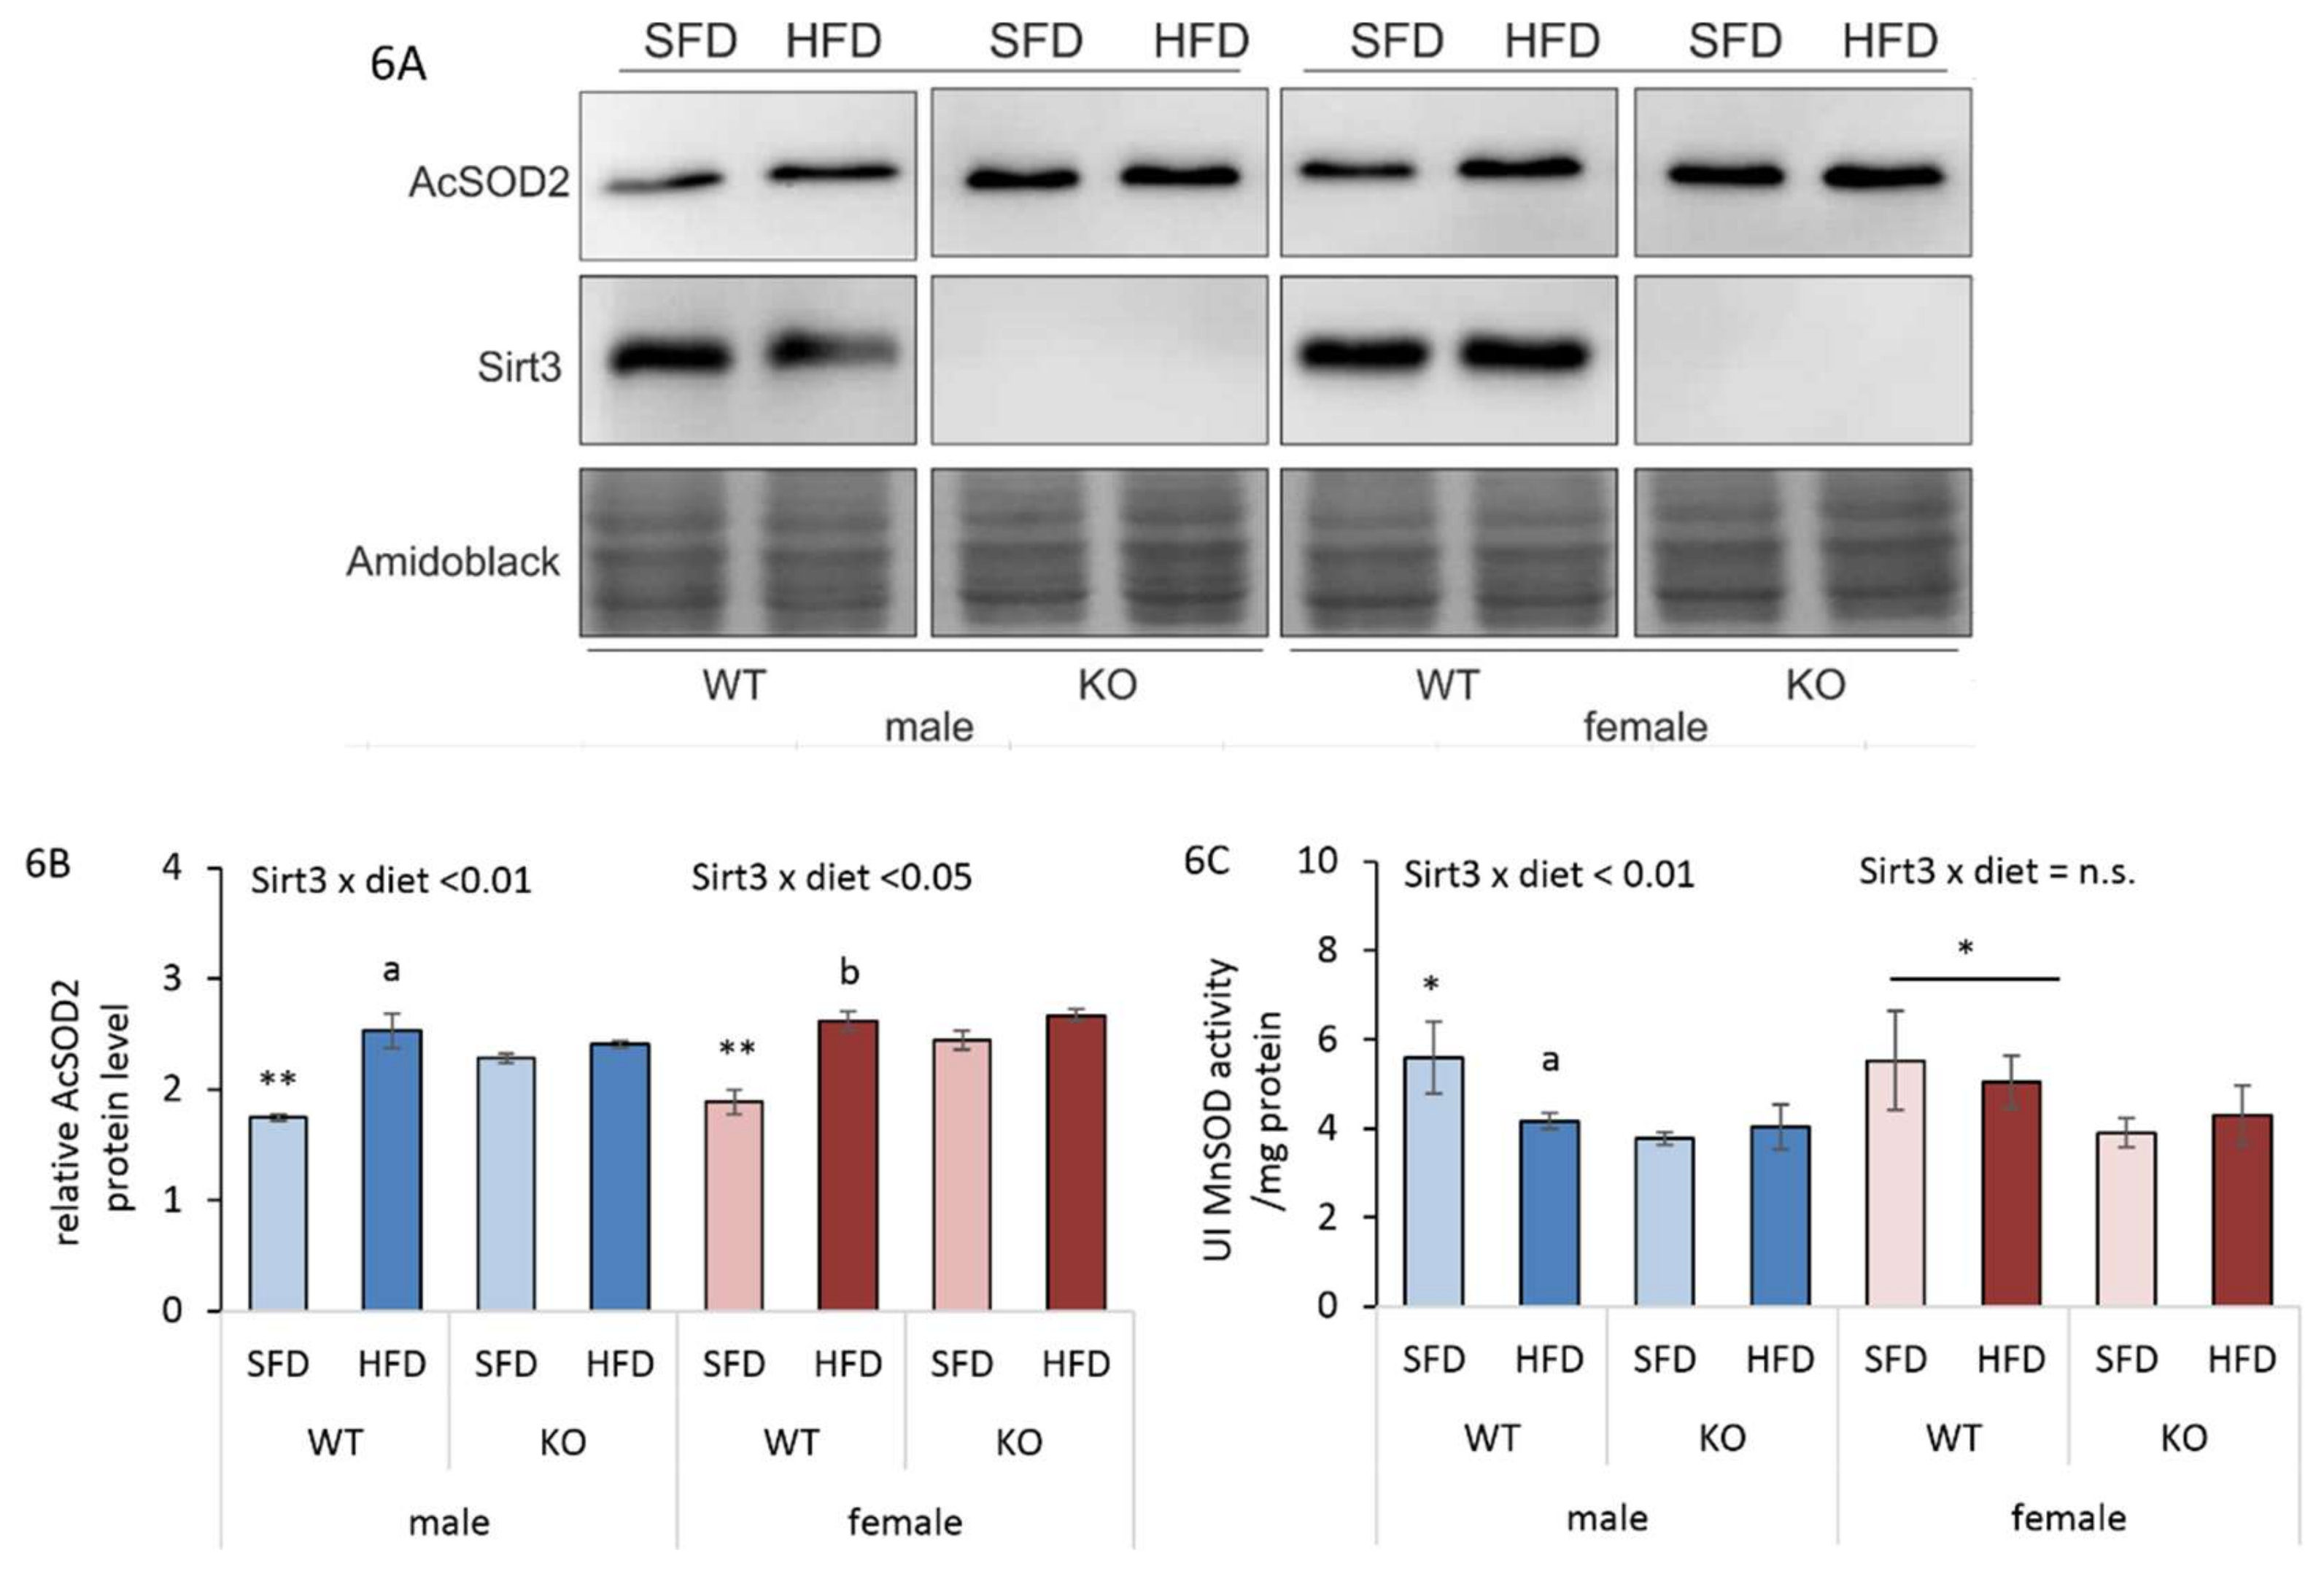
3.7. HFD-Induced Reduction in Sirt3/MnSOD Axis is Male-Specific
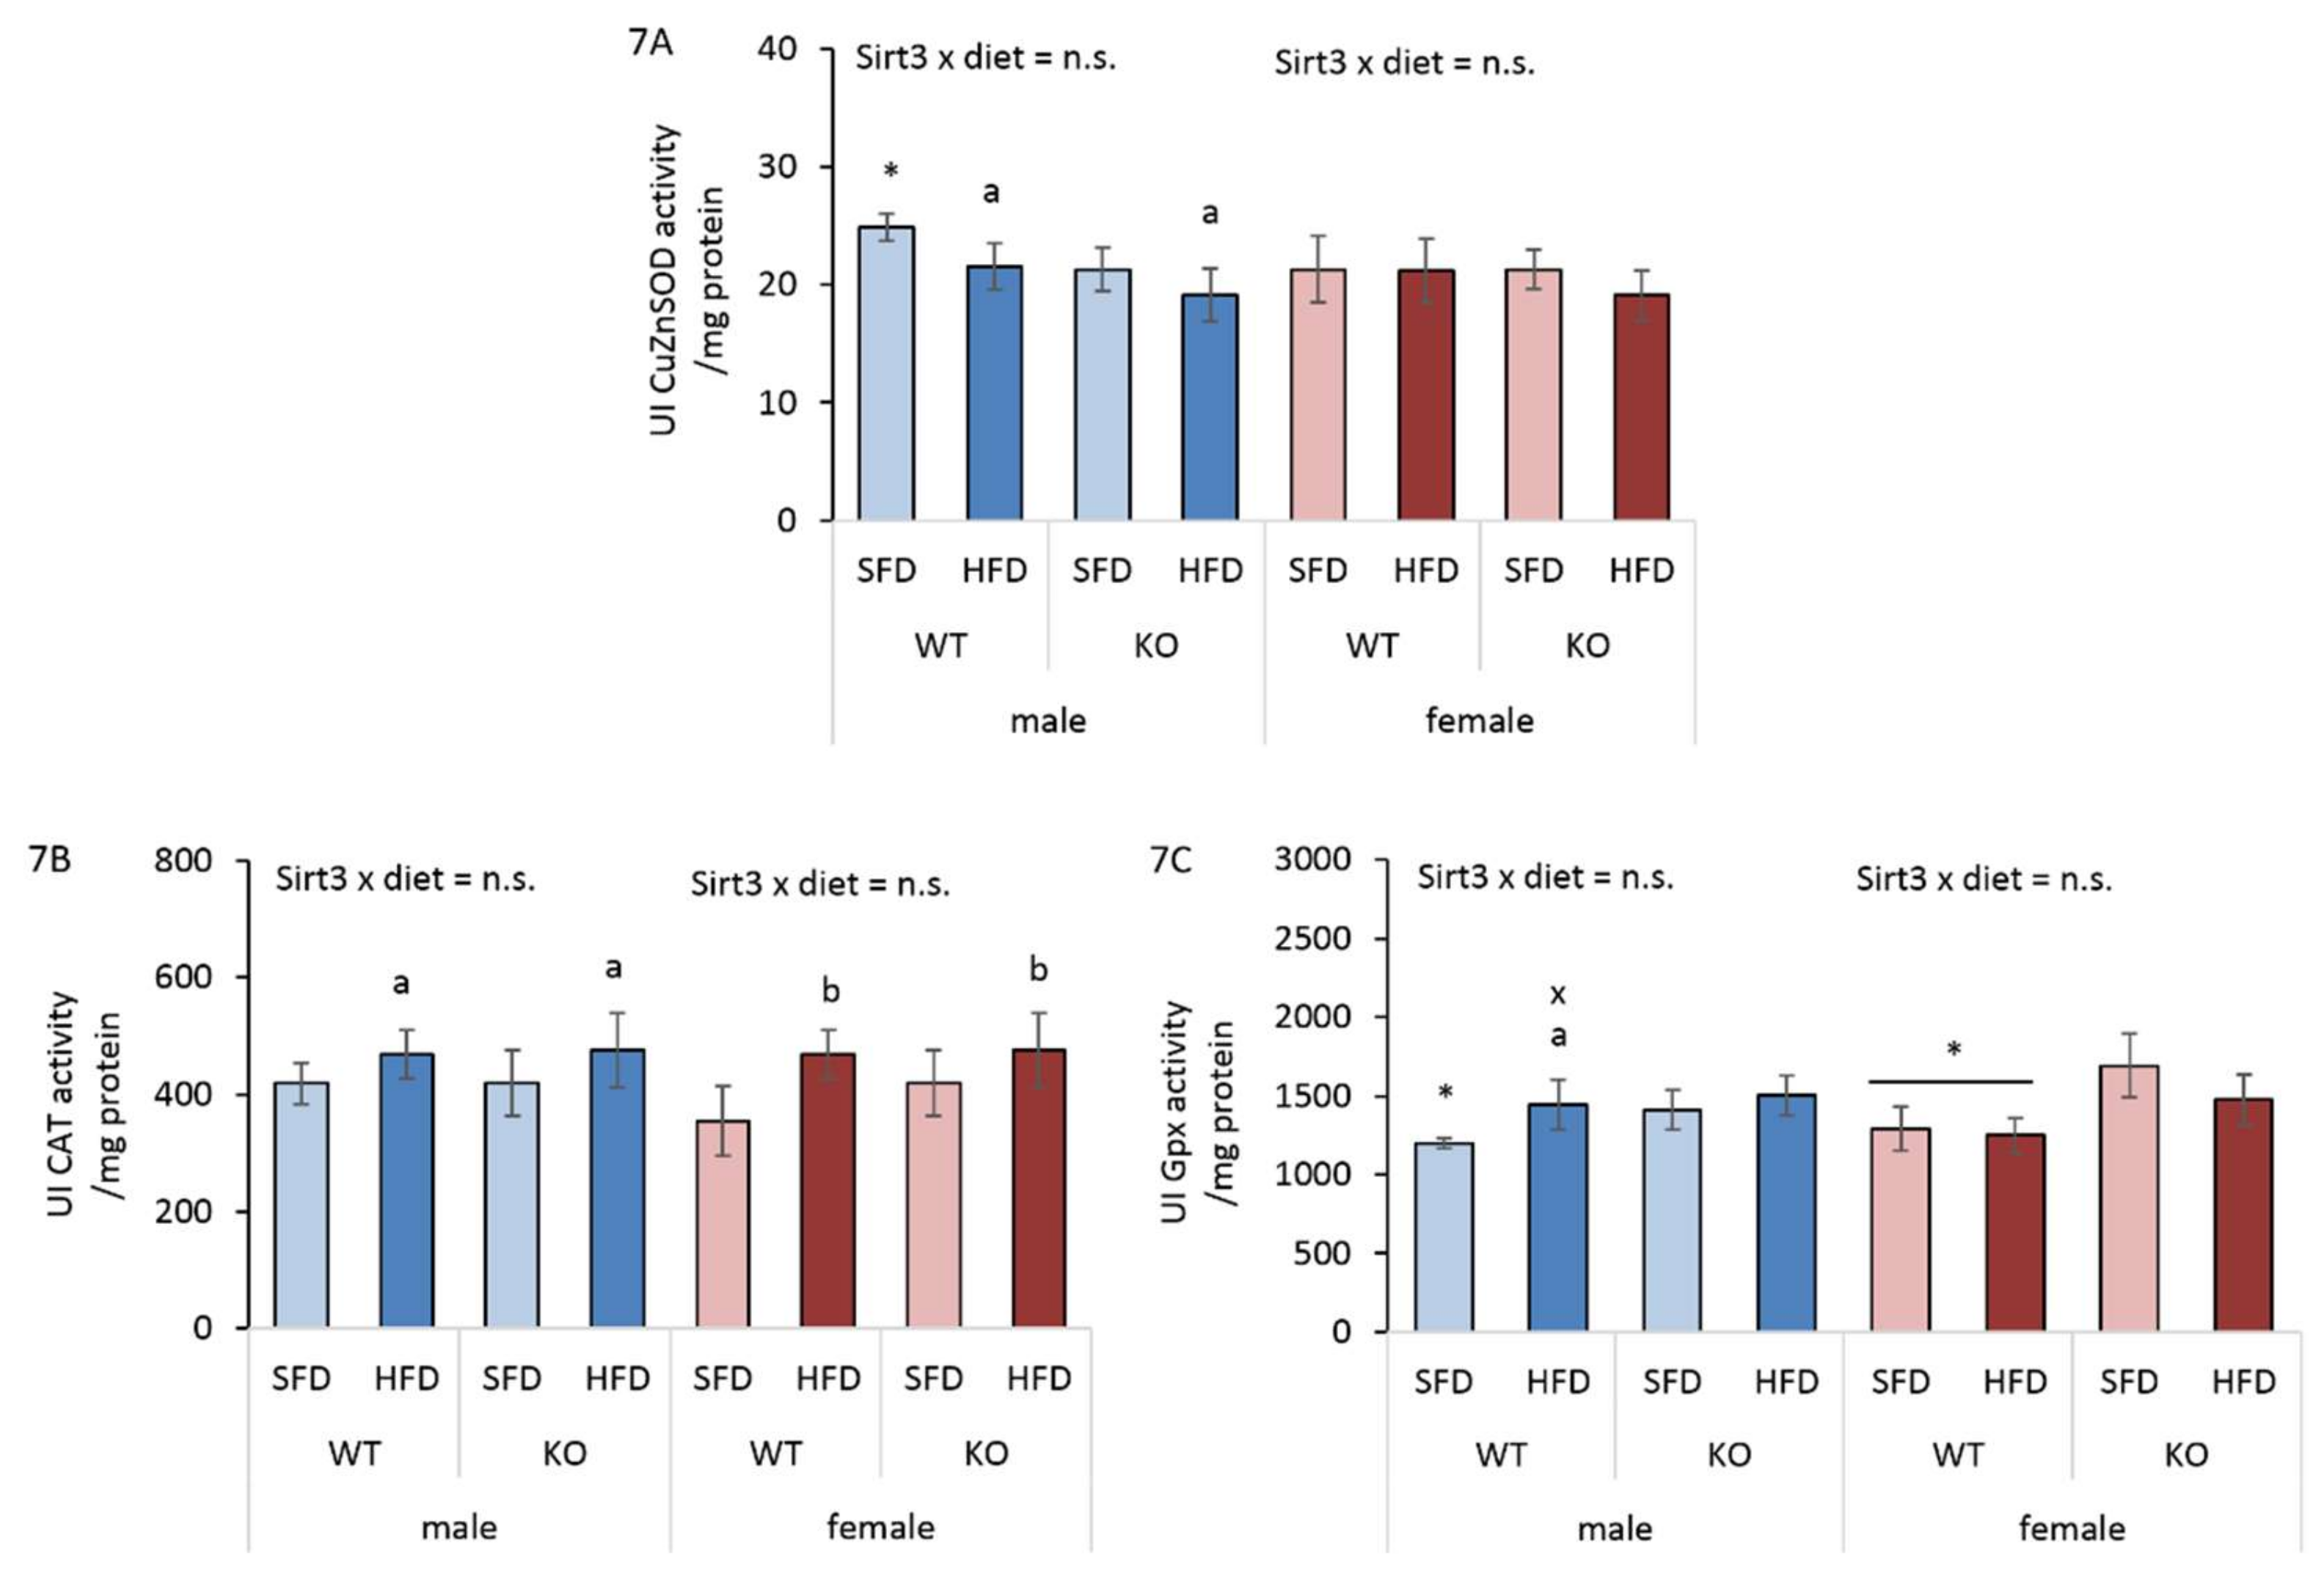
3.8. HFD Affects Antioxidant Enzyme Activities Differently in Males and Females
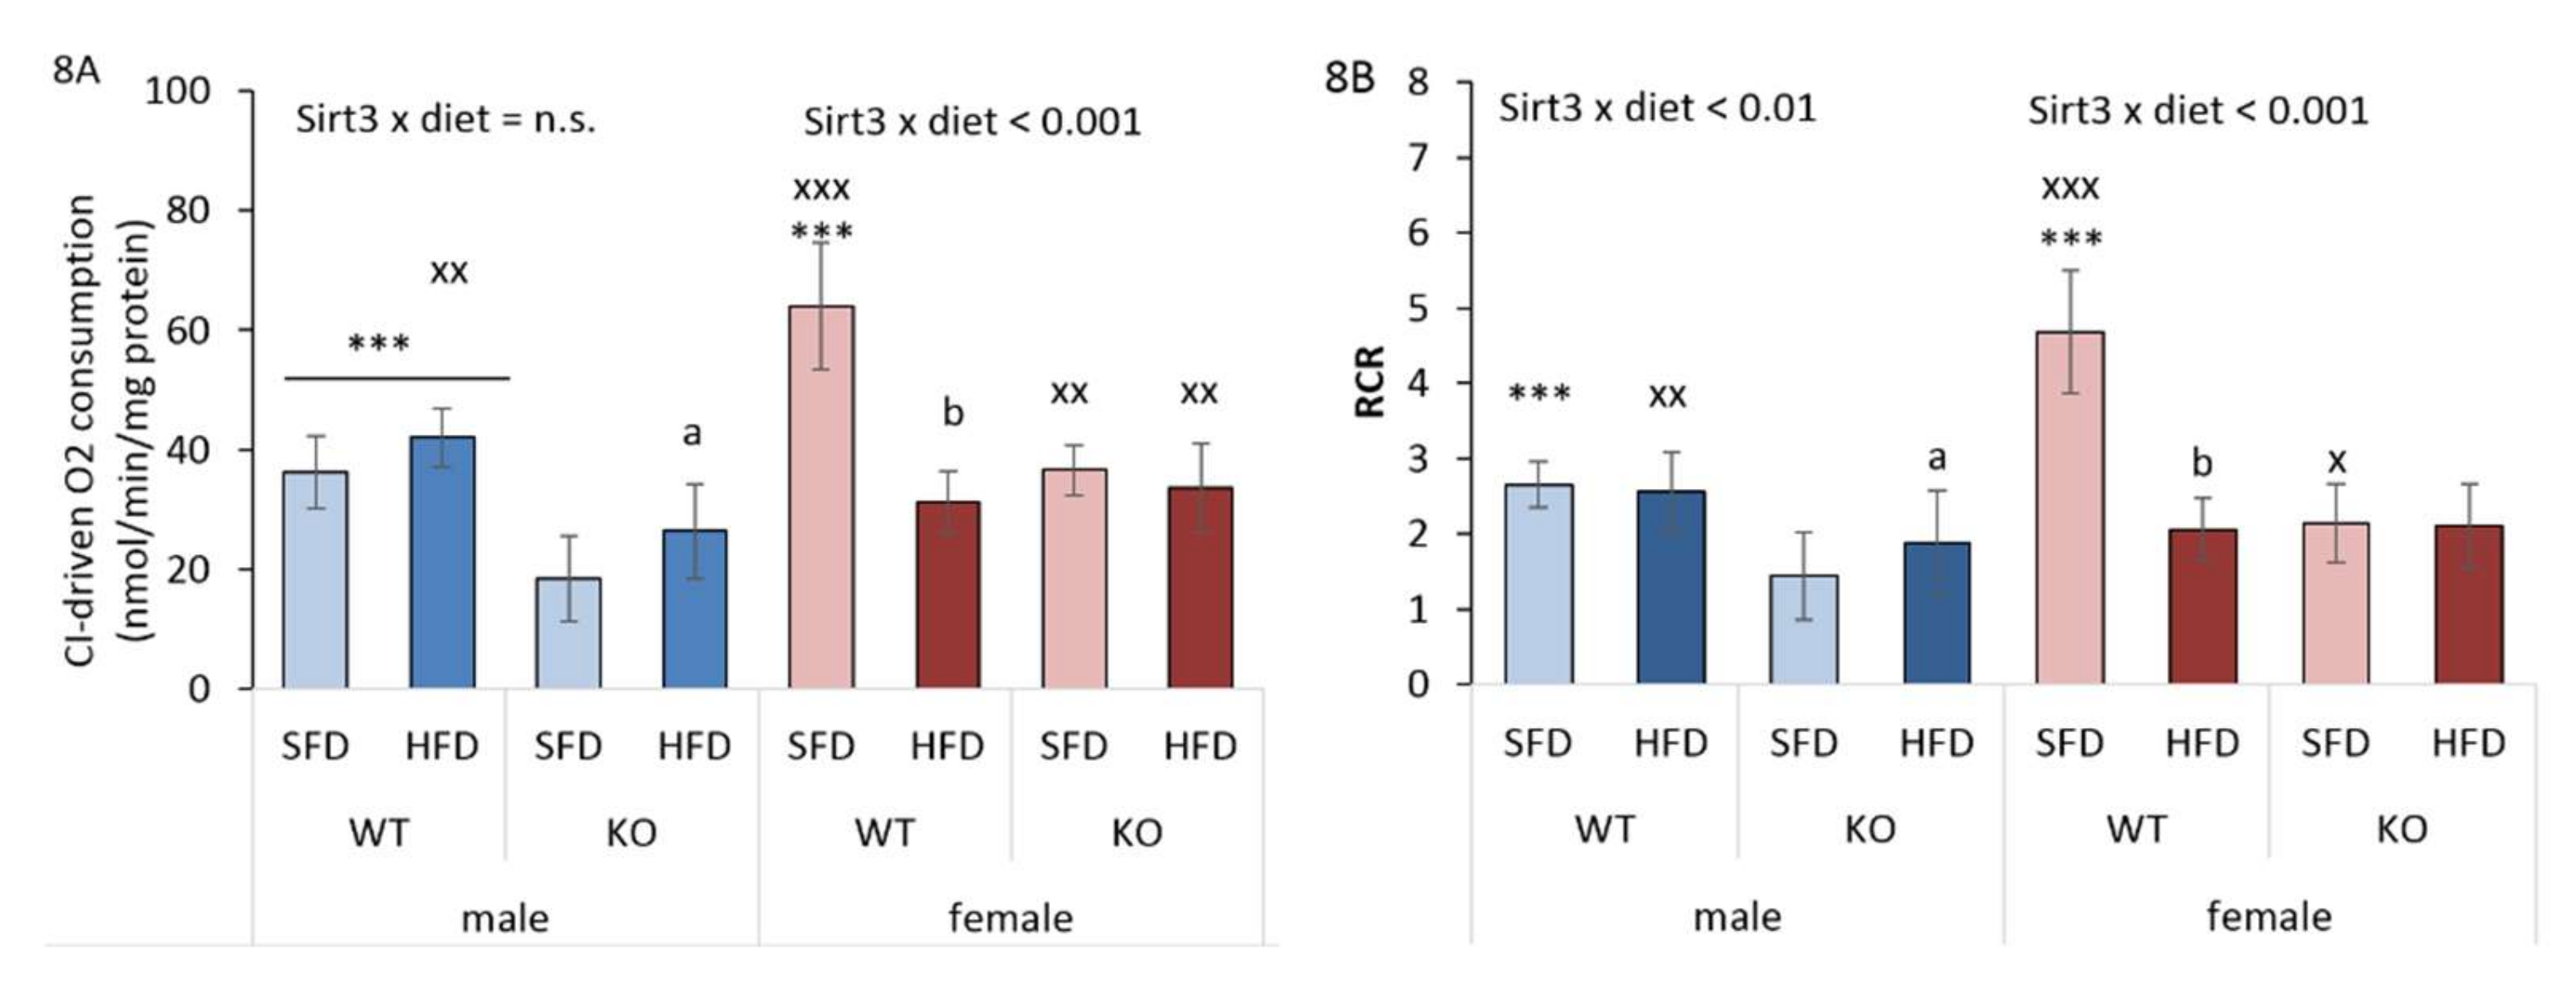
3.9. HFD and Sirt3 Depletion Affect Mitochondrial Respiration Differently in Males and Females
4. Discussion
Supplementary Materials
Author Contributions
Funding
Acknowledgments
Conflicts of Interest
References
- Bonomini, F.; Rodella, L.F.; Rezzani, R. Metabolic syndrome, aging and involvement of oxidative stress. Aging Dis. 2015, 6, 109–120. [Google Scholar] [CrossRef]
- Nunn, A.V.; Guy, G.W.; Brodie, J.S.; Bell, J.D. Inflammatory modulation of exercise salience: Using hormesis to return to a healthy lifestyle. Nutr. Metab. (Lond). 2010, 7, 87. [Google Scholar] [CrossRef] [PubMed]
- Kakimoto, P.A.; Kowaltowski, A.J. Effects of high fat diets on rodent liver bioenergetics and oxidative imbalance. Redox Biol. 2016, 8, 216–225. [Google Scholar] [CrossRef] [PubMed]
- Guarner-Lans, V.; Rubio-Ruiz, M.E.; Pérez-Torres, I.; Baños de MacCarthy, G. Relation of aging and sex hormones to metabolic syndrome and cardiovascular disease. Exp. Gerontol. 2011, 46, 517–523. [Google Scholar] [CrossRef] [PubMed]
- Lejri, I.; Grimm, A.; Eckert, A. Mitochondria, Estrogen and Female Brain Aging. Front. Aging Neurosci. 2018, 10, 124. [Google Scholar] [CrossRef]
- Beery, A.K.; Zucker, I. Sex bias in neuroscience and biomedical research. Neurosci. Biobehav. Rev. 2011, 35, 565–572. [Google Scholar] [CrossRef] [PubMed]
- Meziane, H.; Ouagazzal, A.-M.; Aubert, L.; Wietrzych, M.; Krezel, W. Estrous cycle effects on behavior of C57BL/6J and BALB/cByJ female mice: Implications for phenotyping strategies. Genes Brain Behav. 2007, 6, 192–200. [Google Scholar] [CrossRef]
- Kahle, M.; Horsch, M.; Fridrich, B.; Seelig, A.; Schultheiß, J.; Leonhardt, J.; Irmler, M.; Beckers, J.; Rathkolb, B.; Wolf, E.; et al. Phenotypic comparison of common mouse strains developing high-fat diet-induced hepatosteatosis. Mol. Metab. 2013, 2, 435–446. [Google Scholar] [CrossRef]
- Narvik, J.; Vanaveski, T.; Innos, J.; Philips, M.-A.; Ottas, A.; Haring, L.; Zilmer, M.; Vasar, E. Metabolic profile associated with distinct behavioral coping strategies of 129Sv and Bl6 mice in repeated motility test. Sci. Rep. 2018, 8, 3405. [Google Scholar] [CrossRef]
- Hirschey, M.D.; Shimazu, T.; Jing, E.; Grueter, C.A.; Collins, A.M.; Aouizerat, B.; Stančáková, A.; Goetzman, E.; Lam, M.M.; Schwer, B.; et al. SIRT3 Deficiency and Mitochondrial Protein Hyperacetylation Accelerate the Development of the Metabolic Syndrome. Mol. Cell 2011, 44, 177–190. [Google Scholar] [CrossRef]
- Bellizzi, D.; Rose, G.; Cavalcante, P.; Covello, G.; Dato, S.; De Rango, F.; Greco, V.; Maggiolini, M.; Feraco, E.; Mari, V.; et al. A novel VNTR enhancer within the SIRT3 gene, a human homologue of SIR2, is associated with survival at oldest ages. Genomics 2005, 85, 258–263. [Google Scholar] [CrossRef]
- Barja, G. Updating the Mitochondrial Free Radical Theory of Aging: An Integrated View, Key Aspects, and Confounding Concepts. Antioxid. Redox Signal. 2013, 19, 1420–1445. [Google Scholar] [CrossRef]
- Vargas-Ortiz, K.; Pérez-Vázquez, V.; Macías-Cervantes, H.M. Exercise and Sirtuins: A Way to Mitochondrial Health in Skeletal Muscle. Int. J. Mol. Sci. 2019, 20, 2717. [Google Scholar] [CrossRef]
- Brown, K.; Xie, S.; Qiu, X.; Mohrin, M.; Shin, J.; Liu, Y.; Zhang, D.; Scadden, D.T.T.; Chen, D. SIRT3 Reverses Aging-Associated Degeneration. Cell Rep. 2013, 3, 319–327. [Google Scholar] [CrossRef]
- Qiu, X.; Brown, K.; Hirschey, M.D.; Verdin, E.; Chen, D. Calorie Restriction Reduces Oxidative Stress by SIRT3-Mediated SOD2 Activation. Cell Metab. 2010, 12, 662–667. [Google Scholar] [CrossRef]
- Hebert, A.S.; Dittenhafer-Reed, K.E.; Yu, W.; Bailey, D.J.; Selen, E.S.; Boersma, M.D.; Carson, J.J.; Tonelli, M.; Balloon, A.J.; Higbee, A.J.; et al. Calorie Restriction and SIRT3 Trigger Global Reprogramming of the Mitochondrial Protein Acetylome. Mol. Cell 2013, 49, 186–199. [Google Scholar] [CrossRef]
- Calabrese, V.; Cornelius, C.; Cuzzocrea, S.; Iavicoli, I.; Rizzarelli, E.; Calabrese, E.J. Hormesis, cellular stress response and vitagenes as critical determinants in aging and longevity. Mol. Aspects Med. 2011, 32, 279–304. [Google Scholar] [CrossRef]
- Ways, P.; Hanahan, D.J. Characterization and quantification of red cell lipids in normal man. J. Lipid Res. 1964, 5, 318–328. [Google Scholar]
- Aebi, H.B.T.-M. Catalase in vitro. In Oxygen Radicals in Biological Systems; Academic Press: Cambridge, MA, USA, 1984; Volume 105, pp. 121–126. ISBN 0076-6879. [Google Scholar]
- Paglia, D.E.; Valentine, W.N. Studies on the quantitative and qualitative characterization of erythrocyte glutathione peroxidase. J. Lab. Clin. Med. 1967, 70, 158–169. [Google Scholar]
- Šarić, A.; Crnolatac, I.; Bouillaud, F.; Sobočanec, S.; Mikecin, A.M.; Mačak Šafranko, Ž.; Delgeorgiev, T.; Piantanida, I.; Balog, T.; Petit, P.X. Non-toxic fluorescent phosphonium probes to detect mitochondrial potential. Methods Appl. Fluoresc. 2017, 5, 15007. [Google Scholar] [CrossRef] [PubMed]
- Fueger, B.J.; Czernin, J.; Hildebrandt, I.; Tran, C.; Halpern, B.S.; Stout, D.; Phelps, M.E.; Weber, W.A. Impact of Animal Handling on the Results of 18F-FDG PET Studies in Mice. J. Nucl. Med. 2006, 47, 999–1006. [Google Scholar]
- Šaric, A.; Sobočanec, S.; Mačak Šafranko, Ž.; Popović Hadžija, M.; Bagarić, R.; Farkaš, V.; Švarc, A.; Marotti, T.; Balog, T. Diminished Resistance to Hyperoxia in Brains of Reproductively Senescent Female CBA/H Mice. Med. Sci. Monit. Basic Res. 2015, 21, 191–199. [Google Scholar] [CrossRef]
- Jing, E.; Emanuelli, B.; Hirschey, M.D.; Boucher, J.; Lee, K.Y.; Lombard, D.; Verdin, E.M.; Kahn, C.R. Sirtuin-3 (Sirt3) regulates skeletal muscle metabolism and insulin signaling via altered mitochondrial oxidation and reactive oxygen species production. Proc. Natl. Acad. Sci. USA 2011, 108, 14608–14613. [Google Scholar] [CrossRef] [PubMed]
- Patsouris, D.; Reddy, J.K.; Müller, M.; Kersten, S. Peroxisome Proliferator-Activated Receptor α Mediates the Effects of High-Fat Diet on Hepatic Gene Expression. Endocrinology 2006, 147, 1508–1516. [Google Scholar] [CrossRef] [PubMed]
- Liss, K.H.H.; Finck, B.N. PPARs and nonalcoholic fatty liver disease. Biochimie 2017, 136, 65–74. [Google Scholar] [CrossRef]
- Waxman, D.J.; Holloway, M.G. Sex differences in the expression of hepatic drug metabolizing enzymes. Mol. Pharmacol. 2009, 76, 215–228. [Google Scholar] [CrossRef] [PubMed]
- Kersten, S.; Rakhshandehroo, M.; Knoch, B.; Müller, M. Peroxisome proliferator-activated receptor alpha target genes. PPAR Res. 2010, 2010, 612089. [Google Scholar]
- Sobočanec, S.; Šarić, A.; Mačak Šafranko, Ž.; Popović Hadžija, M.; Abramić, M.; Balog, T. The role of 17β-estradiol in the regulation of antioxidant enzymes via the Nrf2-Keap1 pathway in the livers of CBA/H mice. Life Sci. 2015, 130, 57–65. [Google Scholar] [CrossRef] [PubMed]
- Kander, M.C.; Cui, Y.; Liu, Z. Gender difference in oxidative stress: A new look at the mechanisms for cardiovascular diseases. J. Cell. Mol. Med. 2017, 21, 1024–1032. [Google Scholar] [CrossRef] [PubMed]
- Tu, W.; Wang, H.; Li, S.; Liu, Q.; Sha, H. The Anti-Inflammatory and Anti-Oxidant Mechanisms of the Keap1/Nrf2/ARE Signaling Pathway in Chronic Diseases. Aging Dis. 2019, 10, 637–651. [Google Scholar] [CrossRef]
- Tyagi, A.; Nguyen, C.U.; Chong, T.; Michel, C.R.; Fritz, K.S.; Reisdorph, N.; Knaub, L.; Reusch, J.E.B.; Pugazhenthi, S. SIRT3 deficiency-induced mitochondrial dysfunction and inflammasome formation in the brain. Sci. Rep. 2018, 8, 1–16. [Google Scholar] [CrossRef] [PubMed]
- Lantier, L.; Williams, A.S.; Williams, I.M.; Yang, K.K.; Bracy, D.P.; Goelzer, M.; James, F.D.; Gius, D.; Wasserman, D.H. SIRT3 is crucial for maintaining skeletal muscle insulin action and protects against severe insulin resistance in high-fat-fed mice. Diabetes 2015, 64, 3081–3092. [Google Scholar] [CrossRef] [PubMed]
- Shi, H.; Seeley, R.J.; Clegg, D.J. Sexual differences in the control of energy homeostasis. Front. Neuroendocrinol. 2009, 30, 396–404. [Google Scholar] [CrossRef] [PubMed]
- Yang, Y.; Smith, D.L., Jr.; Keating, K.D.; Allison, D.B.; Nagy, T.R. Variations in body weight, food intake and body composition after long-term high-fat diet feeding in C57BL/6J mice. Obesity 2014, 22, 2147–2155. [Google Scholar] [CrossRef]
- Bao, J.; Scott, I.; Lu, Z.; Pang, L.; Dimond, C.C.; Gius, D.; Sack, M.N. SIRT3 is regulated by nutrient excess and modulates hepatic susceptibility to lipotoxicity. Free Radic. Biol. Med. 2010, 49, 1230–1237. [Google Scholar] [CrossRef]
- Mauvais-Jarvis, F. Gender differences in glucose homeostasis and diabetes. Physiol. Behav. 2018, 187, 20–23. [Google Scholar] [CrossRef]
- Ussar, S.; Griffin, N.W.; Bezy, O.; Fujisaka, S.; Vienberg, S.; Softic, S.; Deng, L.; Bry, L.; Gordon, J.I.; Kahn, C.R. Interactions between Gut Microbiota, Host Genetics and Diet Modulate the Predisposition to Obesity and Metabolic Syndrome. Cell Metab. 2015, 22, 516–530. [Google Scholar] [CrossRef]
- Chen, T.; Liu, J.; Li, N.; Wang, S.; Liu, H.; Li, J.; Zhang, Y.; Bu, P. Mouse SIRT3 attenuates hypertrophy-related lipid accumulation in the heart through the deacetylation of LCAD. PLoS ONE 2015, 10, e0118909. [Google Scholar] [CrossRef]
- Yang, L.; Li, Y.; Hong, H.; Chang, C.-W.; Guo, L.-W.; Lyn-Cook, B.; Shi, L.; Ning, B. Sex Differences in the Expression of Drug-Metabolizing and Transporter Genes in Human Liver. J. Drug Metab. Toxicol. 2012, 3, 1000119. [Google Scholar] [CrossRef]
- Sugii, S.; Olson, P.; Sears, D.D.; Saberi, M.; Atkins, A.R.; Barish, G.D.; Hong, S.H.; Castro, G.L.; Yin, Y.Q.; Nelson, M.C.; et al. PPARγ activation in adipocytes is sufficient for systemic insulin sensitization. Proc. Natl. Acad. Sci. USA 2009, 106, 22504–22509. [Google Scholar] [CrossRef]
- Rosen, E.D.; Sarraf, P.; Troy, A.E.; Bradwin, G.; Moore, K.; Milstone, D.S.; Spiegelman, B.M.; Mortensen, R.M. PPARγ is required for the differentiation of adipose tissue in vivo and in vitro. Mol. Cell 1999, 4, 611–617. [Google Scholar] [CrossRef]
- Krisko, A.; Radman, M. Phenotypic and genetic consequences of protein damage. PLoS Genet. 2013, 9, e1003810. [Google Scholar] [CrossRef] [PubMed]
- Rincón-Cervera, M.A.; Valenzuela, R.; Hernandez-Rodas, M.C.; Marambio, M.; Espinosa, A.; Mayer, S.; Romero, N.; Barrera Cynthia, M.S.; Valenzuela, A.; Videla, L.A. Supplementation with antioxidant-rich extra virgin olive oil prevents hepatic oxidative stress and reduction of desaturation capacity in mice fed a high-fat diet: Effects on fatty acid composition in liver and extrahepatic tissues. Nutrition 2016, 32, 1254–1267. [Google Scholar] [CrossRef] [PubMed]
- Chen, Q.; Tang, L.; Xin, G.; Li, S.; Ma, L.; Xu, Y.; Zhuang, M.; Xiong, Q.; Wei, Z.; Xing, Z.; et al. Oxidative stress mediated by lipid metabolism contributes to high glucose-induced senescence in retinal pigment epithelium. Free Radic. Biol. Med. 2019, 130, 48–58. [Google Scholar] [CrossRef] [PubMed]
- Kamalvand, G.; Pinard, G.; Ali-Khan, Z. Heme-oxygenase-1 response, a marker of oxidative stress, in a mouse model of AA amyloidosis. Amyloid 2003, 10, 151–159. [Google Scholar] [CrossRef] [PubMed]
- Flor, A.C.; Wolfgeher, D.; Wu, D.; Kron, S.J. A signature of enhanced lipid metabolism, lipid peroxidation and aldehyde stress in therapy-induced senescence. Cell Death Discov. 2017, 3, 17075. [Google Scholar] [CrossRef]
- Tahara, E.B.; Navarete, F.D.T.; Kowaltowski, A.J. Tissue-, substrate-, and site-specific characteristics of mitochondrial reactive oxygen species generation. Free Radic. Biol. Med. 2009, 46, 1283–1297. [Google Scholar] [CrossRef]
- Crescenzo, R.; Bianco, F.; Mazzoli, A.; Giacco, A.; Liverini, G.; Iossa, S. Alterations in proton leak, oxidative status and uncoupling protein 3 content in skeletal muscle subsarcolemmal and intermyofibrillar mitochondria in old rats. BMC Geriatr. 2014, 14, 79. [Google Scholar] [CrossRef]
- Aon, M.A.; Bhatt, N.; Cortassa, S. Mitochondrial and cellular mechanisms for managing lipid excess. Front. Physiol. 2014, 5, 282. [Google Scholar] [CrossRef]
- Schönfeld, P.; Reiser, G. Rotenone-like Action of the Branched-chain Phytanic Acid Induces Oxidative Stress in Mitochondria. J. Biol. Chem. 2006, 281, 7136–7142. [Google Scholar] [CrossRef]
- Schönfeld, P.; Wojtczak, L. Fatty acids decrease mitochondrial generation of reactive oxygen species at the reverse electron transport but increase it at the forward transport. Biochim. Biophys. Acta-Bioenerg. 2007, 1767, 1032–1040. [Google Scholar] [CrossRef] [PubMed]
- Hoeks, J.; Briedé, J.J.; de Vogel, J.; Schaart, G.; Nabben, M.; Moonen-Kornips, E.; Hesselink, M.K.C.; Schrauwen, P. Mitochondrial function, content and ROS production in rat skeletal muscle: Effect of high-fat feeding. FEBS Lett. 2008, 582, 510–516. [Google Scholar] [CrossRef] [PubMed]
- Turner, N.; Bruce, C.R.; Beale, S.M.; Hoehn, K.L.; So, T.; Rolph, M.S.; Cooney, G.J. Excess Lipid Availability Increases Mitochondrial Fatty Acid Oxidative Capacity in Muscle. Diabetes 2007, 56, 2085–2092. [Google Scholar] [CrossRef] [PubMed]
- Crescenzo, R.; Bianco, F.; Mazzoli, A.; Giacco, A.; Liverini, G.; Iossa, S. Mitochondrial efficiency and insulin resistance. Front. Physiol. 2015, 5, 512. [Google Scholar] [CrossRef]


© 2020 by the authors. Licensee MDPI, Basel, Switzerland. This article is an open access article distributed under the terms and conditions of the Creative Commons Attribution (CC BY) license (http://creativecommons.org/licenses/by/4.0/).
Share and Cite
Pinterić, M.; Podgorski, I.I.; Hadžija, M.P.; Tartaro Bujak, I.; Dekanić, A.; Bagarić, R.; Farkaš, V.; Sobočanec, S.; Balog, T. Role of Sirt3 in Differential Sex-Related Responses to a High-Fat Diet in Mice. Antioxidants 2020, 9, 174. https://doi.org/10.3390/antiox9020174
Pinterić M, Podgorski II, Hadžija MP, Tartaro Bujak I, Dekanić A, Bagarić R, Farkaš V, Sobočanec S, Balog T. Role of Sirt3 in Differential Sex-Related Responses to a High-Fat Diet in Mice. Antioxidants. 2020; 9(2):174. https://doi.org/10.3390/antiox9020174
Chicago/Turabian StylePinterić, Marija, Iva I. Podgorski, Marijana Popović Hadžija, Ivana Tartaro Bujak, Ana Dekanić, Robert Bagarić, Vladimir Farkaš, Sandra Sobočanec, and Tihomir Balog. 2020. "Role of Sirt3 in Differential Sex-Related Responses to a High-Fat Diet in Mice" Antioxidants 9, no. 2: 174. https://doi.org/10.3390/antiox9020174
APA StylePinterić, M., Podgorski, I. I., Hadžija, M. P., Tartaro Bujak, I., Dekanić, A., Bagarić, R., Farkaš, V., Sobočanec, S., & Balog, T. (2020). Role of Sirt3 in Differential Sex-Related Responses to a High-Fat Diet in Mice. Antioxidants, 9(2), 174. https://doi.org/10.3390/antiox9020174