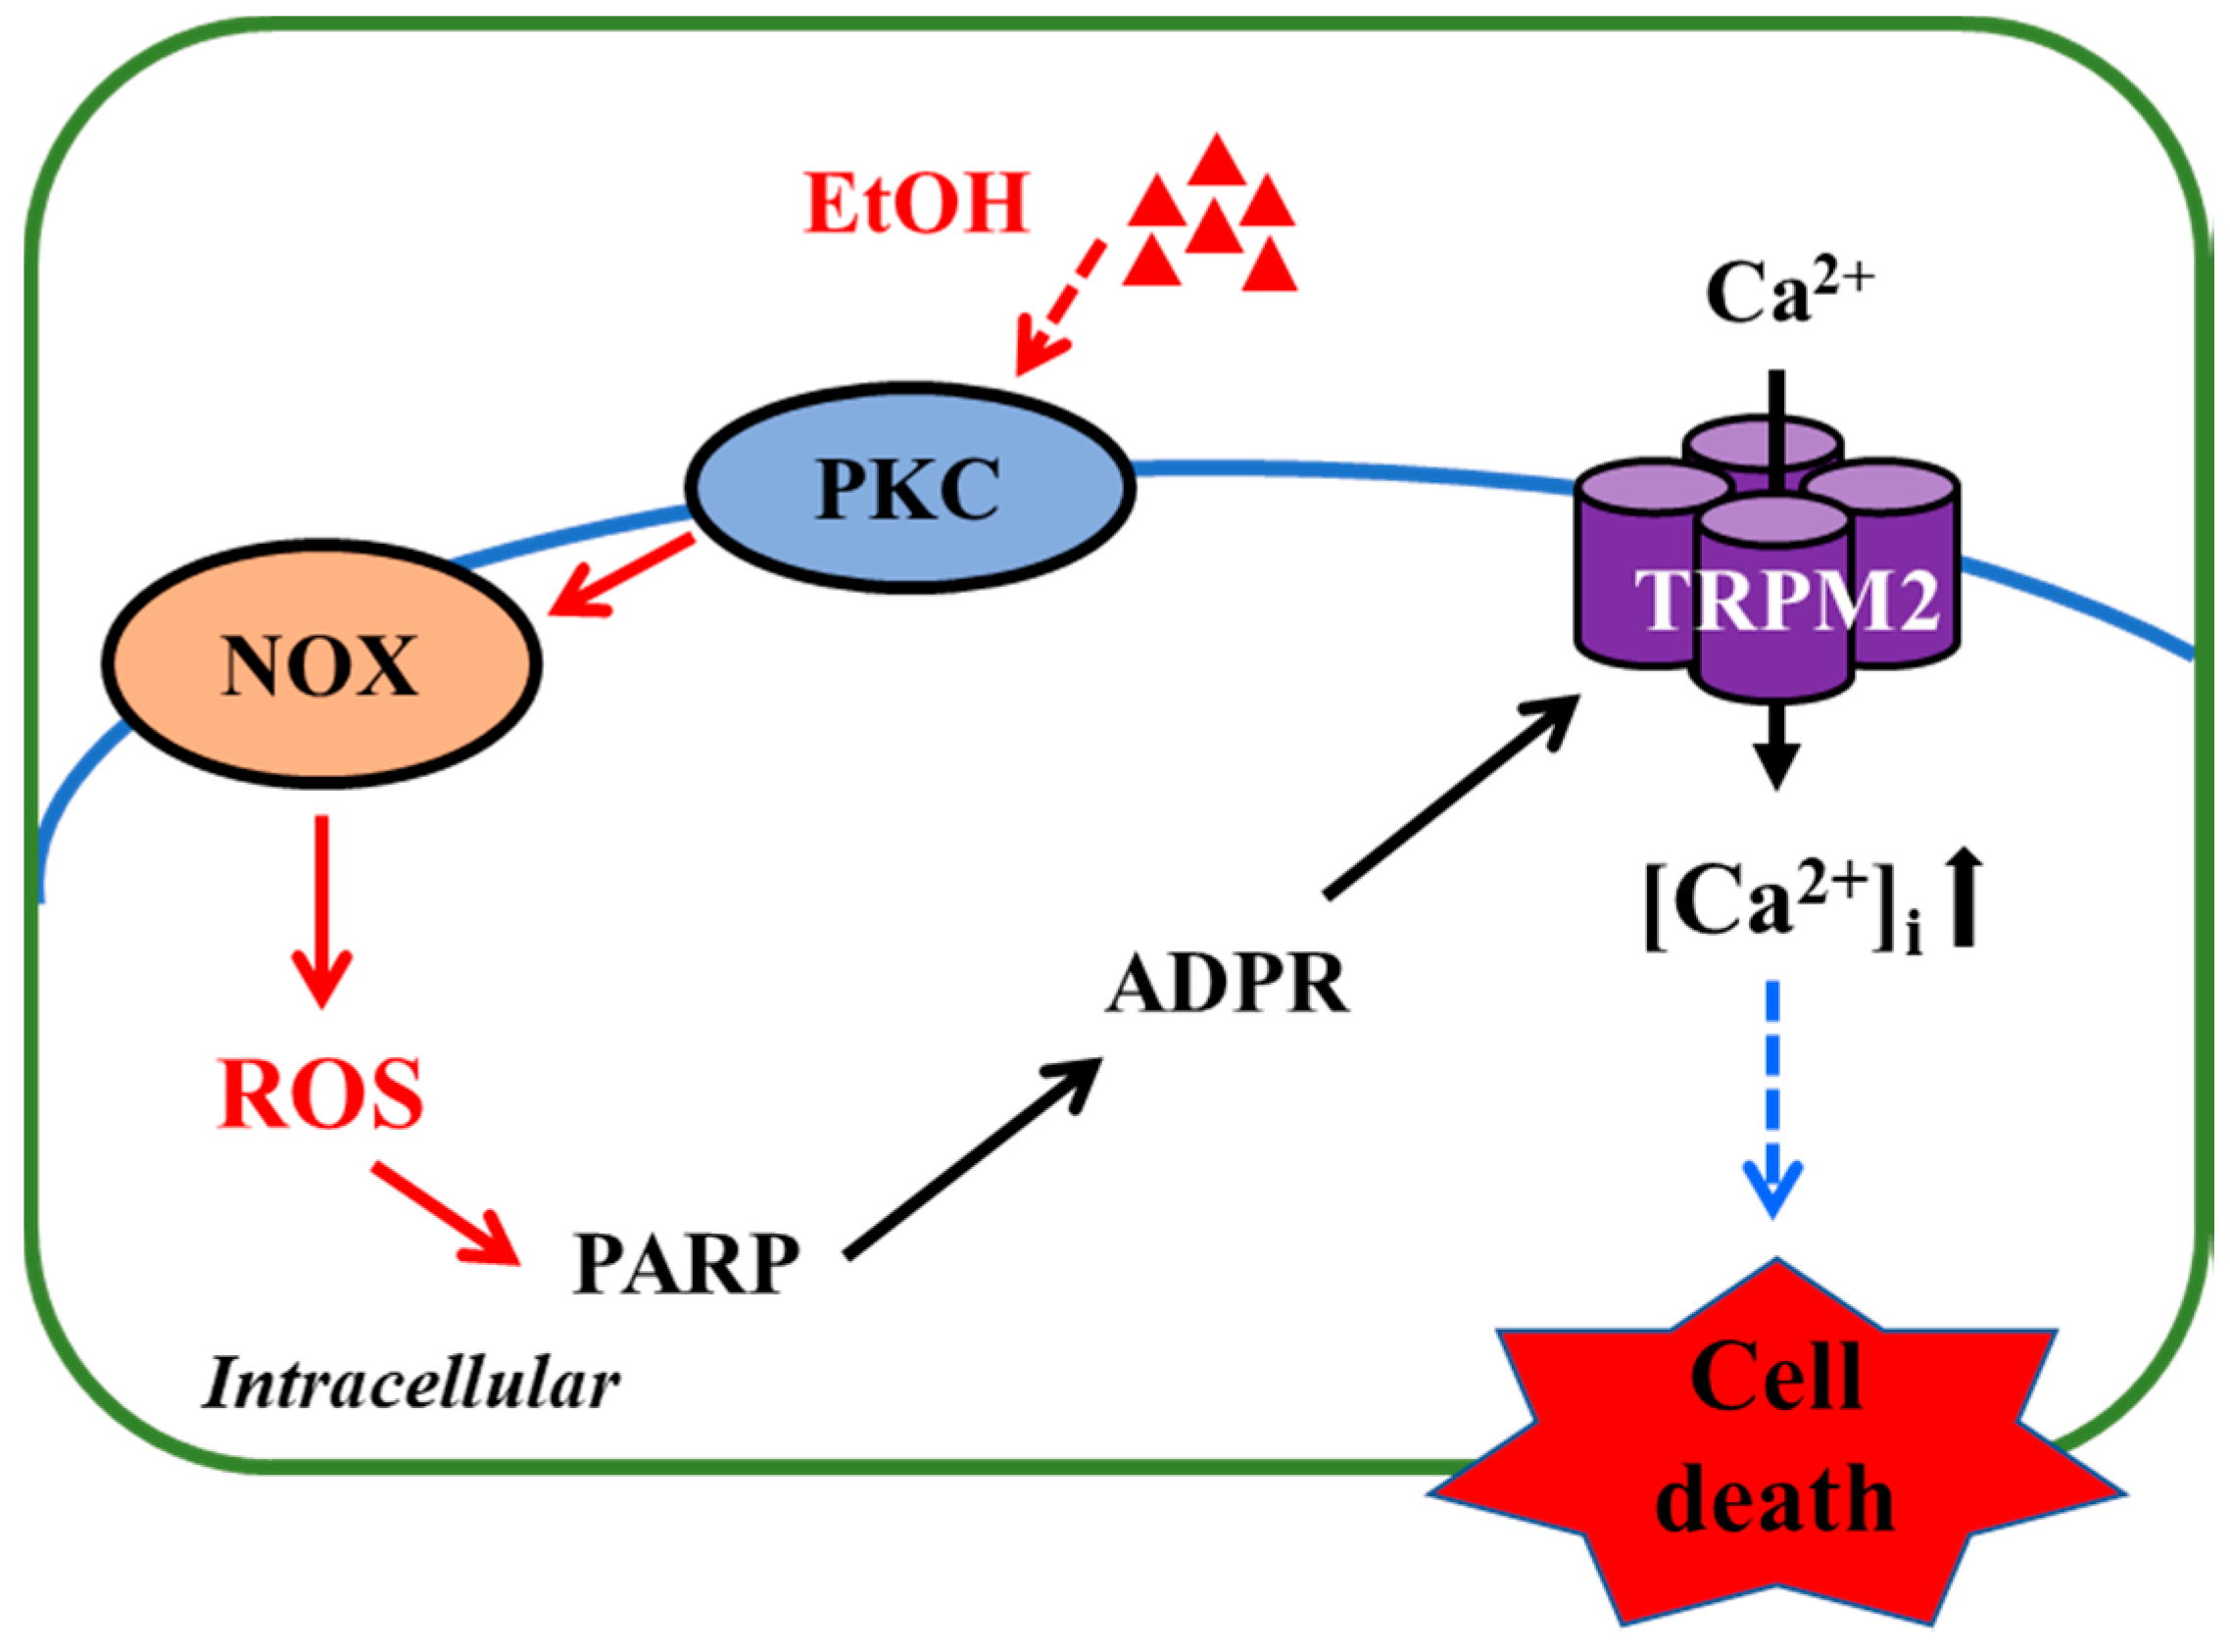
Ethanol Induces Microglial Cell Death via the NOX/ROS/PARP/TRPM2 Signalling Pathway

 ,
,  ,
,  ,
,  and
and 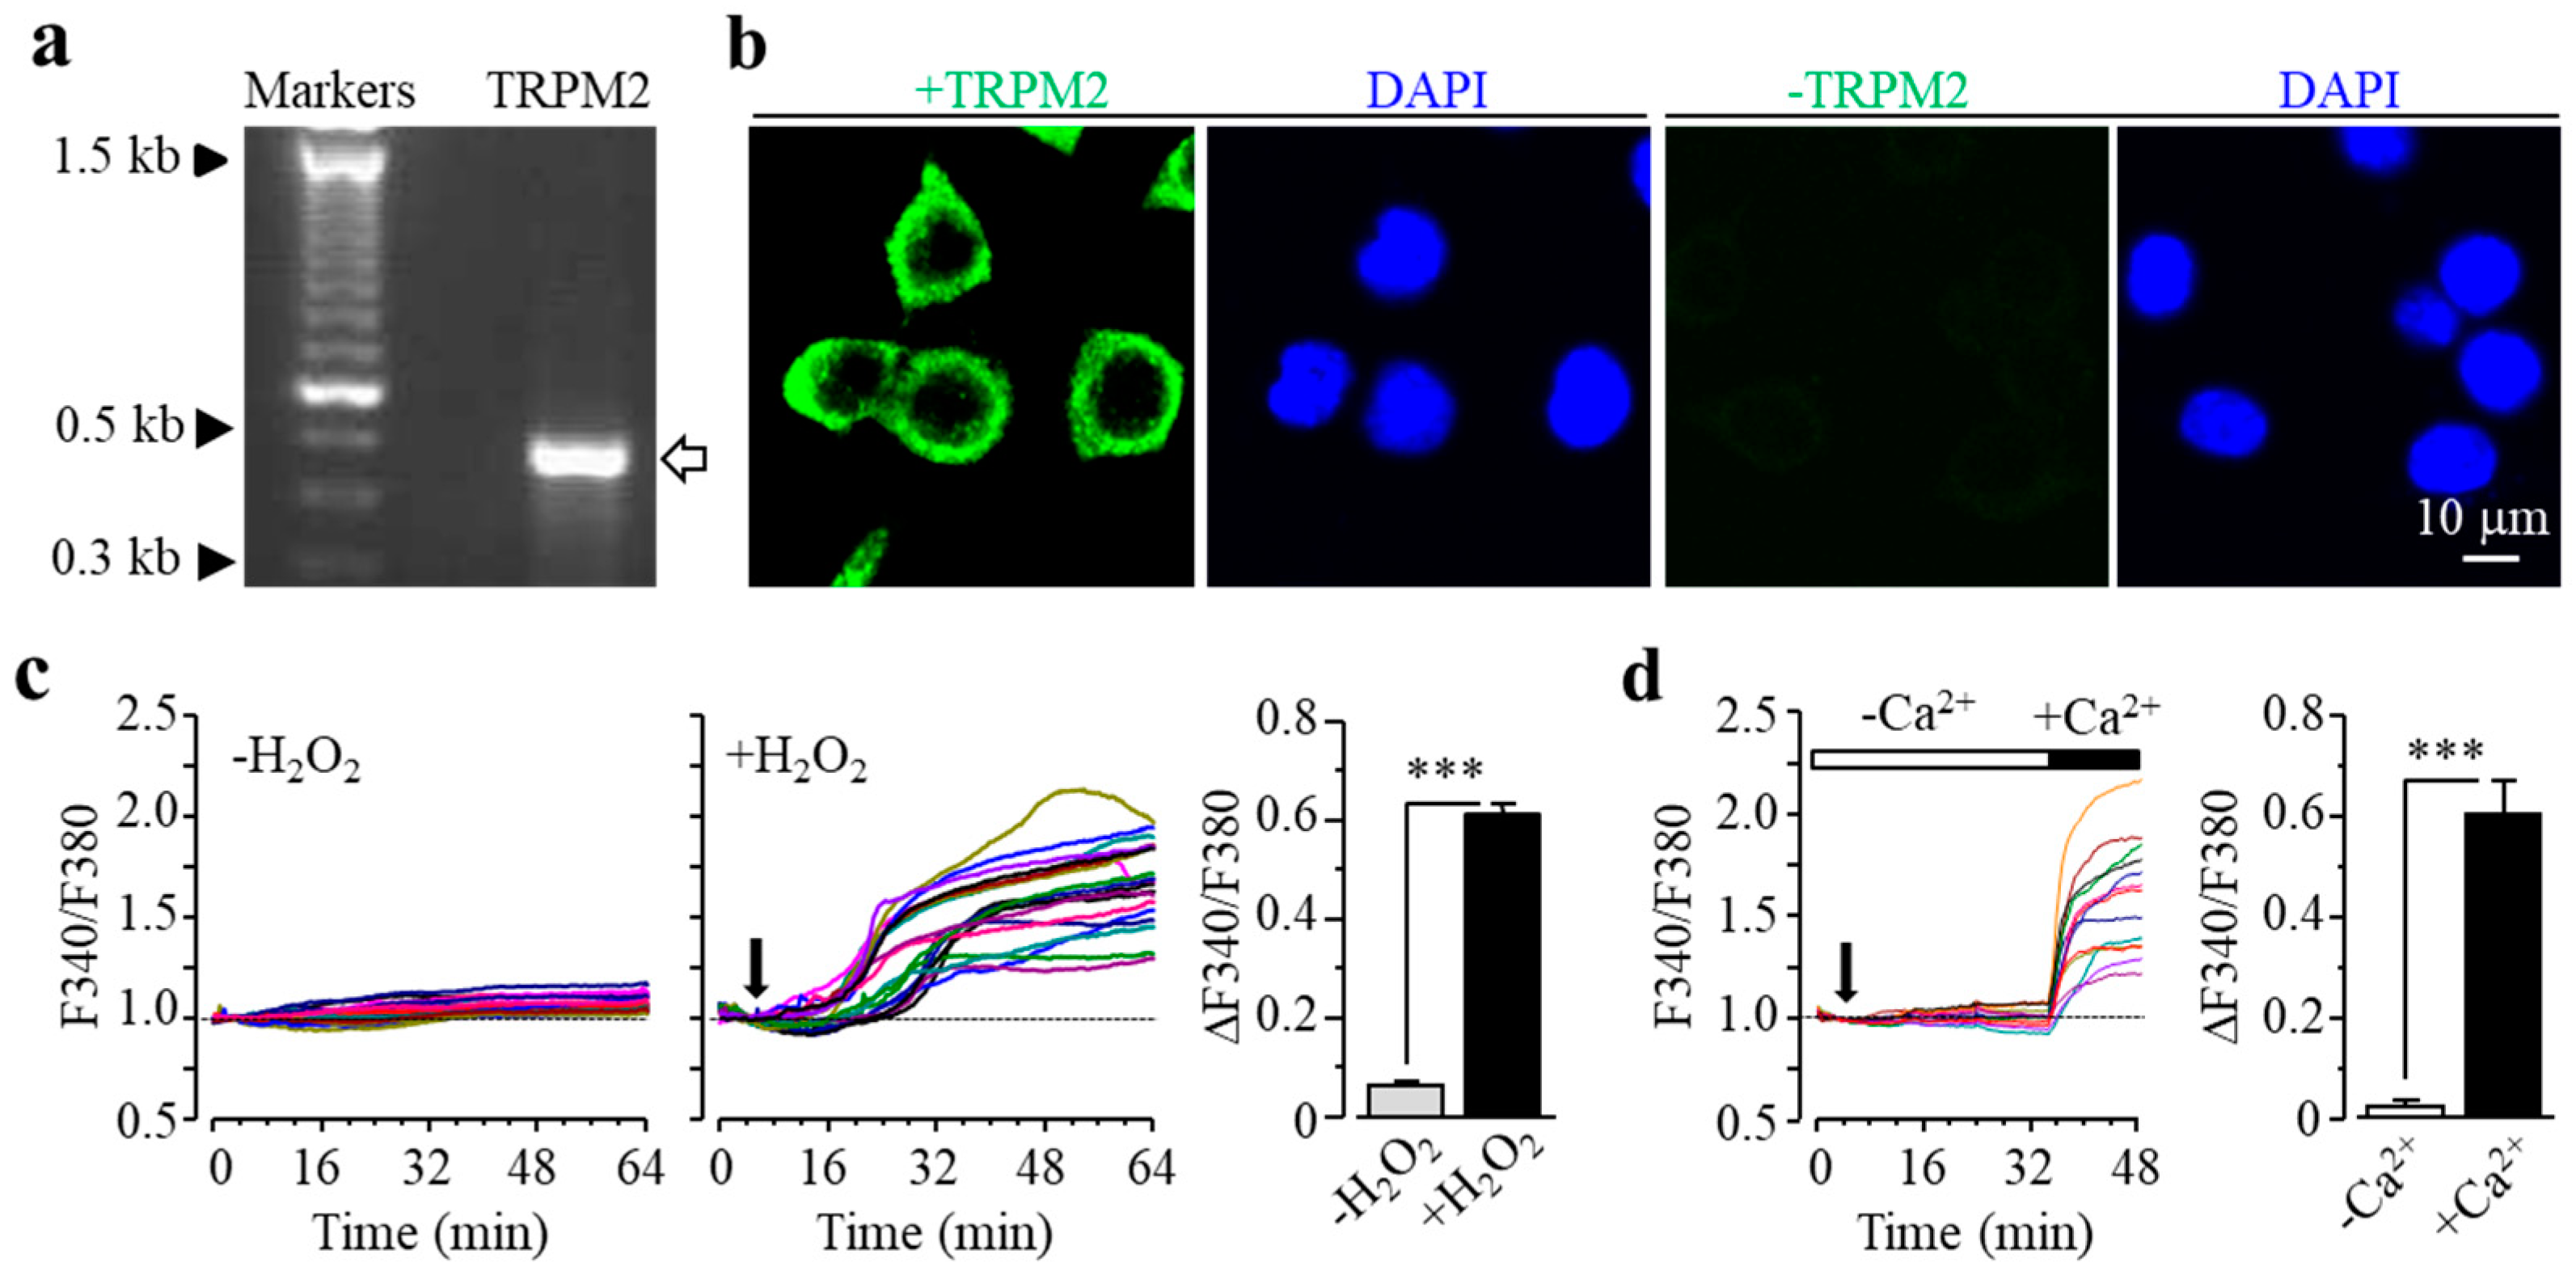
Abstract
1. Introduction
2. Materials and Methods
2.1. Chemicals and Reagents
2.2. BV2 Cell Culture and Preparation
2.3. Reverse Transcription-Polymerase Chain Reaction (RT-PCR)
2.4. Immunofluorescent Staining
2.5. Single-Cell Ca2+ Imaging
2.6. Cell Death Assay
2.7. Measurement of ROS Production
2.8. Data Presentation and Statistical Analysis
3. Results
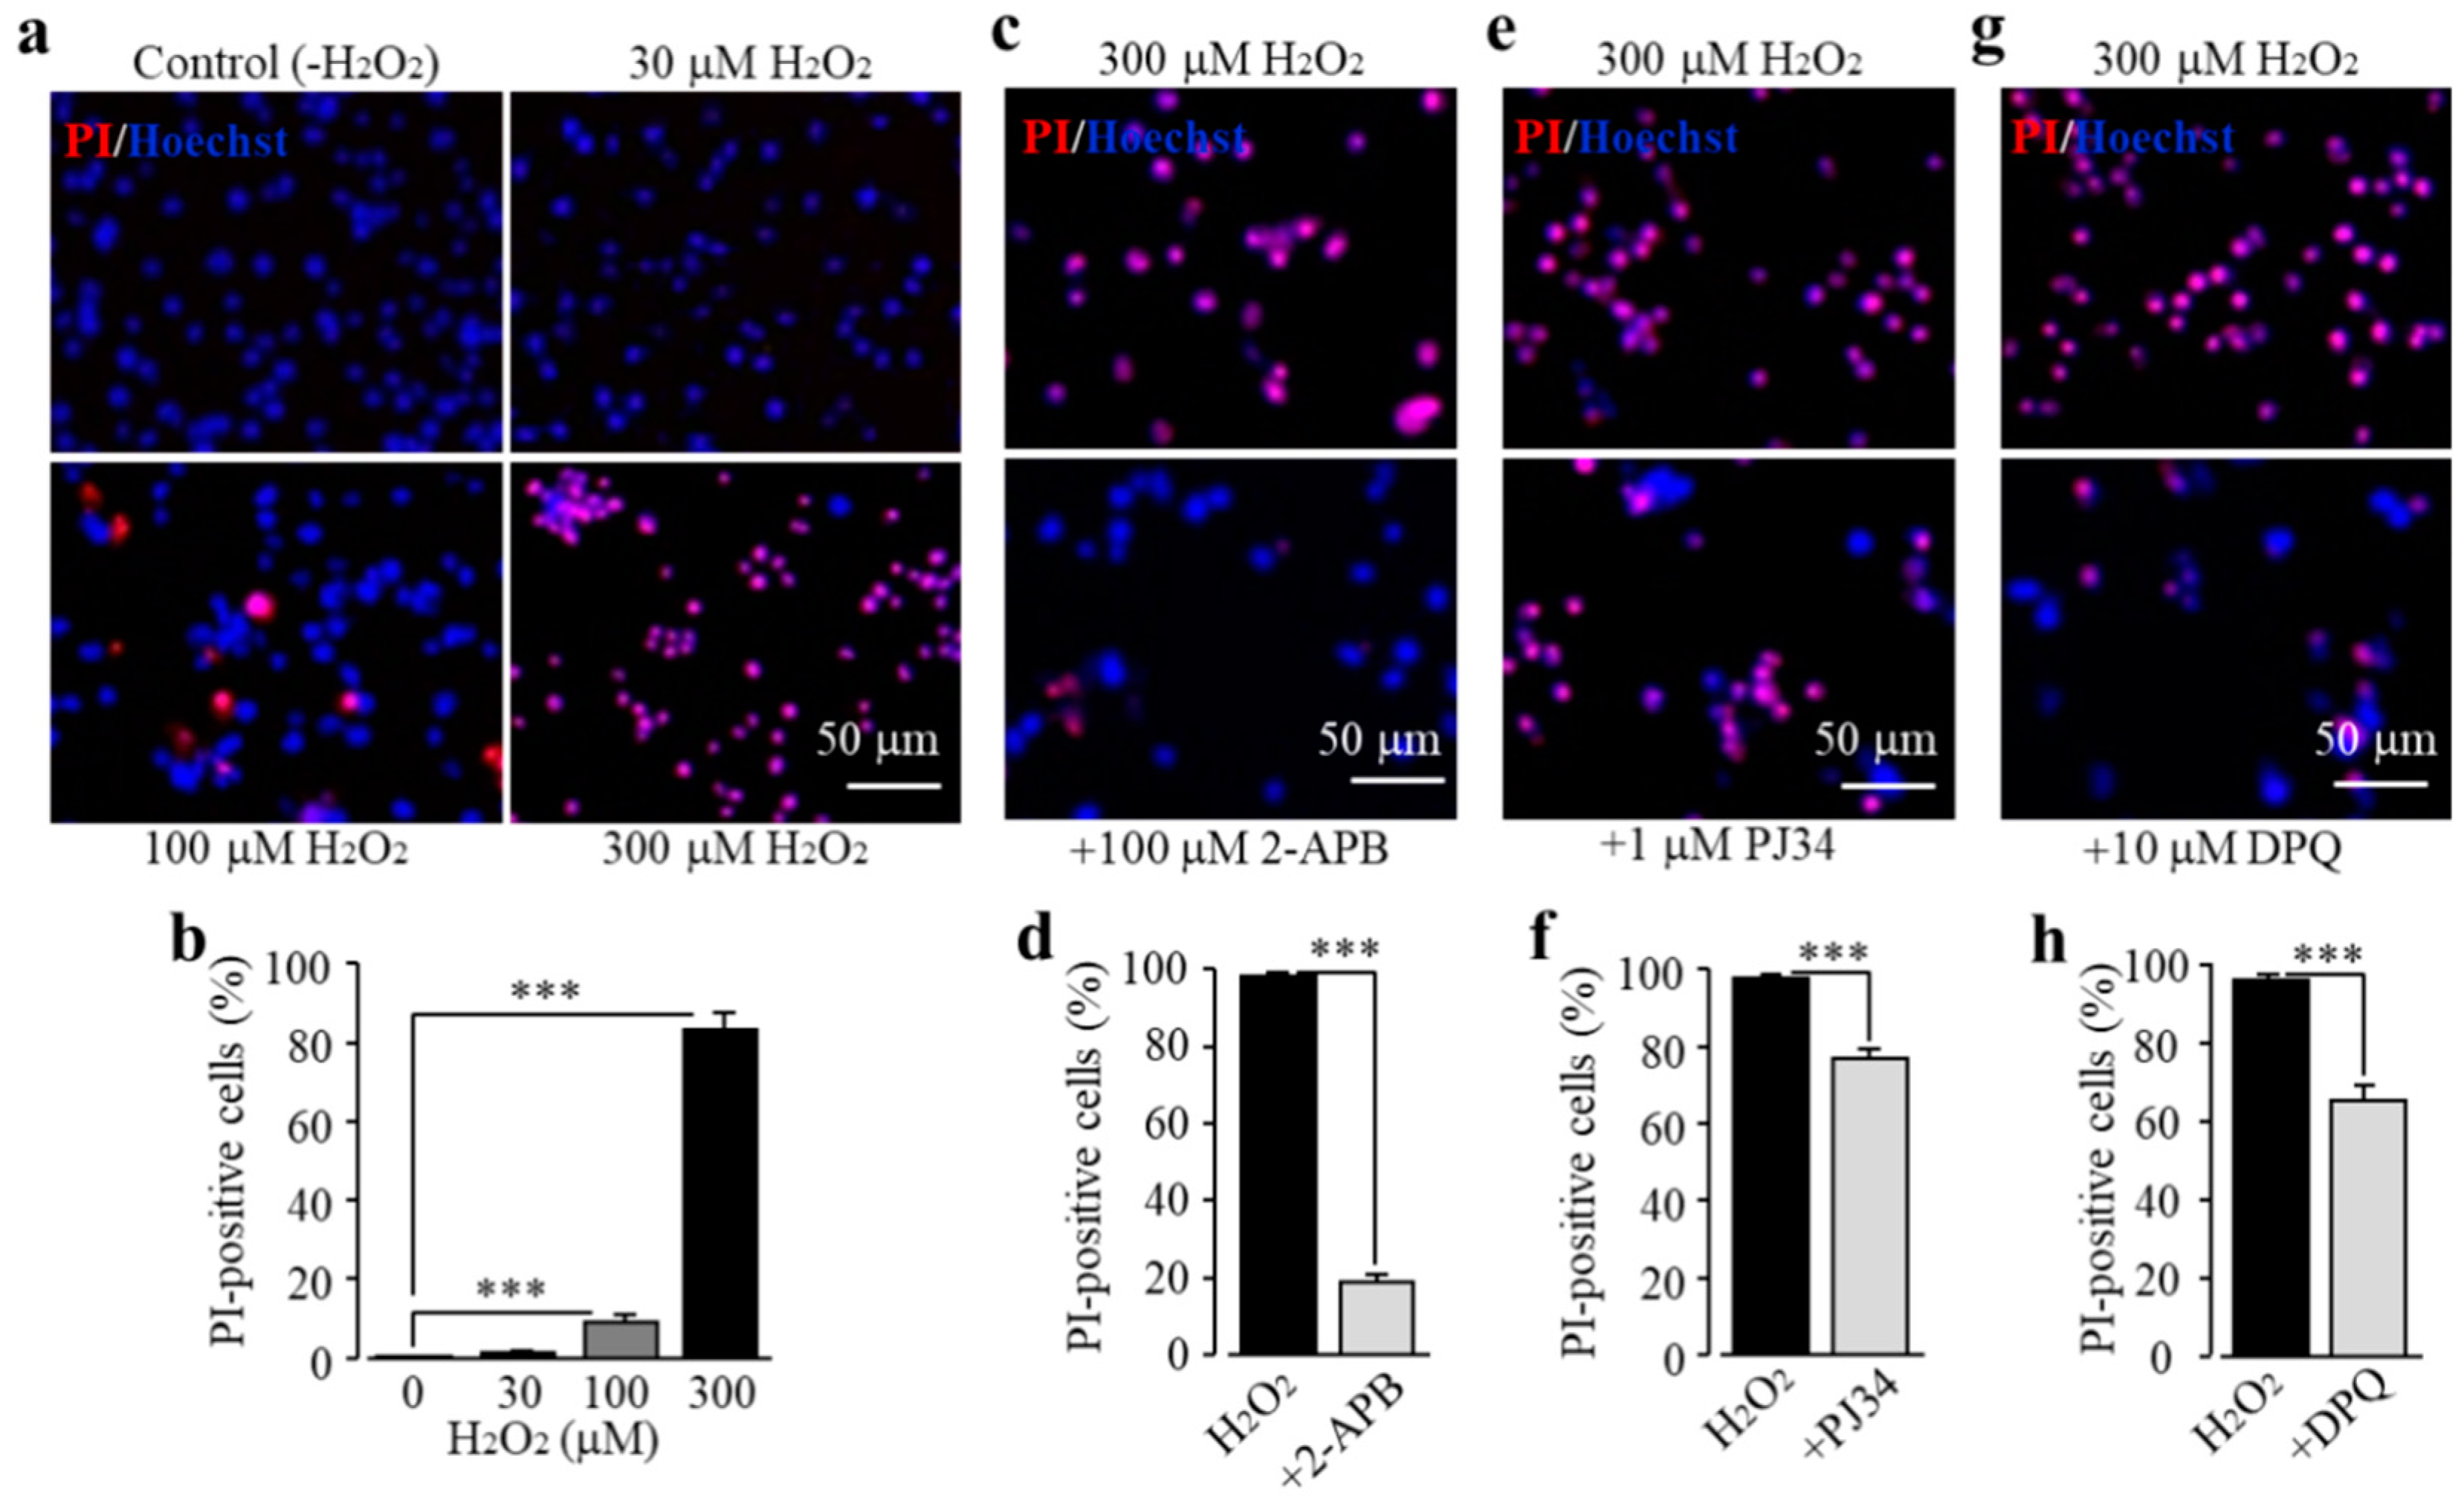
3.1. Expression of TRPM2 in Microglial Cells and Its Role in H2O2-Induced Cell Death
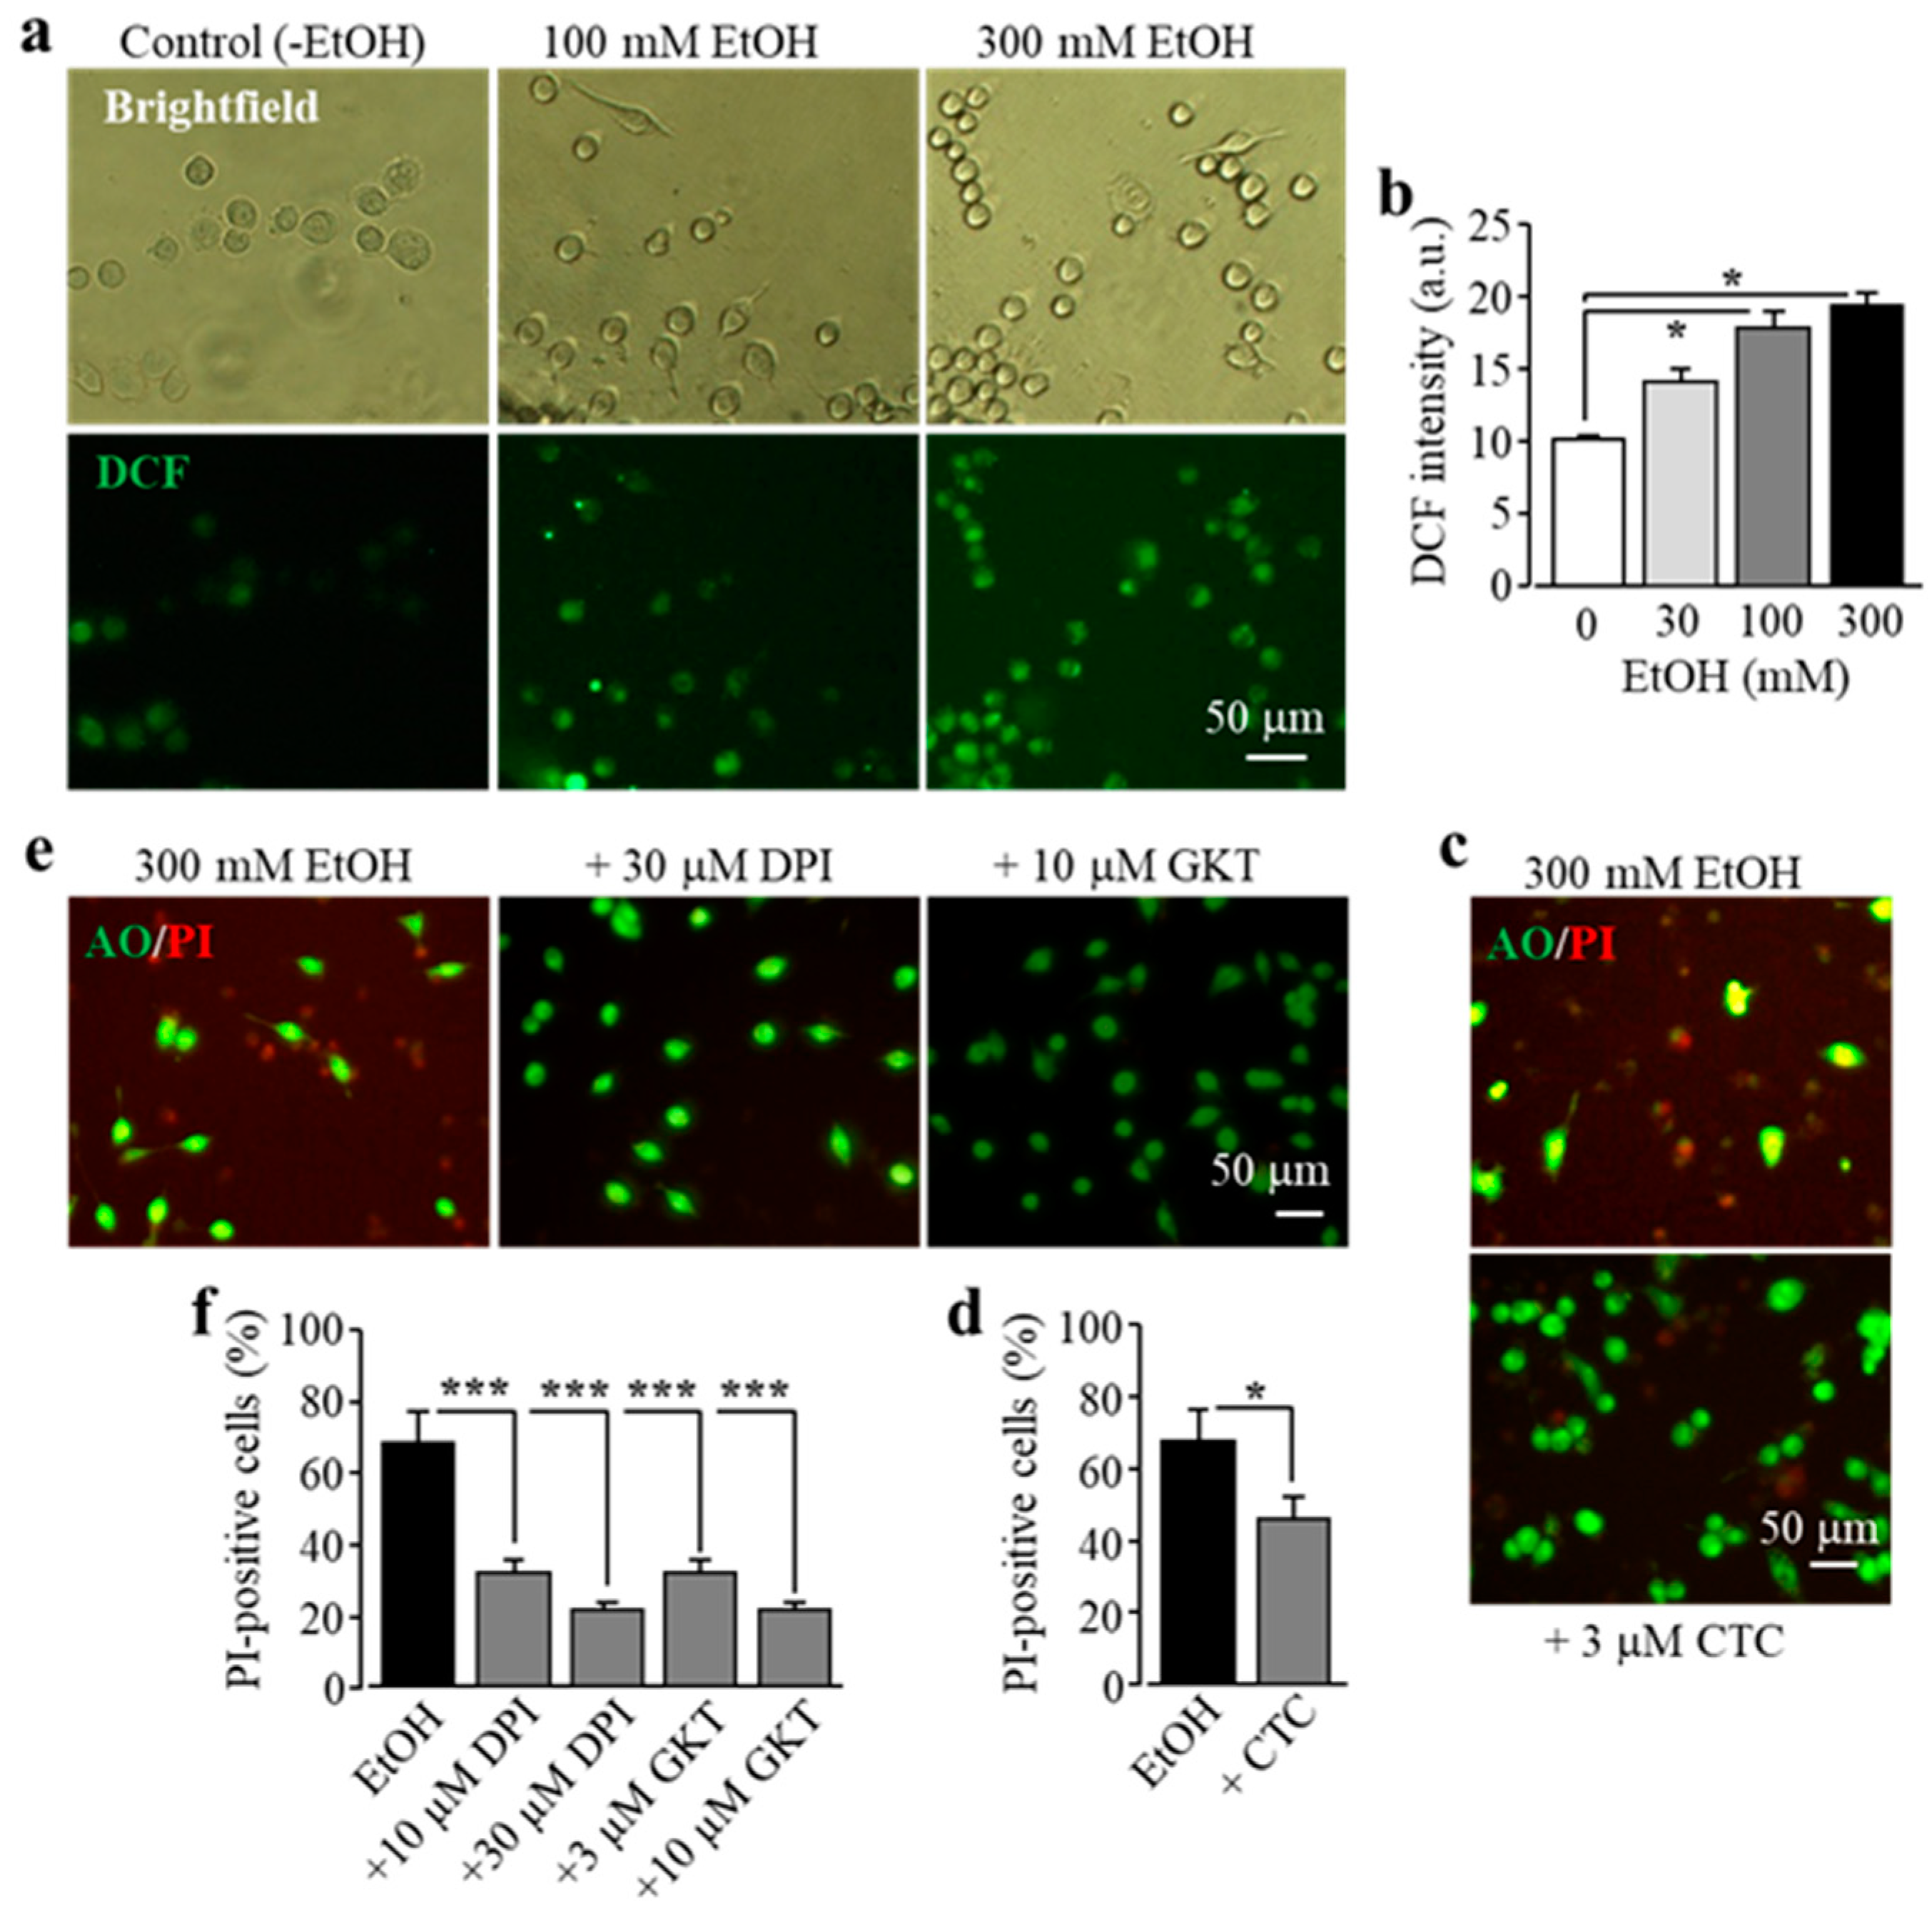
3.2. Exposure to EtOH Induces Microglial Cell Death via PARP-Dependent TRPM2 Channel Activation
3.3. EtOH-Induced Microglial Cell Death Depends on NOX-Mediated ROS Generation
4. Discussion
5. Conclusions
Author Contributions
Funding
Conflicts of Interest
References
- National Institute on Alcohol And Alcoholism (NIAAA). Alcohol Use Disorder. Available online: https://www.niaaa.nih.gov/alcohol-health/overview-alcohol-consumption/alcohol-use-disorders (accessed on 6 May 2019).
- Paton, A. Alcohol in the body. BMJ 2005, 330, 85–87. [Google Scholar] [CrossRef]
- Osna, N.A.; Donohue, T.M., Jr.; Kharbanda, K.K. Alcoholic liver disease: Pathogenesis and current management. Alcohol Res. 2017, 38, 147–161. [Google Scholar]
- Piano, M.R. Alcohol’s effects on the cardiovascular system. Alcohol Res. 2017, 38, 219–241. [Google Scholar]
- Ahmadi, A.; Pearlson, G.D.; Meda, S.A.; Dager, A.; Potenza, M.N.; Rosen, R.; Austad, C.S.; Raskin, S.A.; Fallahi, C.R.; Tennen, H.; et al. Influence of alcohol use on neural response to Go/No-Go task in college drinkers. Neuropsychopharmacology 2013, 38, 2197–2208. [Google Scholar] [CrossRef]
- de la Monte, S.M.; Kril, J.J. Human alcohol-related neuropathology. Acta Neuropathol. 2014, 127, 71–90. [Google Scholar] [CrossRef]
- Warden, A.S.; Wolfe, S.A.; Khom, S.; Varodayan, F.P.; Patel, R.R.; Steinman, M.Q.; Bajo, M.; Montgomery, S.E.; Vlkolinsky, R.; Nadav, T.; et al. Microglia control escalation of drinking in alcohol-dependent mice: Genomic and synaptic drivers. Biol. Psychiatry 2020. [Google Scholar] [CrossRef]
- Gavin, D.P.; Kusumo, H.; Sharma, R.P.; Guizzetti, M. Ethanol-induced changes in poly (ADP-ribose) polymerase and neuronal developmental gene expression. Neuropharmacology 2016, 110, 287–296. [Google Scholar] [CrossRef]
- Quintanilla, M.E.; Ezquer, F.; Morales, P.; Ezquer, M.; Olivares, B.; Santapau, D.; Herrera-Marschitz, M.; Israel., Y. N-acetylcysteine and acetylsalicylic acid inhibit alcohol consumption by different mechanisms: Combined protection. Front. Behav. Neurosci. 2020, 14, 122. [Google Scholar] [CrossRef]
- Vallerini, G.P.; Cheng, Y.H.; Chase, K.A.; Sharma, R.P.; Kusumo, H.; Khakhkhar, S.; Feinstein, D.L.; Guizzetti, M.; Gavin, D.P. Modulation of poly ADP-ribose polymerase (PARP) levels and activity by alcohol binge-like drinking in male mice. Neuroscience 2020, 448, 1–13. [Google Scholar] [CrossRef]
- Kamal, H.; Tan, G.C.; Ibrahim, S.F.; Shaikh, M.F.; Mohamed, I.N.; Mohamed, R.M.P.; Hamid, A.A.; Ugusman, A.; Kumar, J. Alcohol use disorder, neurodegeneration, Alzheimer’s and Parkinson’s disease: Interplay between oxidative stress, neuroimmune response and excitotoxicity. Front. Cell Neurosci. 2020, 14, 1–15. [Google Scholar] [CrossRef]
- Goodwani, S.; Saternos, H.; Alasmari, F.; Sari, Y. Metabotropic and ionotropic glutamate receptors as potential targets for the treatment of alcohol use disorder. Neurosci. Biobehav. Rev. 2017, 77, 14–31. [Google Scholar] [CrossRef] [PubMed]
- Li, Q.; Barres, B.A. Microglia and macrophages in brain homeostasis and disease. Nat. Rev. Immunol. 2018, 18, 225–242. [Google Scholar] [CrossRef]
- Colonna, M.; Butovsky, O. Microglia function in the central nervous system during health and neurodegeneration. Annu. Rev. Immunol. 2017, 35, 441–468. [Google Scholar] [CrossRef]
- Wolf, S.A.; Boddeke, H.W.; Kettenmann, H. Microglia in physiology and disease. Annu. Rev. Physiol. 2017, 79, 619–643. [Google Scholar] [CrossRef]
- Toyama, H.; Hatano, K.; Suzuki, H.; Ichise, M.; Momosaki, S.; Kudo, G.; Ito, F.; Kato, T.; Yamaguchi, H.; Katada, K.; et al. In vivo imaging of microglial activation using a peripheral benzodiazepine receptor ligand: [11C]PK-11195 and animal PET following ethanol injury in rat striatum. Ann. Nucl. Med. 2008, 22, 417–424. [Google Scholar] [CrossRef]
- Fernandez-Lizarbe, S.; Pascual, M.; Guerri, C. Critical role of TLR4 response in the activation of microglia induced by ethanol. J. Immunol. 2009, 183, 4733–4744. [Google Scholar] [CrossRef]
- Yang, J.Y.; Xue, X.; Tian, H.; Wang, X.X.; Dong, Y.X.; Wang, F.; Zhao, Y.N.; Yao, X.C.; Cui, W.; Wu, C.F. Role of microglia in ethanol-induced neurodegenerative disease: Pathological and behavioral dysfunction at different developmental stages. Pharmacol. Ther. 2014, 144, 321–337. [Google Scholar] [CrossRef]
- Ahlers, K.E.; Karaçay, B.; Fuller, L.; Bonthius, D.J.; Dailey, M.E. Transient activation of microglia following acute alcohol exposure in developing mouse neocortex is primarily driven by BAX-dependent neurodegeneration. Glia 2015, 63, 1694–1713. [Google Scholar] [CrossRef]
- Walter, T.J.; Crews, F.T. Microglial depletion alters the brain neuroimmune response to acute binge ethanol withdrawal. J. Neuroinflamm. 2017, 14, 86. [Google Scholar] [CrossRef]
- Walter, T.J.; Vetreno, R.P.; Crews, F.T. Alcohol and stress activation of microglia and neurons: Brain regional effects. Alcohol. Clin. Exp. Res. 2017, 41, 2066–2081. [Google Scholar] [CrossRef]
- Erickson, E.K.; Blednov, Y.A.; Harris, R.A.; Mayfield, R.D. Glial gene networks associated with alcohol dependence. Sci. Rep. 2019, 9, 10949. [Google Scholar] [CrossRef] [PubMed]
- Warden, A.S.; Triplett, T.A.; Lyu, A.; Grantham, E.K.; Azzam, M.M.; DaCosta, A.; Harris, R.A. Microglia depletion and alcohol: Transcriptome and behavioral profiles. Addict. Biol. 2020, e12889. [Google Scholar] [CrossRef] [PubMed]
- Freire, D.; Reyes, R.E.; Baghram, A.; Davies, D.L.; Asatryan, L. P2X7 receptor antagonist A804598 inhibits inflammation in brain and liver in C57BL/6J mice exposed to chronic ethanol and high fat diet. J. Neuroimmune Pharmacol. 2019, 14, 263–277. [Google Scholar] [CrossRef] [PubMed]
- Mortadza, S.S.; Sim, J.A.; Stacey, M.; Jiang, L.H. Signalling mechanisms mediating Zn2+-induced TRPM2 channel activation and cell death in microglial cells. Sci. Rep. 2017, 7, 45032. [Google Scholar] [CrossRef]
- Yildizhan, Y.; Naziroglu, M. Glutathione depletion and parkinsonian neurotoxin MPP+-induced TRPM2 channel activation play central roles in oxidative cytotoxicity and inflammation in microglia. Mol. Neurobiol. 2020, 57, 3508–3525. [Google Scholar] [CrossRef]
- Jiang, L.H.; Yang, W.; Zou, J.; Beech, D.J. TRPM2 channel properties, functions and therapeutic potentials. Expert Opin. Ther. Targets 2010, 14, 973–988. [Google Scholar] [CrossRef]
- Jiang, L.H.; Li, X.; Syed Mortadza, S.A.; Lovatt, M.; Yang, W. The TRPM2 channel nexus from oxidative damage to Alzheimer’s pathologies: An emerging novel intervention target for age-related dementia. Ageing Res. Rev. 2018, 47, 67–79. [Google Scholar] [CrossRef]
- Malko, P.; Jiang, L.H. TRPM2 channel-mediated cell death: An important mechanism linking oxidative stress-inducing pathological factors to associated pathological conditions. Redox Biol. 2020, 37, 101755. [Google Scholar] [CrossRef]
- Kraft, R.; Grimm, C.; Grosse, K.; Hoffmann, A.; Sauerbruch, S.; Kettenmann, H.; Harteneck, C. Hydrogen peroxide and ADP-ribose induce TRPM2-mediated calcium influx and cation currents in microglia. Am. J. Physiol. Cell Physiol. 2004, 286, C129–C137. [Google Scholar] [CrossRef]
- Alawieyah, S.M.S.; Sim, J.A.; Neubrand, V.E.; Jiang, L.H. A critical role of TRPM2 channel in Aβ42 -induced microglial activation and generation of tumor necrosis factor-α. Glia 2018, 66, 562–575. [Google Scholar] [CrossRef]
- Mortadza, S.A.S.; Wang, L.; Li, D.; Jiang, L.H. TRPM2 channel-mediated ROS-sensitive Ca2+ signaling mechanisms in immune cells. Front. Immunol. 2015, 6, 407. [Google Scholar] [CrossRef] [PubMed]
- Malko, P.; Mortadza, S.A.S.; McWilliam, J.; Jiang, L.H. TRPM2 channel in microglia as a new player in neuroinflammation associated with a spectrum of central nervous system pathologies. Front. Pharmacol. 2019, 10, 239. [Google Scholar] [CrossRef] [PubMed]
- Asatryan, L.; Ostrovskaya, O.; Lieu, D.; Davies, D.L. Ethanol differentially modulates P2X4 and P2X7 receptor activity and function in BV2 microglial cells. Neuropharmacology 2018, 128, 11–21. [Google Scholar] [CrossRef] [PubMed]
- Lawrimore, C.J.; Coleman, L.G.; Zou, J.; Crews, F.T. Ethanol induction of innate immune signals across BV2 microglia and SH-SY5Y neuroblastoma involves induction of IL-4 and IL-13. Brain Sci. 2019, 9, 228. [Google Scholar] [CrossRef]
- Zou, J.; Ainscough, J.F.; Yang, W.; Sedo, A.; Yu, S.P.; Mei, Z.Z.; Jiang, L.H. A differential role of macrophage TRPM2 channels in Ca2+ signaling and cell death in early responses to H2O2. Am. J. Physiol. Cell Physiol. 2013, 305, C61–C69. [Google Scholar] [CrossRef]
- Li, C.; Peoples, R.W.; Weight, F.F. Ethanol-induced inhibition of a neuronal P2X purinoceptor by an allosteric mechanism. Br. J. Pharmacol. 1998, 123, 1–3. [Google Scholar] [CrossRef]
- Frye, G.D.; Fincher, A. Sustained ethanol inhibition of native AMPA receptors on medial septum/diagonal band (MS/DB) neurons. Br. J. Pharmacol. 2000, 129, 87–94. [Google Scholar] [CrossRef]
- Zhao, Y.; Ren, H.; Peoples, R.W. Intersubunit interactions at putative sites of ethanol action in the M3 and M4 domains of the NMDA receptor GluN1 and GluN2B subunits. Br. J. Pharmacol. 2016, 173, 1950–1965. [Google Scholar] [CrossRef]
- Noh, K.M.; Koh, J.Y. Induction and activation by zinc of NADPH oxidase in cultured cortical neurons and astrocytes. J. Neurosci. 2000, 20, RC111. [Google Scholar] [CrossRef]


Publisher’s Note: MDPI stays neutral with regard to jurisdictional claims in published maps and institutional affiliations. |
© 2020 by the authors. Licensee MDPI, Basel, Switzerland. This article is an open access article distributed under the terms and conditions of the Creative Commons Attribution (CC BY) license (http://creativecommons.org/licenses/by/4.0/).
Share and Cite
Sha’fie, M.S.A.; Rathakrishnan, S.; Hazanol, I.N.; Dali, M.H.I.; Khayat, M.E.; Ahmad, S.; Hussin, Y.; Alitheen, N.B.; Jiang, L.-H.; Syed Mortadza, S.A. Ethanol Induces Microglial Cell Death via the NOX/ROS/PARP/TRPM2 Signalling Pathway. Antioxidants 2020, 9, 1253. https://doi.org/10.3390/antiox9121253
Sha’fie MSA, Rathakrishnan S, Hazanol IN, Dali MHI, Khayat ME, Ahmad S, Hussin Y, Alitheen NB, Jiang L-H, Syed Mortadza SA. Ethanol Induces Microglial Cell Death via the NOX/ROS/PARP/TRPM2 Signalling Pathway. Antioxidants. 2020; 9(12):1253. https://doi.org/10.3390/antiox9121253
Chicago/Turabian StyleSha’fie, Muhammad Syahreel Azhad, Sharani Rathakrishnan, Iffa Nadhira Hazanol, Mohd Haziq Izzazuddin Dali, Mohd Ezuan Khayat, Syahida Ahmad, Yazmin Hussin, Noorjahan Banu Alitheen, Lin-Hua Jiang, and Sharifah Alawieyah Syed Mortadza. 2020. "Ethanol Induces Microglial Cell Death via the NOX/ROS/PARP/TRPM2 Signalling Pathway" Antioxidants 9, no. 12: 1253. https://doi.org/10.3390/antiox9121253
APA StyleSha’fie, M. S. A., Rathakrishnan, S., Hazanol, I. N., Dali, M. H. I., Khayat, M. E., Ahmad, S., Hussin, Y., Alitheen, N. B., Jiang, L.-H., & Syed Mortadza, S. A. (2020). Ethanol Induces Microglial Cell Death via the NOX/ROS/PARP/TRPM2 Signalling Pathway. Antioxidants, 9(12), 1253. https://doi.org/10.3390/antiox9121253