Hawthorn Herbal Preparation from Crataegus oxyacantha Attenuates In Vivo Carbon Tetrachloride -Induced Hepatic Fibrosis via Modulating Oxidative Stress and Inflammation

 ,
, 
 ,
,
Abstract
:1. Introduction
2. Materials and Methods
2.1. Chemicals and Reagents
2.2. Herbal Drug Preparation
2.3. Animals and Treatments
2.4. Sample Preparation
2.5. Measurement of Serum Biochemical Markers of Liver Damage
2.6. Histopathological Examination
2.7. Immunohistochemically Examination
2.8. Determination of Hepatic Hydroxyproline
2.9. Oxidative Stress Biomarkers and Myeloperoxidase Activity
2.10. Quantitative Real-Time Reverse-Transcriptase Polymerase Chain Reaction Analysis
2.11. Determination of Total Phenolic Content of HAW
2.12. Determination of Total Antioxidant Capacity of HAW
2.13. High-Performance Liquid Chromatography (HPLC) Analysis of Phenolic Compounds of HAW
2.14. Statistical Analysis
3. Results
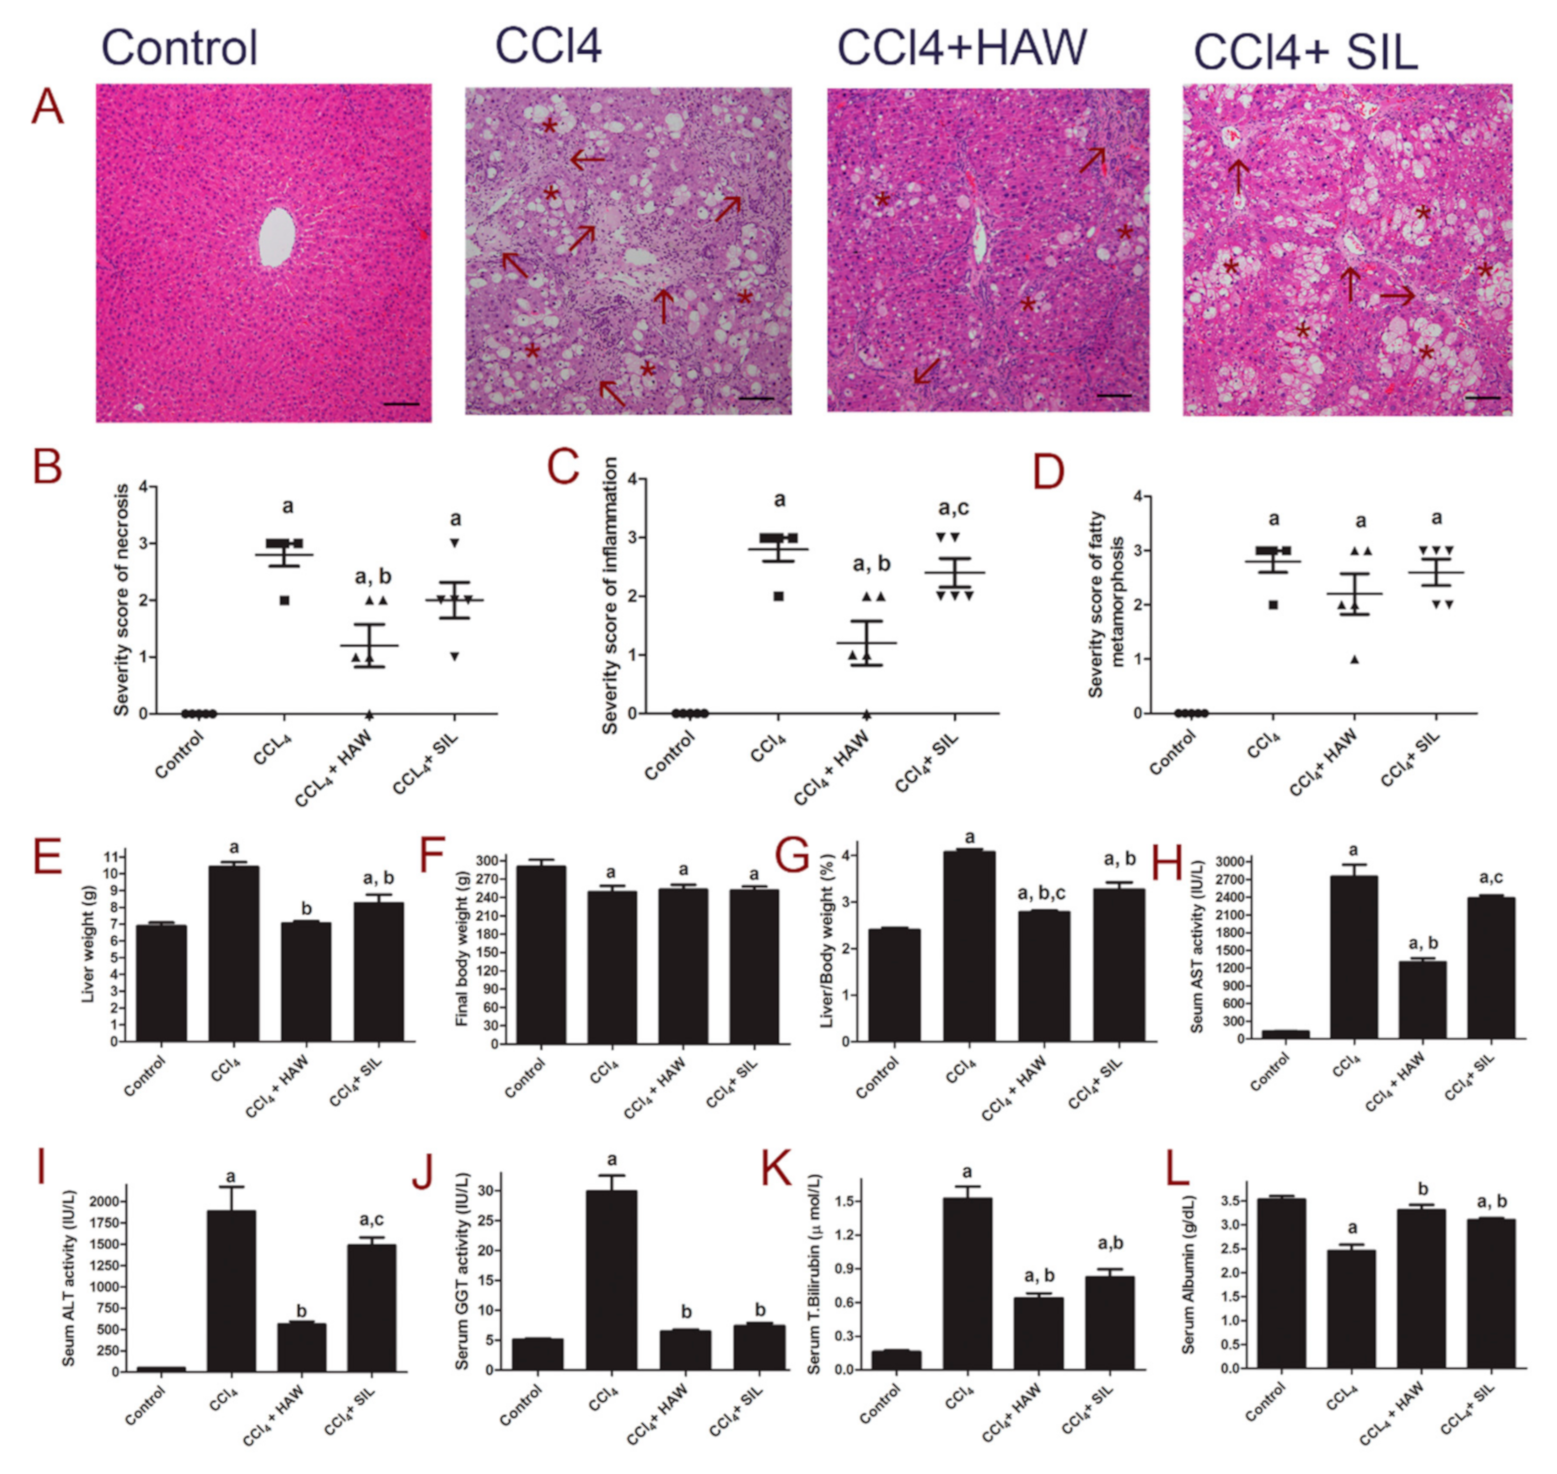
3.1. HAW Attenuated Liver Lesions in CCl4-Induced Liver Damage
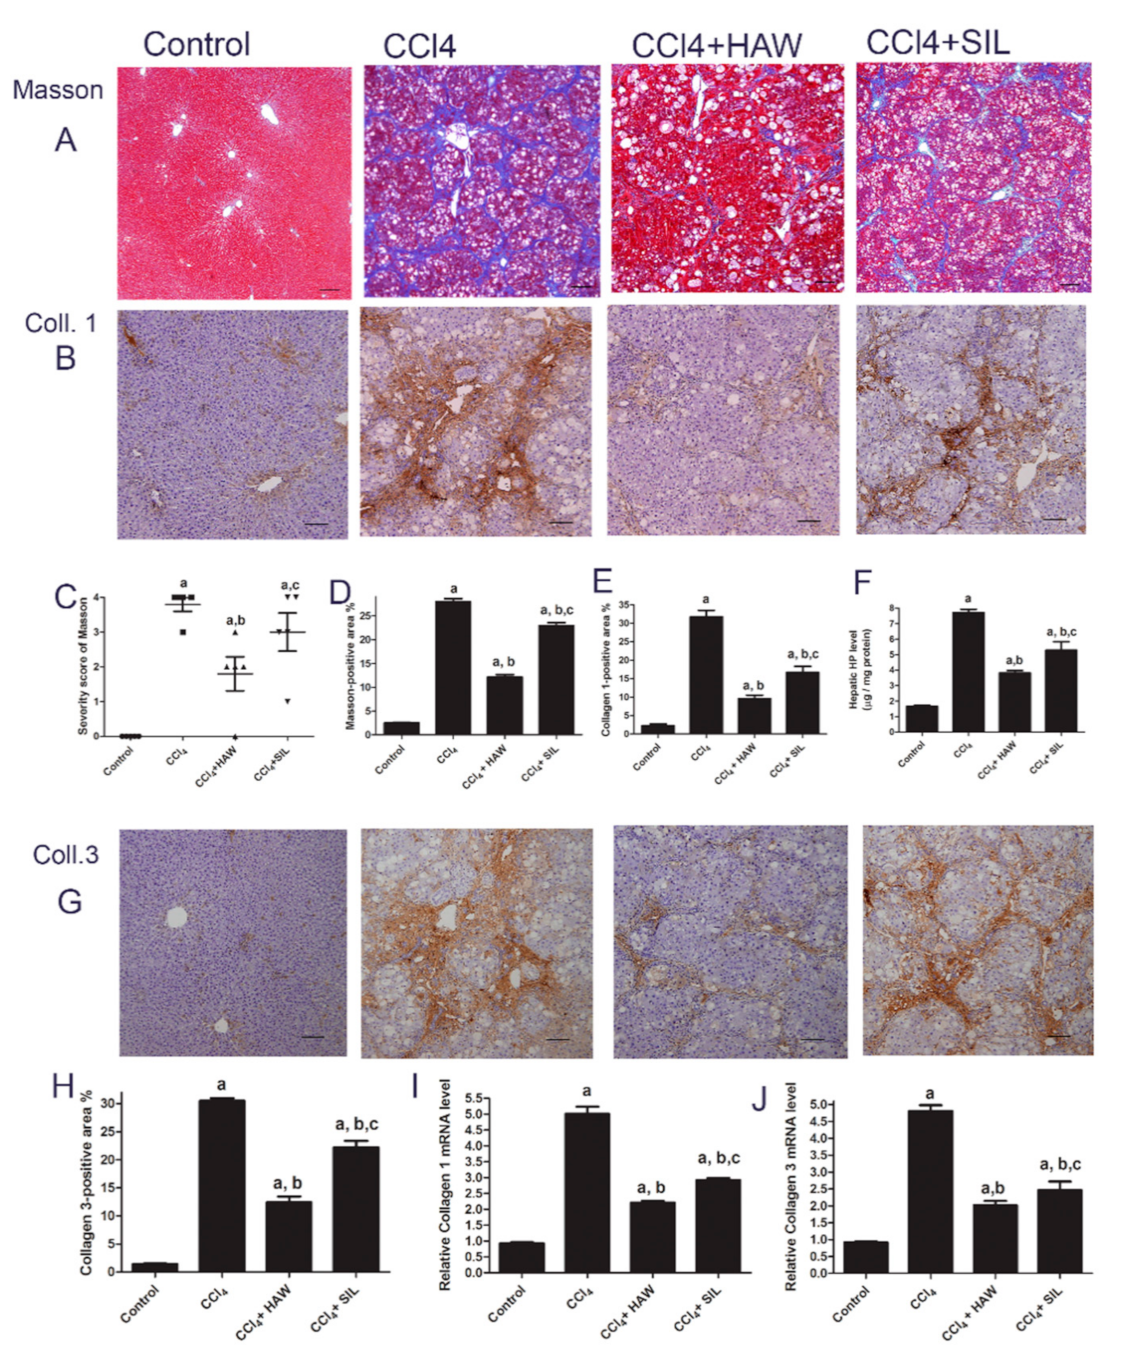
3.2. HAW Ameliorated CCl4-Induced Liver Fibrosis in Rats
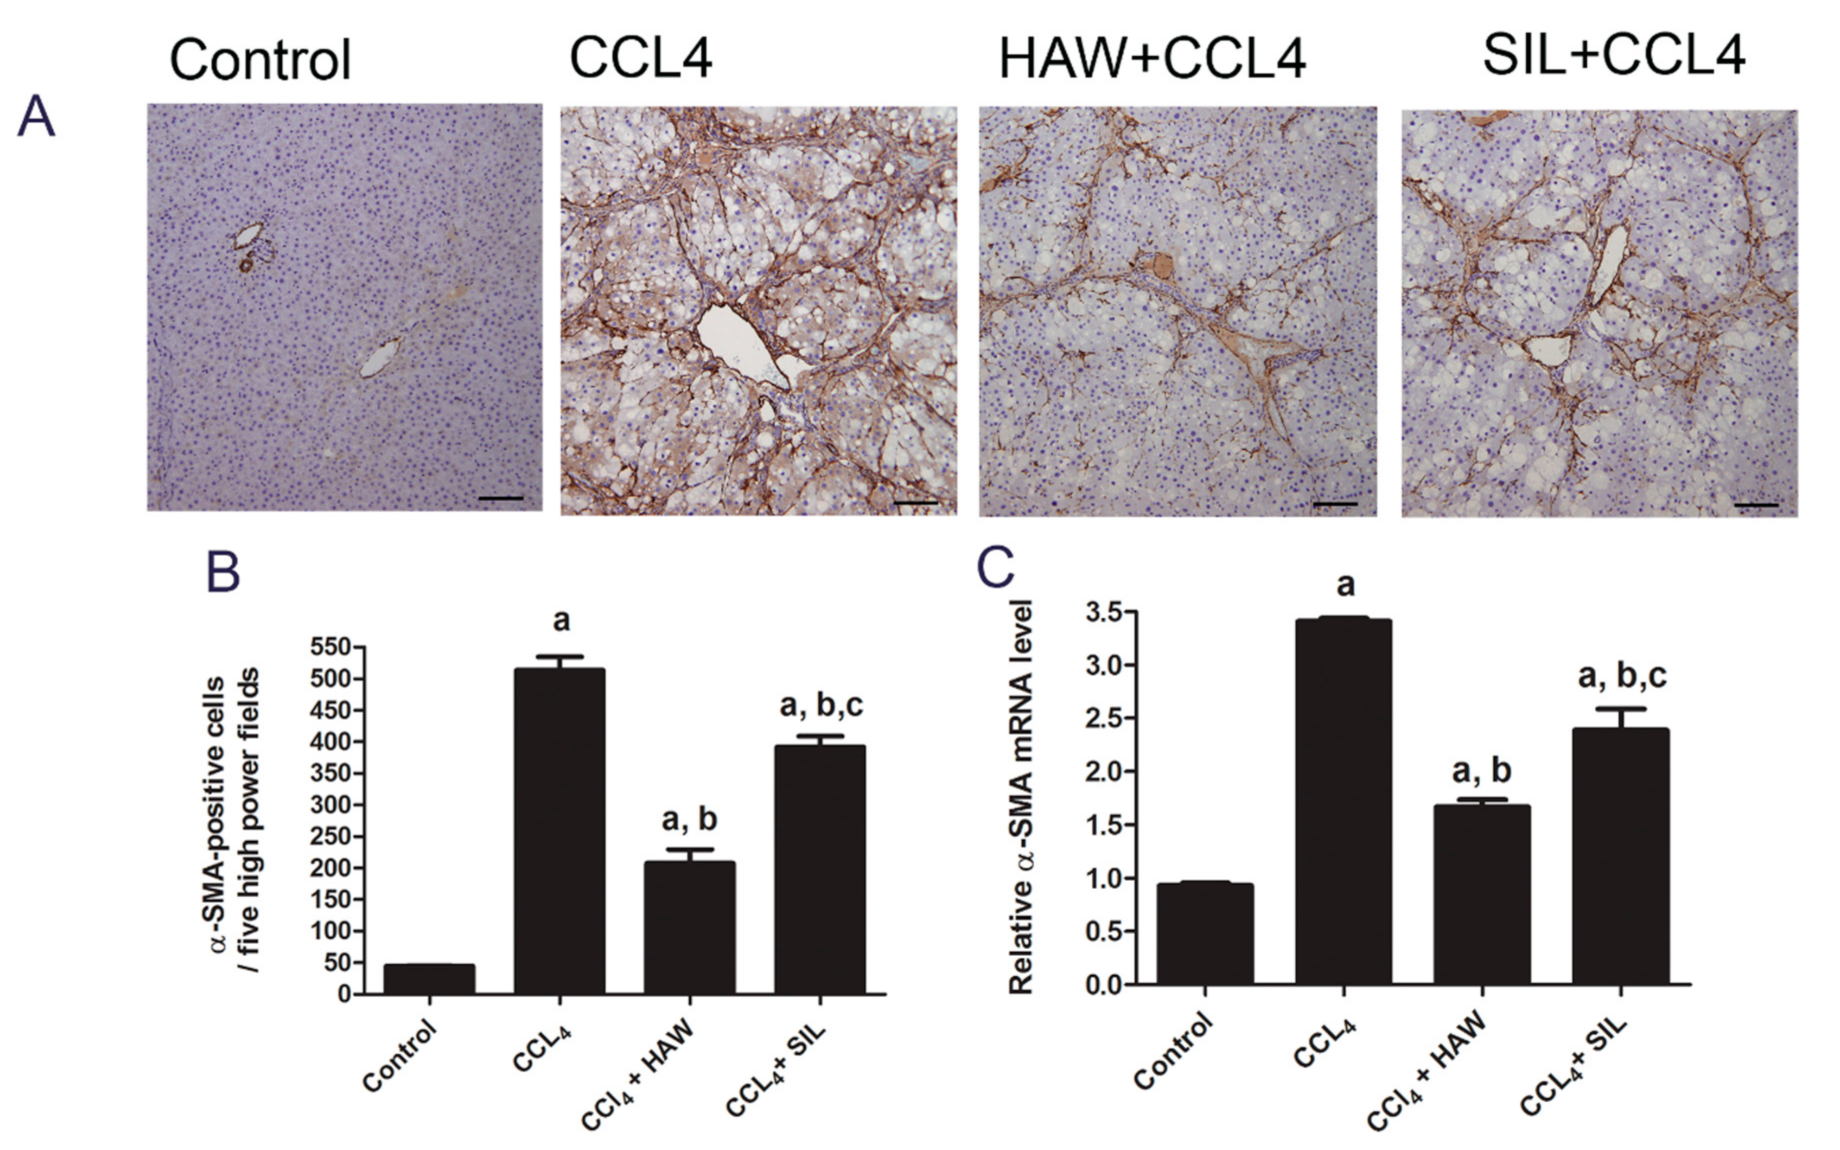
3.3. HAW Ameliorated Overexpression of α-SMA in CCl4-Induced Liver Fibrosis in Rats
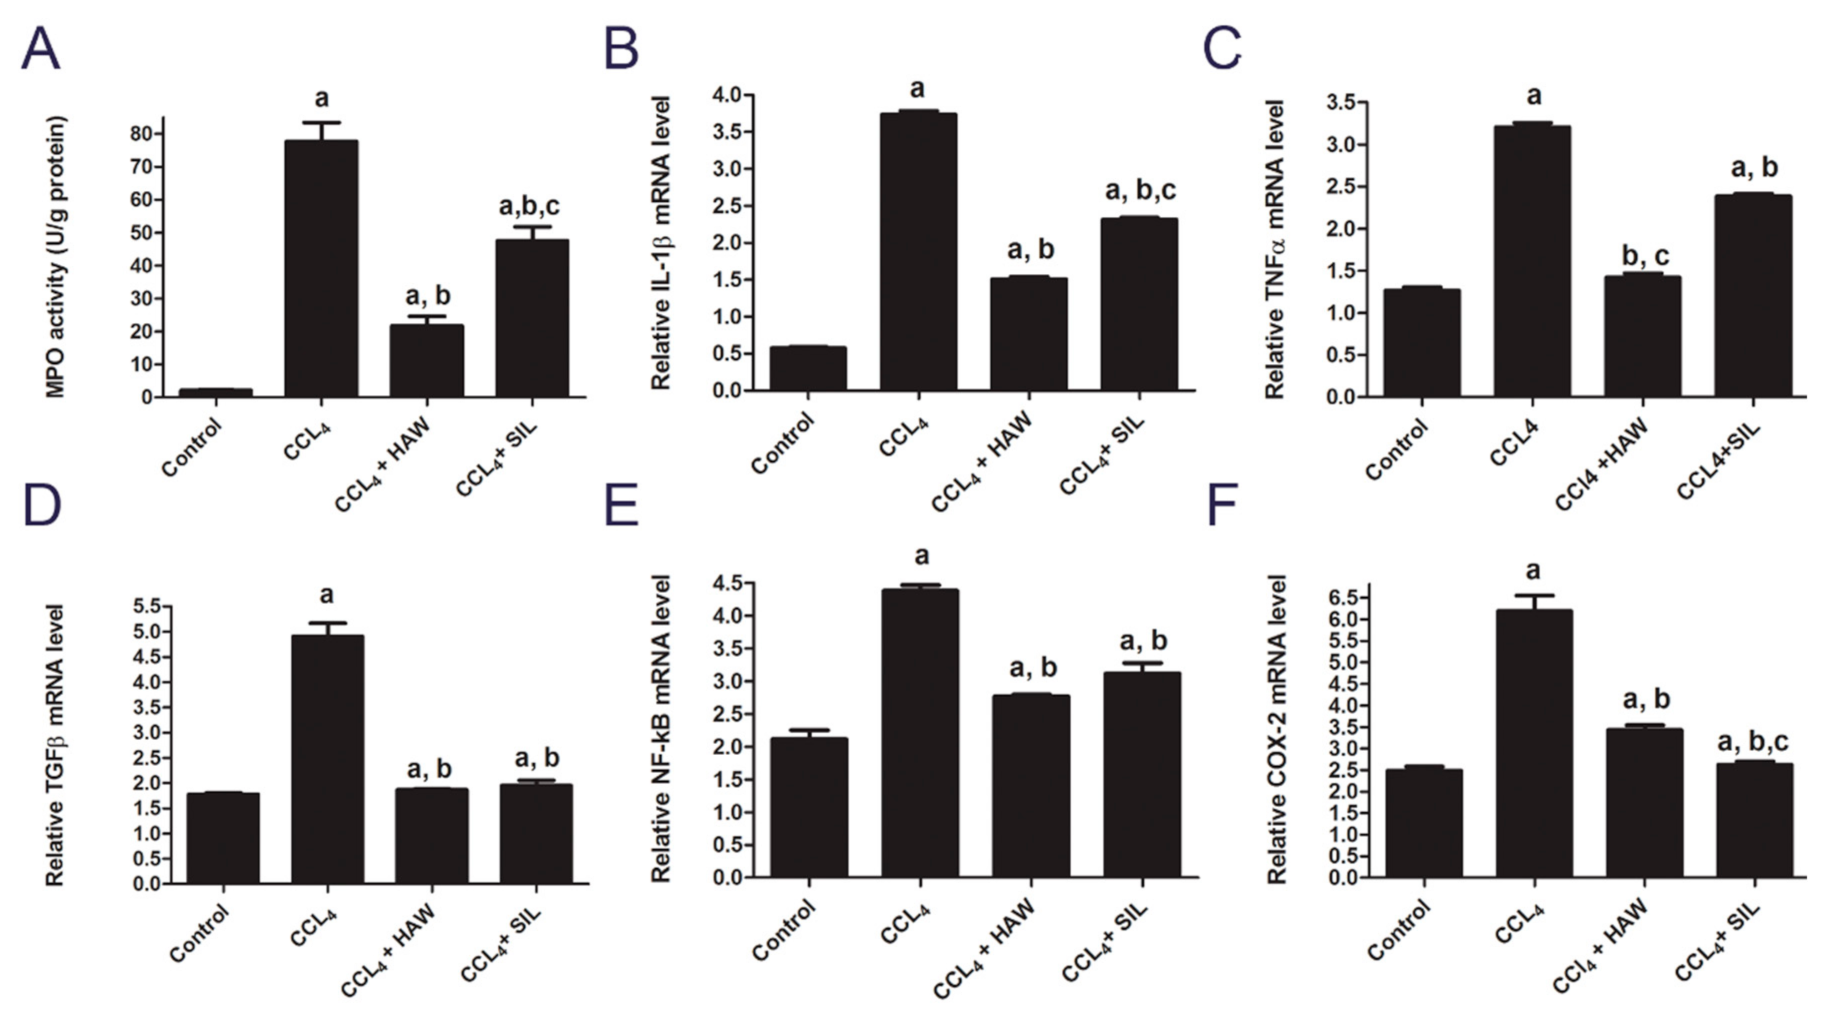
3.4. HAW Ameliorated Overexpression of Inflammatory Markers in CCl4-Induced Liver Fibrosis in Rats
3.5. HAW Ameliorated Oxidative Stress in CCl4-Induced Liver Fibrosis in Rats
3.6. Total Antioxidant Capacity and Phenolic Content of HAW
4. Discussion
5. Conclusions
Author Contributions
Funding
Acknowledgments
Conflicts of Interest
Abbreviations
| HAW | Hawthorn |
| CCl4 | Carbon tetrachloride |
| CO | Crataegus oxyacanthine |
| IL1B | interleukin-IL-1β |
| TNF-α | tumor necrosis factor-α |
| TGF-β 1 | transforming growth factor-β 1 |
| NFkB | nuclear factor kappa-B |
| COX-2 | cyclooxygenase-2 |
| MPO | the myeloperoxidase |
| MDA | malondialdehyde |
| P.Carbonyl | Protein carbonyl |
| SOD | superoxide dismutase |
| α-SMA | alpha-smooth muscle actin |
| SIL | silymarin |
| ROS | reactive oxygen species |
| HSC | hepatic stellate cells |
| H & E | hematoxylin and eosin |
| HP | hydroxyproline |
| TAC | total antioxidant capacity |
| FRAP | ferric reducing antioxidant power |
| AST | aspartate aminotransferase |
| ALT | alanine aminotransferase |
| GGT | gamma-glutamyl transferase |
References
- Schuppan, D.; Ashfaq-Khan, M.; Yang, A.T.; Kim, Y.O. Liver fibrosis: Direct antifibrotic agents and targeted therapies. Matrix Biol. J. Int. Soc. Matr. Biol. 2018, 68, 435–451. [Google Scholar] [CrossRef] [PubMed]
- Cordero-Espinoza, L.; Huch, M. The balancing act of the liver: Tissue regeneration versus fibrosis. J. Clin. Investig. 2018, 128, 85–96. [Google Scholar] [CrossRef] [PubMed] [Green Version]
- Shay, J.E.S.; Hamilton, J.P. Hepatic fibrosis: Avenues of investigation and clinical implications. Clin. Liver Dis. 2018, 11, 111–114. [Google Scholar] [CrossRef] [PubMed]
- Friedman, S.L. Hepatic fibrosis, Overview. Toxicology 2008, 254, 120–129. [Google Scholar] [CrossRef]
- Higashi, T.; Friedman, S.L.; Hoshida, Y. Hepatic stellate cells as key target in liver fibrosis. Adv. Drug Deliv. Rev. 2017, 121, 27–42. [Google Scholar] [CrossRef]
- Clichici, S.; Olteanu, D.; Nagy, A.L.; Oros, A.; Filip, A.; Mircea, P.A. Silymarin inhibits the progression of fibrosis in the early stages of liver injury in CCl4-treated rats. J. Med. Food 2015, 18, 290–298. [Google Scholar] [CrossRef]
- Ali, M.; Khan, T.; Fatima, K.; Ali, Q.U.A.; Ovais, M.; Khalil, A.T.; Ullah, I.; Raza, A.; Shinwari, Z.K.; Idrees, M. Selected hepatoprotective herbal medicines: Evidence from ethnomedicinal applications, animal models, and possible mechanism of actions. Phytother. Res. 2018, 32, 199–215. [Google Scholar] [CrossRef] [Green Version]
- Ni, M.M.; Wang, Y.R.; Wu, W.W.; Xia, C.C.; Zhang, Y.H.; Xu, J.; Xu, T.; Li, J. Novel Insights on Notch signaling pathways in liver fibrosis. Eur. J. Pharmacol. 2018, 826, 66–74. [Google Scholar] [CrossRef]
- Tsuchida, T.; Friedman, S.L. Mechanisms of hepatic stellate cell activation. Nat. Rev. Gastroenterol. Hepat. 2017, 14, 397–411. [Google Scholar] [CrossRef]
- Chen, L.; Deng, H.; Cui, H.; Fang, J.; Zuo, Z.; Deng, J.; Li, Y.; Wang, X.; Zhao, L. Inflammatory responses and inflammation-associated diseases in organs. Oncotarget 2018, 9, 7204–7218. [Google Scholar] [CrossRef] [Green Version]
- Bae, M.; Park, Y.K.; Lee, J.Y. Food components with antifibrotic activity and implications in prevention of liver disease. J. Nutr. Biochem. 2018, 55, 1–11. [Google Scholar] [CrossRef] [PubMed]
- Mahmoud-Ghoneim, D.; Amin, A.; Corr, P. MRI-based texture analysis: A potential technique to assess protectors against induced-liver fibrosis in rats. Radiol. Oncol. 2009, 43, 30–40. [Google Scholar] [CrossRef] [Green Version]
- Amin, A.; Mahmoud-Ghoneim, D. Texture analysis of liver fibrosis microscopic images: A study on the effect of biomarkers. Acta Biochim. Biophys. Sin. 2011, 43, 193–203. [Google Scholar] [CrossRef] [PubMed] [Green Version]
- El-Kharrag, R.; Amin, A.; Hisaindee, S.; Greish, Y.; Karam, S.M. Development of a therapeutic model of precancerous liver using crocin-coated magnetite nanoparticles. Int. J. Oncol. 2017, 50, 212–222. [Google Scholar] [CrossRef] [Green Version]
- Hamza, A.A.; Heeba, G.H.; Elwy, H.M.; Murali, C.; El-Awady, R.; Amin, A. Molecular characterization of the grape seeds extract’s effect against chemically induced liver cancer: In vivo and in vitro analyses. Sci. Rep. 2018, 8, 1270. [Google Scholar] [CrossRef] [Green Version]
- Jaggi, A.S.; Singh, N. Silymarin and Its Role in Chronic Diseases. Adv. Exp. Med. Biol. 2016, 929, 25–44. [Google Scholar]
- Domitrovic, R.; Jakovac, H.; Romic, Z.; Rahelic, D.; Tadic, Z. Antifibrotic activity of Taraxacum officinale root in carbon tetrachloride-induced liver damage in mice. J. Ethnopharmacol. 2010, 130, 569–577. [Google Scholar] [CrossRef]
- Caliskan, O. Mediterranean Hawthorn Fruit (Crataegus) Species and Potential Usage. In The Mediterranean Diet; Academic Press: Cambridge, MA, USA, 2015; pp. 621–628. [Google Scholar]
- Kashyap, C.; Arya, V.; Thakur, N. Ethnomedicinal and phytopharmacological potential of Crataegus oxyacantha Linn.–A review. Asian Pac. J. Trop. Biomed. 2012, 2, S1194–S1199. [Google Scholar] [CrossRef]
- Zorniak, M.; Szydlo, B.; Krzeminski, T. Review atricle, CRATAEGUS special extract WS 1442. J. Physiol. Pharmacol. 2017, 68, 521–526. [Google Scholar]
- Bekbolatova, E.; Kukula-Koch, W.; Baj, T.; Stasiak, N.; Ibadullayeva, G.; Koch, W.; Głowniak, K.; Tulemissov, S.; Sakipova, Z.; Boylan, F. Phenolic composition and antioxidant potential of different organs of Kazakh Crataegus almaatensis Pojark: A comparison with the European Crataegus oxyacantha L. flowers. Open Chem. 2018, 16, 415–426. [Google Scholar] [CrossRef]
- Elango, C.; Jayachandaran, K.S.; Devaraj, S.N. Hawthorn extract reduces infarct volume and improves neurological score by reducing oxidative stress in rat brain following middle cerebral artery occlusion. Int. J. Dev. Neurosci. 2009, 27, 799–803. [Google Scholar] [CrossRef] [PubMed]
- Paul, S.; Sharma, S.; Paliwal, S.K.; Kasture, S. Role of Crataegus oxyacantha (Hawthorn) on scopolamine induced memory deficit and monoamine mediated behaviour in rats. Orient. Pharm. Exp. Med. 2017, 17, 315–324. [Google Scholar] [CrossRef]
- Cuevas-Durán, R.; Medrano-Rodríguez, J.; Sánchez-Aguilar, M.; Soria-Castro, E.; Rubio-Ruíz, M.; Valle-Mondragón, D.; Sánchez-Mendoza, A.; Torres-Narvaéz, J.; Pastelín-Hernández, G.; Ibarra-Lara, L. Extracts of crataegus oxyacantha and rosmarinus officinalis attenuate ischemic myocardial damage by decreasing oxidative stress and regulating the production of cardiac vasoactive agents. Int. J. Mol. Sci. 2017, 18, 2412. [Google Scholar] [CrossRef] [PubMed] [Green Version]
- Ranjbar, K.; Zarrinkalam, E.; Salehi, I.; Komaki, A.; Fayazi, B. Cardioprotective effect of resistance training and Crataegus oxyacantha extract on ischemia reperfusion–induced oxidative stress in diabetic rats. Biomed. Pharmacother. 2018, 100, 455–460. [Google Scholar] [CrossRef] [PubMed]
- Rezaei-Golmisheh, A.; Malekinejad, H.; Asri-Rezaei, S.; Farshid, A.A.; Akbari, P. Hawthorn ethanolic extracts with triterpenoids and flavonoids exert hepatoprotective effects and suppress the hypercholesterolemia-induced oxidative stress in rats. Iran. J. Basic Med. Sci. 2015, 18, 691–699. [Google Scholar]
- Saeedi, G.; Jeivad, F.; Goharbari, M.; Gheshlaghi, G.H.; Sabzevari, O. Ethanol extract of Crataegus oxyacantha L. ameliorate dietary non-alcoholic fatty liver disease in rat. Drug Res. 2018, 68, 553–559. [Google Scholar] [CrossRef]
- Salam, O.M.A.; Sleem, A.A.; Shafee, N. Effect of Crataegus extract on carbon tetrachloride-induced hepatic damage. Com. Clin. Pathol. 2012, 21, 1719–1726. [Google Scholar] [CrossRef]
- Amin, A.; Mahmoud-Ghoneim, D. Zizyphusspina-christi protects against carbon tetrachloride-induced liver fibrosis in rats. Food Chem. Toxicol. 2009, 47, 2111–2119. [Google Scholar] [CrossRef]
- Hamza, A.A. Ameliorative effects of Moringa oleifera Lam seed extract on liver fibrosis in rats. Food and chemical toxicology: An international journal published for the British Ind. Biologic. Res. Assoc. 2010, 48, 345–355. [Google Scholar]
- Han, X.; Li, W.; Huang, D.; Yang, X. Polyphenols from hawthorn peels and fleshes differently mitigate dyslipidemia, inflammation and oxidative stress in association with modulation of liver injury in high fructose diet-fed mice. Chem. Biol. Interact. 2016, 257, 132–140. [Google Scholar] [CrossRef]
- Wahid, B.; Ali, A.; Rafique, S.; Saleem, K.; Waqar, M.; Wasim, M.; Idrees, M. Role of altered immune cells in liver diseases: A review. Gastroenterol. Hepatol. 2018, 41, 377–388. [Google Scholar] [CrossRef] [PubMed]
- Fortea, J.I.; Fernández-Mena, C.; Puerto, M.; Ripoll, C.; Almagro, J.; Bañares, J.; Bellón, J.M.; Bañares, R.; Vaquero, J. Comparison of Two Protocols of Carbon Tetrachloride-Induced Cirrhosis in Rats—Improving Yield and Reproducibility. Sci. Rep. 2018, 8, 9163. [Google Scholar] [CrossRef] [PubMed] [Green Version]
- Varga, J.; Brenner, D.; Phan, S.H. Fibrosis Research: Methods and Protocols; Springer Science & Business Media: Berlin/Heidelberg, Germany, 2005; Volume 117. [Google Scholar]
- Edwards, C.A.; Brien, W.D. Modified assay for determination of hydroxyproline in a tissue hydrolyzate. Clin. Chem. Acta 1980, 104, 161–167. [Google Scholar] [CrossRef] [Green Version]
- Gérard-Monnier, D.; Erdelmeier, I.; Régnard, K.; Moze-Henry, N.; Yadan, J.-C.; Chaudiere, J. Reactions of 1-methyl-2-phenylindole with malondialdehyde and 4-hydroxyalkenals. Analytical applications to a colorimetric assay of lipid peroxidation. Chem. Res. Toxicol. 1998, 11, 1176–1183. [Google Scholar] [CrossRef]
- Reznick, A.Z.; Packer, L. Oxidative damage to proteins: Spectrophotometric method for carbonyl assay. In Methods in Enzymology; Elsevier: Amsterdam, The Netherlands, 1994; Volume 233, pp. 357–363. [Google Scholar]
- Nandi, A.; Chatterjee, I. Assay of superoxide dismutase activity in animal tissues. J. Biosci. 1988, 13, 305–315. [Google Scholar] [CrossRef]
- Hillegass, L.; Griswold, D.; Brickson, B.; Albrightson-Winslow, C. Assessment of myeloperoxidase activity in whole rat kidney. J. Pharmacol. Methods 1990, 24, 285–295. [Google Scholar] [CrossRef]
- Peterson, G.L. A simplification of the protein assay method of Lowry et al. which is more generally applicable. Anal. Biochem. 1977, 83, 346–356. [Google Scholar] [CrossRef]
- Singleton, V.L.; Orthofer, R.; Lamuela-Raventos, R.M. Analysis of total phenols and other oxidation substrates and antioxidants by means of folin-ciocalteu reagent. In Methods in Enzymology; Packer, L., Ed.; Academic Press: London, UK; New York, NY, USA; Tokyo, Japan; Harcourt Brace & Company: San Diego, CA, USA, 1999; Volume 299, pp. 152–178. [Google Scholar]
- Benzie, I.F.; Strain, J.J. The ferric reducing ability of plasma (FRAP) as a measure of (antioxidant power): The FRAP assay. Anal. Biochem. 1996, 293, 70–76. [Google Scholar] [CrossRef] [Green Version]
- Liu, P.; Kallio, H.; Lü, D.; Zhou, C.; Yang, B. Quantitative analysis of phenolic compounds in Chinese hawthorn (Crataegus spp.) fruits by high performance liquid chromatography–electrospray ionisation mass spectrometry. Food Chem. 2011, 127, 1370–1377. [Google Scholar] [CrossRef]
- Omara, E.A.; El-Toumy, S.A.; Shabana, M.E.; Farrag, A.R.H.; Nada, S.A.; Shafee, N. The antifibrotic effect of Zilla spinosa extracts targeting apoptosis in CCl4-induced liver damage in rats. J. Arab. Soc. Med. Res. 2018, 13, 129–143. [Google Scholar] [CrossRef]
- Atzori, L.; Poli, G.; Perra, A. Hepatic stellate cell: A star cell in the liver. Int. J. Biochem. Cell Biol. 2009, 41, 1639–1642. [Google Scholar] [CrossRef] [PubMed]
- Weiskirchen, R. Hepatoprotective and anti-fibrotic agents: It’s time to take the next step. Front. Pharmacol. 2016, 6, 303. [Google Scholar] [CrossRef] [PubMed] [Green Version]
- Sagaradze, V.; Babaeva, E.Y.; Kalenikova, E. HPLC-UV method for determing flavonoids in Hawthorn flowers and leaves. Pharm. Chem. J. 2017, 51, 277–280. [Google Scholar] [CrossRef]
- Schlegelmilch, R.; Heywood, R. Toxicity of Crataegus (hawthorn) extract (WS 1442). J. Am. Coll. Toxicol. 1994, 13, 103–111. [Google Scholar] [CrossRef]


| Gene Name | Primer Sequence: 5′-3′ | Gene Bank Accession Number |
|---|---|---|
| TNF-α | F: AACTCGAGTGACAAGCCCGTAG R: GTACCACCAGTTGGTTGTCTTTGA | NM_012675.3 |
| NF-kB | F: CATTGAGGTGTATTTCACGG R: GAACACAATGGCCACTTGCC | NM_199267.2 |
| IL-1β | F: GCTGTGGCAGCTACCTATGTCTTG R: AGGTCGTCATCATCCCACGAG | NM_031512.2 |
| COX-2 | F: ACTTGCTCACTTTGTTTCATTC R: TTTGATTAGTACTGTAGGGTTAATG | S67722.1 |
| TGF-β | F: TGCGCCTGCAGAGATTCAAG R: AGGTAACGCCAGGAATTGTTGCTA | NM_021578.2 |
| α-SMA | F: ACCAACTGGGACGACATGGAG R: CGTGAGGATCTTCATGAGGTAGTC | NM_031004.2 |
| Colla1 | F: GAACTTGGGGCAAGACAGTCA R: GTCACGTTCAGTTGGTCAA | NM_053304.1 |
| Colla3 | F: TTGATGTGCAGCTGGCATTC R: GCCACTGGCCTGATCCATAT | NM_009930 |
| GAPDH | F: CCCCTTCATTGACCTCAACTACATGG R: GCCTGCTTCACCACCTTCTTGATGTC | NM_017008.4 |
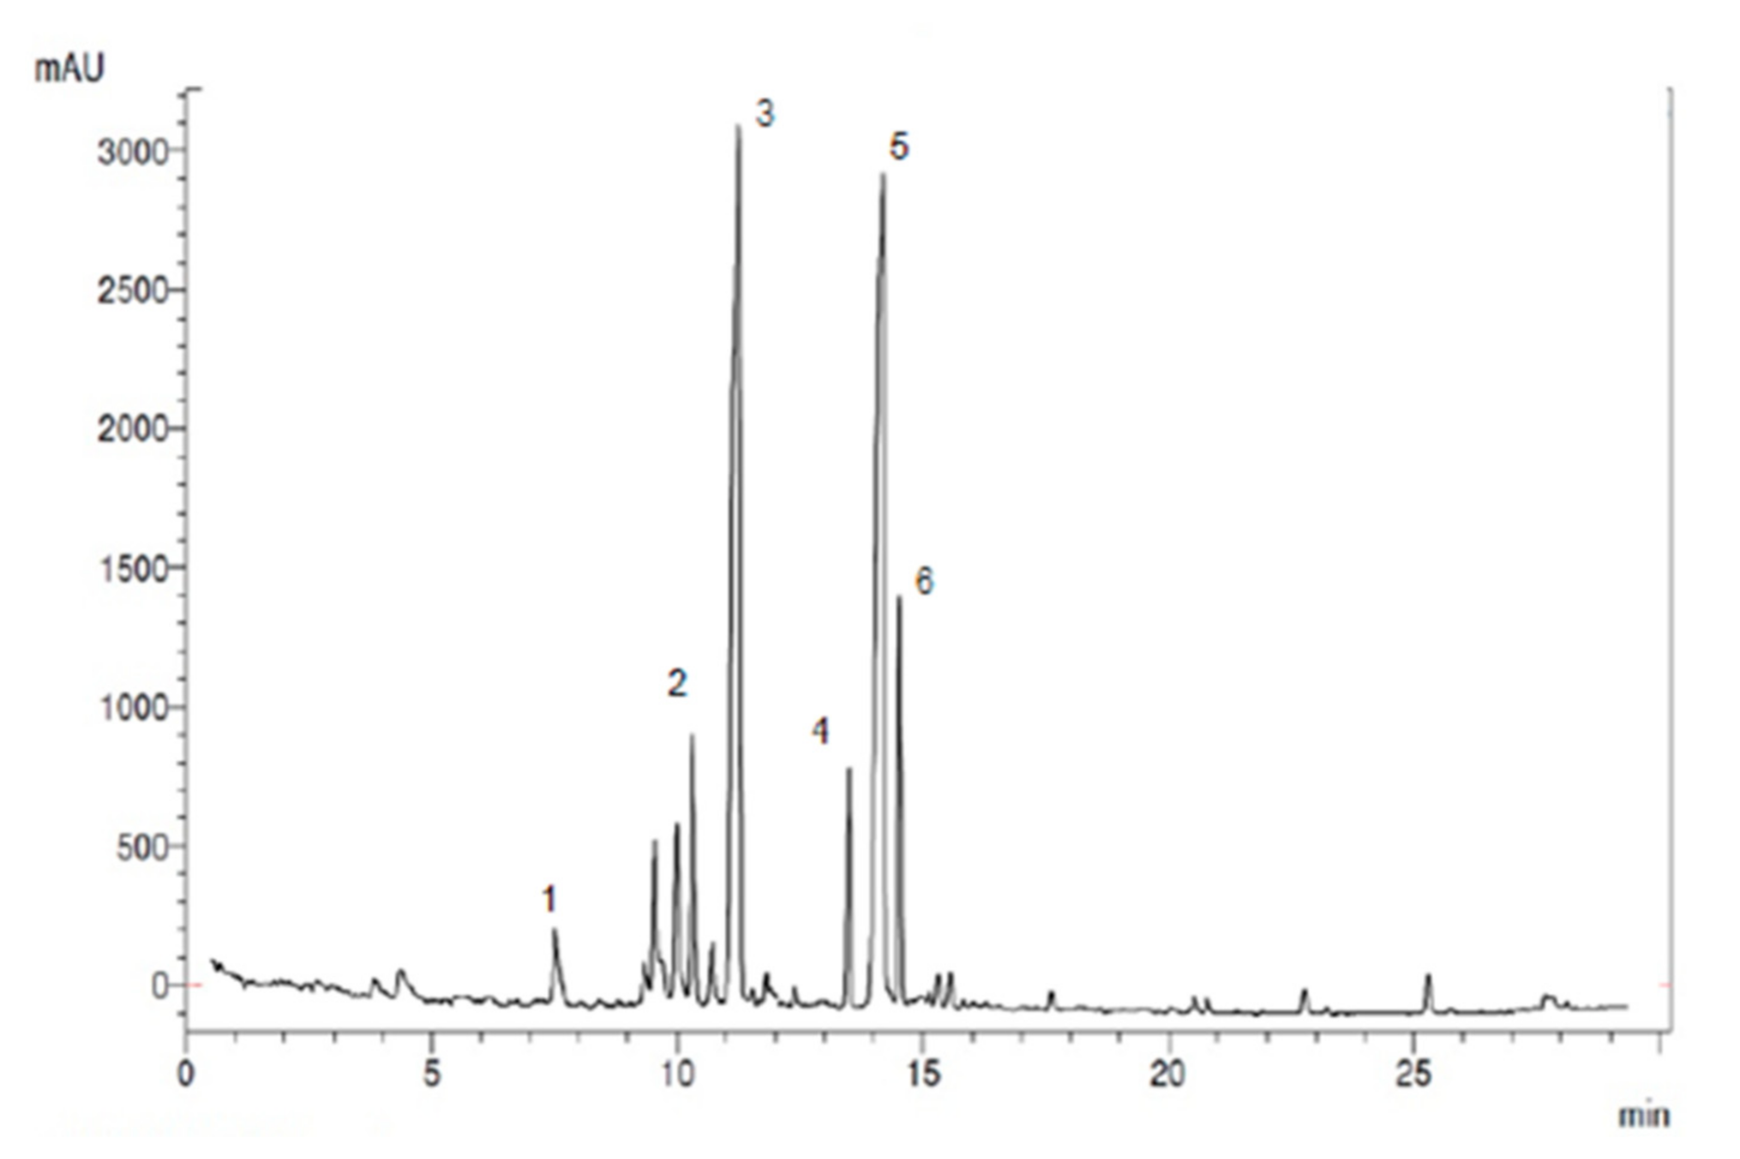
| Compound | Retention Time/min | Amount of Compounds | |
|---|---|---|---|
| a | Total antioxidants content | - | 877.8 ± 5.33 µmol/g |
| b | Total phenolic content | - | 150.37 ± 1.33 mg/g |
| 1 | Chlorogenic | 7.2 | 5.22 ± 0.01 mg/g |
| 2 | Vitexin | 10.3 | 15.12± 0.13 mg/g |
| 3 | Rutin | 11.2 | 30.77± 0.13 mg/g |
| 4 | Epicatechin | 13.5 | 11.23 ± 0.01 mg/g |
| 5 | Quercetin | 14.01 | 32.14 ± 0.11 mg/g |
| 6 | Iso quercetin | 14.5 | 17.05 ± 1.13 mg/g |
Publisher’s Note: MDPI stays neutral with regard to jurisdictional claims in published maps and institutional affiliations. |
© 2020 by the authors. Licensee MDPI, Basel, Switzerland. This article is an open access article distributed under the terms and conditions of the Creative Commons Attribution (CC BY) license (http://creativecommons.org/licenses/by/4.0/).
Share and Cite
Hamza, A.A.; Lashin, F.M.; Gamel, M.; Hassanin, S.O.; Abdalla, Y.; Amin, A. Hawthorn Herbal Preparation from Crataegus oxyacantha Attenuates In Vivo Carbon Tetrachloride -Induced Hepatic Fibrosis via Modulating Oxidative Stress and Inflammation. Antioxidants 2020, 9, 1173. https://doi.org/10.3390/antiox9121173
Hamza AA, Lashin FM, Gamel M, Hassanin SO, Abdalla Y, Amin A. Hawthorn Herbal Preparation from Crataegus oxyacantha Attenuates In Vivo Carbon Tetrachloride -Induced Hepatic Fibrosis via Modulating Oxidative Stress and Inflammation. Antioxidants. 2020; 9(12):1173. https://doi.org/10.3390/antiox9121173
Chicago/Turabian StyleHamza, Alaaeldin Ahmed, Fawzy Mohamed Lashin, Mona Gamel, Soha Osama Hassanin, Youssef Abdalla, and Amr Amin. 2020. "Hawthorn Herbal Preparation from Crataegus oxyacantha Attenuates In Vivo Carbon Tetrachloride -Induced Hepatic Fibrosis via Modulating Oxidative Stress and Inflammation" Antioxidants 9, no. 12: 1173. https://doi.org/10.3390/antiox9121173
APA StyleHamza, A. A., Lashin, F. M., Gamel, M., Hassanin, S. O., Abdalla, Y., & Amin, A. (2020). Hawthorn Herbal Preparation from Crataegus oxyacantha Attenuates In Vivo Carbon Tetrachloride -Induced Hepatic Fibrosis via Modulating Oxidative Stress and Inflammation. Antioxidants, 9(12), 1173. https://doi.org/10.3390/antiox9121173