Article

Proteomics Study of Peripheral Blood Mononuclear Cells in Down Syndrome Children

1
Department of Biochemical Sciences “A. Rossi Fanelli”, Laboratory Affiliated to Istituto Pasteur Italia-Fondazione Cenci Bolognetti, Sapienza University of Rome, 00185 Rome, Italy
2
Department of Basic Biotechnological Sciences, Intensivological and Perioperative Clinics, Università Cattolica del Sacro Cuore, 00168 Rome, Italy
3
Department of Laboratory Diagnostic and Infectious Diseases, Fondazione Policlinico Universitario Agostino Gemelli-IRCCS, 00168 Rome, Italy
4
Pediatric and Infectious Disease Unit, Bambino Gesù Children’s Hospital, 00165 Rome, Italy
5
Department of Pediatric Hematology/Oncology and of Cell and Gene Therapy, Bambino Gesù Children’s Hospital, 00165 Rome, Italy
6
Department of Gynecology/Obstetrics and Pediatrics, Sapienza University of Rome, 00185 Rome, Italy
*
Author to whom correspondence should be addressed.
The authors contributed equally to the work.
Antioxidants 2020, 9(11), 1112; https://doi.org/10.3390/antiox9111112
Submission received: 29 September 2020 / Revised: 22 October 2020 / Accepted: 9 November 2020 / Published: 11 November 2020
(This article belongs to the Special Issue Oxidative Stress and Neurodegenerative Disorders)

Abstract

:
Down syndrome (DS) is the most common chromosomal disorder and the leading genetic cause of intellectual disability in humans, which results from the triplication of chromosome 21. To search for biomarkers for the early detection and exploration of the disease mechanisms, here, we investigated the protein expression signature of peripheral blood mononuclear cells (PBMCs) in DS children compared with healthy donors (HD) by using an in-depth label-free shotgun proteomics approach. Identified proteins are found associated with metabolic pathways, cellular trafficking, DNA structure, stress response, cytoskeleton network, and signaling pathways. The results showed that a well-defined number of dysregulated pathways retain a prominent role in mediating DS pathological features. Further, proteomics results are consistent with published study in DS and provide evidences that increased oxidative stress and the increased induction of stress related response, is a participant in DS pathology. In addition, the expression levels of some key proteins have been validated by Western blot analysis while protein carbonylation, as marker of protein oxidation, was investigated. The results of this study propose that PBMCs from DS children might be in an activated state where endoplasmic reticulum stress and increased production of radical species are one of the primary events contributing to multiple DS pathological features.

1. Introduction

Down syndrome (DS) is the most common chromosomal abnormality among live-born infants. The number of people with DS living in the United States has grown from 49,923 in 1950 to 206,366 in 2010 [1]. There are no population-based registries in Italy, but the prevalence of people with DS living is estimated at approximately 30,000. Life expectancy in children with DS has increased significantly over the past decade, but children with DS remain at higher risk of neonatal and infant mortality than children without DS, respectively (1.65% vs. 0.36 and 4% vs. 0.48%) [2]. Some of the most prominent features of the DS phenotype include mental retardation as well as an increased incidence of congenital heart disease, hypothyroidism, diabetes, leukemia and by the age of 40 they reported an increased risk of developing Alzheimer like dementia [3,4,5,6,7,8,9]. Furthermore, patients with DS show multiple defects in both numbers and function of innate and adaptive immunity [10,11]. Recent studies also stated that DS is associated with a primary defect of the B-cell compartment, characterized by a reduced number of IgM memory B and switched memory B [12,13]. Therefore, children with DS show a high susceptibility to recurrent infections, characterized by increased severity and a prolonged course [14]. No single gene or region of human chromosome 21 has been found to be responsible for all the common features of DS [15,16], therefore, it would be expected that multiple genes and other factors working in concert are responsible for the major DS phenotypes [4,5,6,7]. Consequently, most of the focus in the field has been focused to understand how the alterations in the expression of specific genes in Chr21 trisomic cells lead to developmental dysfunction and pathological manifestations [17]. Chronic oxidative stress (OS) and mitochondrial dysfunction are the key factors that are thought to contribute to additional clinical conditions observed in individuals with DS such as diabetes, immune system abnormalities, and autism spectrum disorder, as well as to the development of Alzheimer’s disease (AD) [18,19,20,21,22]. Increased OS has been linked to the triplication of the Cu/Zn superoxide dismutase (SOD), the transcription factor Ets-2, the stress-inducing factors DSCR1, and the amyloid precursor protein (APP), and it has been consistently observed in different DS primary cells including fibroblasts [20,23], cortical neurons, astrocytes, pancreatic cells, and lymphoblastic cell lines from both DS young and old patients [22,24,25].
The increase of OS results from increased basal levels of mitochondrial reactive oxygen species (ROS), deficits in electron transport chain components deficit in mitochondrial complex I, ATP synthase, ADP/ATP translocator, and adenylate kinase activities [23,26] from an adaptive downregulation of mitochondrial activity and from a reduction of antioxidant response [23,27,28]. Mitochondrial DNA mutations and alteration in mtDNA have also been reported in fibroblasts derived from people with DS and in DS brain tissue [29,30]. Furthermore, induced pluripotent stem cells (iPSCs) from people with DS and iPSCs-derived DS neurons show oxidative hallmarks and are more sensitive to oxidative damage than control cells [31,32]. Fragmented and bioenergetically inefficient mitochondria have also been observed in DS as a result of impaired MQC [33].
Recent studies on human and murine samples described a strong and complex crosstalk between altered protein homeostasis and OS in DS pathology [34,35,36,37,38]. Increased OS can target and aberrantly stimulate stress response pathways, thus promoting the dysregulation of protein homeostasis [35,39,40,41,42]. In the last years, the dysregulation of the unfolded protein response (UPR), as well as, the failure of autophagy and ubiquitin proteasome system (UPS) degradative pathways have been observed in DS and are emerging as a strong candidate mechanisms involved in the development of pathological conditions [43,44,45,46,47]. In addition, studies from Potier’s laboratory and others reported endosomal enlargement in peripheral and neuronal cells from DS cases supporting a role for early endosomal dysfunction and aberrantly regulated endosomal trafficking in the toxic events leading to DS pathology in the brain and in other organs [48,49,50,51,52]. An increasing number of studies also demonstrated that DS subjects are at high risk to develop either peripheral or brain metabolic defects, characterized by the dysregulation of the insulin signaling with reduced downstream pathways, and altered mitochondrial structure and function that, in turn, is associated with increased ROS production and OS [53].
In the present study, we performed a high-definition label-free shotgun proteomics analysis on PBMCs samples from DS and healthy children (healthy donors, HD) to identify novel molecular mechanisms in DS pathology and to investigate potential biomarkers based on the identified proteins in young diseased individuals. Results obtained from the comparative protein expression analysis confirmed that a well-defined number of dysregulated pathways, including stress responses, cellular trafficking, energy metabolism, and cell structure retain a prominent role in mediating DS pathological features.

2. Materials and Methods

2.1. Study Population

For this study, we recruited individuals referring from the Down Syndrome and Pediatric outpatient Clinic of Bambino Gesù Children’s Hospital in Rome. All the study participants underwent complete clinical workup including medical history collection, clinical examination, thropometric measurements and laboratory test. In Table 1 are listed all the clinical data of the subjects enrolled in the study including gender, age of participants, their body mass index calculated [BMI; weight (kg) × squared height (m2)], and comorbidities; for children under the age of 2 years old we did not calculate the BMI but the ratio between weight/height and the relative’s centile. The study was approved by the Ethical Committee of Bambino Gesù Children Hospital in Rome, Italy (protocol # 1771_OPBG_2019).

2.2. Samples Collection of Peripheral Blood Mononuclear Cells from HD and DS Subjects

Peripheral blood mononuclear cell (PBMC) was isolated from DS and healthy donors (HD) blood samples. For the isolation of PBMC, ACD-A-anticoagulated blood was centrifuged at 800× g for 30 min and the top layer containing the plasma was removed. The remaining blood was diluted with an equal volume of phosphate-buffered saline, pH 7.4 (PBS), containing 0.05 M ethylenediaminetetraacetic acid (EDTA; Invitrogen Corporation, Carlsbad, CA, USA). Total of 12.5 mL of diluted blood was layered over 25 mL of the Ficoll-Paque PLUS (GE Healthcare, Chicago, IL, USA). Gradients were centrifuged at 400× g for 30 min at room temperature in a swinging-bucket rotor without applying brake. The PBMC interface was prudently removed by pipetting and washed with PBS-EDTA by centrifugation at 250× g for 10 min. PBMC pellets were suspended in ammonium-chloride-potassium (ACK) lysing buffer (Invitrogen Corporation, Carlsbad, CA, USA) and incubated for 10 min at room temperature with gentle mixing to lyse the contaminating red blood cells (RBC), then washed with PBS-EDTA. Cell number and viability were determined using a countess automated cell counter (Invitrogen Corporation, Carlsbad, CA, USA). Non-viable cells were identified by staining with trypan blue, and cell viability was calculated using the total cell count and the count of non-viable cells. PBMCs were cryopreserved in liquid nitrogen in fetal calf serum (FCS; Invitrogen, Carlsbad, CA, USA) containing 10% dimethyl sulfoxide (DMSO; Thermo Fisher Scientific, Waltham, MA, USA) and stored until required for downstream analyses.

2.3. Protein Sample Preparation

The total protein extract from PBMCs was prepared in RIPA buffer (pH = 7.4) containing tris-HCl (50 mM pH = 7.4), NaCl (150 mM), 1% NP-40, 0.25% sodium deoxycholate, 1 mM EDTA, 0.1% SDS, supplemented with phosphatase and protease inhibitor (539132, Millipore, 1:100; P0044; Sigma-Aldrich, St. Louis, MO, USA; 1:100). Before clarification, the samples were sonicated on ice and then centrifuged at 16,000× rpm at 4 °C for 30 min to remove cellular debris. The supernatant was then used to determine the total protein concentration by the BCA method (Pierce, Rockford, IL, USA).

2.4. Protein Expression Analysis by nLC–HDMSE

Briefly, protein extracts derived from peripheral blood mononuclear cells (PBMCs) isolated from 6 DS subjects and 6 healthy donors (HD) blood samples were handled for enzymatic digestion according to the filter-aided sample preparation (FASP) protocol [54]. Briefly, as shown below the following steps were performed using filter tubes (Nanosep centrifugal device with Omega membrane-10 K MWCO): reduction (DTT 8 mM in urea buffer-8 M urea, and 100 mM Tris), alkylation (IAA 50 mM in urea buffer 8 M urea, and 100 mM Tris), and trypsin digestion (final trypsin concentration of 0.01 μg/μL). Label-free proteomic analysis was performed, as previously described by Greco V et al. [55] with few modifications. First, 300 fmol/μL of digested enolase from Saccharomyces cerevisiae (P00924) was added to each sample as an internal standard. Each digested sample (0.25 μg) was loaded onto a Symmetry C18 5 µm, 180 µm × 20 mm pre-column (Waters Corp., Milford, MA, USA), and was subsequently separated by a 120-min reversed-phase gradient at 300 nL/min (linear gradient, 2–40% ACN over 90 min) using a HSS T3 C18 1.8 μm, 75 μm × 150 mm nanoscale LC column (Waters Corp., Milford, MA, USA) maintained at 40 °C. Tryptic peptides were separated on an ACQUITY MClass System (Waters Corp., Milford, MA, USA) and then separated peptides were analyzed using a high-definition Synapt G2-Si mass spectrometer (Waters Corp., Milford, MA, USA) directly coupled to the chromatographic system. Differential protein expression was evaluated by a high-definition expression configuration mode (HDMSE), a data-independent acquisition (DIA) protocol where ion mobility separation (IMS) is integrated into LC-MSE workflow as described by Marini F. et al. [56]. The mass spectrometer parameters are set as: positive survey polarity of electrospray source (ES+), acquisition mode mass range 50–2000 m/z, capillary source voltage 3.2 kV, source T 80 °C, cone voltage 40 eV, TOF resolution power 20,000, precursor ion charge state 0.2–4, trap collision energy 4eV, transfer collision energy 2eV precursor MS scan time 0.5 sec, and fragment MS/MS scan time 1.0 sec. All spectra have been acquired in ion mobility separation mode (IMS) cycles with wave height at 40 V, wave velocity of 650 m/s, transfer wave height 4 V, and transfer wave velocity of 175 m/s. Data were post-acquisition lock mass corrected using the doubly charged monoisotopic ion of [Glu1]-Fibrinopeptide B (Waters Corp., Milford, MA, USA), sampled every 30 s. Each sample was run in four technical replicates. The analysis of differentially expressed proteins was performed according to Silva et al. [57] and Visser et al. [58]. Continuum LC-MS data from the four analytical replicates for each sample derived from both DS and HD PBMC were processed for qualitative and quantitative analysis using the ProteinLynx Global Server v3.0.3 software (PLGS, Waters Corp., Milford, MA, USA). The qualitative identification of proteins was obtained using the embedded ion accounting algorithm of the software PLGS and by searching against Homo Sapiens database (UniProt KB/Swiss-Prot Protein Knowledgebase restricted to homo sapiens taxonomy) to which the sequence from Saccharomyces cerevisiae Enolase (UniProtKB/Swiss-Prot AC: P00924) was appended. In order to obtain protein identifications, the PLGS software Search parameters include: automatic tolerance for precursor ions and for product ions, minimum 1 fragment ion matched per peptide, minimum 3 fragment ions matched per protein, minimum two peptide matched per protein, 2 missed cleavage, carbamydomethylation of cysteines and oxidation of methionine as fixed and variable modifications respectively. The identification of protein was based on the detection of more than two fragment ions per peptide, and more than two peptides measured per protein. False discovery rate (FDR) of the identification algorithm was set under 1%, based on a target decoy database. For quantitative expression analysis 300 fmol of Enolase has been set as calibration protein concentration. PLGS software uses the most reproducible proteotypic peptides for retention time and intensity of Enolase digestion (m/z 745.43, m/z 814.49, m/z 1288.70, m/z 1416.72, m/z 1578.80, and m/z 1840.89) to normalize the table of the exact mass on retention times (EMRTs). The expression analysis was performed considering two experimental groups, DS and HD, which include all the technical replicates derived from each sample (i.e., experimental condition, DS and HD: six biological samples × four technical replicates) following the hypothesis that each group was an independent variable (DS and HD). The differentially expressed proteins dataset was screened and filtered according to the following MS established criteria by considering only those identifications from the alternate scanning LC-HDMSE data exhibiting a good replication rate (at least three out of four runs of the same sample) and with p < 0.05 for the relative protein fold change (two-tailed Student’s t test). The significance of regulation level specified with a fold change of regulation higher than ±30%, which is typically 2–3 times higher than the estimated error on the intensity measurement, was used as a threshold to identify significant up- or down-regulation.

2.5. Bioinformatics and Network Analysis

To identify the biologically relevant molecular pathways, the proteomic datasets were analyzed using bioinformatic analysis tools based on QIAGEN’S Ingenuity Pathway Analysis (QIAGEN’S Ingenuity Pathway Analysis, Ingenuity Systems, http://www.qiagen.com/ingenuity) and STRING. Relevant functional associations have been explored. The analysis parameters were set as follows: direct and indirect relationships, endogenous chemical substances included all molecules, and/or relationships considered as the summary filter. The most significant categories associated with the loaded datasets were identified by calculating their significance (p-value, Fischer test). A p-value threshold was set at 0.05, which showed the probability of association between genes/proteins present in the datasets and each pathway (canonical pathway, and biological function).

2.6. Western Blot

For Western blot validations, 20 μg of protein from 8 DS subjects and 8 HD were resolved on Criterion TGX 4–15% 18-well (Tris-Glycine extended) Stain-Free precast gels (Bio-Rad, Hercules, CA, USA, #5678084) in Tris/Glycine/SDS (TGS) Running Buffer (Bio-Rad Laboratories, Hercules, CA, USA, # 1610772). After electrophoresis, the gel was placed on aChemi/UV/Stain-Free tray and then placed in a ChemiDoc MP imaging System (Bio-Rad Laboratories, Hercules, CA, USA, # 17001402) and UV-activated based with the stain-free gel settings to collect total protein load image. Stain-free imaging technology utilizes a trihalo compound to enhance natural protein fluorescence by covalently binding to tryptophan residues with a brief UV activation. Images of the gel or membrane after transfer were easily captured using stain-free gel settings. This allowed visualization, verification, and validation at all steps of electrophoresis and blotting. The stain-free technology allows for total lane normalization avoiding the use of housekeeping proteins (HKPs). Following electrophoresis and gel imaging, the proteins were transferred via the Trans Blot Turbo semi-dry blotting apparatus (Bio-Rad Laboratories, Hercules, CA, USA, # 1704150) onto nitrocellulose membranes (Bio-Rad, Hercules, CA, USA, # 162–0115). Membranes were blocked with 3% of BSA (bovine serum albumin 9048-46-8; SERVA Electrophoresis GmbH, Heidelberg, Germany) in 1X tris buffer saline (TBS; 1706435, Bio-Rad, Hercules, CA, USA) containing 0.01% Tween 20 and incubated overnight at 4 °C with the following primary antibodies: ATF6 (sc-166659; Santa Cruz Biotechnology; Dallas, TX, USA, 1:250), pSer724IRE1α (NB100-2323; Novus Biologicals, Centennial, CO, USA; 1:1000), IRE1α (sc-390960; Santa Cruz Biotechnology, Dallas, TX, USA; 1:250), PRDX6 (A305-315A-M Bethyl, 1:1000), Gelsolin (sc-398244; Santa Cruz Biotechnology, Dallas, TX, USA; 1:500), and SOD-1 (sc-271014; Santa Cruz Biotechnology, Dallas, TX, USA; 1:500). Next day all membranes were washed three times with 1X tris buffer saline containing 0.01% Tween 20 and incubated for 1 h at room temperature with respective horseradish peroxidase-conjugated secondary antibodies: anti-rabbit (L005661; Bio-Rad Laboratories, Hercules, CA, USA; 1:20,000), anti-mouse (L005662; Bio-Rad Laboratories, Hercules, CA, USA; 1:20,000) from or anti-goat IgG (A5420; Sigma-Aldrich, St. Louis, MO, USA; 1:3000). Blots were then imaged via ChemiDoc MP imaging system using the Chemiluminescence settings. Subsequent determination of relative abundance via total protein normalization was calculated using Image Lab 6.1 software (Bio-rad Laboratories, Hercules, CA, USA).

2.7. Slot Blot Analysis and Protein Carbonylation

Protein carbonyls was used as a marker of protein oxidation and their levels were determined as described by Butterfield et al. [59]. Total of 5 μL from PBMCs samples was derivatized at room temperature for 20 min in 10 mM DNPH and 5 μL of 12% sodium dodecyl sulphate (SDS). Samples were than neutralized with 7.5 μL of neutralization solution (2 M tris in 30% glycerol). The derived samples (250 ng) were then blotted onto a nitrocellulose membrane under vacuum pressure using a slot-blot apparatus (Bio-Rad, Hercules, CA, USA). Membranes were blocked for 1 h at room temperature with 3% of BSA (bovine serum albumin 9048-46-8; SERVA Electrophoresis GmbH, Heidelberg, Germany) in 1X tris buffer saline (TBS; 1706435, Bio-Rad, Hercules, CA, USA) containing 0.01% Tween 20 and incubated for 2 h at room temperature with a 1:1000 dilution of rabbit polyclonal anti-DNP primary antibody. Then, membranes were washed three times with 1X tris buffer saline solution containing 0.01% Tween 20 (T-TBS) and incubated for 1 h at room temperature with the respective alkaline phosphatase secondary antibodies from Sigma-Aldrich (1:10,000 dilution of anti-rabbit IgG alkaline phosphatase). The membranes were later washed three times in (T-TBS) and developed with a solution of nitro-tetrazolium blue chloride (0.2 mM) and 5-bromo-4-chloro-3-indolyl phosphate dipotassium (0.4 mM) in ALP buffer (0.1 M Tris, 0.1 M NaCl, 5 mM MgCl2; pH 9.5). Blots were dried, acquired with Chemi-Doc MP imaging system Bio-Rad Laboratories, Hercules, CA, USA, # 17001402) (Bio-Rad, Hercules, CA, USA) and analyzed using Image Lab 6.0 software (Bio-Rad, Hercules, CA, USA).
To have an internal control we use samples with no primary antibody or samples pre-treated with NaBH4 to reduce protein carbonyls and resulted in no staining.

2.8. Statistical Analysis

For proteomics analysis six samples were employed for each group. As previously described [44], sample size was calculated using G-Power 3.1 software using the following parameters: Effect size = 2.5; Err- prob = 0.05; Power = 0.95; sample size of n = 6 for each group with an actual power of 0.97. For Western blot analysis, we selected eight samples per group (G-power parameters are: Effect size = 2; Err- prob = 0.05; Power = 0.95; sample size of n = 8 for each group with an actual power of 0.96). The t-test was used to evaluate differences between HD and DS where p values equal * p = 0.05, ** p = 0.01. Data are expressed as mean ± SEM per group. Values above or below two standard deviations of the mean were considered outliers and discarded from the data set. All statistical analyses were performed using Graph Pad Prism 8.0 software (GraphPad, La Jolla, CA, USA). As reported in the dedicated section, mass spectrometry raw data have been analyzed according to the well-established parameters for DIA-MSE acquisition [57,58].

3. Results

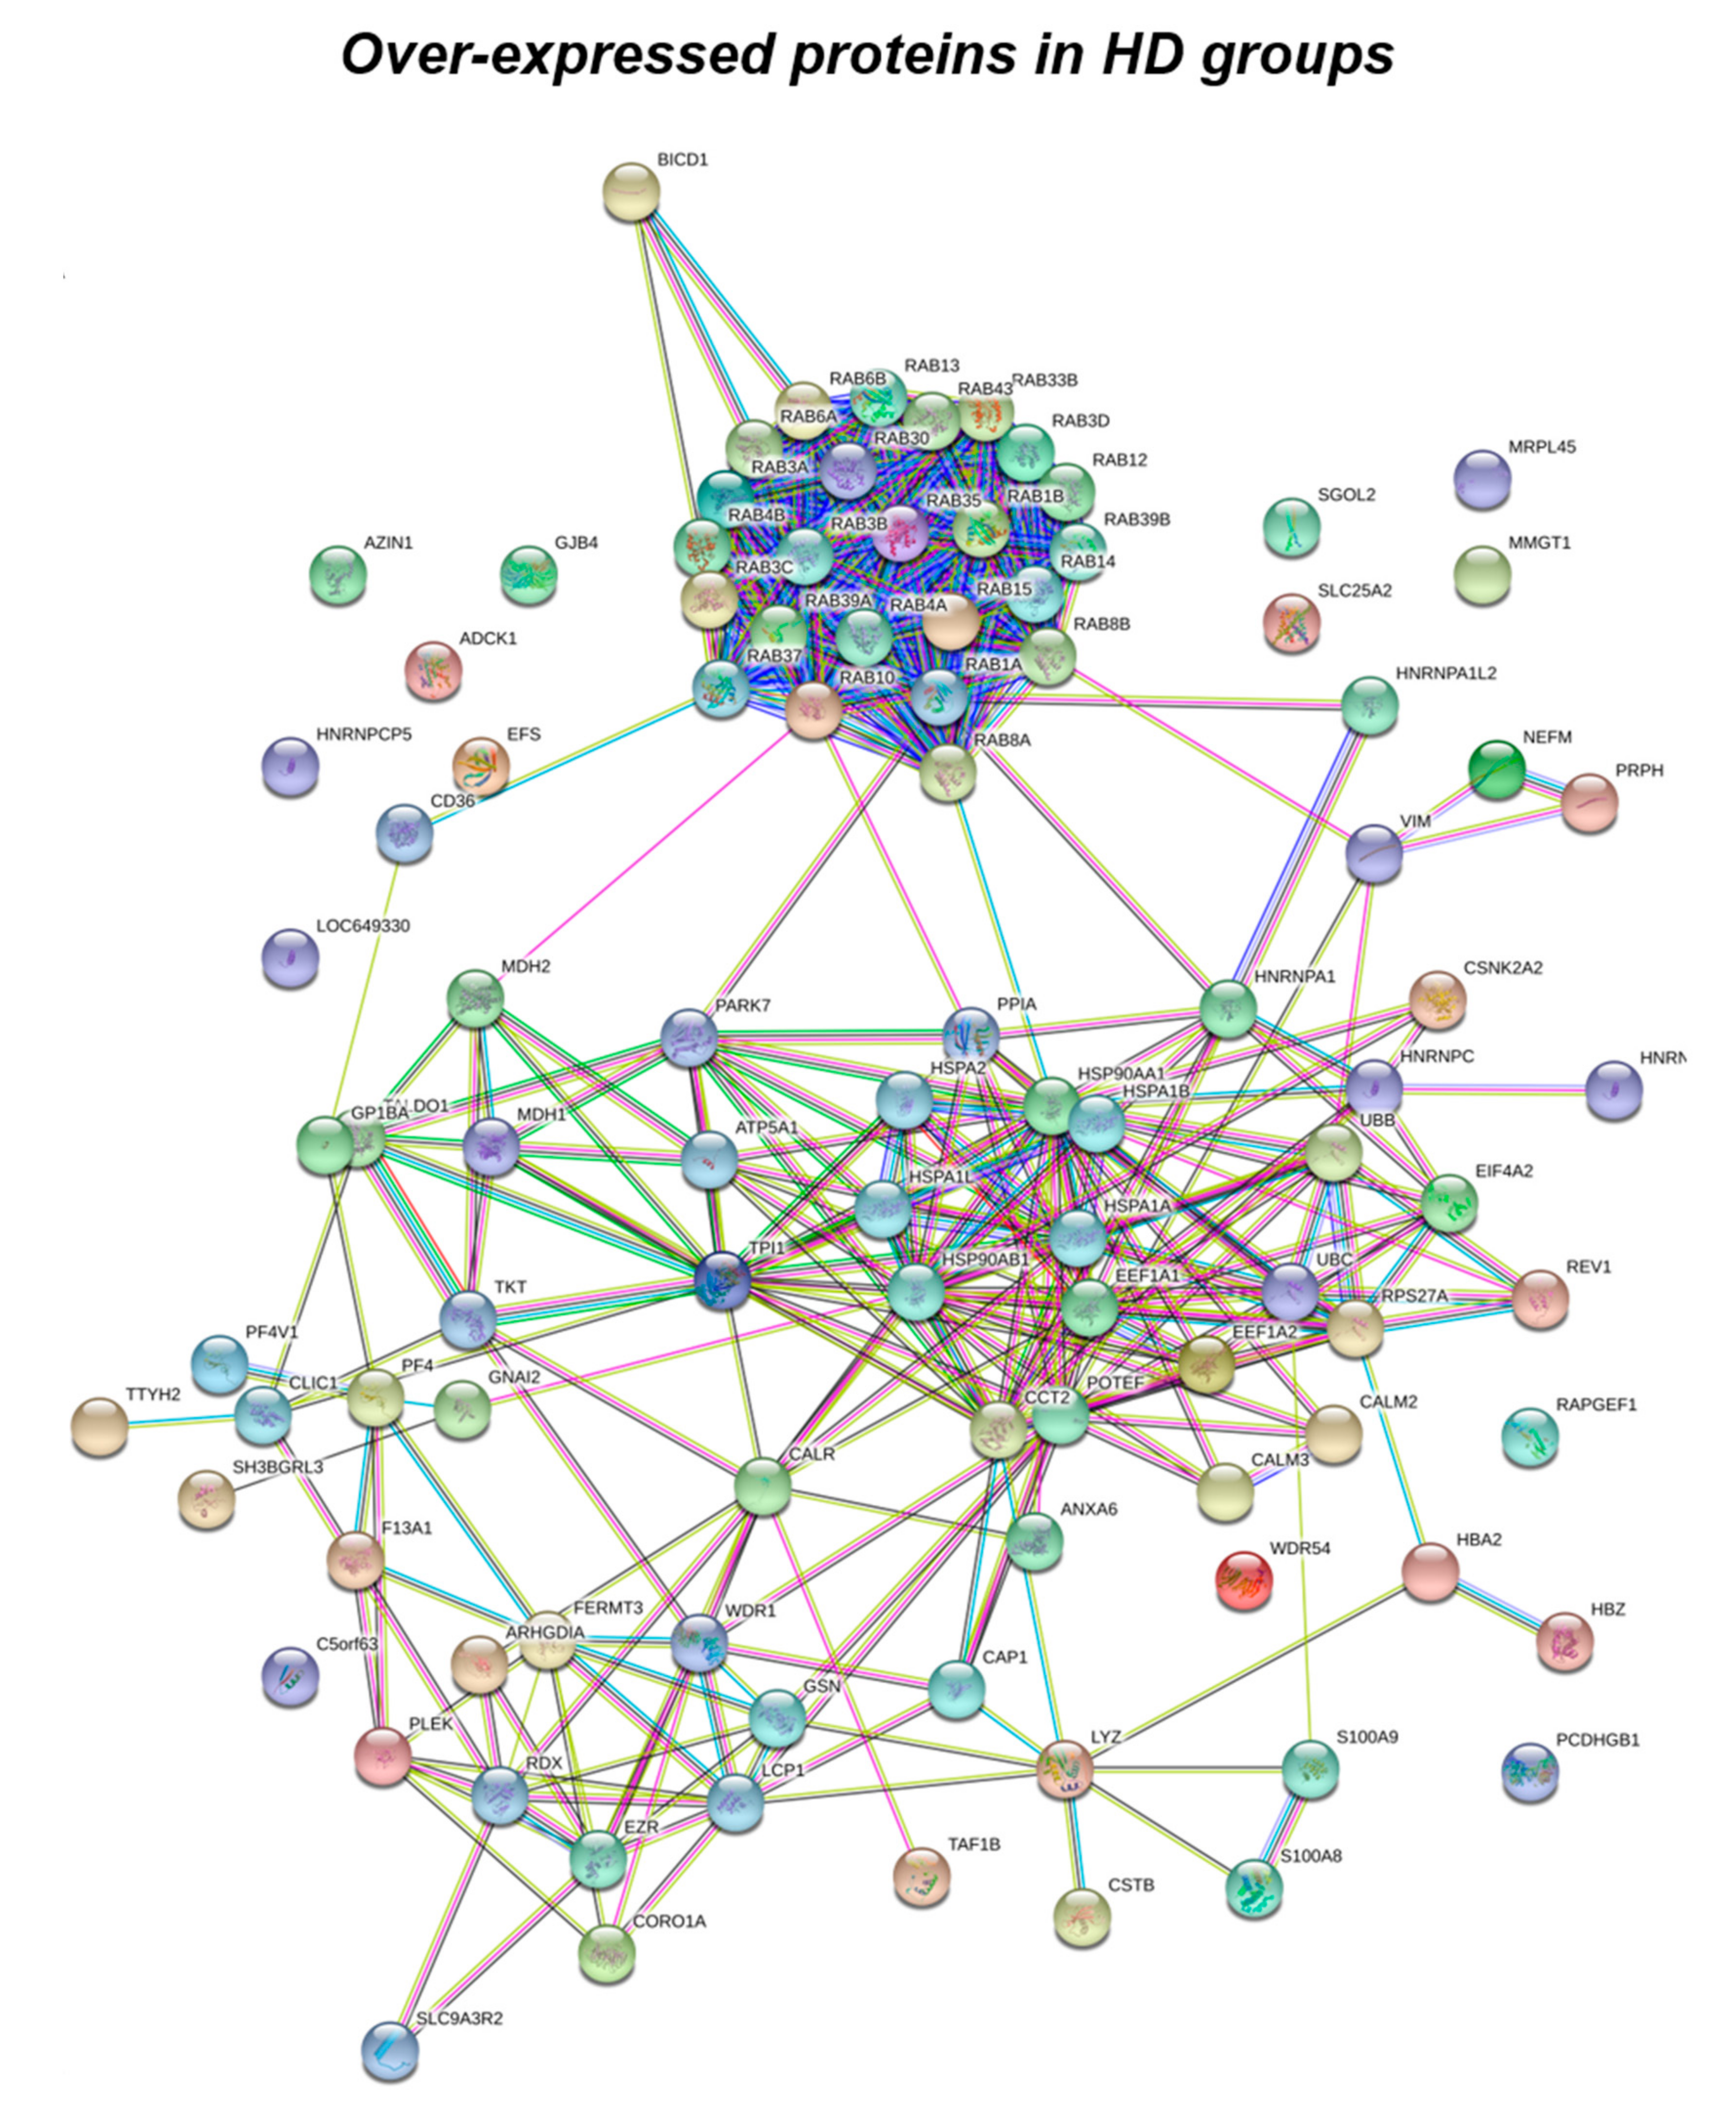
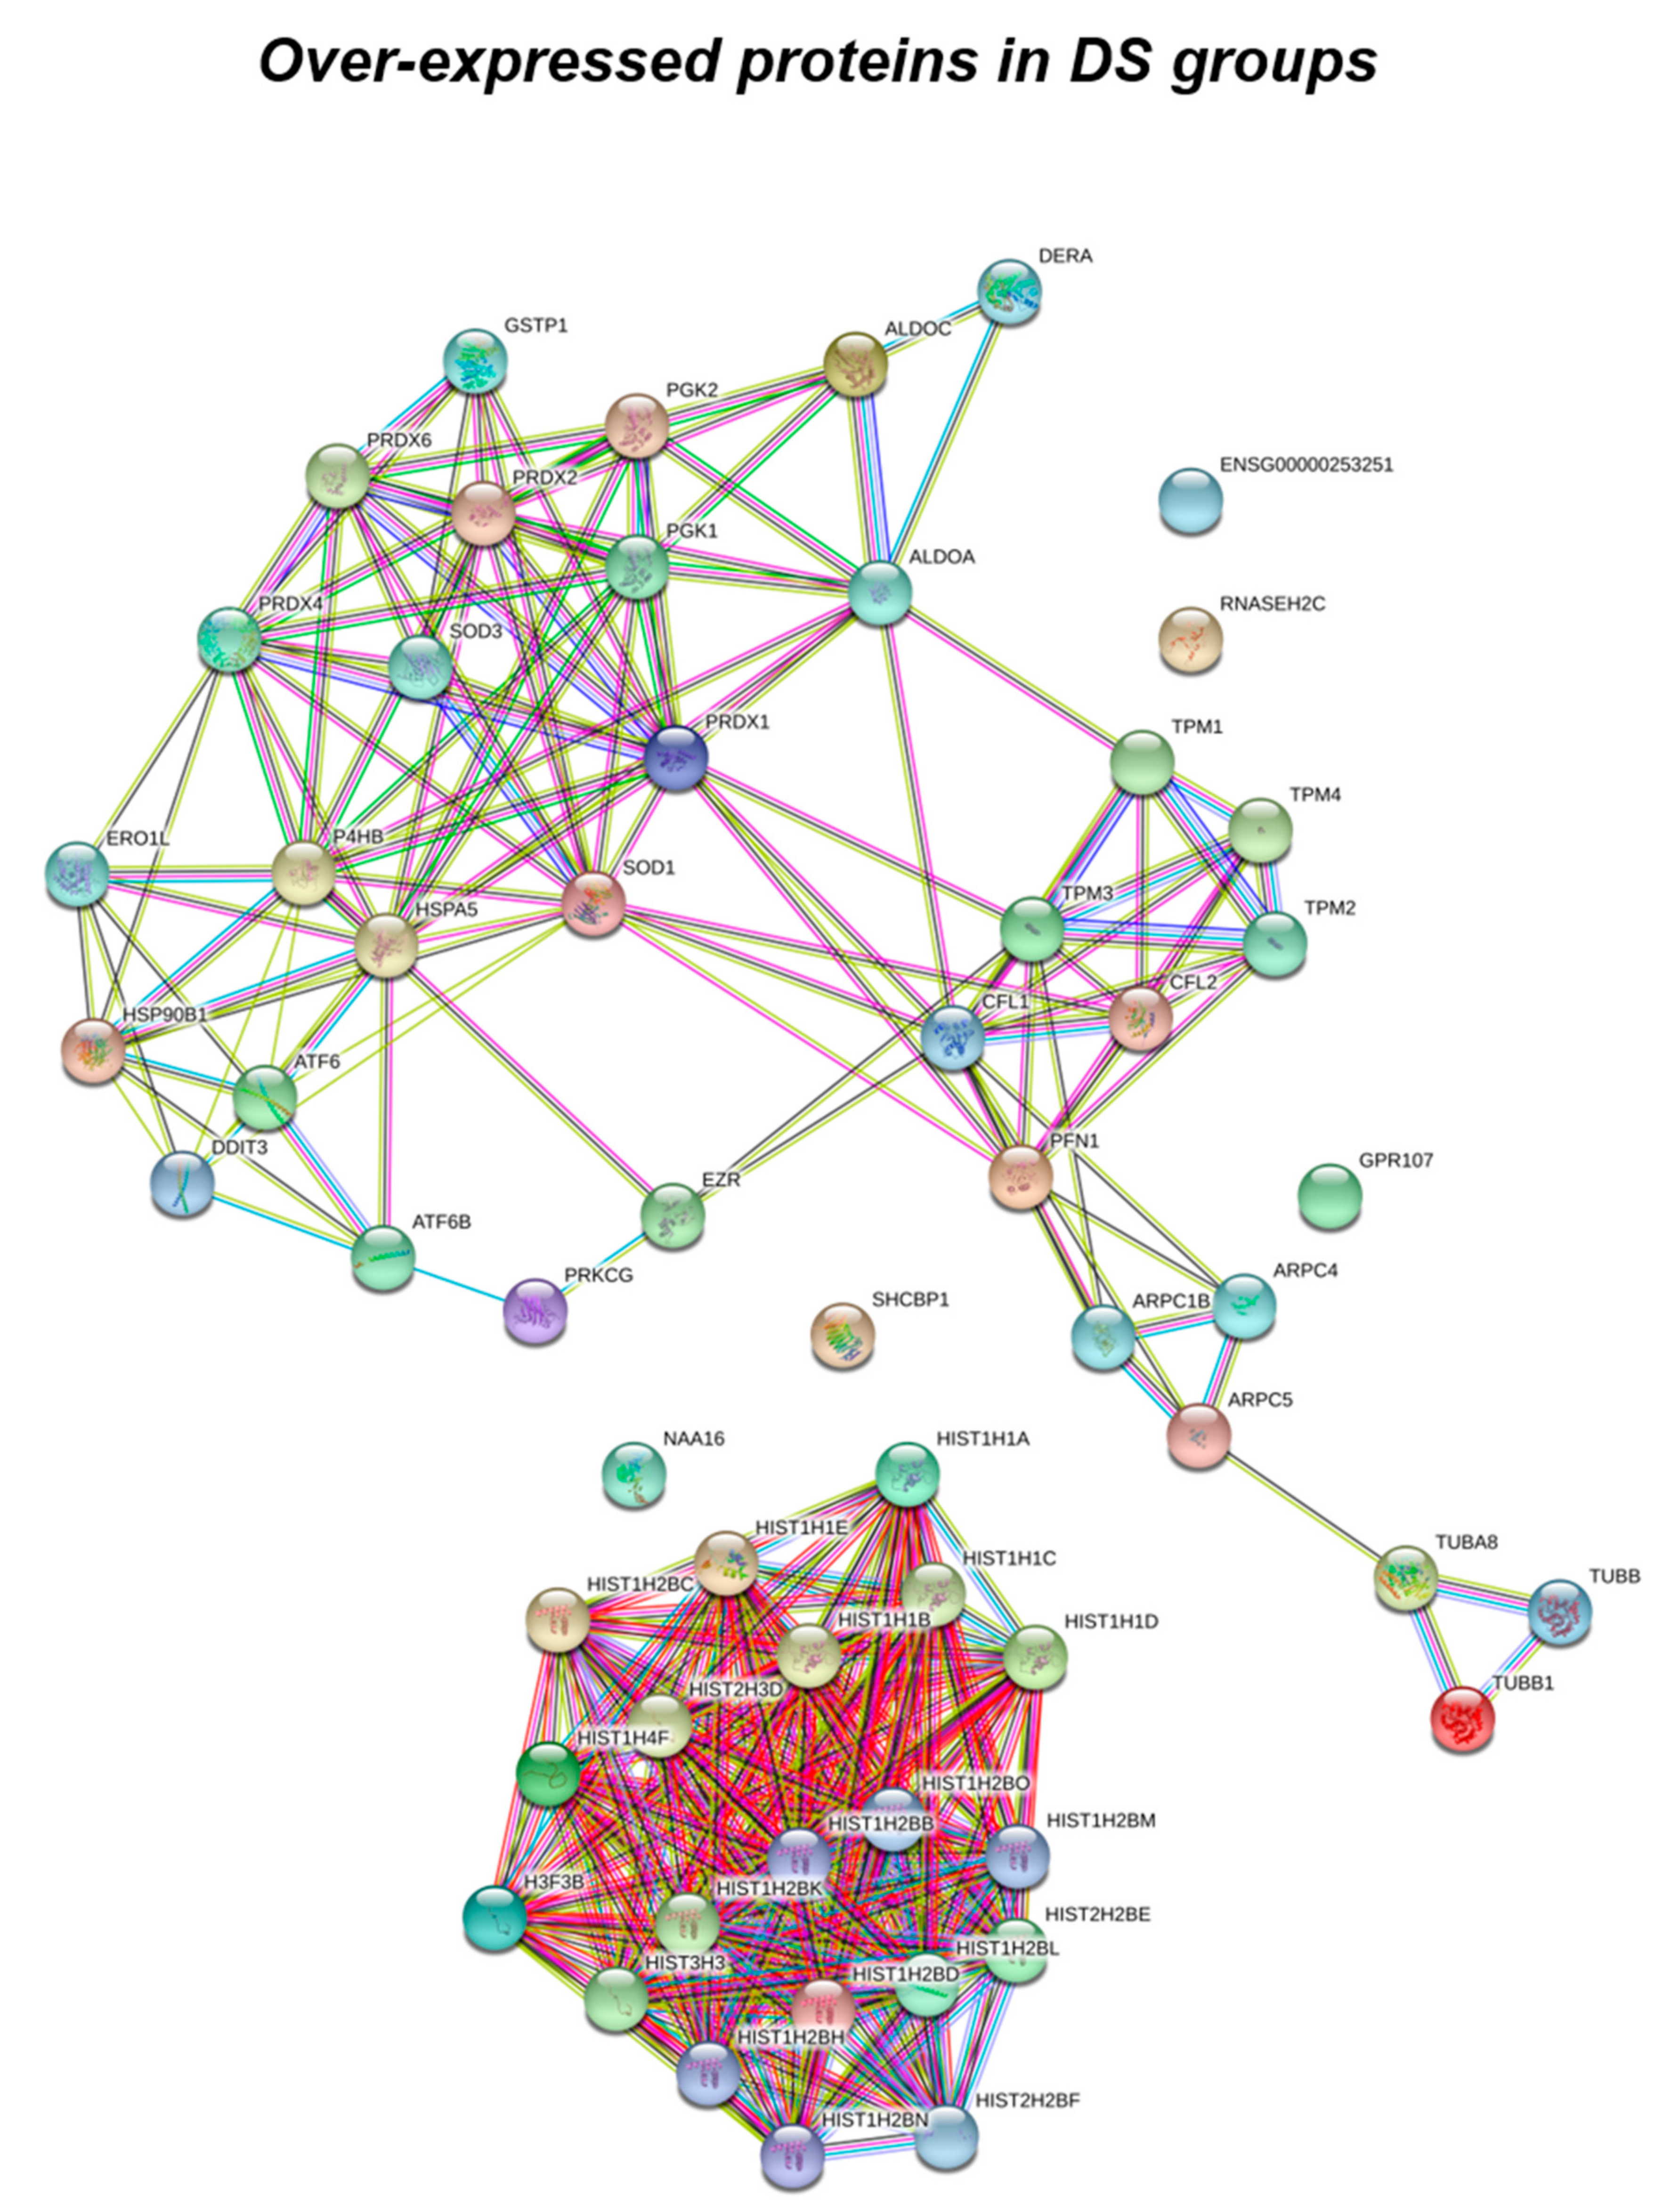
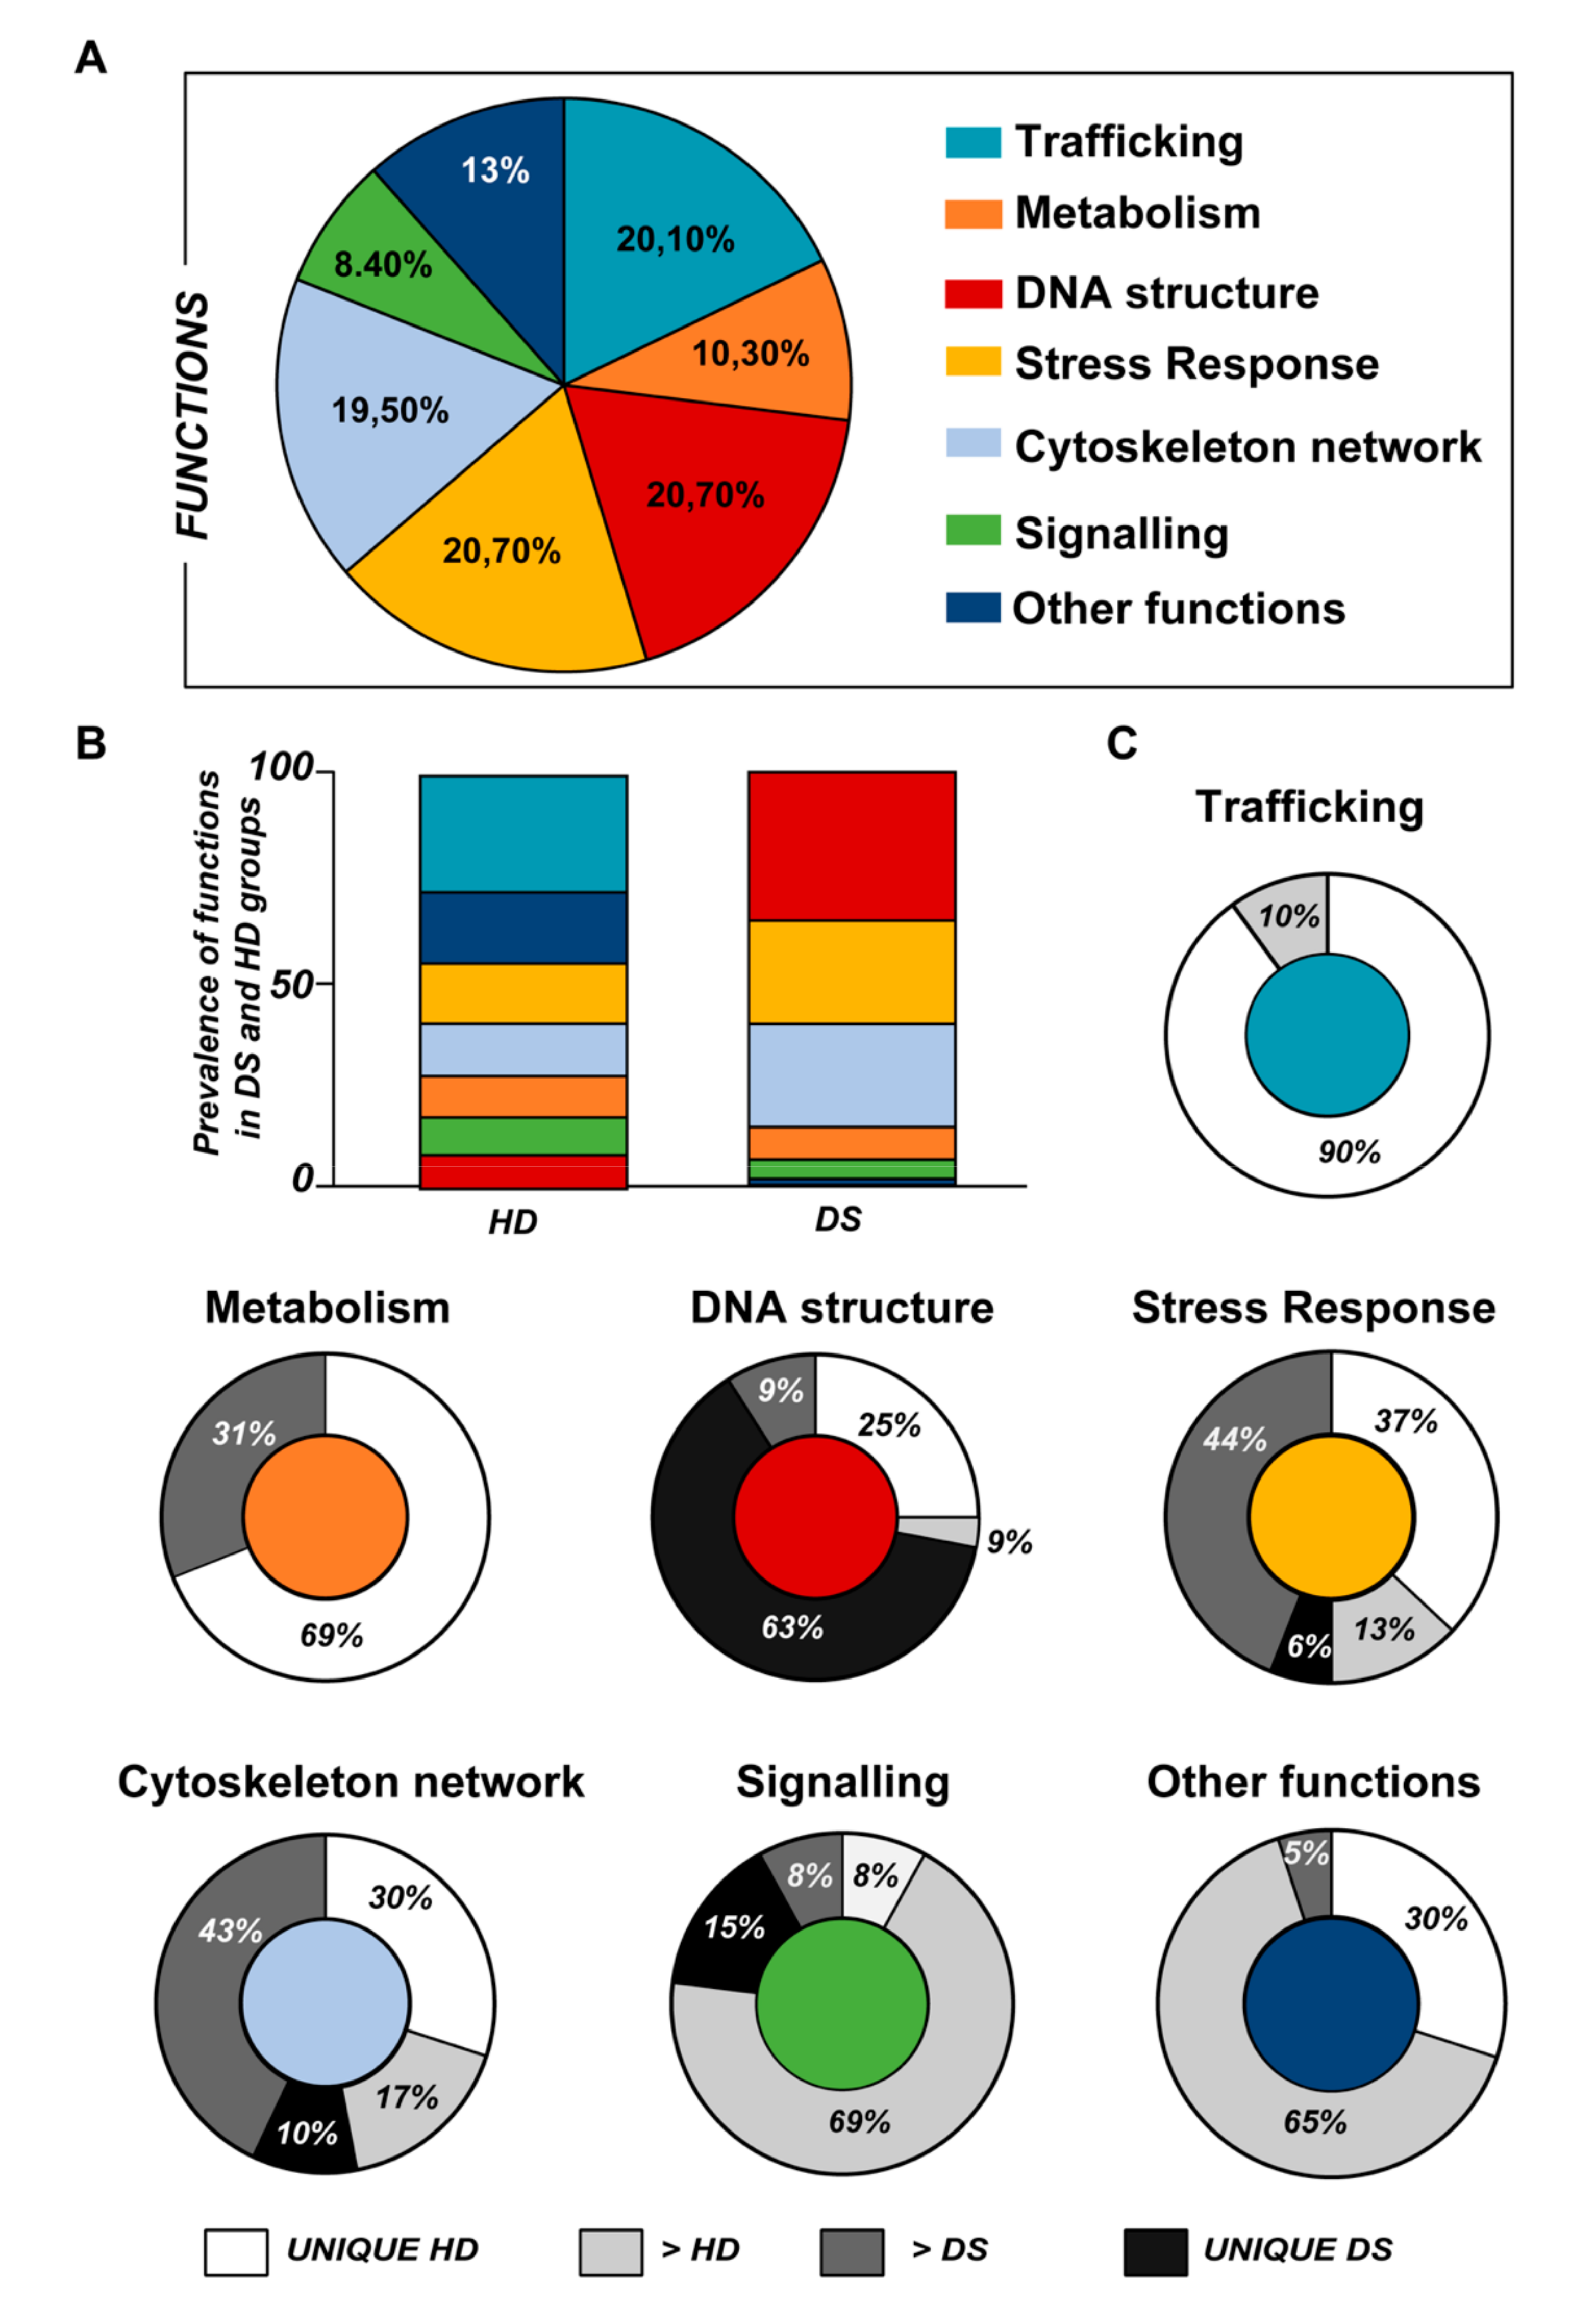
3.1. Proteomics Analysis

In the present study a comparative characterization of PBMC proteomes from 6 DS and 6 HD cases was performed to investigate the putative changes in protein expression that could allow to gain insight into the molecular mechanisms of DS pathology. The differential protein expression analysis was carried out by a HD-MSE isotope label-free profiling. Quality control measures were performed on the analytical replicates to ensure the reproducibility of the mass measurement and chromatographic retention time of each peptide. We acknowledge a limitation for sample size in the present study, however data obtained were consistent with previous analysis and have been partially confirmed by specific immunochemical analysis. As thoroughly described in Section 2.3, applying the statistical parameters on the identified proteins (such as fold change of regulation higher than ±30%), 178 proteins have been shown as statistically differentially expressed across both conditions.
Data obtained from label-free proteomics analysis and then bioinformatics-based speculations show that all the proteins, differently expressed in the experimental groups, clustered in a well-defined number of functions including stress response, trafficking, metabolism, DNA structure, cytoskeleton network and signaling, as represented in Figure 1 and Figure 2, and as listed in Table 2, Table 3 and Table 4.
According to the analytical features of the mass spectrometer used and the results from quantitative expression analysis, the identified proteins were then clustered as follows: proteins with a different expression comparing both DS and HD conditions (over-expressed or down-expressed, with fold change >30%), and highly expressed proteins, so-called “unique” proteins, whose compared expression ratio is more than ten times higher so that they can be considered present in only one specific group. Thus, we identified four groups of comparison: UNIQUE HD that include proteins overexpressed in HD with a fold >10; overexpressed in HD (>HD) that include protein with a fold of increase >1.3 but <10; UNIQUE DS that include proteins overexpressed in DS with a fold >10; overexpressed in DS (>DS) that include protein with a fold of increase >1.3 but <10. Intriguingly, the HD groups include proteins belonging to all six functional groups but demonstrate a high prevalence of trafficking proteins (28%) as also evident in Figure 1 and Table 2. We report also a 15% of stress response proteins, a 13% of cytoskeletal proteins, a 10% of metabolic proteins, a 9% of proteins related to signaling network, and an 8% of DNA structure proteins. In addition, the 17% of proteins with increased expression in HD groups do not fall in any of the functional networks taken into considerations. The DS groups display an altered expression for proteins mainly involved in DNA structure (36%) and stress response (25%) as evident in Figure 2 and Figure 3B, while other functional groups that presents overexpressed protein in DS are: cytoskeleton network for the 25%, metabolic pathways for the 8%, cell signaling for the 5%, and a broad array of function for the remaining 2% (Figure 3B).
Subsequently, by analyzing for each identified functional set, the percentage and the identity of the proteins belonging to UNIQUE HD, >HD, UNIQUE DS, and >DS groups, we sought to delineate the pathways that are mainly affected during DS pathology, their role in disease progression and their potential value as biomarkers. The 100% of all the proteins included in intracellular trafficking group are over increased in HD groups with the 90% and 10% belonging to UNIQUE HD and to >HD respectively (Figure 1 and Figure 3C); in detail as listed in Table 1 we identified 25 proteins belonging to the Rab family, a member of the Ras superfamily of small G proteins. In the cell metabolism group, UNIQUE HD proteins account for the 69%, while the 31% belongs to >DS (Figure 3C). Pathway analysis revealed that these proteins are related to energy metabolism, glucose metabolism, ornithin metabolic pathway, and urea cycle. In detail, the protein linked to energy metabolism are: cytoplasmatic and mitochondrial malate dehydrogenase, lactate dehydrogenase, ATP synthase subunit alpha mitochondrial, glyceraldehyde-3-phosphate dehydrogenase, fructose-bisphosphate aldolase A/C, phosphoglycerate kinase 1, 2, transaldolase, transketolase. Protein linked to the ornithin metabolic pathway and urea cycle are the Antizyme inhibitor 1 and the mitochondrial ornithine transporter 2. Analyzing the stress response proteins network, it is evident that the 37% of the proteins are UNIQUE HD, the 13% are >HD, the 6% belong to UNIQUE in DS, and the 44% are overexpressed in DS (Figure 2 and Figure 3C). Some notable proteins include those involved in the response to ER stress, protein folding in the ER (ERO1 and PDI), ER-nucleus signaling pathway (ATF6, ATF6-alpha, B and CHOP), and in cellular chaperoning, such as GRP78 (Table 1). Focusing on ER stress, endoplasmin is a molecular chaperone that functions in the processing and transport of secreted proteins, and functions in endoplasmic reticulum-associated degradation (ERAD). Intriguingly, all the above-mentioned proteins, associated with ER stress, were found to be over-expressed in DS compared to HD, thus confirming the involvement of increased UPR in the pathophysiology of Down syndrome. Furthermore, other relevant over-expressed proteins in DS involved in stress response with antioxidant properties are SOD-1, peroxiredoxin 1, 2, 4, 6, and glutathione S-transferase. Regarding the cytoskeleton network, statistical analysis reveals that these proteins fall into the HD groups for the 47% (specifically, 30% UNIQUE in HD and 17% >HD) and into the DS group for the 53% (specifically, 10% are UNIQUE DS, and 43% are overexpressed in DS). The UNIQUE HD group include the following proteins: Gelsolin, Annexin A6, Calmodulin-1, 2, 3, WD repeat-containing protein 1, 54, Vimentin, Protocadherin gamma, Plastin-2, Adenylyl cyclase-associated protein 1, and Fermitin family homolog 3. The only protein unique in DS cases is actin-related protein 2/3 complex subunit, while the proteins over-expressed in DS are: Cofilin-1, 2, Tropomyosin alpha and beta chain, Tubulin alpha and beta with different isoforms, Myosin-9, Ezrin, and Profilin-1. An altered expression of the proteins involved in the DNA structure strongly affects the DS groups, indeed, only the 28% of protein belongs to the HD groups including the heterogeneous nuclear ribonucleoprotein A1 and heterogeneous nuclear ribonucleoprotein C1/C2, while 72% of the identified protein is part of both the UNIQUE DS and >DS groups. In detail, five types of histone proteins, H1, H2A, H2B, H3, and H4, have been identified as increased in DS (Figure 2). The proteins involved in signaling network group represents a small amount of the total identified proteins (8%) and comprises: Pleckstrin OS, Platelet glycoprotein 4, Platelet glycoprotein Ib alpha chain, SHC SH2 domain-binding protein 1, Protein kinase C gamma, and GPR107. The distribution of these proteins between the groups of comparisons revealed that the 77% belong to the HD groups (specifically, 8% UNIQUE HD and 69% > HD) and the 27% to DS groups (respectively, 15% to UNIQUE DS and 8% to the >DS). At final we identified 20 proteins (13% of the total), which do not fall in any of the above-mentioned networks and may hold various biological functions, have been identified in HD groups (95%).

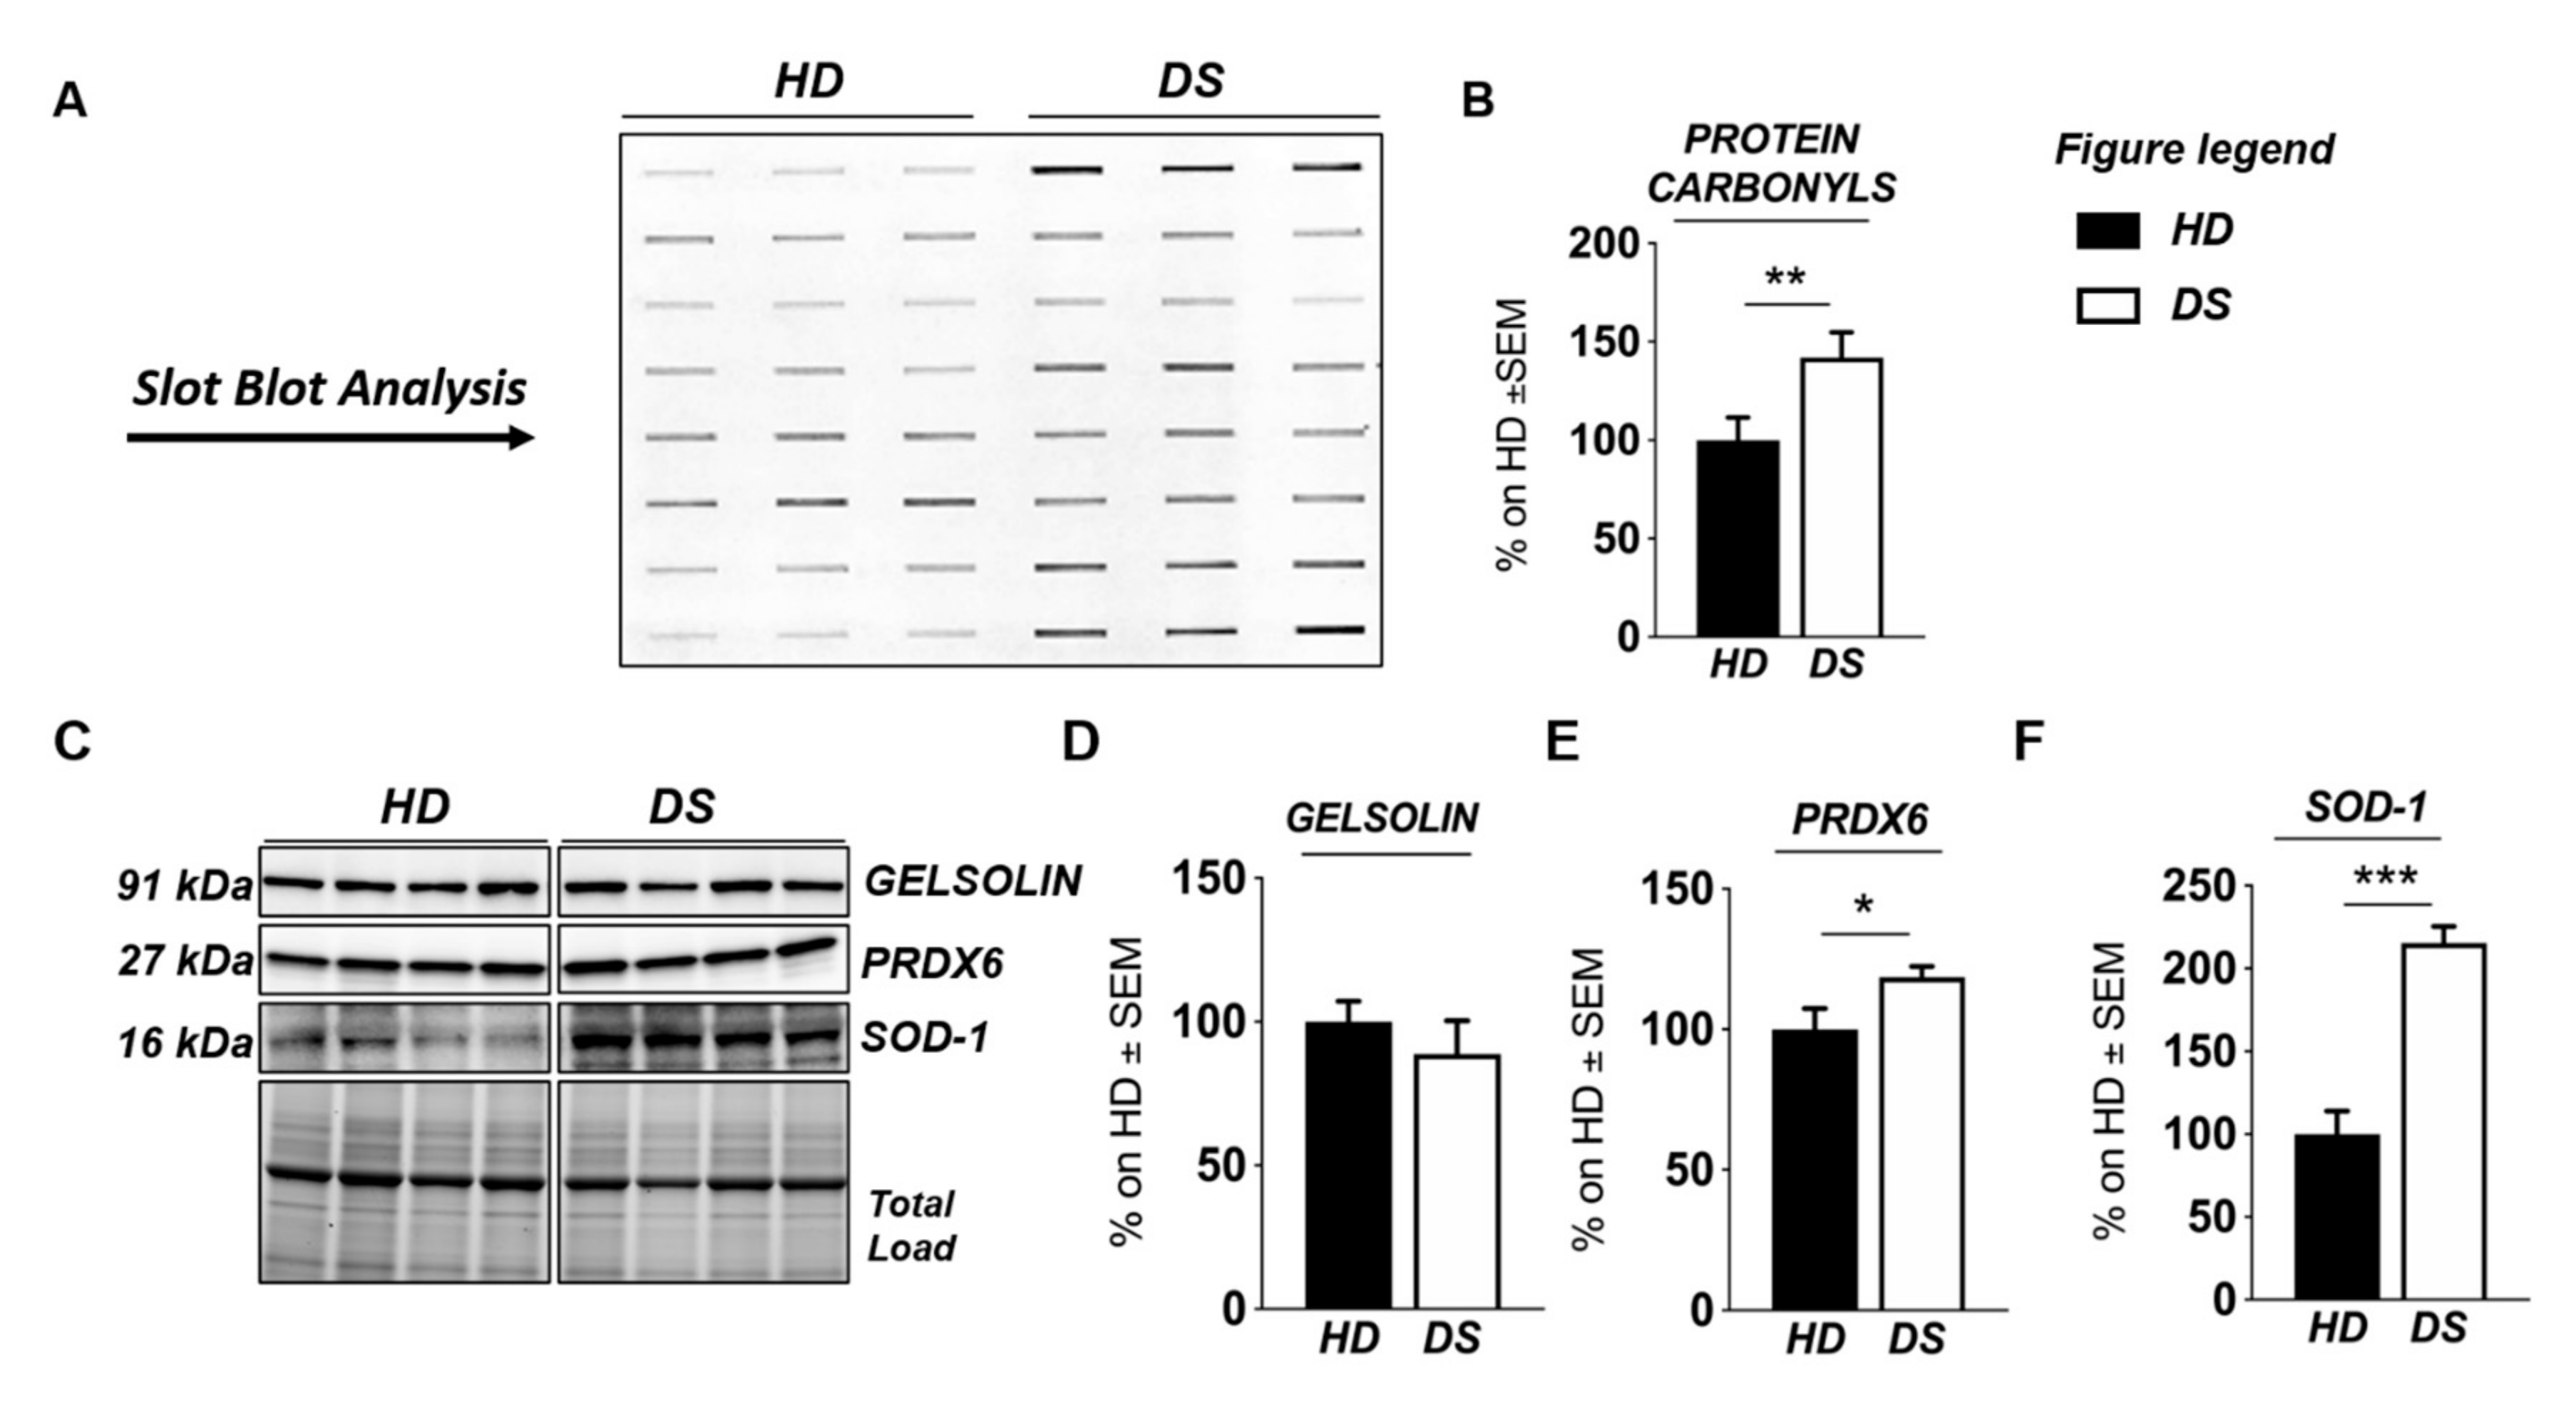
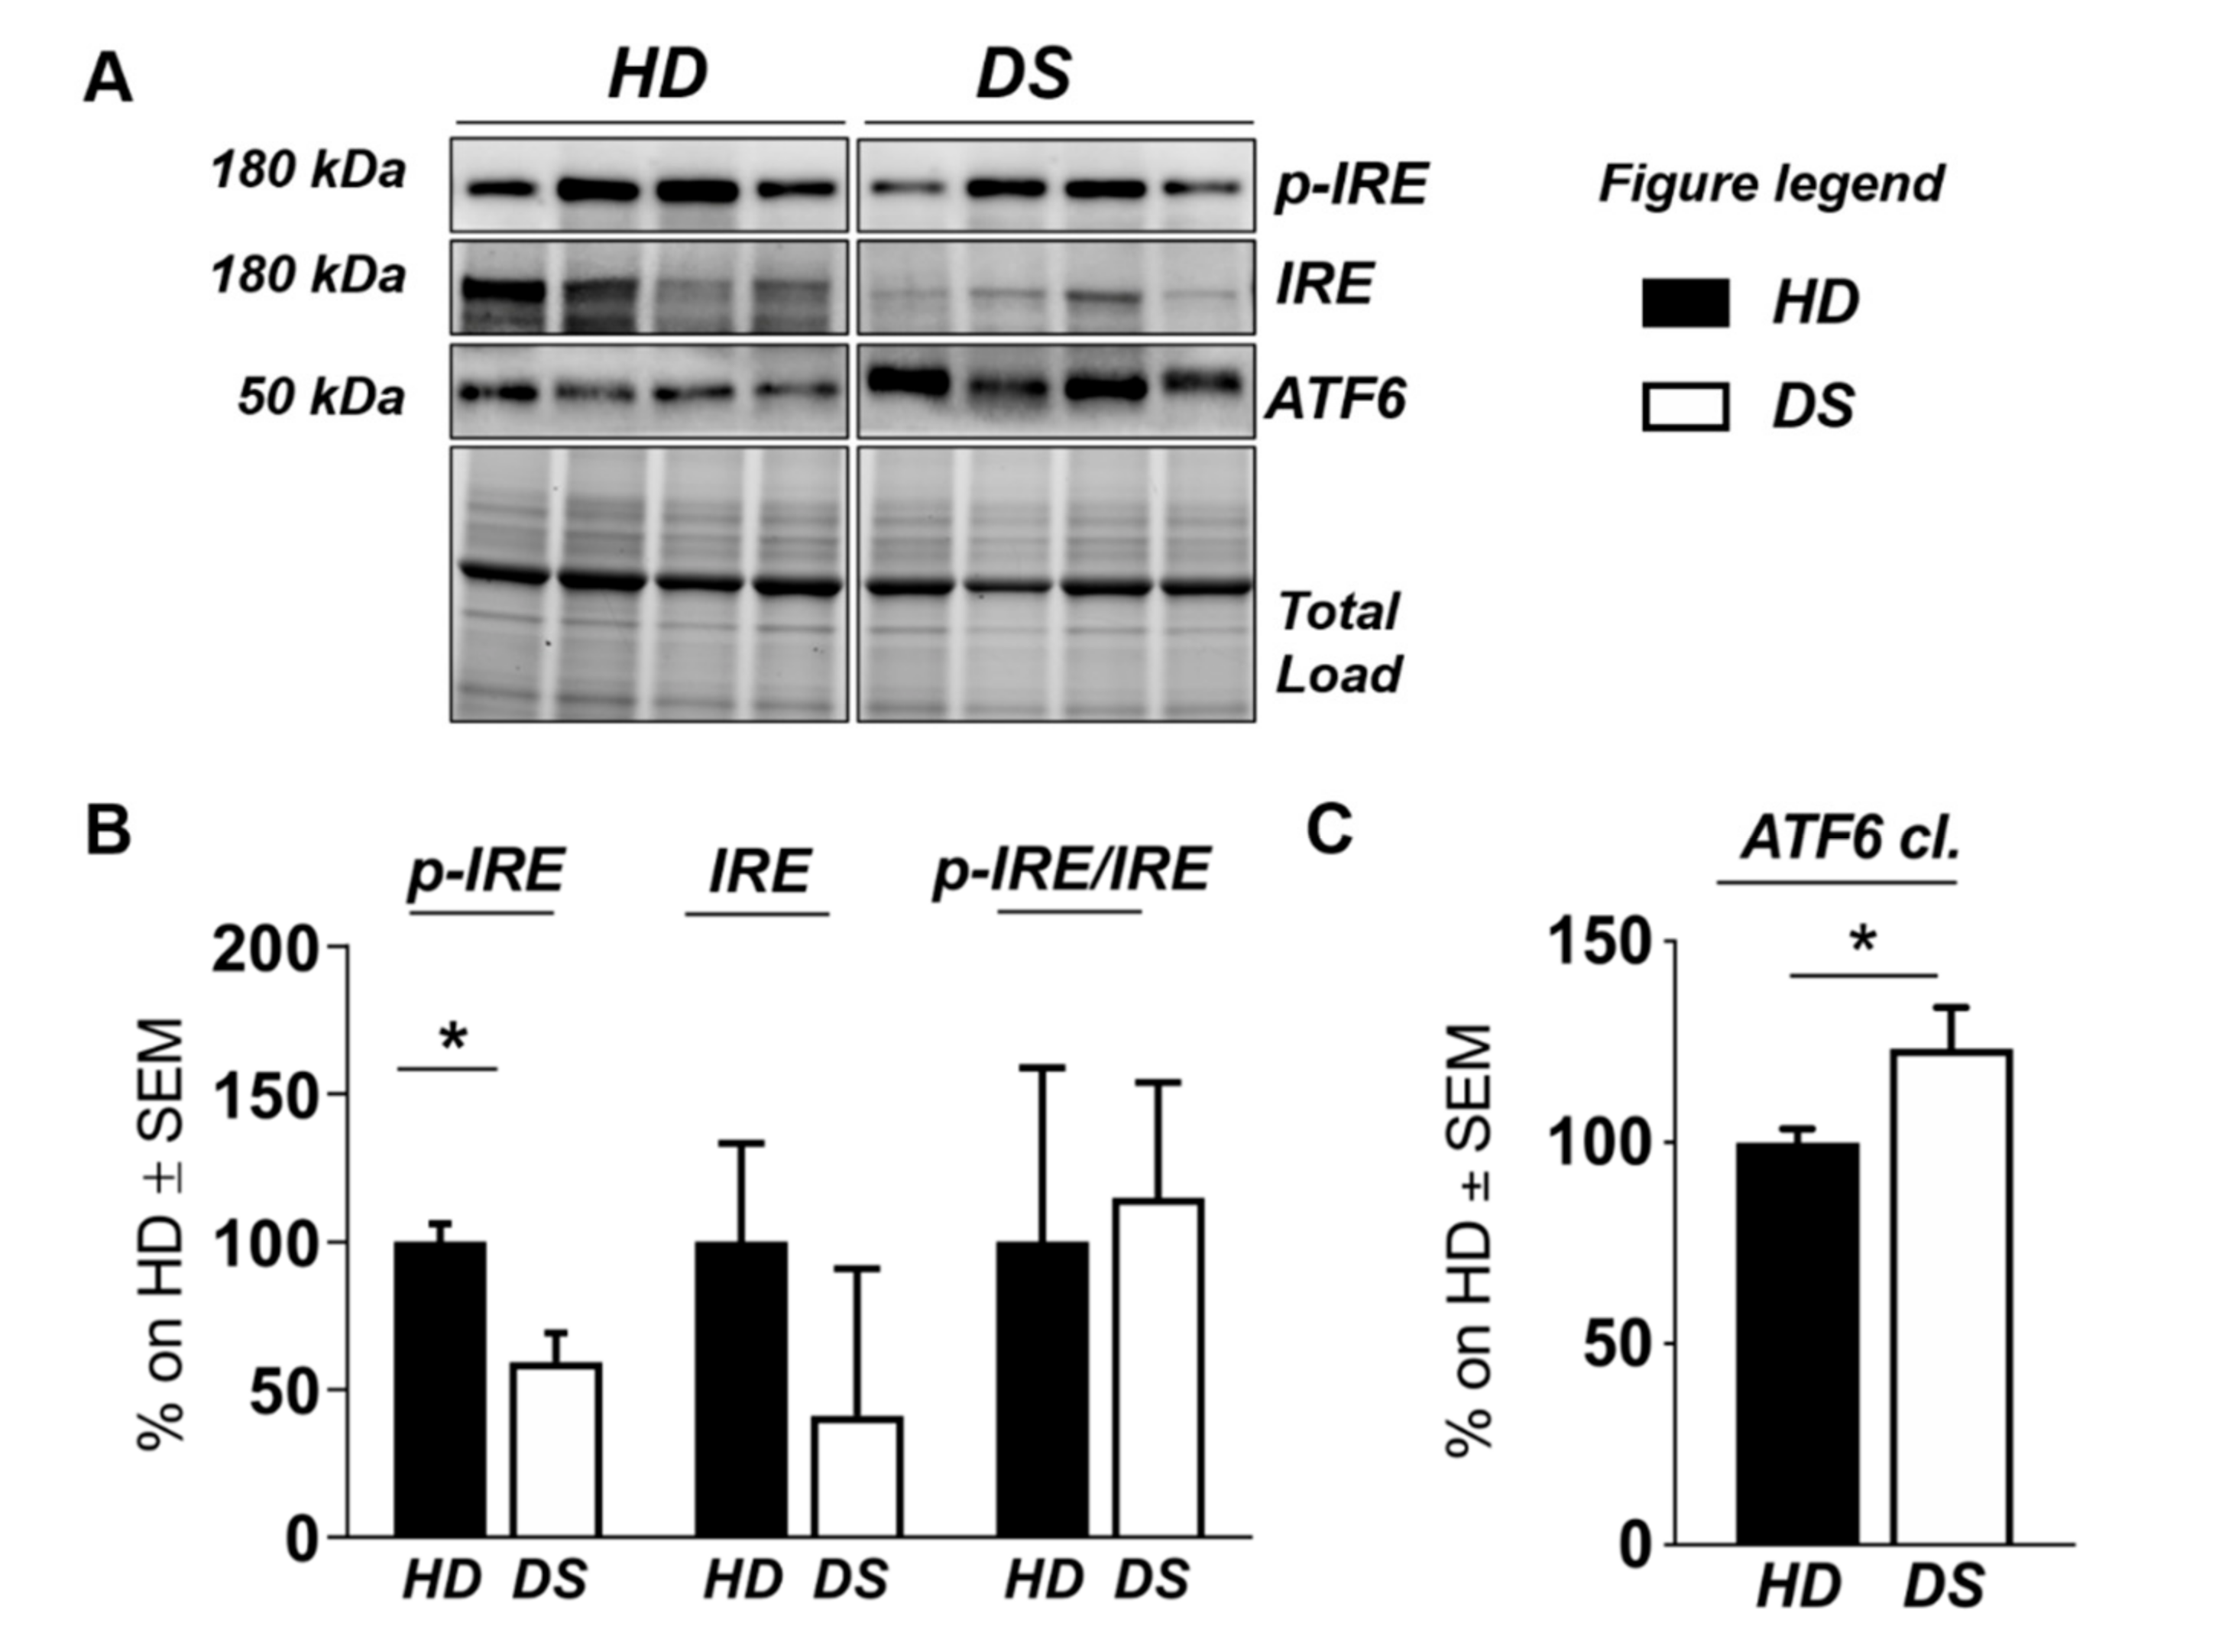
3.2. Western Blot Analysis

To validate the results obtained with label-free proteomics analysis and to strengthen the notion that the over induction of UPR and of OS detoxifying mechanisms occur in DS for of the increase of the OS environment, we analyzed, by slot blot, protein carbonylation as a surrogate index for total protein oxidation and, by Western blot, the proteins involved in ER stress and OS responses (Figure 4 and Figure 5).
We found a significant increase of protein carbonylation in DS PBMCs compared to HD. As can be seen from Figure 4B, the global protein carbonylation load was higher in DS group with respect to HD group (+42%, p = 0.02). The elevation of protein carbonylation parallel with the increase of SOD-1, triplicated in DS, whose overexpression is observed both by mass spectrometry-based proteomics and WB (+115.4%; p < 0.001) (Figure 4F). As a further validation of the MS data, the overexpression of PRDX-6 in DS was also confirmed by WB analysis (+18%; p = 0.03) and support the induction of antioxidant responses to counteract OS in DS PBMCs (Figure 4E). In addition, by WB analysis we analyzed the expression levels of Gelsolin, a protein linked to cytoskeletal network, but we did not find a significant increase in DS as expected (Figure 4D). Moreover, proteomics data supports the increase of UPR components in DS PBMCs. Previous studies by us have already demonstrated the increased expression of GRP78 (BiP), CHOP, and of the PERK pathway in human PBMCs from DS cases [45]. To add additional insights into the UPR induction in DS periphery, we performed the analysis of ATF6 and of IRE1. We show a significant increase of ATF6 cleaved form in DS PBMCs compared with HD (+23.3, p = 0,04) (Figure 5C) confirming MS-proteomics data, while the analysis of IRE1 demonstrates a decrease of protein expression but no alterations concerning its phosphorylation state (Figure 5B), strengthen the idea of the induction of selected UPR branches in DS pathology.

4. Discussion

In the present study, a comparative proteomic investigation was performed to identify the putative protein biomarkers of DS that could allow to get a deeper comprehension of the complex mechanisms responsible for DS pathological phenotypes. Gene dosage is believed to play a significant role in determining the wide variability of DS phenotypes [15,60,61,62]. While gene dosage may contribute to the phenotype associated with DS, an exact mechanism and specific gene network underlying DS abnormalities are yet to be elucidated [63,64]. Differentially expressed proteins were identified and a comprehensive study on the proteins associated with DS imbalance was carried out in PBMCs isolated from young DS individuals compared with heathy age-matched donors. PBMCs, by reflecting at systemic level cellular alterations driven by trisomic condition, represent a valuable model to elucidate the molecular mechanisms of DS pathology, including those that characterize neurodegeneration [43,45]. Collected results agree with published studies from our group and others showing the early alterations of specific cellular pathways in DS individuals that are considered to contribute to the accelerated-aging phenotype, ultimately resulting in the early onset of Alzheimer dementia in DS [5,34,35,36,49,65,66,67,68,69].
We suggest that a well-defined number of pathways, including intracellular trafficking, stress responses, cytoskeleton network, and energy metabolism are significantly disrupted in PBMCs from young DS individuals, reflecting alterations already observed in other tissues [5,35,53]. The presence of Rab GTPases, increasingly expressed in HD cases only, demonstrate a massive dysfunction of the intracellular membrane trafficking in DS. Alterations of Rab GTPases, or of the membrane compartments that they regulate, are associated with virtually all cellular activities in health and disease. Rab GTPases were initially discovered in brain tissue, where their abundance and functional adaptations reflect neuronal challenges for membrane trafficking [70,71]. However, Rabs are found in all eukaryotic cells, where they mediate fundamental processes of vesicle sorting and transport between target membranes [72,73]. Consequently, Rab GTPases are commonly used as markers and identifiers of various organelles and vesicles in the endocytic and secretory systems. Of particular interest in the present study is RAb-3A, whose downregulation was already reported in human frontal cortex from DS individuals [74]. Further, in a previous work, Reddy et al. have shown a substantial loss of presynaptic vesicle proteins and postsynaptic proteins, including Rab 3A, in brains from AD patients compared to controls subjects supporting a role of this protein in brain neuropathology [75]. In this scenario, our data suggest that the reduction of Rab3A could be an early event in DS that occurs at different body compartments thus representing a shared mechanism of cell alteration. Furthermore, in the present study we found both rab10 and rab2 as UNIQUE proteins in HD cases. Rab1 and Rab2 regulate the transport of vesicles between ER and Golgi [76]. Amber R. English et al. have also identified Rab10 as an ER-specific Rab GTPase that regulates ER structure and dynamics [77]. They show that Rab10 localizes to the ER and to dynamic ER-associated structures that track along microtubules and mark the position of new ER tubule growth. Rab10 depletion or expression of a Rab10 GDP-locked mutant alters the ER morphology, resulting in fewer ER tubules. Another major finding of this study was that the protein levels of Rab GDP-dissociation inhibitor 2 (GDI-2) were significantly decreased in DS, as observed in a fetal Down syndrome brain by R. Weitzdoerfer et al. [78]. Rab GDP-dissociation inhibitor 2 (GDI-2) is a regulatory protein involved in membrane release of Rabs [79] that holds an essential role in vesicle formation, vesicle docking, and membrane fusion [80]. The depletion of the GDI gene in yeast led to various transport defects in the cell, demonstrating the high importance of GDIs function [81]. Furthermore D’ Adamo et al. showed that GDI has an important role in neuronal function and a mutation in the gene encoding GDI-1 is responsible for X-linked mental retardation [81]. Taken together these results suggest that decreased levels of GDI-2, together with the alteration of Rabs proteins, found in PBMCs from DS patients may represent one of the multiple factors leading to impaired vesicles transport observed in DS [48].
Membrane trafficking is essential for protein synthesis, processing, sorting, and turnover in the ER and Golgi apparatus. The ER is a multifunctional organelle that coordinates protein folding, lipid biosynthesis, and calcium storage and release [82]. The alteration of ER trafficking is associated with the perturbations of ER homeostasis that lead to ER stress and to the activation of specific stress responses involved in protein folding and/or degradation. These response mechanisms include the induction of the UPR and of re-folding proteins such as PDIs. Our proteomics analysis demonstrates the differential expression, in PBMCs from DS children, of proteins belonging to ER stress responses with a role in protein folding and unfolded protein binding. We found the altered expression of GRP78, ATF6, and CHOP components of the UPR, and of ERO1 and PDIA1. The UPR is composed of three main branches including the PKR (dsRNA-dependent protein kinase)-like ER kinase (PERK) branch, the inositol-requiring enzyme 1 (IRE-1) branch, and the activating transcription factor 6 (ATF6) branch. Under basal conditions, these specialized ER membrane-associated sensor proteins are bound by the ER chaperone GRP78 (also known as BiP) and are maintained in an inactive state [82,83]. Accumulation of unfolded/misfolded/mutated proteins in the ER lumen activates adaptive UPR mechanisms through release of GRP78 from the sensor proteins and the initiation of specific cellular responses for the restoration of ER homeostasis [82]. Once the ER stress is over activated, protein synthesis overtakes protein-folding capacity, then ATF6 translocates to the Golgi where it is cleaved [84,85,86]. The ensuing ATF6 fragment (pATF6(N)) translocates to the nucleus and initiates the expression of its target genes such as chaperones, genes involved in ERAD and pXBP1(S), and also of the pro-apoptotic gene CHOP [87]. Therefore, CHOP plays an important role in the switch between pro-survival and pro-apoptotic responses and [88,89] its regulation is central to adjust the sensitivity of cells to ER stress. Here, we suggest that ATF6 plays a crucial part in the dynamics of CHOP induction, where perturbation of ATF6 led to slightly increased CHOP levels. The crucial role of ATF6 in CHOP dynamics during the induction of the UPR has been recently published by Yang et al. [90]. Further, a recent study from our laboratory demonstrated the increased expression of GRP78 and CHOP along with the over induction of PERK and eIF2α in DS PBMCs and human brain supporting the concept of the putative role of aberrant UPR induction in promoting DS pathology. Interestingly, our current data confirm that ER stress and UPR are primary events in DS and might have a prominent role in pathological processes [45]. Such hypothesis is further corroborated by different authors that observed dysfunctional UPR and ISR in DS human and mice, supporting a role for trisomy-related aberrant UPR/ISR induction in the disruption of the proteostasis network [43,47]. Over the above-cited proteins involved in the UPR and folding related to the ER, the selective recognition of oxidized/misfolded proteins by molecular chaperones (HSPs) is the first step toward their elimination. Heat shock protein 70 (HSP70) and heat shock protein 90 (HSP90) are chaperones that interact with the outer mitochondrial membrane, stabilizing the unfolded state of the nascent proteins and thereby preventing their aggregation. We showed that HSP70 and HSP90 were significantly downregulated in DS suggesting a prevention in the formation of the appropriate interactions with the proteins target resulting in protein misfolding and a consequent exacerbation of oxidative stress. The increase of oxidative stress is demonstrated to occur in our sample and is known to be involved in DS phenotype as an effect of the increased production of pro-oxidant species due to the triplication of SOD-1 gene, among other. However, an involvement of differentially induced antioxidant responses has been also documented. We previously observed in DS blood-derived and brain samples the depletion of Nrf2-related antioxidant response, as an effect of Bach1 triplication, and its uncoupling with UPR defining a further degree of connection between proteostasis and OS [45]. Here we show that the increased expression levels of peroxiredoxins subtypes (Prx-proteins) in DS PBMCs suggest the activation of the Prx system due to unbalanced redox homeostasis [91]. Overall, the increased expression of Prx subtypes was already observed in brain patients with AD and DS [92].
Histones proteins represent a common target of ROS and RNS irreversible damage, that is able to alter their folding, expression, and stability, as well as, to induce their aberrant post-translational modification [93] thus severely impacting the global structure of chromatin, gene expression, genome stability, and replication. The alteration of proteins involved in DNA structure found by proteomic data concern mainly the DS group. We identified the altered expression of all the five types of histone proteins: H2A, H2B, H3, H4, and H1; and, except for H4, they all were identified as multiple isoforms. The increase in histone transcript levels that normally occurs during aging suggest a protection of the cells from premature aging, while the reduced histone expression in the short-lived mutants is a cause of their shortened lifespan. In agreement, Feser et al. demonstrated that the increase in the gene expression of all four core histones extended the median lifespan of asf1 mutants by 65% [94]. Within this context, our data suggest that the increased histones expression might represent a response to counteract the accelerated aging observed in DS.
Proteomics data also highlight the alteration of a central cellular function, the energy production. Collected results suggest that young DS individuals show an altered metabolic profile as indicated by a reduced expression of mitochondrial enzymes and of enzymes belonging to the pentose phosphate pathway (PPP), while in the presence of increased expression of glycolytic enzymes, including aldolase, GAPDH, and PGK1,2. Glycolysis is a fundamental feature of all cells and is therefore involved in a range of cellular responses that have been associated with both neurodevelopmental and neurodegenerative disorders. This includes effects on the immune system, cytoskeletal abnormalities, synaptic plasticity, and neurogenesis. We suggest that upregulation of glycolysis may be a compensatory mechanism in response to impaired mitochondrial function. Interestingly, among the glycolytic enzyme, fructose bisphosphate aldolase that catalyzes the reversible cleavage of F1,6PP to two triose phosphates, both of which continue through glycolysis, occupies a central position in glycolysis and gluconeogenesis pathways. Aldolase has been shown to boost glycolysis upon phosphoinositide 3-kinase (PI3K)/Akt signaling [95]. When glycolysis is activated, GAPDH has been reported to become a rate-limiting pathway step. Interestingly, GAPDH is often the most highly concentrated protein in glycolysis suggesting that the role of this high expression is to support the increased amount of glycolytic flux [96]. However, beside the above evidences support a condition of activated glycolysis, several published studies demonstrate that DS exhibit mitochondrial defects [20,22,26], ultimately responsible of reduced ATP production. Further, a reduction of transaldolase and transketolase levels, both involved in the second phase of PPP, may suggest decreased ability of the cell to replenish the cycle thus ultimately affecting both levels of energy substrates as well as reducing equivalents in the form of NADPH. Abnormalities in glucose metabolism and the link to metabolic syndrome in DS patients have been recently proposed [53] with evidences deriving from metabolome profile of plasma from DS [97,98], genes associated with glycolysis and signs of abnormal glucose metabolism evidenced in DS individuals and mouse models thereof [53]. Taken together, this signature suggests that a condition of hypometabolism occurs in DS individuals, likely because of the lowered glucose uptake, an early occurrence of insulin resistance associated with reduced mitochondrial activity [67]. Interestingly, our group, highlighted for the first time that markers of brain insulin resistance are evident in DS brain even before the development of AD pathology [67], suggesting that these alterations might support the mechanisms associated with intellectual disability, as well as the early onset of AD in people with DS [66].
Increasing evidences indicates that cytoskeletal abnormalities are observed already in prenatal life and may be largely responsible for the cortical dysgenesis in DS [65]. Among cytoskeleton components, we found that actin-related protein 2/3 complexes, tropomyosin, tubulin, cofilin, and myosin are overexpressed in DS vs. healthy controls. The microtubule cytoskeleton network is made up of tubulin subunits and actin filaments and serves multiple roles in neurons [99]. It provides a structural framework for axons and dendrites, representing a major determinant of neuronal size and morphology. It also serves as a track for transport and plays essential roles in growth and development. In contrast to microtubules that function individually, actin filaments work in networks or bundles that function to control cell shape, distribution of membrane proteins, and cell–cell interactions. Interestingly, in DS, cytoskeleton integrity seems to be strictly related to aberrant expression of Dyrk1A [100]. Published studies showed that both brain tissue and immortalized lymphocytes of DS patients displayed a significant reduction in the yield of all the major cytoskeletal proteins co-immunoprecipitated with DYRK1A antibodies [101]. Similarly to DS cells, overexpression of DYRK1A in trisomic TgDYRK1A mice was shown to cause alterations in actin dynamic through increased stability of actin filaments [102]. Further, results from Ori-McKenney et al. demonstrated that the regulation of microtubule dynamics by DYRK1A-mediated phosphorylation is critical for dendritic patterning and neuronal function, revealing a previously unidentified mode of post-translational microtubule regulation in neurons and uncovering a conserved pathway for a DS-associated kinase [100]. Conversely, Weitzdoerfer et al. reported the reduction of actin-related protein complex 2/3 in a fetal Down syndrome brain [103]. Our findings showing altered expression of cytoskeleton proteins in DS vs. healthy controls suggest that immune peripheral cell also retains the similar aberrant phenotype that is likely to play a central role in neurons. Dysfunction of cytoskeleton network may be considered a key pathological signature of DS.
Finally, we found the aberrant expression of several signaling proteins among which the reduced expression of protein kinase C (PKC) in DS group results in particular interest for the comprehension of the pathological processes. PKC represents a family of proteins including ten different members that represent ~2% of the entire kinome and display an almost ubiquitous expression throughout the human body. PKC enzymes are activated by signals such as increases with the concentration of diacylglycerol (DAG) or calcium ions (Ca2+) [104]. Once active PKCs are involved in controlling the function of other proteins through the phosphorylation of hydroxyl groups of serine and threonine amino acid residues. Reduced PKC activity was demonstrated in the brain of a DS mouse model [105] and in agreement with this, we support the decreased functionality of PKC signaling as pathological contributor of DS phenotype.

5. Conclusions

In summary, we found that PBMCs from young DS individuals recapitulate cellular defects that are considered to play a prominent role in DS pathological phenotypes. In detail, we identified proteins involved in metabolic pathways, cellular trafficking, stress response, cytoskeleton network, and cell signaling. In particular, collected data suggest that among the above-mentioned pathways increased OS and the over induction of stress-related response may confer to young DS individuals an activated state that may become a fertile ground that favors the accumulation, over lifespan, of multiple cellular damages, ultimately leading to different pathological outcomes including the onset of Alzheimer-like dementia. In addition, our data support the idea of employing blood cells as a model to complement the understanding of the key pathological mechanisms of DS. Further, considering that blood cells can be easily collected from living patients, they offer the unique opportunity for human studies aimed at identifying biomarkers of the disease, as well as testing novel therapeutic strategies.

Abbreviations

amyloid beta peptide
ADAlzheimer disease
AORantioxidant response
APPamyloid precursor protein
AREantioxidant response element
ATF6activating transcription factor 6
ATPadenosine triphosphate
BiP-GRP78Binding immunoglobulin—Glucose regulated protein 78
CHOP (DDTI3)DNA damage-inducible transcript 3
Chr21chromosome 21
CNcentral nervous system
DSDown syndrome
Dyrk1Adual specificity tyrosine phosphorylation regulated kinase 1A
eIF2αeukaryotic initiation factor 2 alpha
ERendoplasmic reticulum
GAPDHglyceraldehyde 3 phosphate dehydrogenase
H1Ahistone 1A
HSPheat shock protein
IRE1inositol-requiring enzyme 1
ISRintegrated stress response
NADPHnicotinamide adenine dinucleotide phosphate
Nrf2nuclear factor erythroid 2-related factor 2
OSoxidative stress
PBMCperipheral blood mononuclear cell
PERKprotein kinase R (PKR)-like endoplasmic reticulum kinase
PGKphosphoglycerate kinase
PPPpentose phosphate pathway
PKCprotein kinase C
PRDXperoxiredoxin

Author Contributions

Conceptualization, M.P. and F.D.D.; methodology, M.P., F.D.D., C.L., V.G., A.U.; software, C.L., V.G., S.P.; validation, M.P., F.D.D., A.U., E.B.; formal analysis, C.L., V.G., S.P., E.B., F.D.D., M.P.; investigation, C.L., V.G., S.P.; resources, M.P., F.D.D., D.V., A.V., V.F., M.C., F.L., E.B., A.U.; data curation, C.L., V.G.; writing—original draft preparation, C.L., V.G., M.P., F.D.D.; writing—review and editing, M.P., F.D.D., E.B., D.V., A.V., V.F., F.L., A.U.; visualization, C.L., V.G., F.D.D.; supervision, M.P., F.D.D.; project administration, M.P.; funding acquisition, M.P., F.D.D. All authors have read and agreed to the published version of the manuscript.

Funding

This work was supported by: Fondi Ateneo grant funded by Sapienza University n° C26H15JT9X to MP and N° RG1181642744DF59, RM11715C773949E3 and RG116154C9214D1A to FDD; Istituto Pasteur Italia—Fondazione Cenci Bolognetti Under 45 U-4.IT, and from Ministry of Health GR-2018-12366381 to FFD.

Conflicts of Interest

The authors declare no conflict of interest.

References

  1. De Graaf, G.; Buckley, F.; Skotko, B.G. Estimation of the number of people with Down syndrome in the United States. Genet. Med. 2017, 19, 439–447. [Google Scholar] [CrossRef] [PubMed]
  2. Weijerman, M.E.; van Furth, A.M.; Vonk Noordegraaf, A.; van Wouwe, J.P.; Broers, C.J.; Gemke, R.J. Prevalence, neonatal characteristics, and first-year mortality of Down syndrome: A national study. J. Pediatr. 2008, 152, 15–19. [Google Scholar] [CrossRef] [PubMed]
  3. Antonarakis, S.E.; Lyle, R.; Dermitzakis, E.T.; Reymond, A.; Deutsch, S. Chromosome 21 and down syndrome: From genomics to pathophysiology. Nat. Rev. Genet. 2004, 5, 725–738. [Google Scholar] [CrossRef] [PubMed]
  4. Nistor, M.; Don, M.; Parekh, M.; Sarsoza, F.; Goodus, M.; Lopez, G.E.; Kawas, C.; Leverenz, J.; Doran, E.; Lott, I.T.; et al. Alpha- and beta-secretase activity as a function of age and beta-amyloid in Down syndrome and normal brain. Neurobiol. Aging 2007, 28, 1493–1506. [Google Scholar] [CrossRef] [Green Version]
  5. Lott, I.T.; Head, E. Alzheimer disease and Down syndrome: Factors in pathogenesis. Neurobiol. Aging 2005, 26, 383–389. [Google Scholar] [CrossRef] [PubMed]
  6. Lai, F.; Williams, R.S. A prospective study of Alzheimer disease in Down syndrome. Arch. Neurol. 1989, 46, 849–853. [Google Scholar] [CrossRef] [PubMed]
  7. Lemere, C.A.; Blusztajn, J.K.; Yamaguchi, H.; Wisniewski, T.; Saido, T.C.; Selkoe, D.J. Sequence of deposition of heterogeneous amyloid beta-peptides and APO E in Down syndrome: Implications for initial events in amyloid plaque formation. Neurobiol. Dis. 1996, 3, 16–32. [Google Scholar] [CrossRef] [Green Version]
  8. Baban, A.; Olivini, N.; Cantarutti, N.; Cali, F.; Vitello, C.; Valentini, D.; Adorisio, R.; Calcagni, G.; Alesi, V.; Di Mambro, C.; et al. Differences in morbidity and mortality in Down syndrome are related to the type of congenital heart defect. Am. J. Med. Genet. Part A 2020, 182, 1342–1350. [Google Scholar] [CrossRef]
  9. Valentini, D.; Alisi, A.; di Camillo, C.; Sartorelli, M.R.; Crudele, A.; Bartuli, A.; Nobili, V.; Villani, A. Nonalcoholic Fatty Liver Disease in Italian Children with Down Syndrome: Prevalence and Correlation with Obesity-Related Features. J. Pediatr. 2017, 189, 92–97.e1. [Google Scholar] [CrossRef] [Green Version]
  10. Bloemers, B.L.; van Bleek, G.M.; Kimpen, J.L.; Bont, L. Distinct abnormalities in the innate immune system of children with Down syndrome. J. Pediatr. 2010, 156, 804–809.e5. [Google Scholar] [CrossRef]
  11. Bloemers, B.L.; Broers, C.J.; Bont, L.; Weijerman, M.E.; Gemke, R.J.; van Furth, A.M. Increased risk of respiratory tract infections in children with Down syndrome: The consequence of an altered immune system. Microb. Infect. 2010, 12, 799–808. [Google Scholar] [CrossRef] [PubMed]
  12. Capolunghi, F.; Rosado, M.M.; Sinibaldi, M.; Aranburu, A.; Carsetti, R. Why do we need IgM memory B cells? Immunol. Lett. 2013, 152, 114–120. [Google Scholar] [CrossRef] [PubMed]
  13. Carsetti, R.; Valentini, D.; Marcellini, V.; Scarsella, M.; Marasco, E.; Giustini, F.; Bartuli, A.; Villani, A.; Ugazio, A.G. Reduced numbers of switched memory B cells with high terminal differentiation potential in Down syndrome. Eur. J. Immunol. 2015, 45, 903–914. [Google Scholar] [CrossRef] [PubMed] [Green Version]
  14. Ram, G.; Chinen, J. Infections and immunodeficiency in Down syndrome. Clin. Exp. Immunol. 2011, 164, 9–16. [Google Scholar] [CrossRef] [PubMed]
  15. Korbel, J.O.; Tirosh-Wagner, T.; Urban, A.E.; Chen, X.N.; Kasowski, M.; Dai, L.; Grubert, F.; Erdman, C.; Gao, M.C.; Lange, K.; et al. The genetic architecture of Down syndrome phenotypes revealed by high-resolution analysis of human segmental trisomies. Proc. Natl. Acad. Sci. USA 2009, 106, 12031–12036. [Google Scholar] [CrossRef] [PubMed] [Green Version]
  16. Olson, L.E.; Richtsmeier, J.T.; Leszl, J.; Reeves, R.H. A chromosome 21 critical region does not cause specific Down syndrome phenotypes. Science 2004, 306, 687–690. [Google Scholar] [CrossRef] [Green Version]
  17. Haydar, T.F.; Reeves, R.H. Trisomy 21 and early brain development. Trends Neurosci. 2012, 35, 81–91. [Google Scholar] [CrossRef] [PubMed] [Green Version]
  18. de Haan, J.B.; Susil, B.; Pritchard, M.; Kola, I. An altered antioxidant balance occurs in Down syndrome fetal organs: Implications for the “gene dosage effect” hypothesis. J. Neural. Transm. Suppl. 2003. [Google Scholar] [CrossRef]
  19. Di Domenico, F.; Pupo, G.; Mancuso, C.; Barone, E.; Paolini, F.; Arena, A.; Blarzino, C.; Schmitt, F.A.; Head, E.; Butterfield, D.A.; et al. Bach1 overexpression in Down syndrome correlates with the alteration of the HO-1/BVR-a system: Insights for transition to Alzheimer’s disease. J. Alzheimers Dis. 2015, 44, 1107–1120. [Google Scholar] [CrossRef] [Green Version]
  20. Busciglio, J.; Pelsman, A.; Wong, C.; Pigino, G.; Yuan, M.; Mori, H.; Yankner, B.A. Altered metabolism of the amyloid beta precursor protein is associated with mitochondrial dysfunction in Down’s syndrome. Neuron 2002, 33, 677–688. [Google Scholar] [CrossRef] [Green Version]
  21. Dickinson, M.J.; Singh, I. Down’s syndrome, dementia, and superoxide dismutase. Br. J. Psychiatry 1993, 162, 811–817. [Google Scholar] [CrossRef] [PubMed]
  22. Coskun, P.; Helguera, P.; Nemati, Z.; Bohannan, R.C.; Thomas, J.; Samuel, S.E.; Argueta, J.; Doran, E.; Wallace, D.C.; Lott, I.T.; et al. Metabolic and Growth Rate Alterations in Lymphoblastic Cell Lines Discriminate Between Down Syndrome and Alzheimer’s Disease. J. Alzheimers Dis. 2017, 55, 737–748. [Google Scholar] [CrossRef] [PubMed]
  23. Valenti, D.; Manente, G.A.; Moro, L.; Marra, E.; Vacca, R.A. Deficit of complex I activity in human skin fibroblasts with chromosome 21 trisomy and overproduction of reactive oxygen species by mitochondria: Involvement of the cAMP/PKA signalling pathway. Biochem. J. 2011, 435, 679–688. [Google Scholar] [CrossRef] [Green Version]
  24. Tramutola, A.; Lanzillotta, C.; Barone, E.; Arena, A.; Zuliani, I.; Mosca, L.; Blarzino, C.; Butterfield, D.A.; Perluigi, M.; Di Domenico, F. Intranasal rapamycin ameliorates Alzheimer-like cognitive decline in a mouse model of Down syndrome. Transl. Neurodegener. 2018, 7, 28. [Google Scholar] [CrossRef] [PubMed] [Green Version]
  25. Di Domenico, F.; Tramutola, A.; Barone, E.; Lanzillotta, C.; Defever, O.; Arena, A.; Zuliani, I.; Foppoli, C.; Iavarone, F.; Vincenzoni, F.; et al. Restoration of aberrant mTOR signaling by intranasal rapamycin reduces oxidative damage: Focus on HNE-modified proteins in a mouse model of down syndrome. Redox. Biol. 2019, 23, 101162. [Google Scholar] [CrossRef] [PubMed]
  26. Valenti, D.; Tullo, A.; Caratozzolo, M.F.; Merafina, R.S.; Scartezzini, P.; Marra, E.; Vacca, R.A. Impairment of F1F0-ATPase, adenine nucleotide translocator and adenylate kinase causes mitochondrial energy deficit in human skin fibroblasts with chromosome 21 trisomy. Biochem. J. 2010, 431, 299–310. [Google Scholar] [CrossRef] [PubMed]
  27. Helguera, P.; Seiglie, J.; Rodriguez, J.; Hanna, M.; Helguera, G.; Busciglio, J. Adaptive downregulation of mitochondrial function in down syndrome. Cell. Metab. 2013, 17, 132–140. [Google Scholar] [CrossRef] [Green Version]
  28. Di Domenico, F.; Barone, E.; Perluigi, M.; Butterfield, D.A. The Triangle of Death in Alzheimer’s Disease Brain: The Aberrant Cross-Talk Among Energy Metabolism, Mammalian Target of Rapamycin Signaling, and Protein Homeostasis Revealed by Redox Proteomics. Antioxid. Redox. Signal. 2017, 26, 364–387. [Google Scholar] [CrossRef]
  29. Druzhyna, N.; Nair, R.G.; LeDoux, S.P.; Wilson, G.L. Defective repair of oxidative damage in mitochondrial DNA in Down’s syndrome. Mutat. Res. 1998, 409, 81–89. [Google Scholar] [CrossRef]
  30. Coskun, P.E.; Busciglio, J. Oxidative Stress and Mitochondrial Dysfunction in Down’s Syndrome: Relevance to Aging and Dementia. Curr. Gerontol. Geriatr. Res. 2012, 2012, 383170. [Google Scholar] [CrossRef]
  31. Weick, J.P.; Held, D.L.; Bonadurer, G.F., 3rd; Doers, M.E.; Liu, Y.; Maguire, C.; Clark, A.; Knackert, J.A.; Molinarolo, K.; Musser, M.; et al. Deficits in human trisomy 21 iPSCs and neurons. Proc. Natl. Acad. Sci. USA 2013, 110, 9962–9967. [Google Scholar] [CrossRef] [PubMed] [Green Version]
  32. Briggs, J.A.; Sun, J.; Shepherd, J.; Ovchinnikov, D.A.; Chung, T.L.; Nayler, S.P.; Kao, L.P.; Morrow, C.A.; Thakar, N.Y.; Soo, S.Y.; et al. Integration-free induced pluripotent stem cells model genetic and neural developmental features of down syndrome etiology. Stem. Cells 2013, 31, 467–478. [Google Scholar] [CrossRef] [PubMed]
  33. Mollo, N.; Cicatiello, R.; Aurilia, M.; Scognamiglio, R.; Genesio, R.; Charalambous, M.; Paladino, S.; Conti, A.; Nitsch, L.; Izzo, A. Targeting Mitochondrial Network Architecture in Down Syndrome and Aging. Int. J. Mol. Sci. 2020, 21, 3134. [Google Scholar] [CrossRef] [PubMed]
  34. Perluigi, M.; Butterfield, D.A. The identification of protein biomarkers for oxidative stress in Down syndrome. Expert Rev. Proteom. 2011, 8, 427–429. [Google Scholar] [CrossRef] [Green Version]
  35. Di Domenico, F.; Coccia, R.; Cocciolo, A.; Murphy, M.P.; Cenini, G.; Head, E.; Butterfield, D.A.; Giorgi, A.; Schinina, M.E.; Mancuso, C.; et al. Impairment of proteostasis network in Down syndrome prior to the development of Alzheimer’s disease neuropathology: Redox proteomics analysis of human brain. Biochim. Biophys. Acta 2013, 1832, 1249–1259. [Google Scholar] [CrossRef]
  36. Perluigi, M.; Butterfield, D.A. Oxidative Stress and Down Syndrome: A Route toward Alzheimer-Like Dementia. Curr. Gerontol. Geriatr. Res. 2012, 2012, 724904. [Google Scholar] [CrossRef] [PubMed] [Green Version]
  37. Perluigi, M.; di Domenico, F.; Fiorini, A.; Cocciolo, A.; Giorgi, A.; Foppoli, C.; Butterfield, D.A.; Giorlandino, M.; Giorlandino, C.; Schinina, M.E.; et al. Oxidative stress occurs early in Down syndrome pregnancy: A redox proteomics analysis of amniotic fluid. Proteom. Clin. Appl. 2011, 5, 167–178. [Google Scholar] [CrossRef]
  38. Perluigi, M.; Di Domenico, F.; Buttterfield, D.A. Unraveling the complexity of neurodegeneration in brains of subjects with Down syndrome: Insights from proteomics. Proteom. Clin. Appl. 2014, 8, 73–85. [Google Scholar] [CrossRef] [Green Version]
  39. Di Domenico, F.; Tramutola, A.; Foppoli, C.; Head, E.; Perluigi, M.; Butterfield, D.A. mTOR in Down syndrome: Role in Ass and tau neuropathology and transition to Alzheimer disease-like dementia. Free Radic Biol. Med. 2018, 114, 94–101. [Google Scholar] [CrossRef]
  40. Jaisson, S.; Gillery, P. Impaired proteostasis: Role in the pathogenesis of diabetes mellitus. Diabetologia 2014, 57, 1517–1527. [Google Scholar] [CrossRef]
  41. Kharabi Masouleh, B.; Geng, H.; Hurtz, C.; Chan, L.N.; Logan, A.C.; Chang, M.S.; Huang, C.; Swaminathan, S.; Sun, H.; Paietta, E.; et al. Mechanistic rationale for targeting the unfolded protein response in pre-B acute lymphoblastic leukemia. Proc. Natl. Acad. Sci. USA 2014, 111, E2219–E2228. [Google Scholar] [CrossRef] [PubMed] [Green Version]
  42. Palsamy, P.; Bidasee, K.R.; Shinohara, T. Selenite cataracts: Activation of endoplasmic reticulum stress and loss of Nrf2/Keap1-dependent stress protection. Biochim. Biophys. Acta 2014, 1842, 1794–1805. [Google Scholar] [CrossRef] [PubMed] [Green Version]
  43. Aivazidis, S.; Coughlan, C.M.; Rauniyar, A.K.; Jiang, H.; Liggett, L.A.; Maclean, K.N.; Roede, J.R. The burden of trisomy 21 disrupts the proteostasis network in Down syndrome. PLoS ONE 2017, 12, e0176307. [Google Scholar] [CrossRef] [PubMed]
  44. Lanzillotta, C.; Tramutola, A.; Meier, S.; Schmitt, F.; Barone, E.; Perluigi, M.; Di Domenico, F.; Abisambra, J.F. Early and Selective Activation and Subsequent Alterations to the Unfolded Protein Response in Down Syndrome Mouse Models. J. Alzheimers Dis. 2018, 62, 347–359. [Google Scholar] [CrossRef] [PubMed]
  45. Lanzillotta, C.; Zuliani, I.; Tramutola, A.; Barone, E.; Blarzino, C.; Folgiero, V.; Caforio, M.; Valentini, D.; Villani, A.; Locatelli, F.; et al. Chronic PERK induction promotes Alzheimer-like neuropathology in Down syndrome: Insights for therapeutic intervention. Prog. Neurobiol. 2020. [Google Scholar] [CrossRef] [PubMed]
  46. Tramutola, A.; Di Domenico, F.; Barone, E.; Arena, A.; Giorgi, A.; di Francesco, L.; Schinina, M.E.; Coccia, R.; Head, E.; Butterfield, D.A.; et al. Polyubiquitinylation Profile in Down Syndrome Brain Before and After the Development of Alzheimer Neuropathology. Antioxid. Redox. Signal. 2017, 26, 280–298. [Google Scholar] [CrossRef] [PubMed] [Green Version]
  47. Zhu, P.J.; Khatiwada, S.; Cui, Y.; Reineke, L.C.; Dooling, S.W.; Kim, J.J.; Li, W.; Walter, P.; Costa-Mattioli, M. Activation of the ISR mediates the behavioral and neurophysiological abnormalities in Down syndrome. Science 2019, 366, 843–849. [Google Scholar] [CrossRef]
  48. Botte, A.; Potier, M.C. Focusing on cellular biomarkers: The endo-lysosomal pathway in Down syndrome. Prog. Brain. Res. 2020, 251, 209–243. [Google Scholar] [CrossRef]
  49. Cataldo, A.M.; Mathews, P.M.; Boiteau, A.B.; Hassinger, L.C.; Peterhoff, C.M.; Jiang, Y.; Mullaney, K.; Neve, R.L.; Gruenberg, J.; Nixon, R.A. Down syndrome fibroblast model of Alzheimer-related endosome pathology: Accelerated endocytosis promotes late endocytic defects. Am. J. Pathol. 2008, 173, 370–384. [Google Scholar] [CrossRef] [Green Version]
  50. Cataldo, A.M.; Peterhoff, C.M.; Troncoso, J.C.; Gomez-Isla, T.; Hyman, B.T.; Nixon, R.A. Endocytic pathway abnormalities precede amyloid beta deposition in sporadic Alzheimer’s disease and Down syndrome: Differential effects of APOE genotype and presenilin mutations. Am. J. Pathol. 2000, 157, 277–286. [Google Scholar] [CrossRef]
  51. Cossec, J.C.; Lavaur, J.; Berman, D.E.; Rivals, I.; Hoischen, A.; Stora, S.; Ripoll, C.; Mircher, C.; Grattau, Y.; Olivomarin, J.C.; et al. Trisomy for synaptojanin1 in Down syndrome is functionally linked to the enlargement of early endosomes. Hum. Mol. Genet. 2012, 21, 3156–3172. [Google Scholar] [CrossRef] [PubMed] [Green Version]
  52. Jiang, Y.; Mullaney, K.A.; Peterhoff, C.M.; Che, S.; Schmidt, S.D.; Boyer-Boiteau, A.; Ginsberg, S.D.; Cataldo, A.M.; Mathews, P.M.; Nixon, R.A. Alzheimer’s-related endosome dysfunction in Down syndrome is Abeta-independent but requires APP and is reversed by BACE-1 inhibition. Proc. Natl. Acad. Sci. USA 2010, 107, 1630–1635. [Google Scholar] [CrossRef] [PubMed] [Green Version]
  53. Dierssen, M.; Fructuoso, M.; Martinez de Lagran, M.; Perluigi, M.; Barone, E. Down Syndrome Is a Metabolic Disease: Altered Insulin Signaling Mediates Peripheral and Brain Dysfunctions. Front. Neurosci. 2020, 14, 670. [Google Scholar] [CrossRef] [PubMed]
  54. Distler, U.; Kuharev, J.; Navarro, P.; Tenzer, S. Label-free quantification in ion mobility-enhanced data-independent acquisition proteomics. Nat. Protoc. 2016, 11, 795–812. [Google Scholar] [CrossRef]
  55. Greco, V.; Spalloni, A.; Corasolla Carregari, V.; Pieroni, L.; Persichilli, S.; Mercuri, N.B.; Urbani, A.; Longone, P. Proteomics and Toxicity Analysis of Spinal-Cord Primary Cultures upon Hydrogen Sulfide Treatment. Antioxidants (Basel) 2018, 7, 87. [Google Scholar] [CrossRef] [Green Version]
  56. Marini, F.; Carregari, V.C.; Greco, V.; Ronci, M.; Iavarone, F.; Persichilli, S.; Castagnola, M.; Urbani, A.; Pieroni, L. Exploring the HeLa Dark Mitochondrial Proteome. Front. Cell Dev. Biol. 2020, 8, 137. [Google Scholar] [CrossRef]
  57. Silva, J.C.; Gorenstein, M.V.; Li, G.Z.; Vissers, J.P.; Geromanos, S.J. Absolute quantification of proteins by LCMSE: A virtue of parallel MS acquisition. Mol. Cell Proteom. 2006, 5, 144–156. [Google Scholar] [CrossRef] [Green Version]
  58. Vissers, J.P.; Langridge, J.I.; Aerts, J.M. Analysis and quantification of diagnostic serum markers and protein signatures for Gaucher disease. Mol. Cell Proteom. 2007, 6, 755–766. [Google Scholar] [CrossRef] [Green Version]
  59. Butterfield, D.A.; Gu, L.; Di Domenico, F.; Robinson, R.A. Mass spectrometry and redox proteomics: Applications in disease. Mass. Spectrom. Rev. 2014, 33, 277–301. [Google Scholar] [CrossRef]
  60. Epstein, C.J.; Korenberg, J.R.; Anneren, G.; Antonarakis, S.E.; Ayme, S.; Courchesne, E.; Epstein, L.B.; Fowler, A.; Groner, Y.; Huret, J.L.; et al. Protocols to establish genotype-phenotype correlations in Down syndrome. Am. J. Hum. Genet. 1991, 49, 207–235. [Google Scholar]
  61. Gardiner, K. Gene-dosage effects in Down syndrome and trisomic mouse models. Genom. Biol. 2004, 5, 244. [Google Scholar] [CrossRef] [PubMed] [Green Version]
  62. Gearhart, J.D.; Oster-Granite, M.L.; Reeves, R.H.; Coyle, J.T. Developmental consequences of autosomal aneuploidy in mammals. Dev. Genet. 1987, 8, 249–265. [Google Scholar] [CrossRef] [PubMed]
  63. Gardiner, K.; Herault, Y.; Lott, I.T.; Antonarakis, S.E.; Reeves, R.H.; Dierssen, M. Down syndrome: From understanding the neurobiology to therapy. J. Neurosci. 2010, 30, 14943–14945. [Google Scholar] [CrossRef] [PubMed] [Green Version]
  64. Reeves, R.H.; Baxter, L.L.; Richtsmeier, J.T. Too much of a good thing: Mechanisms of gene action in Down syndrome. Trends Genet. 2001, 17, 83–88. [Google Scholar] [CrossRef]
  65. Engidawork, E.; Lubec, G. Molecular changes in fetal Down syndrome brain. J. Neurochem. 2003, 84, 895–904. [Google Scholar] [CrossRef] [Green Version]
  66. Lott, I.T.; Head, E. Dementia in Down syndrome: Unique insights for Alzheimer disease research. Nat. Rev. Neurol. 2019, 15, 135–147. [Google Scholar] [CrossRef]
  67. Tramutola, A.; Lanzillotta, C.; Di Domenico, F.; Head, E.; Butterfield, D.A.; Perluigi, M.; Barone, E. Brain insulin resistance triggers early onset Alzheimer disease in Down syndrome. Neurobiol. Dis. 2020, 137, 104772. [Google Scholar] [CrossRef]
  68. Perluigi, M.; Barone, E.; Di Domenico, F.; Butterfield, D.A. Aberrant protein phosphorylation in Alzheimer disease brain disturbs pro-survival and cell death pathways. Biochim. Biophys. Acta 2016, 1862, 1871–1882. [Google Scholar] [CrossRef]
  69. Mancuso, C.; Siciliano, R.; Barone, E. Curcumin and Alzheimer disease: This marriage is not to be performed. J. Biol. Chem. 2011, 286. [Google Scholar] [CrossRef] [Green Version]
  70. Touchot, N.; Chardin, P.; Tavitian, A. Four additional members of the ras gene superfamily isolated by an oligonucleotide strategy: Molecular cloning of YPT-related cDNAs from a rat brain library. Proc. Natl. Acad. Sci. USA 1987, 84, 8210–8214. [Google Scholar] [CrossRef] [Green Version]
  71. Weber, E.; Jilling, T.; Kirk, K.L. Distinct functional properties of Rab3A and Rab3B in PC12 neuroendocrine cells. J. Biol. Chem. 1996, 271, 6963–6971. [Google Scholar] [CrossRef] [PubMed] [Green Version]
  72. Pfeffer, S.R. Rab GTPases: Master regulators that establish the secretory and endocytic pathways. Mol. Biol. Cell 2017, 28, 712–715. [Google Scholar] [CrossRef] [PubMed]
  73. Zhen, Y.; Stenmark, H. Cellular functions of Rab GTPases at a glance. J. Cell Sci. 2015, 128, 3171–3176. [Google Scholar] [CrossRef] [PubMed] [Green Version]
  74. Cenini, G.; Fiorini, A.; Sultana, R.; Perluigi, M.; Cai, J.; Klein, J.B.; Head, E.; Butterfield, D.A. An investigation of the molecular mechanisms engaged before and after the development of Alzheimer disease neuropathology in Down syndrome: A proteomics approach. Free Radic Biol. Med. 2014, 76, 89–95. [Google Scholar] [CrossRef] [PubMed] [Green Version]
  75. Reddy, P.H.; Mani, G.; Park, B.S.; Jacques, J.; Murdoch, G.; Whetsell, W., Jr.; Kaye, J.; Manczak, M. Differential loss of synaptic proteins in Alzheimer’s disease: Implications for synaptic dysfunction. J. Alzheimers Dis. 2005, 7, 103–117. [Google Scholar] [CrossRef] [PubMed]
  76. Kiral, F.R.; Kohrs, F.E.; Jin, E.J.; Hiesinger, P.R. Rab GTPases and Membrane Trafficking in Neurodegeneration. Curr. Biol. 2018, 28, R471–R486. [Google Scholar] [CrossRef] [Green Version]
  77. English, A.R.; Voeltz, G.K. Rab10 GTPase regulates ER dynamics and morphology. Nat. Cell Biol. 2013, 15, 169–178. [Google Scholar] [CrossRef] [Green Version]
  78. Weitzdoerfer, R.; Stolzlechner, D.; Dierssen, M.; Ferreres, J.; Fountoulakis, M.; Lubec, G. Reduction of nucleoside diphosphate kinase B, Rab GDP-dissociation inhibitor beta and histidine triad nucleotide-binding protein in fetal Down syndrome brain. J. Neural Transm. Suppl. 2001, 347–359. [Google Scholar] [CrossRef]
  79. Shisheva, A.; Chinni, S.R.; DeMarco, C. General role of GDP dissociation inhibitor 2 in membrane release of Rab proteins: Modulations of its functional interactions by in vitro and in vivo structural modifications. Biochemistry 1999, 38, 11711–11721. [Google Scholar] [CrossRef]
  80. Schimmoller, F.; Simon, I.; Pfeffer, S.R. Rab GTPases, directors of vesicle docking. J. Biol. Chem. 1998, 273, 22161–22164. [Google Scholar] [CrossRef] [Green Version]
  81. D’Adamo, P.; Menegon, A.; Lo Nigro, C.; Grasso, M.; Gulisano, M.; Tamanini, F.; Bienvenu, T.; Gedeon, A.K.; Oostra, B.; Wu, S.K.; et al. Mutations in GDI1 are responsible for X-linked non-specific mental retardation. Nat. Genet. 1998, 19, 134–139. [Google Scholar] [CrossRef] [PubMed]
  82. Chaudhari, N.; Talwar, P.; Parimisetty, A.; Lefebvre d’Hellencourt, C.; Ravanan, P. A molecular web: Endoplasmic reticulum stress, inflammation, and oxidative stress. Front. Cell Neurosci. 2014, 8, 213. [Google Scholar] [CrossRef] [PubMed]
  83. Zhang, K.; Kaufman, R.J. From endoplasmic-reticulum stress to the inflammatory response. Nature 2008, 454, 455–462. [Google Scholar] [CrossRef] [PubMed] [Green Version]
  84. Chen, X.; Shen, J.; Prywes, R. The luminal domain of ATF6 senses endoplasmic reticulum (ER) stress and causes translocation of ATF6 from the ER to the Golgi. J. Biol. Chem. 2002, 277, 13045–13052. [Google Scholar] [CrossRef] [Green Version]
  85. Shen, J.; Chen, X.; Hendershot, L.; Prywes, R. ER stress regulation of ATF6 localization by dissociation of BiP/GRP78 binding and unmasking of Golgi localization signals. Dev. Cell 2002, 3, 99–111. [Google Scholar] [CrossRef] [Green Version]
  86. Ye, J.; Rawson, R.B.; Komuro, R.; Chen, X.; Dave, U.P.; Prywes, R.; Brown, M.S.; Goldstein, J.L. ER stress induces cleavage of membrane-bound ATF6 by the same proteases that process SREBPs. Mol. Cell 2000, 6, 1355–1364. [Google Scholar] [CrossRef]
  87. Itoh, K.; Ohtsu, T.; Sasaki, Y.; Ogura, M.; Morishima, Y.; Kasai, M.; Chou, T.; Yoshida, K.; Ohno, T.; Mizorogi, F.; et al. Randomized comparison of mobilization kinetics of circulating CD34+ cells between biweekly CHOP and dose-escalated CHOP with the prophylactic use of lenograstim (glycosylated rHuG-CSF) in aggressive non-Hodgkin’s lymphoma. The lenograstim/Lymphoma Study Group. Leuk Lymphoma 2000, 38, 521–532. [Google Scholar] [CrossRef]
  88. Urra, H.; Dufey, E.; Lisbona, F.; Rojas-Rivera, D.; Hetz, C. When ER stress reaches a dead end. Biochim. Biophys. Acta 2013, 1833, 3507–3517. [Google Scholar] [CrossRef] [Green Version]
  89. Uzi, D.; Barda, L.; Scaiewicz, V.; Mills, M.; Mueller, T.; Gonzalez-Rodriguez, A.; Valverde, A.M.; Iwawaki, T.; Nahmias, Y.; Xavier, R.; et al. CHOP is a critical regulator of acetaminophen-induced hepatotoxicity. J. Hepatol. 2013, 59, 495–503. [Google Scholar] [CrossRef]
  90. Yang, H.; Niemeijer, M.; van de Water, B.; Beltman, J.B. ATF6 Is a Critical Determinant of CHOP Dynamics during the Unfolded Protein Response. iScience 2020, 23, 100860. [Google Scholar] [CrossRef] [Green Version]
  91. Fullerton, H.J.; Ditelberg, J.S.; Chen, S.F.; Sarco, D.P.; Chan, P.H.; Epstein, C.J.; Ferriero, D.M. Copper/zinc superoxide dismutase transgenic brain accumulates hydrogen peroxide after perinatal hypoxia ischemia. Ann. Neurol. 1998, 44, 357–364. [Google Scholar] [CrossRef] [PubMed]
  92. Krapfenbauer, K.; Engidawork, E.; Cairns, N.; Fountoulakis, M.; Lubec, G. Aberrant expression of peroxiredoxin subtypes in neurodegenerative disorders. Brain Res. 2003, 967, 152–160. [Google Scholar] [CrossRef]
  93. Kreuz, S.; Fischle, W. Oxidative stress signaling to chromatin in health and disease. Epigenomics 2016, 8, 843–862. [Google Scholar] [CrossRef] [PubMed] [Green Version]
  94. Feser, J.; Truong, D.; Das, C.; Carson, J.J.; Kieft, J.; Harkness, T.; Tyler, J.K. Elevated histone expression promotes life span extension. Mol. Cell 2010, 39, 724–735. [Google Scholar] [CrossRef] [PubMed] [Green Version]
  95. Hu, H.; Juvekar, A.; Lyssiotis, C.A.; Lien, E.C.; Albeck, J.G.; Oh, D.; Varma, G.; Hung, Y.P.; Ullas, S.; Lauring, J.; et al. Phosphoinositide 3-Kinase Regulates Glycolysis through Mobilization of Aldolase from the Actin Cytoskeleton. Cell 2016, 164, 433–446. [Google Scholar] [CrossRef] [Green Version]
  96. Shestov, A.A.; Liu, X.; Ser, Z.; Cluntun, A.A.; Hung, Y.P.; Huang, L.; Kim, D.; Le, A.; Yellen, G.; Albeck, J.G.; et al. Quantitative determinants of aerobic glycolysis identify flux through the enzyme GAPDH as a limiting step. Elife 2014, 3. [Google Scholar] [CrossRef]
  97. Antonaros, F.; Ghini, V.; Pulina, F.; Ramacieri, G.; Cicchini, E.; Mannini, E.; Martelli, A.; Feliciello, A.; Lanfranchi, S.; Onnivello, S.; et al. Plasma metabolome and cognitive skills in Down syndrome. Sci. Rep. 2020, 10, 10491. [Google Scholar] [CrossRef]
  98. Caracausi, M.; Ghini, V.; Locatelli, C.; Mericio, M.; Piovesan, A.; Antonaros, F.; Pelleri, M.C.; Vitale, L.; Vacca, R.A.; Bedetti, F.; et al. Plasma and urinary metabolomic profiles of Down syndrome correlate with alteration of mitochondrial metabolism. Sci. Rep. 2018, 8, 2977. [Google Scholar] [CrossRef] [Green Version]
  99. Barone, E.; Mosser, S.; Fraering, P.C. Inactivation of brain Cofilin-1 by age, Alzheimer’s disease and gamma-secretase. Biochim. Biophys. Acta 2014, 1842, 2500–2509. [Google Scholar] [CrossRef] [Green Version]
  100. Ori-McKenney, K.M.; McKenney, R.J.; Huang, H.H.; Li, T.; Meltzer, S.; Jan, L.Y.; Vale, R.D.; Wiita, A.P.; Jan, Y.N. Phosphorylation of beta-Tubulin by the Down Syndrome Kinase, Minibrain/DYRK1a, Regulates Microtubule Dynamics and Dendrite Morphogenesis. Neuron 2016, 90, 551–563. [Google Scholar] [CrossRef] [Green Version]
  101. Dowjat, K.; Adayev, T.; Kaczmarski, W.; Wegiel, J.; Hwang, Y.W. Gene dosage-dependent association of DYRK1A with the cytoskeleton in the brain and lymphocytes of down syndrome patients. J. Neuropathol. Exp. Neurol. 2012, 71, 1100–1112. [Google Scholar] [CrossRef] [PubMed] [Green Version]
  102. Dowjat, K.; Adayev, T.; Wojda, U.; Brzozowska, K.; Barczak, A.; Gabryelewicz, T.; Hwang, Y.W. Abnormalities of DYRK1A-Cytoskeleton Complexes in the Blood Cells as Potential Biomarkers of Alzheimer’s Disease. J. Alzheimers Dis. 2019, 72, 1059–1075. [Google Scholar] [CrossRef] [PubMed] [Green Version]
  103. Weitzdoerfer, R.; Fountoulakis, M.; Lubec, G. Reduction of actin-related protein complex 2/3 in fetal Down syndrome brain. Biochem. Biophys. Res. Commun. 2002, 293, 836–841. [Google Scholar] [CrossRef]
  104. Wilson, C.H.; Ali, E.S.; Scrimgeour, N.; Martin, A.M.; Hua, J.; Tallis, G.A.; Rychkov, G.Y.; Barritt, G.J. Steatosis inhibits liver cell store-operated Ca(2)(+) entry and reduces ER Ca(2)(+) through a protein kinase C-dependent mechanism. Biochem. J. 2015, 466, 379–390. [Google Scholar] [CrossRef] [PubMed]
  105. Siarey, R.J.; Kline-Burgess, A.; Cho, M.; Balbo, A.; Best, T.K.; Harashima, C.; Klann, E.; Galdzicki, Z. Altered signaling pathways underlying abnormal hippocampal synaptic plasticity in the Ts65Dn mouse model of Down syndrome. J. Neurochem. 2006, 98, 1266–1277. [Google Scholar] [CrossRef]
Figure 1. Functional network enrichment in the HD group.
Antioxidants 09 01112 g001
Figure 2. Functional network enrichment in the DS group.
Antioxidants 09 01112 g002
Figure 3. (A) Pie chart representing all the proteins grouped according to their function. (B) Representative graph showing the prevalence distribution of the listed functions in the HD and DS groups, respectively. (C) Pie chart representing all the functions reported in the work and the related alterations among the groups of analysis (UNIQUE HD, UNIQUE DS, >HD, and >DS).
Antioxidants 09 01112 g003
Figure 4. Human PBMCs from DS individuals show the induction of antioxidant responses to counteract OS. Slot blot analysis of total protein carbonylation. Panel (A) (left hand side): Slot blot of representative samples from healthy donors (HD) and Down syndrome (DS) groups. A triplicate of eight samples per group is showed. Panel (B) (right hand side): Densitometric analysis of total protein carbonylation in healthy donors (HD) and Down syndrome (DS) groups. (C) Representative Western blot showing SOD-1, PRDX6, and GELSOLIN in PBMCs from DS and HD. (D) Quantification of panel C showing levels of total GELSOLIN. (E) Quantification of panel C showing levels of PRDX6 (E) Quantification of panel C showing levels of total GELSOLIN. (F) Quantification of panel (C) showing levels of SOD1. Densitometric values shown in the bar graph are the mean of six samples for each group normalized for total load and are given as percentage of HD, set as 100%. Statistical significance was determined using Student t-test analysis (* p < 0.05, ** p < 0.01, *** p < 0.001).
Antioxidants 09 01112 g004
Figure 5. Human PBMCs from DS individuals show selective activation of the unfolded protein response. (A) Representative Western blot showing ATF6, p-IRE1, and IRE1 in PBMCs from DS and HD. (B) Quantification of panel (A) showing levels of total ATF6. (C) Quantification of panel (A) showing levels of pIRE1/IRE1 ratio. Densitometric values shown in the bar graph are the mean of eight samples for each group normalized for total load and are given as percentage of HD, set as 100%. Statistical significance was determined using Student t-test analysis (* p < 0.05).
Antioxidants 09 01112 g005
Table 1. Clinical characteristics of Down syndrome (DS) and healthy donors (HD) individuals.
SubjectDiagnosisAgeSexBMICentileComorbidities
HD 1Healthy donors2Fn/a96Asthma
HD 2Healthy donors14F19.854Rash
HD 3Healthy donors9F17.668Abdominal pain
HD 4Healthy donors4M15.754Kawasaki disease
HD 5Healthy donors8F2093Headache
HD 6Healthy donors3M16.249Kawasaki disease
HD 7Healthy donors12M19.654Abdominal pain
HD 8Healthy donors7F2092Headache
DS 1Down Syndrome6M14.99Behavioral trouble
DS 2Down Syndrome4M20.640CAV surgery, behavioral trouble
DS 3Down Syndrome5M17.564sleep apnea
DS 4Down Syndrome17F24.535leukopenia
DS 5Down Syndrome1F21.948hypothyroidism
DS 6Down Syndrome1Fn/a0prematurity
DS 7Down Syndrome1Fn/a31FPIES
DS 8Down Syndrome3F16.135FPIES
Table 2. Differentially expressed proteins in DS and HD groups identified using HD-MSE label-free mass spectrometry analysis clustered in the related molecular networks. (1) Experimental group in which proteins are mainly expressed; (2) protein name; (3) accession number according to UniProtKB/Swiss-Prot Protein Knowledgebase; (4) protein found highly represented (defined as unique) in DS or HD PBMCs protein extracts; (5) ratio of expression between DS and HS according to quantitative expression analysis by PLGS 3.03.
(1) Group(2) Protein Description(3) Uni Prot Accession Number(4) Highly Expressed(5) DS/HD Ratio
Metabolism
Unique HDL-lactate dehydrogenase A, B, CP00338; P07195; P07864
Malate dehydrogenase_cytoplasmicP40925HD
Malate dehydrogenase_mitochondrialP40926HD
ATP synthase subunit alpha_mitochondrialP25705HD
TransaldolaseP37837HD
TransketolaseP29401HD
Triosephosphate isomeraseP60174HD
Antizyme inhibitor 1O14977HD
Mitochondrial ornithine transporter 2Q9BXI2HD
Over-expressed in HDN/AN/AN/AN/A
Unique DSN/AN/AN/AN/A
Over-expressed in DSGlyceraldehyde-3-phosphate dehydrogenaseP04406 5.2
Fructose-bisphosphate aldolase A, CP04075; P09972 3.17
Phosphoglycerate kinase 1, 2P00558; P07205 1.86
Trafficking
Unique HDRab1 (A, B, C)P62820; Q9H0U4; Q92928HD
Rab3 (A, B, C, D)P20336; P20337; Q96E17; O95716 HD
Rab4 (A, B)P20338; P61018HD
Rab6 (A, B)P20340; Q9NRW1HD
Rab8 (A, B)P61006; Q92930HD
Rab10P61026HD
Rab12Q6IQ22HD
Rab13P51153HD
Rab14P61106HD
Rab15P59190HD
Rab30Q15771HD
Rab33 (B)Q9H082HD
Rab35Q15286HD
Rab37Q96AX2HD
Rab39 (A, B)Q14964; Q96DA2HD
Rab43Q86YS6HD
PeripherinP41219HD
Chloride intracellular channel protein 1O00299HD
AarF domain-containing protein kinase 1Q86TW2HD
Over-expressed in HDRho GDP-dissociation inhibitor 1P52565 0.12
Protein bicaudal D homolog 1Q96G01 0.15
Membrane magnesium transporterQ8N4V1 0.3
Unique DSN/AN/AN/A
Over-expressed in DSN/AN/A N/A
DNA Structure
Unique HDHeterogeneous nuclear ribonucleoprotein A1 P09651HD
Heterogeneous nuclear ribonucleoprotein A1-like 2 Q32P51HD
Heterogeneous nuclear ribonucleoprotein C-like 1, 2, 3, 4O6081; B2RXH8; B7ZW38; P0DMR1HD
Heterogeneous nuclear ribonucleoproteins C1/C2 P07910HD
TATA box-binding protein-associated factor RNA polymerase I subunit B Q53T94HD
Over-expressed in HDPutative male-specific lethal-3 protein-like 2P0C860 0.56
Unique DSHistone H1.1,2, 3,4,5Q02539; P16403; P16402; P10412; P16401DS
Histone H2B type 1-B, C, D, H, K, L, M, N, OP33778; P62807; P58876; Q93079; O60814; Q99880; Q99879; Q99877; P23527DS
Histone H2B type 2- E, FQ16778; Q5QNW6DS
Histone H2B type 3Q8N257DS
Histone H3.1,2,3Q16695; Q71DI3; P84243DS
Over-expressed in DSShieldin complex subunit 3Q6ZNX1 1.78
Ribonuclease H2 subunit CQ8TDP1 2.4
Histone H4P62805 2.51
Stress Response
Unique HDPoliubiquitin B, CP0CG47; P0CG48HD
Heat shock 70 kDa protein 1A, 1B P0DMV8; P0DMV9HD
Heat shock 70 kDa protein 1, 2P34931; P54652HD
Heat shock protein HSP 90-alpha, beta P07900; P08238HD
Ubiquitin-40S ribosomal protein S27a P62979HD
CalreticulinP27797HD
Parkinson disease protein 7Q99497HD
Glutaredoxin-like protein C5orf63 A6NC05HD
Over-expressed in HDT-complex protein 1 subunit beta P78371 0.3
Protein S100-A8, A9P05109; P06702 0.26
Peptidyl-prolyl cis-trans isomerase A P62937 0.4
Unique DSNitric oxide synthase-interacting proteinQ9Y314DS
Glutathione S-transferaseP09211DS
Over-expressed in DSCyclic AMP-dependent transcription factor ATF-6 alpha and beta P18850; Q99941 2.2
DNA damage-inducible transcript 3 protein (CHOP)P35638 3.4
Endoplasmic reticulum chaperone BiP (GRP78)P11021 2.07
ERO1-like protein alphaQ96HE7 3.04
Protein disulfide-isomerase (PDI)P07237 8.7
Peroxiredoxin-1, 2, 4, 6Q06830; P32119; Q13162; P30041 2.88; 3.7; 4.2; 4.8
Endoplasmin P14625 2.4
Superoxide dismutase [Cu-Zn]P00441 6.7
Extracellular superoxide dismutase [Cu-Zn]P08294 5.4
Cytoskeleton Network
Unique HDGelsolin P06396HD
Annexin A6 P08133HD
Calmodulin-1, 2, 3P0DP23; P0DP24; P0DP25HD
Protocadherin gammaQ9Y5G3HD
Neurofilament medium polypeptide P07197HD
Plastin-2 P13796HD
Adenylyl cyclase-associated protein 1 Q01518HD
Over-expressed in HDPOTE ankyrin domain family member F A5A3E0 0.6
Radixin P35241; P15311 0.7
Na(+)/H(+) exchange regulatory cofactor NHE-RF2Q15599 0.13
Vimentin P08670 0.8
Unique DSActin-related protein 2/3 complex subunit 1, 4, 5O15143; P59998; O15511DS
Over-expressed in DSCofilin-1, 2P23528; Q9Y281 1.67; 1.7
Tropomyosin alpha-1,3, 4 chainP09493; P06753; P67936, 2.21; 2.18; 2.46
Tropomyosin beta chainP07951 2.46
TUBA4B Putative tubulin-like protein alpha-4B Iso 1Q9H853 2.43
TUBA8 Tubulin alpha-8 chain Iso 2Q9NY65 5.13
TUBB1 Tubulin beta-1 chain Iso 1Q9H4B7 4.28
TUBB2B Tubulin beta-2B chain Iso 1Q9BVA1 3.8
Myosin-9P35579 7.29
EzrinP15311 2.8
Profilin-1P07737 7.4
Signaling
Unique HDGuanine nucleotide-binding protein G(i) subunit alpha-2 P04899HD
Over-expressed in HDPleckstrin P08567 0.53
Platelet factor 4 P02776; P10720 0.24
Platelet glycoprotein Ib alpha chain P07359 0.22
Platelet glycoprotein 4 P16671 0.26
Embryonal Fyn-associated substrateO43281 0.32
SH3 domain-binding glutamic acid-rich-like protein Q9H299 0.2
Gap junction beta-4 proteinQ9NTQ9 0.4
Casein kinase II subunit alphaP19784 0.37
Unique DSSHC SH2 domain-binding protein 1Q8NEM2DS
Protein kinase C gamma P05129DS
Overexpressed in DSGPR107Q5VW38 8.4
Other Functions
Unique HDWD repeat-containing protein 1, 54O75083; Q9H977HD
Cystatin-B P04080HD
Putative elongation factor 1-alpha-like 3 Q5VTE0HD
Coagulation factor XIII A chain P00488HD
Coronin-1A P31146HD
Over-expressed in HDHemoglobin subunit alpha, zeta P69905; P02008 0.64; 0.45
Protein tweety homolog 2 Q9BSA4 0.4
Elongation factor 1-alpha 1 P68104; Q5VTE0; Q05639 0.09
Eukaryotic initiation factor 4A-IIQ14240 0.2
Lysozyme C P61626 0.39
Shugoshin 2 Q562F6 0.46
Fermitin family homolog 3Q86UX7; Q13905; Q9UBZ9 0.34; 0.46; 0.6
39S ribosomal protein L45_ mitochondrialQ9BRJ2 0.14
Unique DSN/AN/AN/A
Overexpressed in DSN-alpha-acetyltransferase Q6N069 2.21
Table 3. Highlights of the five most significant reactome pathways involving proteins overexpressed in the HD group.
Reactome Pathways in HD
PathwayDescriptionCount in Gene SetFalse Discovery Rate
HSA-8873719RAB geranylgeranylation23 of 633.35 × 10⁻³¹
HSA-9007101Rab regulation of trafficking16 of 1182.57 × 10−15
HSA-8876198RAB GEFs exchange GTP for GDP on RABs14 of 862.18 × 10⁻¹⁴
HSA-5653656Vesicle-mediated transport26 of 646.66 × 10⁻¹⁴
HSA-199991Membrane Trafficking23 of 6121.27 × 10−11
Table 4. Highlights of the 5 most significant reactome pathways involving proteins overexpressed in the DS group.
Reactome Pathways in DS
PathwayDescriptionCount in Gene SetFalse Discovery Rate
HSA-2262752Cellular responses to stress27 of 3841.17 × 10−27
HSA-2559586Cellular responses to external stimuli27 of 4595.50 × 10−26
HSA-2559586DNA Damage Stress Induced Senescence15 of 613.98 × 10⁻²²
HSA-2559583Cellular Senescence15 of 1611.70 × 10−16
HSA-195258RHO GTPase effectors17 of 2733.41 × 10−16
Publisher’s Note: MDPI stays neutral with regard to jurisdictional claims in published maps and institutional affiliations.

