Abstract
Meat consumption plays a critical role in the development of several types of cancer. Hemin, a metabolite of myoglobin produced after meat intake, has been demonstrated to be involved in the cancer initiation phase. Macrophages are key components of the innate immunity, which, upon activation, can prevent cancer development by eliminating neoplastic cells. Metabolic reprogramming, characterized by high glycolysis and low oxidative phosphorylation, is critical for macrophage activation. 3,4-dihydroxyphenylacetic acid (3,4DHPAA) and 4-hydroxyphenylacetic acid (4HPAA), both microbiota-derived metabolites of flavonoids, have not been extensively studied although they exert antioxidant properties. The aim of this study was to determine the effect of hemin on the anticancer properties of macrophages and the role of 3,4DHPAA and 4HPAA in metabolic reprogramming and activation of macrophages leading to the elimination of cancer cells. The results showed that hemin inhibited glycolysis, glycolytic, and pentose phosphate pathway (PPP) enzyme activities and hypoxia-inducible factor-1 alpha (HIF-1α) stabilization, which interferes with macrophage activation (evidenced by decreased interferon-γ-inducible protein 10 (IP-10) release) and their ability to eliminate cancer cells (via cytotoxic mediators and phagocytosis). Hemin also reduced the mitochondrial membrane potential (MMP) and mitochondrial mass in macrophages. 3,4DHPAA and 4HPAA, by stimulating glycolysis and PPP, prevented the impairment of the macrophage anticancer activity induced by hemin. In conclusion, 3,4HPAA and 4HPAA administration could represent a promising strategy for preventing the reduction of macrophage activation induced by hemin.
1. Introduction
According to the latest data provided by the World Health Organization, cancer is the second leading cause of death globally, and is responsible for an estimated 9.6 million deaths in 2018 [1]. Globally, about one in six deaths are due to cancer [2]. Macrophages are innate immune cells that have a pivotal role in cancer prevention, as upon activation, they can identify emerging cancer cells and eliminate them [3]. Macrophages kill cancer cells through phagocytosis and the production of cytotoxic soluble factors, such as cytokines and chemokines [4,5]. Metabolic reprogramming, characterized by high glycolysis and low oxidative phosphorylation (OXPHOS), is critical for macrophage activation towards the M1 phenotype that is characterized by proinflammatory and anticancer properties [6].
In 2009, WHO indicated that almost one-third of cancer-related deaths are associated with the five leading behavioral and dietary risks, namely high body mass index, diet, lack of physical activity, tobacco, and alcohol use. Red meat and processed meat were classified as “probably carcinogenic to humans” and as “carcinogenic to humans”, respectively, by The Agency for Research on Cancer (IARC) in 2015 [7]. In the development of several types of cancer, such as colorectal (CRC), lung, and breast cancers, the role of a high percentage of meat in diets has been implicated [8]. For example, the risk of CRC increases by 17% with a daily intake of 100 g of red meat [9]. Myoglobin (a protein containing a heme group) from red meat can be oxidized into metmyoglobin under acidic conditions in the gastrointestinal tract, causing the dissociation of hemin from metmyoglobin [10,11,12]. Hemin, a covalently modified porphyrin formed from heme, contains a ferric iron (Fe3+) ion with a coordinating chloride ligand (Scheme 1) [13]. Hemin has been demonstrated to be involved in CRC initiation, promoting colon carcinogenesis through mechanisms involving oxidative damage [14,15,16]. We recently found that hemin, in addition to promoting malignant transformation in normal colon epithelial cells by inducing intracellular and mitochondrial reactive oxygen species (ROS) production and DNA oxidative damage, can also cause metabolic reprogramming by decreasing MMP and the activity of complexes I and II of the electron transport chain [17]. In addition, hemin has also been shown to reduce MMP in bovine aortic endothelial cells (BAECs), which was associated with a decrease in basal and maximal mitochondrial respiration [18]. Although it is known that metabolic reprogramming in macrophages is critical for their activation and that hemin can induce cellular metabolic changes, the role of hemin in macrophage activation towards an anticancer phenotype has not yet been addressed.
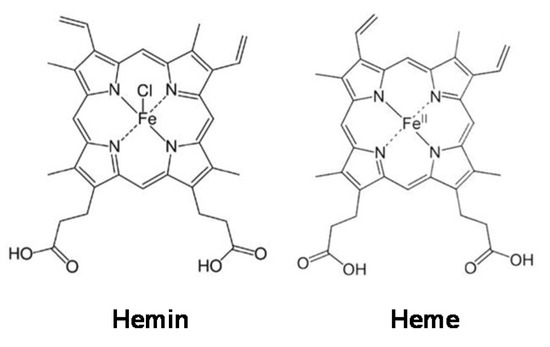
Scheme 1.
Hemin and heme structures.
There is a negative correlation between diets containing abundant vegetables, fruits, and grains, and the risk of cancer [19]. The flavonol quercetin (QUE) is the most ubiquitous polyphenol in fruits and vegetables, specifically abundant in apples and onions [20]. Kaempferol, another member of the flavonols, is abundantly found in tea, broccoli, apples, strawberries, and beans [21]. Proanthocyanidins, oligomeric compounds formed from catechin and epicatechin molecules, account for a major fraction of the total flavonoids ingested in Western diets [22]. These polyphenols exert their anticancer effects though mechanisms related to apoptosis, cell cycle arrest, regulation of signaling pathways, and antioxidant response [23,24,25]. Though many healthy systemic effects in humans have been attributed to these flavonoids, they are barely absorbable in the gastrointestinal tract and as a result they accumulate in the lumen [26,27].
Flavonoids can be metabolized by the microbiota in the colon; the metabolite produced can be absorbed and thus exert biological effects in the organism, such as antimicrobial, anti-inflammatory, and antioxidant activities [28]. The major microbial metabolite of QUE and its glycosylated derivatives is 3,4-dihydroxyphenylacetic acid (3,4DHPAA) [29,30,31,32,33,34,35,36], which also has potent antioxidant properties. It has been shown that this metabolite has the highest free radical scavenging activity among several flavonoid metabolites tested in vitro, and that it may reduce plasma lipid peroxidation in vivo [37,38]. Recently, we found that 3,4DHPAA is more effective than QUE in preventing hemin-induced malignant transformation and metabolic reprogramming in normal colon epithelia cells [17]. 4-hydroxyphenylacetic acid (4HPAA) is the major microbiota-derived metabolite of proanthocyanidins and kaempferol [39,40], which possesses antioxidant [41], anxiolytic [42], and antiplatelet properties [43]. These metabolites are detected in human plasma and urine after the ingestion of a standard diet [44] or flavonoid-rich foodstuffs [45,46], as well as after the administration of flavonoid supplements [47]. Although 3,4DHPAA and 4HPPA are abundantly produced in the colon, and can be absorbed, their role in cancer prevention remains unknown.
The present study aimed to determine the effect of hemin on the anticancer properties of macrophages. The role of 3,4DHPAA and 4HPAA in metabolic reprogramming and activation of macrophages that leads to the elimination of cancer cells was also investigated. Based on the capacity of 3,4DHPAA to interfere with cell energy metabolism [17], we postulated that the beneficial effects of 3,4DHPAA and 4HPAA against the macrophage inactivation induced by hemin are related to their ability to stimulate glycolysis and the pentose phosphate pathway (PPP).
2. Materials and Methods
2.1. Culturing Conditions and Assay Format
THP-1 (ATCC TIB202) cells, an in vitro model extensively used to study human monocytes and macrophages [48], were maintained in RPMI media (Cat# 11875093, Life Technologies, Carlsbad, CA, USA) supplemented with 10% heat-inactivated fetal bovine serum (FBS, Cat# 10437028, ThermoFisher Scientific, Waltham, MA, USA) at 37 °C in a humidified incubator with 5% CO2. The cells were subcultured every 2 to 3 days in order to maintain a cell density between 2 × 10⁵ and 1 × 10⁶ cells/mL. THP-1 cells were seeded in assay plates in RMPI plus 10% FBS medium containing 25 ng of PMA (Cat# P8139, Sigma-Aldrich, St. Louis, MO, USA) per mL in order to induce differentiation of the THP-1 cells. After 24 h of cell plating, macrophages were activated with 5 pg/mL LPS (Cat# L8274, Sigma-Aldrich) and 10 ng/mL INFγ (Cat# SRP3058, Merck, Kenilworth, NJ, USA), and treated with 10 μM hemin (Cat# 51280, Sigma-Aldrich), 10 μM 3,4DHPAA (Cat# 850217, Sigma-Aldrich), or 10 μM 4HPAA (Cat# H50004, Sigma-Aldrich) for 72 h (Scheme 2).
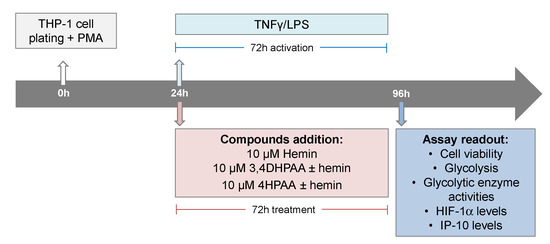
Scheme 2.
Assay format and compound addition format.
2.2. A375 Cells Overexpressing Red Fluorescence Protein
The melanoma cells A375 cells (ATCC® CRL-1619™) were used in this study for the epidemiological relevance of this type of cancer, as melanoma accounts for the majority of skin cancer deaths and its incidence has risen faster than almost any other cancer [49]. A375 cells were infected with purified lentiviral particles for red fluorescence protein and expanded as we previously described [50].
2.3. Macrophage Differentiation Biomarkers
THP-1 cells were seeded at 9000 or 2500 cells/well/50 µL in a 384-well plate (CellCarrier Ultra, Cat # 6057300, Perkin Elmer, Baesweiler, Germany) in the absence of PMA. Then, 24 h or 96 h after seeding, cells were fixed in 4% w/v paraformaldehyde (PFA, Cat# 28908, ThermoFisher) solution for 15 min and washed 3× with PBS (Cat# 14190250, ThermoFisher). In addition, THP-1 cells were seeded at 12,500 cell cells/well/50 µL in a 384-well plate (CellCarrier Ultra), in the presence of 25 ng/mL PMA. After 24, 48, 72, and 96 h, cells were fixed and washed. Fixed cells were blocked for 2 h at room temperature with a buffer containing 2% w/v BSA and 0.2% w/v Triton-X 100, then incubated overnight at 4 °C with the primary antibodies (Abs): Anti-CD14 [1H5D8] (1/100, mouse mAb, Cat# ab181470, Abcam, Cambridge, UK) and Anti-CD68 [KP1] (1/100, mouse mAb, Cat# ab955, Abcam) prepared in PBS. After washing 3× with PBS, cells were incubated for 2 h at room temperature with Hoechst 33342 (10 μM, Cat# H1399, Life Technologies) to identify the nucleus; HCS CellMask™ Deep Red Stain (0.2 μg/mL, Cat# H32721, Molecular Probe, Eugene, OR, USA) to identify cytosol and the secondary Ab Alexa Fluor 488 goat anti-mouse IgG (H+L) (1/400, Cat# A11001, ThermoFisher), all prepared in PBS. Cells were washed 3× in PBS and imaged on the Opera Phenix™ High Content Screening System (Perkin Elmer) using a 20× water objective, in which nine fields were imaged per well. Hoechst was detected at 405 nm; Alexa Fluor 488 Ab at 488 nm and HCS CellMask™ Deep Red Stain detected at 655 nm. Images were analyzed using Harmony software (Perkin Elmer) and fluorescence of Alexa Fluor 488 was quantified in the nucleus and cytosol areas.
2.4. Cell Viability Inhibition
THP-1 cells were seeded at 12,500 cells/well/50 µL in a 384-well plate (Greiner 384 Plates Black, Cat# 781090, Monroe, NC, USA), in the absence or presence of 25 ng/mL PMA. A375 cells expressing red fluorescence protein were seeded at 2500 cells/well/50 µL in a 384-well plate (Greiner 384 Plates Black). After 24 h, THP-1 and A375 cells were treated with hemin, 3,4DHPAA, and 4HPAA (0.05–50 µM) for 72 h. Cells were incubated for 6 h with 60 µM resazurin (Cat# 14322, Cayman, Ann Arbor, MI, USA) and 10 μM Hoechst 33342 to identify the nucleus. The ability of live cells to reduce resazurin dye was assessed and calculated as we previously described [50].
2.5. Immunofluorescence against HIF-1α
Cells were seeded at 12,500 cells/well/50 µL in a 384-well plate (CellCarrier Ultra), in the presence of 25 ng/mL PMA. After 24 h, cells were treated with hemin, 3,4DHPAA, or 4HPAA with or without 5 pg/mL LPS and 10 ng/mL INFγ (Scheme 2). After 72 h, cells were fixed in 4% w/v PFA solution for 15 min and washed 3× with PBS. Cells were blocked for 2 h, then incubated overnight at 4 °C with anti-HIF-1α (1/200, rabbit pAb, Cat# NB100-134, Novus Biologicals, Littleton, CO, USA) prepared in PBS. After washing 3× with PBS, cells were incubated for 2 h at room temperature with 10 μM Hoechst 33342, 0.2 μg/mL HCS CellMask™ Deep Red Stain, and Alexa Fluor 488 goat anti-rabbit IgG (H+L) (1/400, Cat# A11008, ThermoFisher), all prepared in PBS. Cells were washed 3× in PBS and imaged on the Opera Phenix™ High Content Screening System using a 20× water objective, in which nine fields were imaged per well. Images were analyzed using Harmony software and fluorescence of Alexa Fluor 488 was quantified in the nucleus and cytosol areas [50].
2.6. Metabolic Enzyme Activities
The activities of hexokinase, pyruvate kinase, and glucose-6-phosphate dehydrogenase were measured through continuous spectrophotometric assays as previously described [50,51] and specified in Supplementary Materials Table S1.
2.7. Extracellular Acidification Rates
Extracellular acidification rates (ECARs) were measured using a Glycolysis kit from Abcam (ab197244). Briefly, cells were seeded at 12,500 cells/well/50 µL in a 384-well plate (Greiner 384 Plates Black), in the presence of 25 ng/mL PMA. After 24 h, cells were treated with hemin, 3,4DHPAA, or 4HPAA with or without 5 pg/mL LPS and 10 ng/mL INFγ (Scheme 2). After 72 h, cells were purged from CO2, by incubating cells at 37 °C in a humidified incubator for 2 h prior to the glycolysis assay. The respiratory buffer (containing 1 mM potassium phosphate, 20 mM glucose, 70 mM NaCl, 50 mM KCl, 0.8 mM MgSO4, 2.4 mM CaCl2) and the Glycolysis Assay Reagent were then added to the cells. Fluorescence at λ excitation 340 nm; λ emission 615 nm was recorded in time at 37 °C, using a Microplate Reader (EnSight, Perkin Elmer). Rates of extracellular acidification are calculated from changes in fluorescence signal over time (120 min). Glycolytic pathway inhibitors, such as 100 mM 2-deoxyglucose (an inhibitor of hexokinase and glucose-6-phosphate isomerase [52], Cat# D8375, Sigma-Aldrich) and 100 mM oxamate (a lactate dehydrogenase (LDH) inhibitor [53], Cat# O2751, Sigma-Aldrich), were added as a control to estimate the glycolysis-dependent ECAR.
2.8. IP-10 Levels
Cells were seeded at 50,000 cells/well/200 µL in a 96-well plate (Greiner 96 Plates Clear, Cat# 655180), in the presence of 25 ng/mL PMA. After 24 h, cells were treated with hemin, 3,4DHPAA, or 4HPAA with or without 5 pg/mL LPS and 10 ng/mL INFγ (Scheme 2). After 72 h, media was collected and the IP-10 ELISA kit from Abcam (ab83700) was performed, according to the manufacturer’s instructions. Briefly, samples and IP-10 standards were added to the coated ELISA plate and incubated for 2 h at room temperature. After washing 3× with washing buffer (provided by the kit), the plate was incubated with biotinylated anti-IP-10 for 1 h at room temperature. Wells were washed 3×, and subsequently, they were incubated with Streptavidin-HRP solution for 30 min at room temperature. After washing 3×, plate was incubated with Chromogen TMB substrate for 20 min at room temperature. After adding 100 µL of Stop Reagent (provided by the kit) per well, optical density was measured at 450 nm. Nuclei were stained with 10 μM Hoechst 33,342 for 1 h, imaged on the Opera Phenix™ High Content Screening System at 405 nm (20× water objective), and quantified using Harmony. IP-10 levels were normalized to cell number.
2.9. Mitochondrial Parameters
Cells were seeded at 12,500 cells/well/50 µL in a 384-well plate (CellCarrier Ultra), in the presence of 25 ng/mL PMA. After 24 h, cells were treated with hemin, 3,4DHPAA, or 4HPAA with or without 5 pg/mL LPS and 10 ng/mL INFγ (Scheme 2). After 72 h, cells were incubated for 1 h with 800 nM MitoTracker Green (Cat# M7514, ThermoFisher) and 10 μM Hoechst 33342 to evaluate mitochondrial mass; or for 30 min with 250 nM tetramethylrhodamine (TMRE, Cat# T669, ThermoFisher) and 10 μM Hoechst 33342 to evaluate MMP. The fluorescent intensity of Hoechst 33342, MitoTracker Green, and TMRE was detected at 405, 488, and 561 nm, respectively. One µM carbonyl cyanide-4-phenylhydrazone (FCCP, Cat# C2920, Sigma-Aldrich) was used as a control to reduce MMP. Cells were washed 3× in PBS and imaged on the Opera Phenix™ High Content Screening System using a 20× water objective, in which nine fields were imaged per well. Images were analyzed using Harmony software and results were expressed as mean intensity/well.
2.10. Cytotoxic Effect of Macrophage
A375 cells expressing red fluorescence protein were seeded at a density of 2000 cells/well/50 µL in a 384-well plate (CellCarrier Ultra). After 24 h, THP-1 cells were seeded at a density of 12,500 cells/well/50 µL in the presence of 25 ng/mL PMA, on top of the cell plate containing the A375 cells. After 24 h, cells were treated with hemin, 3,4DHPAA, or 4HPAA with or without 5 pg/mL LPS and 10 ng/mL INFγ (Scheme 3). After 72 h, cells were incubated for 1 h with Hoechst 33342 and imaged on the Opera Phenix™ High Content Screening System using a 20× water objective, in which nine fields were imaged per well. Nuclei were identified through Hoechst staining at 405 nm and A375 cells at 655 nm. Engulfed A375 cells were identified as disaggregated cells at 655 nm. Images were analyzed using Harmony software.
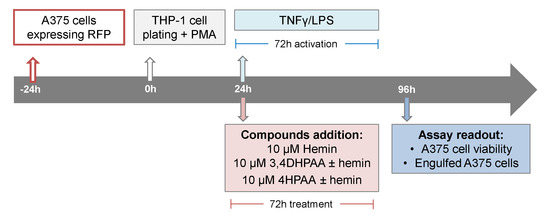
Scheme 3.
Cytotoxic assays format and compound addition format.
2.11. Statistical Analysis
Data were analyzed by two-way ANOVA followed by Bonferroni’s multiple comparison test, using GraphPad Prism 7 (La Jolla, CA, USA). Unless indicated otherwise, the experiments were performed using three independent culture preparations and in triplicate or quadruplicate. Values are expressed as mean ± SEM. Values with different superscript letters (a, b, c, d, and f) indicate significant differences (p < 0.05) between groups. For all bars with the same letter, the difference between the means is not statistically significant.
3. Results
3.1. Monocyte Differentiation into Macrophages
Human THP-1 monocytes were differentiated into macrophages by incubation with 25 ng of phorbol 12-myristate 13-acetate (PMA)/mL for 24, 48, 72, and 96 h. The presence of the recognized macrophage marker CD68 (cluster of differentiation 68) confirmed the differentiation of monocytes into macrophages [54]. The CD68 signal was already maximal after 24 h incubation with PMA (Figure 1A) and did not increase further at 96 h. The expression of CD14, which decreases with macrophage differentiation [54], was also studied and confirmed the differentiation (Figure 1B). PMA (at the tested concentration and incubation times) was not cytotoxic to macrophages (data not shown).
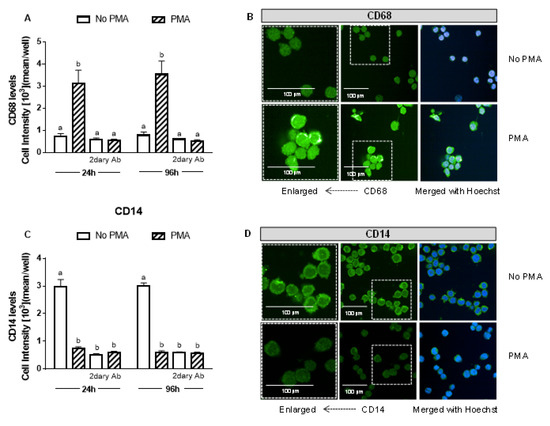
Figure 1.
PMA induces monocyte differentiation into macrophages. After 24 and 96 h of differentiation with 25 ng/mL PMA (A,B), CD68 and (C,D) CD14 levels were measured and compared to the non-treated THP-1 cells. CD68 and CD14 levels were detected by immunofluorescence using a confocal imaging system (Opera Phenix, Perkin Elmer). Images were acquired with a 20× water objective. Staining intensity levels were analyzed using Harmony software (Perkin Elmer). Nuclei and cytosol were identified through Hoechst (at 405 nm) and CellMask (at 655 nm) staining, respectively. Scale is shown as 100 μm. White dotted frames indicate the section of the image that was enlarged. CD14 (cluster of differentiation 14); Values with different superscript letters (a and b) indicate significant differences (p < 0.05) between groups. For all bars with the same letter, the difference between the means is not statistically significant. CD68, cluster of differentiation 68; PMA, phorbol 12-myristate 13-acetate; 2dary Ab, secondary antibody staining.
3.2. Hemin Prevented the Increase in IP-10 Release Induced by LPS and INFγ
The incubation of macrophages with 5 pg/mL lipopolysaccharide (LPS) and 10 ng/mL interferon gamma (INFγ) for 24 or 72 h activated the macrophages, evidenced by a 100-fold increase in interferon-γ-inducible protein 10 (IP-10) release after 24 or 72 h incubation (Figure 2A,B). Further, 10 µM hemin prevented the increase in IP-10 release induced by LPS and INFγ (Figure 2A,B). Hemin was tested at 2.5, 5, 10, and 20 µM, but only from 10 µM concentration did hemin show an effect in IP-10 release. However, the effect induced by 20 µM was not greater than that observed at 10 µM (Figure S1A). Hemin, LPS, and INFγ were not cytotoxic to macrophages (data not shown). Hemin had no effect in unstimulated macrophages.
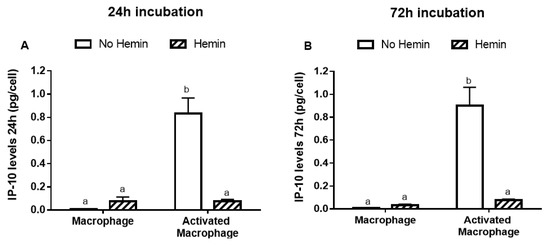
Figure 2.
The IP-10 release from macrophages activated with LPS and INFγ is reduced by hemin. Macrophages were incubated for (A) 24 or (B) 72 h with vehicle in the presence or absence of 10 µM hemin. Macrophages were also activated for (A) 24 or (B) 72 h with vehicle or 5 pg/mL LPS and 10 ng/mL INFγ in the presence or absence of 10 µM hemin. IP-10 levels in the media were quantified at 450 nm and normalized to the cell number. Values with different superscript letters (a and b) indicate significant differences (p < 0.05) between groups. For all bars with the same letter, the difference between the means is not statistically significant. IP-10, interferon-γ-inducible protein 10.
3.3. Hemin Prevented the Increase in Glycolysis, Metabolic Enzyme Activities, and HIF-1α Levels in Activated Macrophages
LPS and INFγ increased the glycolysis by 2.4-fold and the activities of key glycolytic enzymes, hexokinase and pyruvate kinase, by 2.4-fold and 2.3-fold, respectively in macrophages. LPS and INFγ also increased the activity of glucose-6-phosphate dehydrogenase, the enzyme responsible for the first step in the pentose phosphate pathway, by 1.6-fold in macrophages. Hemin prevented the increase in glycolysis and metabolic enzyme activities induced by LPS and INFγ in macrophages (Figure 3).
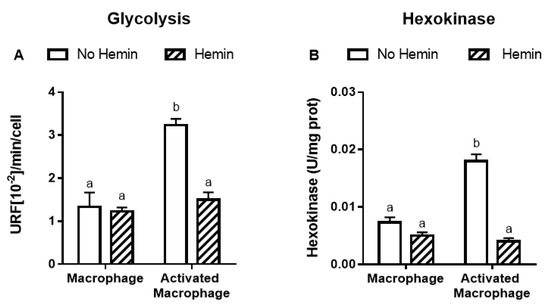
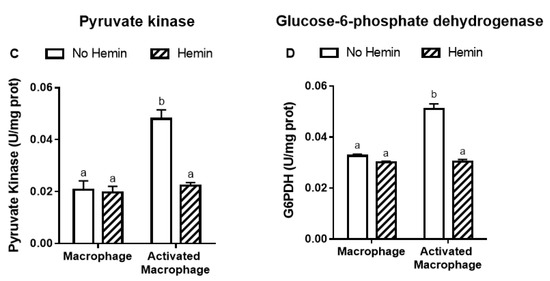
Figure 3.
The increased glycolysis and metabolic enzyme activities of activated macrophages are reduced by hemin. (A) Glycolysis and the activities of (B) hexokinase, (C) pyruvate kinase, and (D) glucose-6-phosphate dehydrogenase were measured in macrophages and activated macrophages, in the absence or presence of 10 µM hemin for 72 h. Activities of the enzymes were expressed as unit/mg protein, calculated as nmol of NADP reduced/min/mg protein for hexokinase and glucose-6-phosphate dehydrogenase, and as nmol of NADH oxidized/min/mg protein for pyruvate kinase. Values with different superscript letters (a and b) indicate significant differences (p < 0.05) between groups. For all bars with the same letter, the difference between the means is not statistically significant. G6PDH, glucose-6-phosphate dehydrogenase.
LPS and INFγ did not alter the levels of HIF-1α in the nucleus; however, they increased HIF-1α levels in the cytosol by 2.5-fold (Figure 4A,B). This increase observed in activated macrophages was abrogated by hemin (Figure 4B).
Figure 4.
The increase of cytosolic HIF-1α levels of activated macrophages is inhibited by hemin. (A) Nuclear and (B) cytosolic HIF-1α levels and (C) representative images of macrophages and activated macrophages, in the absence or presence of 10 µM hemin for 72 h. HIF-1α levels were detected by immunofluorescence using a confocal imaging system (Opera Phenix, Perkin Elmer). Images were acquired with 20× water objective. Staining intensity levels in the nucleus and cytosolic region were obtained using Harmony software (Perkin Elmer). Nucleus and cytosol were identified through Hoechst (at 405 nm) and CellMask (at 655 nm) staining, respectively. Scale is shown as 100 μm. White dotted frames indicate the section of the image that was enlarged. Values with different superscript letters (a and b) indicate significant differences (p < 0.05) between groups. For all bars with the same letter, the difference between the means is not statistically significant. HIF-1α, hypoxia-inducible factor-1 alpha.
3.4. Hemin Reduced Mitochondrial Membrane Potential and Mitochondrial Mass of Macrophages
LPS/INFγ did not alter the MMP and mitochondrial mass in macrophages (Figure 5A,B). Hemin reduced MMP by 32% and 27% in macrophages and in activated macrophages, respectively (Figure 5A). Hemin reduced mitochondrial mass by 43%, regardless of macrophage activation (Figure 5B).
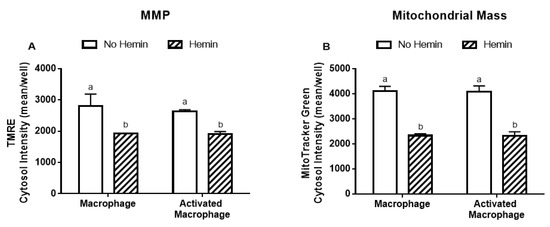
Figure 5.
MMP and mitochondrial mass in macrophages are reduced by hemin. (A) MMP and (B) mitochondrial mass in macrophages and activated macrophages, in the absence or presence of 10 µM hemin for 72 h. MMP and mitochondrial mass were detected by immunofluorescence using a confocal imaging system. Values with different superscript letters (a and b) indicate significant differences (p < 0.05) between groups. For all bars with the same letter, the difference between the means is not statistically significant. MMP, mitochondrial membrane potential; TMRE, tetramethylrhodamine.
3.5. Hemin Prevented the Cytotoxicity of Activated Macrophages and Their Engulfment Capacity
Macrophages did not cause a reduction in A375 melanoma cells; however, upon activation, they reduced the A375 cell number by 56% (Figure 6A). In the presence of hemin, the ability of activated macrophages to kill A375 cells was completely abolished (Figure 6A). In addition, hemin inhibited the ability of macrophages to engulf A375 cells (Figure 6B). Hemin did not exert a cytotoxic effect on A375 cells (Figure 6A).
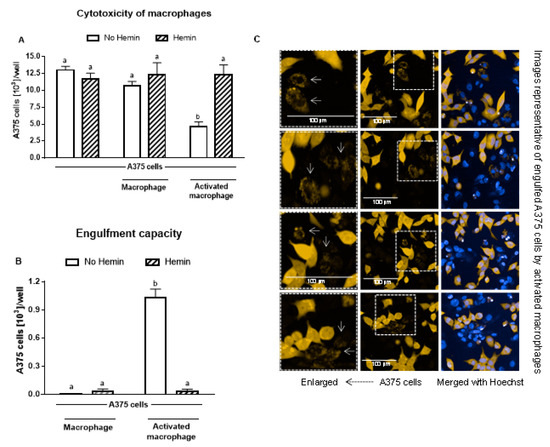
Figure 6.
The increased cytotoxic effect and engulfment capacity of activated macrophages is reduced by hemin. (A) Cytotoxic effect of macrophages and activated macrophages against A375 cells, in the absence or presence of 10 µM hemin for 72 h. A375 cells were counted using Harmony software (Perkin Elmer), by identifying the cells at 655 nm using a confocal imaging system. (B) Engulfment of A375 cells by macrophages and activated macrophages against A375 cells, in the absence or presence of 10 µM hemin for 72 h. (C) Engulfed A375 cells by activated macrophages were identified as disrupted cells at 655 nm using a confocal imaging system. Nuclei of macrophages and A375 cells were identified through Hoechst (at 405 nm). Values with different superscript letters (a and b) indicate significant differences (p < 0.05) between groups. For all bars with the same letter, the difference between the means is not statistically significant.
3.6. 3,4DHPAA and 4HPAA Increased IP-10 Release in Macrophages and Prevented the Hemin-Induced Reduction of IP-10 Release in Activated Macrophages
3,4DHPAA and 4HPAA induced IP-10 release in macrophages by 136-fold and 152-fold, respectively (Figure 7A); however, they did not further increase the IP-10 release of activated macrophages (Figure 7B). In the presence of hemin, the ability of 3,4DHPAA and 4HPAA to induce IP-10 release in macrophages was reduced by 44% and 47%, respectively (Figure 7A). In activated macrophages, 3,4DHPAA and 4HPAA completely prevented the drop in IP-10 release induced by hemin (Figure 7B). The metabolites were also tested at 2.5, 5 and 20 µM, but only from 10 µM concentration were they able to fully prevent the hemin effects (Figure S1B,C). 3,4DHPAA and 4HPAA were not cytotoxic to macrophages (data not shown).
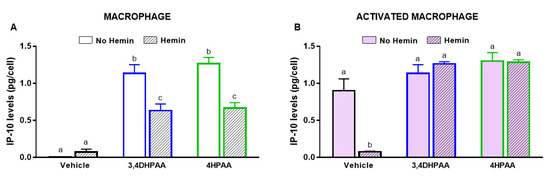
Figure 7.
3,4DHPAA and 4HPAA induce IP-10 release in macrophages and hemin reduces IP-10 release in macrophages. Levels of IP-10 in the media of (A) macrophages and (B) activated macrophages incubated with 10 µM 3,4DHPAA or 10 µM 4HPAA, in the presence or absence of 10 µM hemin for 72 h. Values with different superscript letters (a and b) indicate significant differences (p < 0.05) between groups. For all bars with the same letter, the difference between the means is not statistically significant. 3,4DHPAA, 3,4-dihydroxyphenylacetic acid; 4HPAA, 4-hydroxyphenylacetic acid; IP-10, interferon-γ-inducible protein 10.
3.7. 3,4DHPAA and 4HPAA Increased Glycolysis, Metabolic Enzyme Activities, and HIF-1α Levels in Macrophages and Abrogated Hemin-Induced Alterations in Activated Macrophages
3,4DHPAA and 4HPAA increased glycolysis in macrophages by 2.4-fold and 1.7-fold, respectively, and regardless of the presence of hemin (Figure 8A). In activated macrophages, 3,4DHPAA and 4HPAA completely prevented the decrease in glycolysis induced by hemin (Figure 8B).
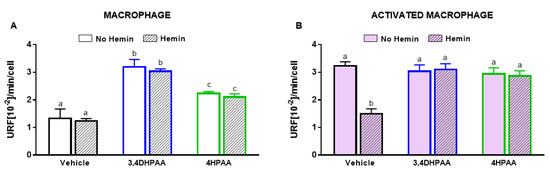
Figure 8.
3,4DHPAA and 4HPAA induce glycolysis in macrophages and hemin reduces glycolysis in activated macrophages. Glycolysis of (A) macrophages and (B) activated macrophages incubated with 10 µM 3,4DHPAA or 10 µM 4HPAA, in the presence or absence of 10 µM hemin for 72 h. Values with different superscript letters (a, b and c) indicate significant differences (p < 0.05) between groups. For all bars with the same letter, the difference between the means is not statistically significant. 3,4DHPAA, 3,4-dihydroxyphenylacetic acid; 4HPAA, 4-hydroxyphenylacetic acid.
3,4DHPAA increased the activities of hexokinase (Figure 9A) and pyruvate kinase (Figure 9C) by 2-fold and G6PDH activity by 1.4-fold in macrophages (Figure 9E). 4HPAA increased hexokinase, pyruvate kinase, and G6PDH activities in macrophages by 2.2-, 2.1-, and 1.6-fold, respectively (Figure 9A,C,E). Hemin did not alter the effects of both metabolites on the activities of hexokinase and G6PDH; however, it reduced the effect of 3,4DHPAA and 4DPAA on pyruvate kinase activity by 23% and 35%, respectively (Figure 9A,C,E). In activated macrophages, 3,4DHPAA and 4HPAA fully prevented a hemin-mediated reduction of the activities of metabolic enzymes (Figure 9B,D,F).
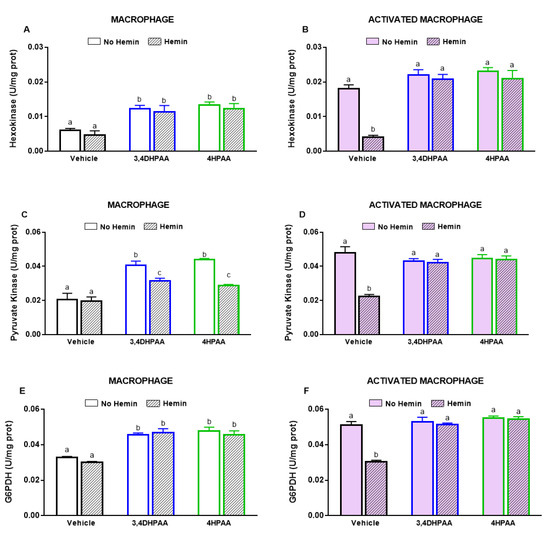
Figure 9.
3,4DHPAA and 4HPAA increase metabolic enzyme activities in macrophages and hemin reduces them in activated macrophages. Hexokinase activity in (A) macrophages and (B) activated macrophages; pyruvate kinase activity in (C) macrophages and (D) activated macrophages; and glucose-6-phosphate dehydrogenase activity in (E) macrophages and (F) activated macrophages. Enzyme activities were measured in macrophages incubated with 10 µM 3,4DHPAA or 10 µM 4HPAA, in the presence or absence of 10 µM hemin for 72 h. Values with different superscript letters (a, b and c) indicate significant differences (p < 0.05) between groups. For all bars with the same letter, the difference between the means is not statistically significant. 3,4DHPAA, 3,4-dihydroxyphenylacetic acid; 4HPAA, 4-hydroxyphenylacetic acid; G6PDH, glucose-6-phosphate dehydrogenase.
3,4DHPAA, 4HPAA, and hemin did not alter the nuclear levels of HIF-1α in both macrophages (Figure 10A) and activated macrophages (Figure 10B). 3,4DHPAA and 4HPAA increased cytosol levels of HIF-1α in macrophages by 2.8-fold and 3.1-fold, respectively (Figure 10C). Hemin did not alter the effect of the metabolites in macrophages (Figure 10C). In activated macrophages, 3,4DHPAA and 4HPAA completely prevented the decrease in cytosolic HIF-1α levels induced by hemin (Figure 10C).
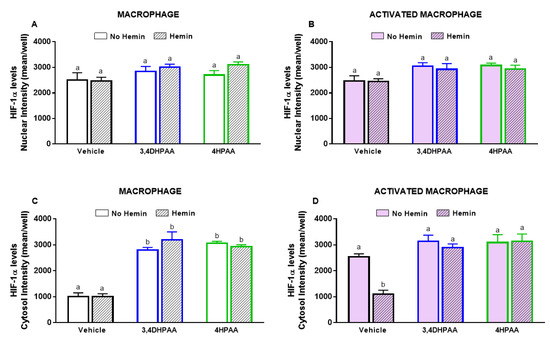
Figure 10.
3,4DHPAA and 4HPAA increase cytosolic HIF-1α levels in macrophages and hemin reduces it in activated macrophages. Nuclear HIF-1α levels in (A) macrophages and (B) activated macrophages; cytosolic HIF-1α levels in macrophages (C) and (D) activated macrophages. HIF-1α levels were measured in macrophages incubated with 10 µM 3,4DHPAA or 10 µM 4HPAA, in the presence or absence of 10 µM hemin for 72 h. HIF-1α levels were detected by immunofluorescence using a confocal imaging system (Opera Phenix, Perkin Elmer) and quantified using Harmony software (Perkin Elmer). Values with different superscript letters (a and b) indicate significant differences (p < 0.05) between groups. For all bars with the same letter, the difference between the means is not statistically significant. 3,4DHPAA, 3,4-dihydroxyphenylacetic acid; 4HPAA, 4-hydroxyphenylacetic acid; HIF-1α, hypoxia-inducible factor-1 alpha.
3.8. 3,4DHPAA and 4HPAA Increased the Ability of Macrophages to Kill A375 Cells and Prevented the Inhibitory Effect of Hemin on Cancer Cell Elimination Capacity in Activated Macrophages
Untreated macrophages did not reduce A375 cell number; however, in the presence of LPS/IFNγ, 3,4DHPAA, or 4HPAA, macrophages were able to reduce A375 cell numbers (Figure 11A,B). The metabolites did not exert direct cytotoxic effects on A375 cells (data not shown). 3,4DHPAA and 4HPAA induced a reduction of the A375 cell number when co-cultured with macrophages by 39% and 27%, respectively (Figure 11A). This effect of the metabolites was not altered by the presence of hemin (Figure 11A). The ability of hemin to reduce the cytotoxicity of activated macrophages on A375 cells was completely prevented by 3,4DHPAA and 4HPAA (Figure 11B). Hemin has no cytotoxic effect in A375 cells (Figure 6A).
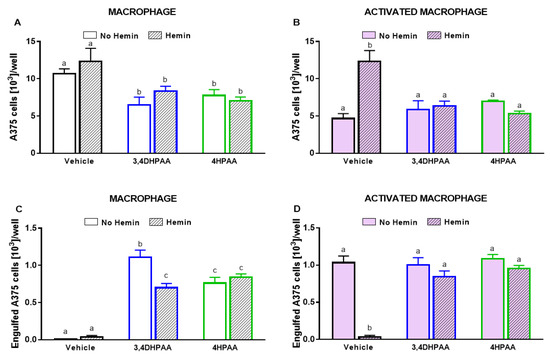
Figure 11.
3,4DHPAA and 4HPAA increased the ability of macrophages to kill cancer cells and hemin reduces this ability in activated macrophages. Cytotoxic effect of (A) macrophages and (B) activated macrophages against A375 cells, incubated with 10 µM 3,4DHPAA or 10 µM 4HPAA, in the presence or absence of 10 µM hemin for 72 h. A375 cells were counted using Harmony software, by identifying the cells at 655 nm using a confocal imaging system. Engulfment of A375 cells by (C) macrophages and (D) activated macrophages, incubated with 10 µM 3,4DHPAA or 10 µM 4HPAA, in the presence or absence of 10 µM hemin for 72 h. Engulfed A375 cells were identified as disrupted cells at 655 nm using a confocal imaging system. Values with different superscript letters (a and b) indicate significant differences (p < 0.05) between groups. For all bars with the same letter, the difference between the means is not statistically significant. 3,4DHPAA, 3,4-dihydroxyphenylacetic acid; 4HPAA, 4-hydroxyphenylacetic acid.
Consistently, macrophages engulfed A375 cells only upon activation with LPS/IFNγ, 3,4DHPAA, or 4HPAA (Figure 11C,D). 3,4DHPAA and 4HPAA increased the ability of macrophages to engulf A375 cells (Figure 11C). Hemin did not interfere with the ability of 4HPAA to increase the engulfment capacity of macrophages (Figure 11C), whereas it reduced this effect of 3,4DHPAA by 37% (Figure 11C). In addition, hemin inhibited the ability of activated macrophages to engulf A375 cells, which was completely prevented by 3,4DHPAA and 4HPAA (Figure 11D).
3.9. 3,4DHPAA and 4HPAA Did Not Alter MMP and Mitochondrial Mass of Macrophages
3,4DHPAA and 4HPAA did not result in alterations in MMP and mitochondrial mass of macrophages (Supplementary Material Figure S2A,C) and activated macrophages (Supplementary Materials Figure S2B,D). 3,4DHPAA and 4HPAA did not prevent the hemin-induced decrease in MMP and mitochondrial mass of macrophages and activated macrophages (Supplementary Materials Figure S2A–D).
4. Discussion
4.1. Hemin Prevented the Increase in IP-10 Release Induced by LPS and INFγ: Role of 3,4DHPAA and 4HPAA
Activated macrophages with proinflammatory and antitumor phenotypes, known as the M1 macrophages, can be induced by LPS and IFNγ [55]. We observed that hemin prevented macrophage activation, evidenced by the inhibition of IP-10 release induced by LPS and INFγ (Figure 2A,B). Consistently, it has been shown that hemin dose-dependently decreases proinflammatory cytokines interleukin (IL)-1β and tumor necrosis factor (TNF)-α levels induced by oxidized low-density lipoprotein (ox-LDL) in a macrophage-derived foam cell model from U937 cell line [56]. In addition, we have shown that 10 µM hemin increases ROS production and promotes DNA oxidative damage in cancer and normal colon cells [17]. Consistently, it has been reported that hemin (25 µM) induces protein oxidation and lipid peroxidation in BAECs [18]. Moreover, we found that 3,4DHPAA was able to prevent the hemin-induced oxidative damage in cancer and normal colon cells [17] and here we found that the metabolites induced the release of the proinflammatory cytokine in macrophages regardless of the presence of hemin (Figure 7A). These findings suggest that the mechanism underlying the ability of the metabolites to prevent hemin-induced macrophage inactivation may rely on their antioxidant and proinflammatory properties. However, more studies are needed to address the effect of hemin and metabolites in the macrophages pro- and antioxidant systems.
4.2. Hemin Prevented the Increase of Glycolysis and Metabolic Enzyme Activities, and the Stabilization of HIF-1α in Activated Macrophages: Effect of 3,4DHPAA and 4HPAA
Activated M1-macrophages are characterized by high glycolysis, and low OXPHOS [57]. Our results showed that LPS and IFNγ, as well as the metabolites, 3,4DHPAA and 4HPAA, increased glycolysis (Figure 3A and Figure 8A,B), and the activities of the glycolytic and PPP enzymes (Figure 3B,D and Figure 9A–F), which is in line with the metabolic adaptations that macrophages undergo upon activation towards proinflammatory and anticancer phenotypes [58,59,60]. Interestingly, downregulation of the glycolytic enzyme, hexokinase, inhibits inflammasomes in macrophages upon LPS activation [60]. Inflammasomes are multi-protein complexes involved in the maturation and secretion of proinflammatory cytokines of macrophages [61]. In addition, genetic deletion or pharmacological inhibition of another key glycolytic enzyme, pyruvate kinase, has been shown to prevent macrophage activation towards the M1 phenotype in response to LPS and IFN-γ [59]. In the same line, when macrophage glucose-6-phosphate dehydrogenase, a PPP enzyme, is chemically inhibited or genetically suppressed, LPS-induced proinflammatory gene expression is attenuated [58]. Considering the pivotal role that these metabolic enzymes have in macrophage activation, it is possible that 3,4DHPAA and 4HPAA promote IP-10 release in macrophages by increasing the activities of hexokinase, pyruvate kinase, and glucose-6-phosphate dehydrogenase (Figure 9A–F). Moreover, the notion that hemin prevents LPS/ IFNγ-induced macrophage activation by inhibiting glycolysis is supported by the fact that 2-deoxyglucose has been shown to decrease the activation of macrophages towards proinflammatory and anticancer phenotypes (Supplementary Materials Figure S3) [62,63]. However, the role of hemin on macrophages acyloxyacyl hydrolase or lipoprotein lipase activities, as an additional mechanism for hemin to affect macrophage response via LPS inactivation, still remains to be explored.
HIF-1α is an essential transcription factor that mediates energy metabolism under hypoxic conditions [64]. It has been shown to increase glycolysis by upregulating the transcription of glycolytic enzymes, such as hexokinase and pyruvate kinase [65,66]. HIF-1α has been reported to also increase PPP by upregulating the transcription of glucose-6-phosphate dehydrogenase [67]. Here, we showed that LPS and IFNγ, as well as the metabolites, 3,4DHPAA and 4HPAA, stabilized HIF-1α in macrophages under normoxia, as evidenced by increased protein levels in the cytosol. Hemin, however, decreased HIF-1α stabilization induced by proinflammatory signals and the metabolites (Figure 4A,B, Figure 10A–D). These findings suggest that 3,4DHPAA and 4HPAA, by preventing hemin-induced destabilization of HIF-1α, promote the expression of glycolytic enzymes, which could contribute to the increase in glycolysis and macrophage activation.
4.3. Hemin Decreased the Cytotoxic Effect and Engulfment Capacity of Activated Macrophages: Effect of 3,4DHPAA and 4HPAA
Inhibition of glycolysis affects many functions of macrophages with proinflammatory and anticancer phenotypes, such as phagocytosis and the secretion of proinflammatory cytokines, events that ultimately contribute to the elimination of cancer cells [68,69,70,71]. Overexpression of the glucose transporter, GLUT1, in RAW264.7 macrophages resulted in an elevated secretion of inflammatory mediators, increased glucose uptake and metabolism, enhanced PPP intermediates, and decreased oxygen consumption rate [68]. All these events were attenuated by the pharmacological inhibition of glycolysis, using 2-deoxyglucose, highlighting the pivotal role of this metabolic pathway in the proinflammatory cytotoxic effect of macrophages [68]. Consistently, it has been found that 2-deoxyglucose inhibits the phagocytosis of immunoglobulin G, or complement-coated sheep erythrocytes by macrophages [69,70]. Here, we found that hemin and 2-deoxyglucose decreased the cytotoxic effect of activated macrophages against cancer cells (Figure 6 and Supplementary Materials Figure S4). In addition, 2-deoxyglucose suppresses glycolysis and reduces phagocytosis in elicited macrophages (with Brewer thioglycollate broth injection) [71]. We suggest, therefore, that the mechanism underlying the protective effect of 3,4DHPAA and 4HPAA against the hemin-induced decrease of the cytotoxic effect and engulfment capacity of activated macrophages may rely on their ability to increase glycolysis (Figure 11A–D). However, as etomoxir, an inhibitor of fatty acid oxidation, can also decrease the engulfment of tumor cells by macrophages [72], more studies are necessary to evaluate the role of 3,4DHPAA and 4HPAA in fatty acid oxidation and its contribution in metabolite-mediated macrophage activation.
4.4. Hemin Decreased MMP and Mitochondrial Mass in Macrophages: Effect of 3,4DHPAA and 4HPAA
A low level of OXPHOS is one of the metabolic features that characterizes activated M1-macrophages [57]. In fact, oligomycin, a compound that inhibits OXPHOS by blocking the F0 subunit of the H+-ATPase, has been shown to increase glycolysis and phagocytosis in elicited macrophages [71]. Inhibition of glycolysis with 2-deoxyglucose shifts the glycolytic metabolism of lymphoma cells to a predominantly OXPHOS-dependent metabolism [73] and increases MMP in breast cancer MCF7 cells [74]. However, we found that hemin, despite being able to decrease glycolysis (Figure 3A), failed to increase MMP in macrophages and on the contrary, hemin decreased MMP and mitochondrial mass (Figure 5 A,B). Hemin has also been shown to reduce MMP in BAECs, which was associated with a decrease in the basal and maximal mitochondrial respiration [18]. The MMP generated by proton pumps from complexes I, III, and IV into the intermembrane space of mitochondria is an essential process for energy production during the OXPHOS. Together with the proton gradient, MMP forms the transmembrane potential of hydrogen ions, which is critical to make ATP; in consequence, a drop in MMP compromises OXPHOS [75]. We suggest that hemin impairs the energy metabolism of macrophages, not only by decreasing glycolysis but also by affecting mitochondrial membrane potential, which consequently could alter OXPHOS. 3,4DHPAA and 4HPAA were not able to prevent these mitochondrial impairments induced by hemin, which indicate that their protective effects on macrophage activation may rely mainly on mechanisms involving the glycolytic pathway. However, to evaluate the physiological effect of hemin and the metabolites on macrophage metabolism and mitochondrial function, studies using in vivo models are required
4.5. Physiological Relevance of This Study and Limitations
After an intake of only 100 mg of beef, approximately 6.7–30.1 µM hemin could be produced in the colon lumen [76,77,78]. However, considering that most heme is broken down in the enterocyte, and only a small fraction of heme or hemin could be transported intact across the basolateral membrane, the concentration used in this study is unlikely to be achieved in vivo [79,80,81]. The impact of high amounts and frequency of red meat intake on heme and hemin absorption need to be determined. With respect to the limitations of our findings, it is unlikely that the effective concentrations of 3,4DHPAA and 4HPAA used in this study can be reached in vivo. Concentrations of 6.98 and 18.54 µM of 3,4DHPAA and 4HPAA, respectively, have been detected in fecal water after the administration of a standard diet [82]. In addition to the dietary intake of these metabolites’ precursors, the effective concentrations of 3,4DHPAA and 4HPAA that can be reached in plasma will depend on differences in the host microbiota, absorption mechanism, intermediate metabolism, and excretion [83]. Plasma concentrations of 0.05 µM 3,4DHPAA have been found in healthy children [84] and 0.4 µM 4HPAA has been observed in the plasma of healthy adults [85]. A strategy to increase the plasma concentration of these metabolites could be to consume supplements containing their precursors, as well as diets high in flavonoids, especially foods abundant in QUE, proanthocyanidins, and kaempferol. For instance, it has been shown that the urinary excretion of 3,4DHPAA as well as other phenolic acid metabolites doubled in human subjects after consumption of chocolate [86]. Urinary excretion of 4HPAA increased by 40% after the intake of green tea [46]. However, further studies in in vivo models are required to investigate the beneficial role of 3,4HDPAA and 4HPAA in macrophage activation and its role in cancer prevention.
5. Conclusions
In conclusion, this study shows that hemin promotes inhibition of glycolysis, glycolytic, and PPP enzyme activities and HIF-1α stabilization, which interfere with macrophage activation and their ability to eliminate cancer cells. 3,4DHPAA, a microbial metabolite of QUE, and 4HPAA, a microbial metabolite of proanthocyanidins and kaempferol, prevented hemin-induced impairment of anticancer activity in macrophages by stimulating glycolysis and PPP. 3,4DHPAA and/or 4HPAA administration could represent a promising strategy to enhance the ability of macrophages to eliminate cancer cells and to prevent the detrimental effects of hemin on macrophages. However, additional experiments are required to evaluate the protective effects of 3,4DHPAA and 4HPAA in in vivo models under dietary interventions, such as a high-meat diet.
Supplementary Materials
Supplementary materials can be found at https://www.mdpi.com/2076-3921/9/11/1109/s1.
Author Contributions
C.C.-P. conceived, designed, collected the data and literature for the manuscript. C.C.-P. and K.N.T. performed the experiments and assisted in the data analysis. C.C.-P and V.M.A. supervised the study. C.C.-P. wrote the manuscript and all authors reviewed the manuscript. All authors have read and agreed to the published version of the manuscript.
Funding
K.N.T. is funded by a Griffith University Postdoctoral Fellowship. C.C.-P. is funded by the Cancer Therapeutics CRC.
Acknowledgments
We would like to acknowledge the support of the Australian Government Cooperative Research Centre Programme. We thank Tayner Rodriguez for producing the A375 cells expressing RFP and the Cancer Therapeutics CRC (CTx) for generously permitting their use for this study.
Conflicts of Interest
Authors declare no conflict of interest.
References
- Bray, F.; Ferlay, J.; Soerjomataram, I.; Siegel, R.L.; Torre, L.A.; Jemal, A. Global cancer statistics 2018: GLOBOCAN estimates of incidence and mortality worldwide for 36 cancers in 185 countries. CA Cancer J. Clin. 2018, 68, 394–424. [Google Scholar] [CrossRef] [PubMed]
- WHO Cancer Website. Available online: https://www.who.int/news-room/fact-sheets/detail/cancer (accessed on 28 October 2020).
- Gonzalez, H.; Hagerling, C.; Werb, Z. Roles of the immune system in cancer: From tumor initiation to metastatic progression. Genes Dev. 2018, 32, 1267–1284. [Google Scholar] [CrossRef]
- Pan, X.Q. The mechanism of the anticancer function of M1 macrophages and their use in the clinic. Chin. J. Cancer 2012, 31, 557–563. [Google Scholar] [CrossRef]
- Dandekar, R.C.; Kingaonkar, A.V.; Dhabekar, G.S. Role of macrophages in malignancy. Ann. Maxillofac. Surg. 2011, 1, 150–154. [Google Scholar]
- Viola, A.; Munari, F.; Sánchez-Rodríguez, R.; Scolaro, T.; Castegna, A. The Metabolic Signature of Macrophage Responses. Front. Immunol. 2019, 10, 1462. [Google Scholar] [CrossRef] [PubMed]
- IARC. Consumption of red meat and processed meat. In IARC Monographs on the Evaluation of Carcinogenic Risks to Humans; IARC: Lyon, France, 2015; Volume 114. [Google Scholar]
- Bingham, S.A. High-meat diets and cancer risk. Proc. Nutr. Soc. 1999, 58, 243–248. [Google Scholar] [CrossRef] [PubMed]
- Chan, D.S.; Lau, R.; Aune, D.; Vieira, R.; Greenwood, D.C.; Kampman, E.; Norat, T. Red and processed meat and colorectal cancer incidence: Meta-analysis of prospective studies. PLoS ONE 2011, 6, 6. [Google Scholar] [CrossRef]
- Baron, C.P.; Andersen, H.J. Myoglobin-induced lipid oxidation. A review. J. Agric. Food Chem. 2002, 50, 3887–3897. [Google Scholar] [CrossRef]
- de La Pomélie, D.; Santé-Lhoutellier, V.; Sayd, T.; Théron, L.; Gatellier, P. Using a dynamic artificial digestive system to investigate heme iron nitrosylation during gastro-intestinal transit. Food Chem. 2019, 281, 231–235. [Google Scholar] [CrossRef]
- Richards, M.P. Redox reactions of myoglobin. Antioxid. Redox Signal. 2013, 18, 2342–2351. [Google Scholar] [CrossRef]
- Deo, V.; Zhang, Y.; Soghomonian, V.; Heremans, J.J. Quantum interference measurement of spin interactions in a bio-organic/semiconductor device structure. Sci. Rep. 2015, 5, 9487. [Google Scholar] [CrossRef] [PubMed]
- Bastide, N.M.; Pierre, F.H.F.; Corpet, D.E. Heme Iron from Meat and Risk of Colorectal Cancer: A Meta-analysis and a Review of the Mechanisms Involved. Cancer Prev. Res. 2011, 4, 177–184. [Google Scholar] [CrossRef] [PubMed]
- Sesink, A.L.; Termont, D.S.; Kleibeuker, J.H.; Van der Meer, R. Red meat and colon cancer: The cytotoxic and hyperproliferative effects of dietary heme. Cancer Res. 1999, 59, 5704–5709. [Google Scholar] [PubMed]
- Thanikachalam, K.; Khan, G. Colorectal Cancer and Nutrition. Nutrients 2019, 11, 164. [Google Scholar] [CrossRef]
- Catalán, M.; Ferreira, J.; Carrasco-Pozo, C. The Microbiota-Derived Metabolite of Quercetin, 3,4-Dihydroxyphenylacetic Acid Prevents Malignant Transformation and Mitochondrial Dysfunction Induced by Hemin in Colon Cancer and Normal Colon Epithelia Cell Lines. Molecules 2020, 25, 4138. [Google Scholar] [CrossRef]
- Higdon, A.N.; Benavides, G.A.; Chacko, B.K.; Ouyang, X.; Johnson, M.S.; Landar, A.; Zhang, J.; Darley-Usmar, V.M. Hemin causes mitochondrial dysfunction in endothelial cells through promoting lipid peroxidation: The protective role of autophagy. Am. J. Physiol. Heart Circ. Physiol. 2012, 302, H1394–H1409. [Google Scholar] [CrossRef]
- Donaldson, M.S. Nutrition and cancer: A review of the evidence for an anti-cancer diet. Nutr. J. 2004, 3, 19. [Google Scholar] [CrossRef]
- Kelly, G.S. Quercetin. Monograph. Altern. Med. Rev. 2011, 16, 172–194. [Google Scholar]
- Somerset, S.M.; Johannot, L. Dietary flavonoid sources in Australian adults. Nutr. Cancer 2008, 60, 442–449. [Google Scholar] [CrossRef]
- Gu, L.; Kelm, M.A.; Hammerstone, J.F.; Beecher, G.; Holden, J.; Haytowitz, D.; Gebhardt, S.; Prior, R.L. Concentrations of Proanthocyanidins in Common Foods and Estimations of Normal Consumption. J. Nutr. 2004, 134, 613–617. [Google Scholar] [CrossRef]
- Reyes-Farias, M.; Carrasco-Pozo, C. The Anti-Cancer Effect of Quercetin: Molecular Implications in Cancer Metabolism. Int. J. Mol. Sci. 2019, 20, 3177. [Google Scholar] [CrossRef] [PubMed]
- Chen, A.Y.; Chen, Y.C. A review of the dietary flavonoid, kaempferol on human health and cancer chemoprevention. Food Chem. 2013, 138, 2099–2107. [Google Scholar] [CrossRef]
- Nandakumar, V.; Singh, T.; Katiyar, S.K. Multi-targeted prevention and therapy of cancer by proanthocyanidins. Cancer Lett. 2008, 269, 378–387. [Google Scholar] [CrossRef] [PubMed]
- Cai, X.; Fang, Z.; Dou, J.; Yu, A.; Zhai, G. Bioavailability of quercetin: Problems and promises. Curr. Med. Chem. 2013, 20, 2572–2582. [Google Scholar] [CrossRef] [PubMed]
- Thilakarathna, S.H.; Rupasinghe, H.P. Flavonoid bioavailability and attempts for bioavailability enhancement. Nutrients 2013, 5, 3367–3387. [Google Scholar] [CrossRef] [PubMed]
- Landete, J.M. Updated knowledge about polyphenols: Functions, bioavailability, metabolism, and health. Crit. Rev. Food Sci. Nutr. 2012, 52, 936–948. [Google Scholar] [CrossRef] [PubMed]
- Aura, A.M.; O’Leary, K.A.; Williamson, G.; Ojala, M.; Bailey, M.; Puupponen-Pimia, R.; Nuutila, A.M.; Oksman-Caldentey, K.M.; Poutanen, K. Quercetin derivatives are deconjugated and converted to hydroxyphenylacetic acids but not methylated by human fecal flora in vitro. J. Agric. Food Chem. 2002, 50, 1725–1730. [Google Scholar] [CrossRef]
- Benov, L.; Sztejnberg, L.; Fridovich, I. Critical evaluation of the use of hydroethidine as a measure of superoxide anion radical. Free Radic. Biol. Med. 1998, 25, 826–831. [Google Scholar] [CrossRef]
- Blaut, M.; Schoefer, L.; Braune, A. Transformation of flavonoids by intestinal microorganisms. Int. J. Vitam. Nutr. Res. 2003, 73, 79–87. [Google Scholar] [CrossRef]
- Braune, A.; Gutschow, M.; Engst, W.; Blaut, M. Degradation of quercetin and luteolin by Eubacterium ramulus. Appl. Environ. Microbiol. 2001, 67, 5558–5567. [Google Scholar] [CrossRef]
- LeBlanc, L.M.; Pare, A.F.; Jean-Francois, J.; Hebert, M.J.; Surette, M.E.; Touaibia, M. Synthesis and antiradical/antioxidant activities of caffeic acid phenethyl ester and its related propionic, acetic, and benzoic acid analogues. Molecules 2012, 17, 14637–14650. [Google Scholar] [CrossRef] [PubMed]
- Manach, C.; Williamson, G.; Morand, C.; Scalbert, A.; Remesy, C. Bioavailability and bioefficacy of polyphenols in humans. I. Review of 97 bioavailability studies. Am. J. Clin. Nutr. 2005, 81 (Suppl. 1), 230S–242S. [Google Scholar] [CrossRef] [PubMed]
- Schneider, H.; Schwiertz, A.; Collins, M.D.; Blaut, M. Anaerobic transformation of quercetin-3-glucoside by bacteria from the human intestinal tract. Arch. Microbiol. 1999, 171, 81–91. [Google Scholar] [CrossRef] [PubMed]
- Schoefer, L.; Mohan, R.; Schwiertz, A.; Braune, A.; Blaut, M. Anaerobic degradation of flavonoids by Clostridium orbiscindens. Appl. Environ. Microbiol. 2003, 69, 5849–5854. [Google Scholar] [CrossRef] [PubMed]
- Raneva, V.; Shimasaki, H.; Ishida, Y.; Ueta, N.; Niki, E. Antioxidative activity of 3,4-dihydroxyphenylacetic acid and caffeic acid in rat plasma. Lipids 2001, 36, 1111–1116. [Google Scholar] [CrossRef]
- Rice-Evans, C.A.; Miller, N.J.; Paganga, G. Structure-antioxidant activity relationships of flavonoids and phenolic acids. Free Radic. Biol. Med. 1996, 20, 933–956. [Google Scholar] [CrossRef]
- Déprez, S.; Brezillon, C.; Rabot, S.; Philippe, C.; Mila, I.; Lapierre, C.; Scalbert, A. Polymeric proanthocyanidins are catabolized by human colonic microflora into low-molecular-weight phenolic acids. J. Nutr. 2000, 130, 2733–2738. [Google Scholar] [CrossRef]
- Moradi-Afrapoli, F.; Oufir, M.; Walter, F.R.; Deli, M.A.; Smiesko, M.; Zabela, V.; Butterweck, V.; Hamburger, M. Validation of UHPLC-MS/MS methods for the determination of kaempferol and its metabolite 4-hydroxyphenyl acetic acid, and application to in vitro blood-brain barrier and intestinal drug permeability studies. J. Pharm. Biomed. Anal. 2016, 128, 264–274. [Google Scholar] [CrossRef]
- Zhao, H.; Jiang, Z.; Chang, X.; Xue, H.; Yahefu, W.; Zhang, X. 4-Hydroxyphenylacetic Acid Prevents Acute APAP-Induced Liver Injury by Increasing Phase II and Antioxidant Enzymes in Mice. Front Pharm. 2018, 9, 653. [Google Scholar] [CrossRef]
- Vissiennon, C.; Nieber, K.; Kelber, O.; Butterweck, V. Route of administration determines the anxiolytic activity of the flavonols kaempferol, quercetin and myricetin—Are they prodrugs? J. Nutr. Biochem. 2012, 23, 733–740. [Google Scholar] [CrossRef]
- Kim, D.H.; Jung, E.A.; Sohng, I.S.; Han, J.A.; Kim, T.H.; Han, M.J. Intestinal bacterial metabolism of flavonoids and its relation to some biological activities. Arch. Pharm. Res. 1998, 21, 17–23. [Google Scholar] [CrossRef] [PubMed]
- Gross, M.; Pfeiffer, M.; Martini, M.; Campbell, D.; Slavin, J.; Potter, J. The quantitation of metabolites of quercetin flavonols in human urine. Cancer Epidemiol. Prev. Biomarkers 1996, 5, 711–720. [Google Scholar]
- Urpi-Sarda, M.; Monagas, M.; Khan, N.; Llorach, R.; Lamuela-Raventos, R.M.; Jauregui, O.; Estruch, R.; Izquierdo-Pulido, M.; Andres-Lacueva, C. Targeted metabolic profiling of phenolics in urine and plasma after regular consumption of cocoa by liquid chromatography-tandem mass spectrometry. J. Chromatogr. A 2009, 1216, 7258–7267. [Google Scholar] [CrossRef] [PubMed]
- Henning, S.M.; Wang, P.; Abgaryan, N.; Vicinanza, R.; de Oliveira, D.M.; Zhang, Y.; Lee, R.P.; Carpenter, C.L.; Aronson, W.J.; Heber, D. Phenolic acid concentrations in plasma and urine from men consuming green or black tea and potential chemopreventive properties for colon cancer. Mol. Nutr. Food Res. 2013, 57, 483–493. [Google Scholar] [CrossRef] [PubMed]
- Olthof, M.R.; Hollman, P.C.; Buijsman, M.N.; van Amelsvoort, J.M.; Katan, M.B. Chlorogenic acid, quercetin-3-rutinoside and black tea phenols are extensively metabolized in humans. J. Nutr. 2003, 133, 1806–1814. [Google Scholar] [CrossRef] [PubMed]
- Bosshart, H.; Heinzelmann, M. THP-1 cells as a model for human monocytes. Ann. Transl. Med. 2016, 4, 53. [Google Scholar] [CrossRef] [PubMed]
- Matthews, N.H.; Li, W.; Qureshi, A.A.; Weinstock, M.A.; Cho, E. Cutaneous Melanoma: Etiology and Therapy; Ward, W.H., Farma, J.M., Eds.; Codon Publications: Brisbane, Australia, 2017. [Google Scholar]
- Carrasco-Pozo, C.; Tan, K.N.; Rodriguez, T.; Avery, V.M. The Molecular Effects of Sulforaphane and Capsaicin on Metabolism upon Androgen and Tip60 Activation of Androgen Receptor. Int. J. Mol. Sci. 2019, 20, 5384. [Google Scholar] [CrossRef]
- Tan, K.N.; Carrasco-Pozo, C.; McDonald, T.S.; Puchowicz, M.; Borges, K. Tridecanoin is anticonvulsant, antioxidant, and improves mitochondrial function. J. Cereb. Blood Flow Metab. 2017, 37, 2035–2048. [Google Scholar] [CrossRef]
- Pajak, B.; Siwiak, E.; Sołtyka, M.; Priebe, A.; Zieliński, R.; Fokt, I.; Ziemniak, M.; Jaśkiewicz, A.; Borowski, R.; Domoradzki, T.; et al. 2-Deoxy-d-Glucose and Its Analogs: From Diagnostic to Therapeutic Agents. Int. J. Mol. Sci. 2019, 21, 234. [Google Scholar] [CrossRef]
- Wang, Z.; Nielsen, P.M.; Laustsen, C.; Bertelsen, L.B. Metabolic consequences of lactate dehydrogenase inhibition by oxamate in hyperglycemic proximal tubular cells. Exp. Cell Res. 2019, 378, 51–56. [Google Scholar] [CrossRef]
- Genin, M.; Clement, F.; Fattaccioli, A.; Raes, M.; Michiels, C. M1 and M2 macrophages derived from THP-1 cells differentially modulate the response of cancer cells to etoposide. BMC Cancer 2015, 15, 577. [Google Scholar] [CrossRef] [PubMed]
- Ivashkiv, L.B. IFNγ: Signalling, epigenetics and roles in immunity, metabolism, disease and cancer immunotherapy. Nat. Rev. Immunol. 2018, 18, 545–558. [Google Scholar] [CrossRef] [PubMed]
- Ma, J.L.; Yang, P.Y.; Rui, Y.C.; Lu, L.; Kang, H.; Zhang, J. Hemin modulates cytokine expressions in macrophage-derived foam cells via heme oxygenase-1 induction. J. Pharmacol. Sci. 2007, 103, 261–266. [Google Scholar] [CrossRef] [PubMed]
- Thapa, B.; Lee, K. Metabolic influence on macrophage polarization and pathogenesis. BMB Rep. 2019, 52, 360–372. [Google Scholar] [CrossRef]
- Ham, M.; Lee, J.W.; Choi, A.H.; Jang, H.; Choi, G.; Park, J.; Kozuka, C.; Sears, D.D.; Masuzaki, H.; Kim, J.B. Macrophage glucose-6-phosphate dehydrogenase stimulates proinflammatory responses with oxidative stress. Mol. Cell Biol. 2013, 33, 2425–2435. [Google Scholar] [CrossRef]
- Min, B.-K.; Park, S.; Kang, H.-J.; Kim, D.W.; Ham, H.J.; Ha, C.-M.; Choi, B.-J.; Lee, J.Y.; Oh, C.J.; Yoo, E.K.; et al. Pyruvate Dehydrogenase Kinase Is a Metabolic Checkpoint for Polarization of Macrophages to the M1 Phenotype. Front. Immunol. 2019, 10, 944. [Google Scholar] [CrossRef]
- Moon, J.S.; Hisata, S.; Park, M.A.; DeNicola, G.M.; Ryter, S.W.; Nakahira, K.; Choi, A.M.K. mTORC1-Induced HK1-Dependent Glycolysis Regulates NLRP3 Inflammasome Activation. Cell Rep. 2015, 12, 102–115. [Google Scholar] [CrossRef]
- Schroder, K.; Tschopp, J. The inflammasomes. Cell 2010, 140, 821–832. [Google Scholar] [CrossRef]
- Kellett, D.N. 2-Deoxyglucose and inflammation. J. Pharm. Pharmacol. 1966, 18, 199–200. [Google Scholar] [CrossRef]
- Kelly, B.; O’Neill, L.A. Metabolic reprogramming in macrophages and dendritic cells in innate immunity. Cell Res. 2015, 25, 771–784. [Google Scholar] [CrossRef]
- Goda, N.; Kanai, M. Hypoxia-inducible factors and their roles in energy metabolism. Int. J. Hematol. 2012, 95, 457–463. [Google Scholar] [CrossRef] [PubMed]
- Kim, J.W.; Tchernyshyov, I.; Semenza, G.L.; Dang, C.V. HIF-1-mediated expression of pyruvate dehydrogenase kinase: A metabolic switch required for cellular adaptation to hypoxia. Cell Metab. 2006, 3, 177–185. [Google Scholar] [CrossRef] [PubMed]
- Marin-Hernandez, A.; Gallardo-Perez, J.C.; Ralph, S.J.; Rodriguez-Enriquez, S.; Moreno-Sanchez, R. HIF-1alpha modulates energy metabolism in cancer cells by inducing over-expression of specific glycolytic isoforms. Mini Rev. Med. Chem. 2009, 9, 1084–1101. [Google Scholar] [CrossRef]
- Singh, D.; Arora, R.; Kaur, P.; Singh, B.; Mannan, R.; Arora, S. Overexpression of hypoxia-inducible factor and metabolic pathways: Possible targets of cancer. Cell Biosci. 2017, 7, 62. [Google Scholar] [CrossRef] [PubMed]
- Freemerman, A.J.; Johnson, A.R.; Sacks, G.N.; Milner, J.J.; Kirk, E.L.; Troester, M.A.; Macintyre, A.N.; Goraksha-Hicks, P.; Rathmell, J.C.; Makowski, L. Metabolic reprogramming of macrophages: Glucose transporter 1 (GLUT1)-mediated glucose metabolism drives a proinflammatory phenotype. J. Biol. Chem. 2014, 289, 7884–7896. [Google Scholar] [CrossRef]
- Michl, J.; Ohlbaum, D.J.; Silverstein, S.C. 2-Deoxyglucose selectively inhibits Fc and complement receptor-mediated phagocytosis in mouse peritoneal macrophages II. Dissociation of the inhibitory effects of 2-deoxyglucose on phagocytosis and ATP generation. J. Exp. Med. 1976, 144, 1484–1493. [Google Scholar] [CrossRef]
- Michl, J.; Silverstein, S.C. The inhibitory effect of 2-deoxy-D-glucose on Fc and C3b receptor-mediated phagocytosis in phagocytic cells. In Protein Turnover and Lysosome Function; Segal, H.L., Doyle, D.J., Eds.; Academic Press: Cambridge, MA, USA, 1978; pp. 561–583. [Google Scholar]
- Pavlou, S.; Wang, L.; Xu, H.; Chen, M. Higher phagocytic activity of thioglycollate-elicited peritoneal macrophages is related to metabolic status of the cells. J. Inflamm. (Lond.) 2017, 14, 4. [Google Scholar] [CrossRef]
- Liu, M.; O’Connor, R.S.; Trefely, S.; Graham, K.; Snyder, N.W.; Beatty, G.L. Metabolic rewiring of macrophages by CpG potentiates clearance of cancer cells and overcomes tumor-expressed CD47-mediated ‘don’t-eat-me’ signal. Nat. Immunol. 2019, 20, 265–275. [Google Scholar] [CrossRef]
- Robinson, G.L.; Dinsdale, D.; Macfarlane, M.; Cain, K. Switching from aerobic glycolysis to oxidative phosphorylation modulates the sensitivity of mantle cell lymphoma cells to TRAIL. Oncogene 2012, 31, 4996–5006. [Google Scholar] [CrossRef]
- Lucantoni, F.; Dussmann, H.; Prehn, J.H.M. Metabolic Targeting of Breast Cancer Cells With the 2-Deoxy-D-Glucose and the Mitochondrial Bioenergetics Inhibitor MDIVI-1. Front. Cell Dev. Biol. 2018, 6, 113. [Google Scholar] [CrossRef]
- Zorova, L.D.; Popkov, V.A.; Plotnikov, E.Y.; Silachev, D.N.; Pevzner, I.B.; Jankauskas, S.S.; Babenko, V.A.; Zorov, S.D.; Balakireva, A.V.; Juhaszova, M.; et al. Mitochondrial membrane potential. Anal. Biochem. 2018, 552, 50–59. [Google Scholar] [CrossRef] [PubMed]
- Pierre, F.H.; Santarelli, R.L.; Allam, O.; Tache, S.; Naud, N.; Gueraud, F.; Corpet, D.E. Freeze-dried ham promotes azoxymethane-induced mucin-depleted foci and aberrant crypt foci in rat colon. Nutr. Cancer 2010, 62, 567–573. [Google Scholar] [CrossRef][Green Version]
- Pretorius, B.; Schönfeldt, H.C.; Hall, N. Total and haem iron content lean meat cuts and the contribution to the diet. Food Chem. 2016, 193, 97–101. [Google Scholar] [CrossRef] [PubMed]
- Pritchard, S.E.; Marciani, L.; Garsed, K.C.; Hoad, C.L.; Thongborisute, W.; Roberts, E.; Gowland, P.A.; Spiller, R.C. Fasting and postprandial volumes of the undisturbed colon: Normal values and changes in diarrhea-predominant irritable bowel syndrome measured using serial MRI. Neurogastroenterol. Motil. 2014, 26, 124–130. [Google Scholar] [CrossRef] [PubMed]
- Khan, A.A.; Quigley, J.G. Heme and FLVCR-related transporter families SLC48 and SLC49. Mol. Asp. Med. 2013, 34, 669–682. [Google Scholar] [CrossRef]
- Oates, P.S.; West, A.R. Heme in intestinal epithelial cell turnover, differentiation, detoxification, inflammation, carcinogenesis, absorption and motility. World J. Gastroenterol. 2006, 12, 4281–4295. [Google Scholar] [CrossRef]
- Uc, A.; Stokes, J.B.; Britigan, B.E. Heme transport exhibits polarity in Caco-2 cells: Evidence for an active and membrane protein-mediated process. Am. J. Physiol. Gastrointest Liver Physiol. 2004, 287, 12. [Google Scholar] [CrossRef]
- Jenner, A.M.; Rafter, J.; Halliwell, B. Human fecal water content of phenolics: The extent of colonic exposure to aromatic compounds. Free Radic. Biol. Med. 2005, 38, 763–772. [Google Scholar] [CrossRef]
- Rowland, I.; Gibson, G.; Heinken, A.; Scott, K.; Swann, J.; Thiele, I.; Tuohy, K. Gut microbiota functions: Metabolism of nutrients and other food components. Eur. J. Nutr. 2018, 57, 1–24. [Google Scholar] [CrossRef]
- Eldrup, E.; Clausen, N.; Scherling, B.; Schmiegelow, K. Evaluation of plasma 3,4-dihydroxyphenylacetic acid (DOPAC) and plasma 3,4-dihydroxyphenylalanine (DOPA) as tumor markers in children with neuroblastoma. Scand. J. Clin. Lab. Investig. 2001, 61, 479–490. [Google Scholar] [CrossRef]
- Davis, B.A.; Yu, P.H.; Carlson, K.; O’Sullivan, K.; Boulton, A.A. Plasma levels of phenylacetic acid, m- and p-hydroxyphenylacetic acid, and platelet monoamine oxidase activity in schizophrenic and other patients. Psychiatry Res. 1982, 6, 97–105. [Google Scholar] [CrossRef]
- Rios, L.Y.; Gonthier, M.P.; Rémésy, C.; Mila, I.; Lapierre, C.; Lazarus, S.A.; Williamson, G.; Scalbert, A. Chocolate intake increases urinary excretion of polyphenol-derived phenolic acids in healthy human subjects. Am. J. Clin. Nutr. 2003, 77, 912–918. [Google Scholar] [CrossRef] [PubMed]


Publisher’s Note: MDPI stays neutral with regard to jurisdictional claims in published maps and institutional affiliations. |
© 2020 by the authors. Licensee MDPI, Basel, Switzerland. This article is an open access article distributed under the terms and conditions of the Creative Commons Attribution (CC BY) license (http://creativecommons.org/licenses/by/4.0/).