Abstract
The current investigation was undertaken to examine saffron processing waste (SPW) as a bioresource, which could be valorized to produce extracts rich in antioxidant polyphenols, using a green, natural deep eutectic solvent (DES). Initially, there was an appraisal of the molar ratio of hydrogen bond donor/hydrogen bond acceptor in order to come up with the most efficient DES composed of L-lactic acid/glycine (5:1). The following step was the optimization of the extraction process using response surface methodology. The optimal conditions thus determined were a DES concentration of 55% (w/v), a liquid-to-solid ratio of 60 mL g−1, and a stirring speed of 800 rounds per minute. Under these conditions, the extraction yield in total polyphenols achieved was 132.43 ± 10.63 mg gallic acid equivalents per g of dry mass. The temperature assay performed within a range of 23 to 80 °C, suggested that extracts displayed maximum yield and antioxidant activity at 50–60 °C. Liquid chromatography-mass spectrometry analysis of the SPW extract obtained under optimal conditions showed that the predominant flavonol was kaempferol 3-O-sophoroside and the major anthocyanin delphinidin 3,5-di-O-glucoside. The results indicated that SPW extraction with the DES used is a green and efficient methodology and may afford extracts rich flavonols and anthocyanins, which are considered to be powerful antioxidants.
1. Introduction
In recent years, the agri-food sector has been acknowledged as a major contributor to the global environmental burden. Processing of plants (fruit, vegetables, tubers etc.) for the production of plant food commodities is considered to be a major concern, since a vast amount of waste material may be generated [1]. Plant processing waste is residual biomass rich in moisture and microbial loads and can be a direct risk associated with environmental pollution. On the other hand, an ever-increasing number of current studies on plant food processing residues suggests the presence of a wide range of bioactive compounds in different waste fractions. These bioactive substances are primarily secondary plant metabolites, belonging to polyphenols, carotenoids, essential oils, resins, etc. Therefore, plant food processing waste and residues are highly regarded as very promising sources of bioactive compounds, with applications in food technology, pharmaceuticals, and cosmetics [2,3].
To date, the development of methodologies for high-performance and time-effective extraction of polyphenols from plant matrices is a challenge, because of the inherent limitations of conventional extraction methods. The valorization of polyphenols as bioactive ingredients at various commercial levels has shifted research to low-cost, eco-friendly, and efficient extraction techniques, based on a green philosophy [4]. A basic concept of such an approach would be the use of novel, green solvents, which would be devoid of the disadvantages that characterize the conventional, volatile, petroleum-based solvents. In this view, the emerging liquids known as deep eutectic solvents (DES) would appear to be solid ground for the implementation of green processes for the production of polyphenol-enriched extracts.
DES are novel materials, which can be synthesized using natural substances, such as sugars, polyols, organic acids and their salts, amino acids, etc. [5]. They are usually composed of a hydrogen bond donor (HBD) and a hydrogen bond acceptor (HBA). The ongoing research on these solvents has provided substantial evidence that they can be highly effective in polyphenol extraction, surpassing the potency of conventional solvents, such as methanol. On the other hand, DES are not volatile, their production does not depend on fossil sources, and they have very attractive characteristics, including tunability of composition (and thus regulation of their properties), lack of toxicity, recyclability, and low cost. It is not surprising, therefore, that over the past five years, numerous DES have been synthesized and tested for their potency to extract polyphenolic compounds [6,7].
The plant Crocus sativus (Iridaceae), known widely as saffron, is a perennial herb that has been acknowledged since antiquity for its culinary uses and medicinal properties [8]. The most precious part of the plant is the stigmas, which are collected and dried to produce the world’s most expensive spice. Following screening and separation, the rest of the flower, composed essentially of the tepals (undifferentiated petals and sepals), is rejected as a residual material. However, emerging evidence has showed that saffron petals contain an array of bioactive polyphenols, including a series of flavonol glycosides and anthocyanin pigments. Several of these constituents were reported to possess multiple beneficial bioactivities [9], and on this evidence, a few extraction methodologies were developed, with the aim of producing polyphenol-containing extracts from saffron processing waste (SPW) [10,11,12,13].
However, to the best of the authors’ knowledge, the use of DES has never been reported for SPW extraction. The present investigation describes the development of a green extraction methodology for the effective recovery of SPW polyphenols, using a DES composed of L-lactic acid (HBD) and glycine (HBA). The study included the synthesis of the most efficient system by screening a range of HBD:HBA molar ratios and then the optimization by deploying response surface methodology and a temperature assay. The polyphenolic composition of the optimally obtained extract was assessed by performing liquid chromatography, mass spectrometry analyses.
2. Materials and Methods
2.1. Chemicals
Glycine (99.5%) was from Applichem (Darmstadt, Germany). Iron chloride hexahydrate was from Merck (Darmstadt, Germany). Rutin (quercetin 3-O-rutinoside) hydrate, kaempferol 3-O-glucoside, 2,4,6-tris(2-pyridyl)-s-triazine (TPTZ), 2,2-diphenylpicrylhydrazyl (DPPH) and Folin-Ciocalteu reagent were from Sigma-Aldrich (St. Louis, MO, USA). L-Lactic acid, sodium carbonate anhydrous (99%), ascorbic acid (99.5%), and sodium acetate trihydrate and aluminium chloride anhydrous (98%) were from Penta (Praha, Czechia). Gallic acid hydrate was from Panreac (Barcelona, Spain). Pelargonin (pelargonidin 3,5-di-O-glucoside) chloride was from Extrasynthese (Genay, France).
2.2. Plant Material and Handling
Saffron (Crocus sativus L.) processing waste (SPW), composed essentially of saffron tepals, was collected immediately after manual processing of saffron flowers from a processing plant located in Kozani (West Macedonia, Greece). The plant material was transferred to the laboratory within 24 h and dried at 55 °C for 48 h in a laboratory oven (Binder BD56, Bohemia, NY, USA). Dried SPW was pulverized in a ball-mill to give powders with approximate average particle diameter of 0.317 mm, and stored in air-tight vessels at −18 °C until used.
2.3. DES Synthesis
Synthesis of the DES used in this study was based on a previous protocol [14]. Exact weights of L-lactic acid (HBD) and glycine (HBA) were transferred into a round-bottom glass flask and heated moderately (75–80 °C) for approximately 120 min until the formation of a perfectly transparent liquid. Heating was provided by an oil bath placed on a thermostat-equipped hotplate (Witeg, Wertheim, Germany). The liquid was allowed to acquire room temperature and stored in a sealed vial, in the dark. Inspection for appearance of crystals that would indicate instability was performed at regular intervals over six weeks.
2.4. Batch Stirred-Tank Extraction
Exact mass of 0.570 g of dried plant material was introduced into a 50-mL round-bottom flask with 20 mL of solvent to give a liquid-to-solid ratio (RL/S) of 35 mL g−1. The flask was immersed into oil bath and heated by means of a thermostat-equipped hotplate. Extractions were carried out for 150 min, at 50 °C, under magnetic stirring set at 500 rpm. All DES were tested as 70% (w/v) aqueous mixtures. Extractions with deionised water, 60% (v/v) aqueous ethanol and 60% (v/v) aqueous methanol were used as control. After the extraction, samples were centrifuged at 10,000× g for 10 min and the supernatant was used for all analyses.
2.5. Extraction Optimization with Response Surface Methodology (RSM)
The scope of RSM was the implementation of a mathematical model to predict polyphenol extraction performance from SPW using the most efficient DES synthesized. The mode chosen was a Box-Behnken experimental design with three central points. Key extraction variables including the concentration of DES in aqueous mixtures (CDES), the liquid-to-solid ratio (RL/S) and the stirring speed (SS) [15] were taken into account and termed X1, X2, and X3, respectively (Table 1). Yield in total polyphenols (YTP) was the screening response and the three independent variables were coded between −1 (lower limit) and 1 (upper limit). Codification was performed with the following equation [16]:

Table 1.
Codified and actual values of the independent variables considered for the experimental design.
Δzi is the distance between the real value at the central design point and the real value in the upper or lower limit of a variable; βd is the major coded limit value in the matrix for each variable, and z0 is the real value at the central point. The equation (mathematical model) obtained by fitting the function to the experimental data was evaluated by ANOVA. Visual model representation was done by 3D surface response plots.
2.6. Total Polyphenol Determination
An established methodology was used [17]. Samples were diluted 1:50 with 0.5% aqueous formic acid prior to determinations. A volume of 0.1 mL of diluted sample was transferred into a 1.5-mL Eppendorf tube and mixed with 0.1 mL Folin–Ciocalteu reagent. The mixture was allowed to react for 2 min and then 0.8 mL of sodium carbonate (5% w/v) was added, followed by 20-min incubation at 40 °C, in a water bath. After incubation, the absorbance at 740 nm was read and total polyphenol concentration (CTP) was determined from a calibration curve constructed with gallic acid (10–80 mg L−1). Extraction yield in total polyphenols was expressed as mg gallic acid equivalents (GAE) per g dry mass (dm).
2.7. Total Flavonoid Determination
For total flavonoids, a previously published protocol was employed [18]. Volume of 0.1 mL of appropriately diluted sample was combined with 0.86 mL 35% (v/v) aqueous ethanol and 0.04 mL of reagent consisted of 5% (w/v) AlCl3 and 0.5 M CH3COONa. After 30 min at room temperature the absorbance was obtained at 415 nm. Total flavonoid concentration (CTFn) was calculated from a calibration curve using rutin as standard (15–300 mg L−1). Yield in total flavonoids (YTFn) was estimated as mg rutin equivalents (RtE) per g dm.
2.8. Determination of the Antiradical Activity (AAR)
The determination was based on the stable radical probe DPPH using a stoichiometric assay [19]. All samples were diluted 1:50 with methanol just before the analysis, and 0.025 mL of sample was mixed with 0.975 mL DPPH (100 μM in methanol) at room temperature. Absorbance readings at 515 nm were performed at t = 0 min (immediately after mixing) and at t = 30 min. The AAR of the extract was then computed as follows:
CDPPH and CTP are the DPPH concentration (μM) and total polyphenol concentration (mg L−1) in the reaction mixture, respectively. A515(f) corresponds to A515 at t = 30 min and A515(i) to A515 at t = 0. YTP is the extraction yield (mg g−1) in TP of each of the extracts tested. AAR was calculated as μmol DPPH g−1 dm.
2.9. Determination of the Reducing Power (PR)
The ferric-reducing power assay was performed as previously described [19]. Before the analysis, samples were diluted 1:50. Then, 0.05 mL of the sample was incubated with 0.05 mL FeCl3 (4 mM in 0.05 M HCl) at 37 °C in a water bath for 30 min. Following incubation, 0.9 mL of TPTZ solution (1 mM in 0.05 M HCl) was added, and the mixture was allowed to stand at room temperature for further 5 min. The absorbance was obtained at 620 nm and PR was reported as μmol ascorbic acid equivalents (AAE) g−1 dm using an ascorbic acid calibration curve (50–300 μM).
2.10. Liquid Chromatography Diode Array Mass Spectrometry (LC-DAD-MS)
A modification of a method reported elsewhere was used [20]. The apparatus was a Finnigan (San Jose, CA, USA) MAT Spectra System P4000 pump, a UV6000LP diode array detector, and a Finnigan AQA mass spectrometer. Analyses were performed with a Fortis RP-18 column, 150 mm × 2.1 mm, 3 μm, at 40 °C, with a 10-μL injection loop. Acquisition of mass spectra at 20 and 70 eV was performed with electrospray ionization (ESI) in positive ion mode, using the following settings: probe temperature was 250 °C, source voltage at 25 V, detector voltage at 450 V, and capillary voltage at 4 kV. The eluents were (A) 2% acetic acid and (B) methanol and the flow rate was 0.3 mL min−1. Elution was carried out as follows: 0–30 min, 0–100% methanol; 30–40 min, 100% methanol.
2.11. High-Performance Liquid Chromatography Diode Array (HPLC-DAD)
The analysis was carried out on a Shimadzu CBM-20A liquid chromatograph (Shimadzu Europa GmbH, Duisburg, Germany) equipped with an SIL-20AC auto sampler and a CTO-20AC column oven. Detection was carried out using a Shimadzu SPD-M20A detector. The system was interfaced by Shimadzu LC solution software. Chromatography was carried out on a Phenomenex Luna C18(2) column (100 Å, 5 μm, 4.6 × 250 mm) (Phenomenex, Inc., Torrance, CA, USA). Columns were maintained at a temperature of 40 °C. Eluents were (A) 0.5% aqueous formic acid and (B) 0.5% formic acid in MeCN/water (6:4), and the flow rate was 1 mL min−1. A 20 μL sample was injected into the high-performance liquid chromatography (HPLC). Following is the elution program used: 100% A to 60% A in 40 min, 60% A to 50% A in 10 min, 50% A to 30% A in 10 min, and then isocratic elution for another 10 min. The column was washed with 100% MeCN and re-equilibrated with 100% eluent A before the next injection. Quantification was performed with calibration curves (0–50 μg mL−1) constructed with kaempferol 3-O-glucoside (R2 = 0.9999), rutin (R2 = 0.9990), and pelargonin (R2 = 0.9999).
2.12. Statistical Analysis
Extractions were repeated at least twice, and all determinations were carried out in triplicate. Values presented are means ± standard deviation (sd). Linear regression analysis was used to establish linear correlations, at least at a 95% significance level (p < 0.05), using SigmaPlot™ 12.5 (Systat Software Inc., San Jose, CA, USA). The design of experiment, response surface methodology and all associated statistics were performed with JMP™ Pro 13 (SAS, Cary, NC, USA).
3. Results and Discussion
3.1. DES Synthesis and the Effect of HBD:HBA Molar Ratio ()
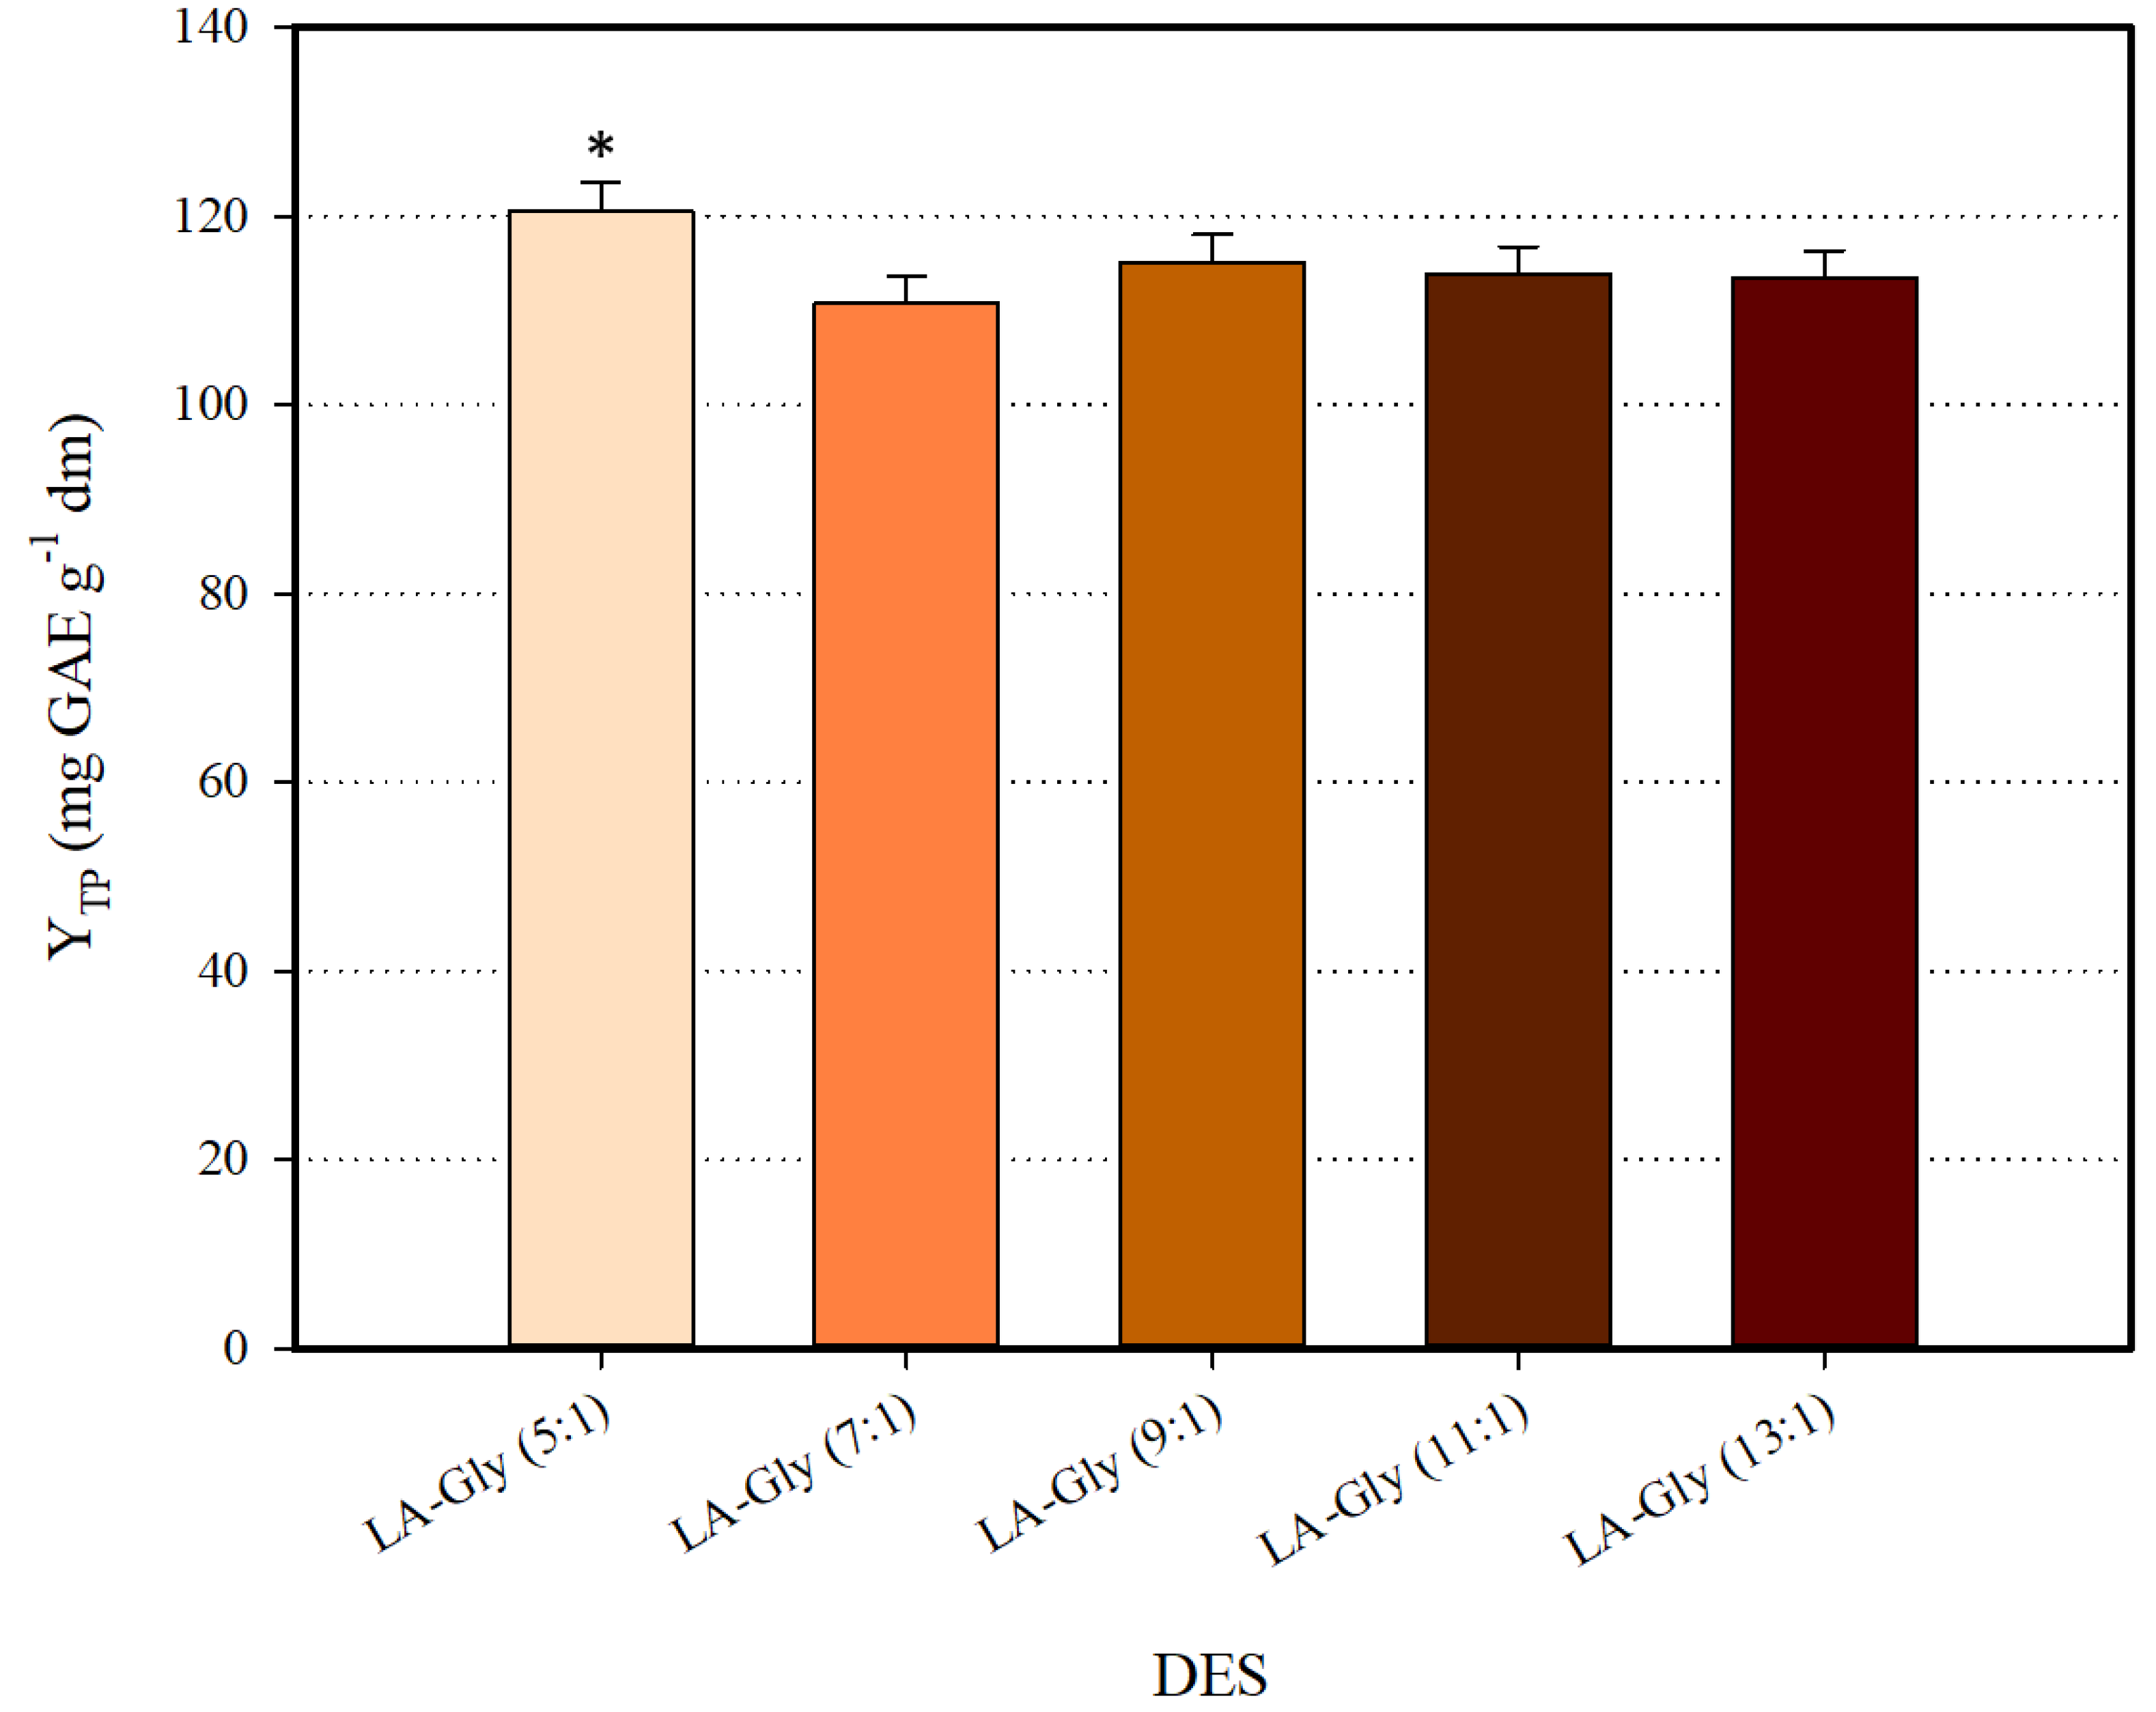
The first report on L-lactic acid (LA) and glycine (Gly) combination pointed out that stable DES may be formed at > 3 [21]. In latter studies, DES composed of LA and Gly exhibited stability at ≥ 5, and it was also demonstrated that may significantly affect DES efficiency in extracting phenolics [22]. On such a basis, synthesis and screening of a series of LA-Gly DES with ranging from five to 13, was the first stage in the development of an efficient solvent. All DES synthesized were tested for polyphenol recovery as 70% (w/v) aqueous mixtures. Screening results are depicted in Figure 1. The DES LA-Gly (5:1) was proven to be the highest-performing system, providing significantly increased YTP (p < 0.05). This finding evidenced the potency of LA-Gly (5:1) for polyphenol recovery, and on this ground, this DES was chosen for all further processes.
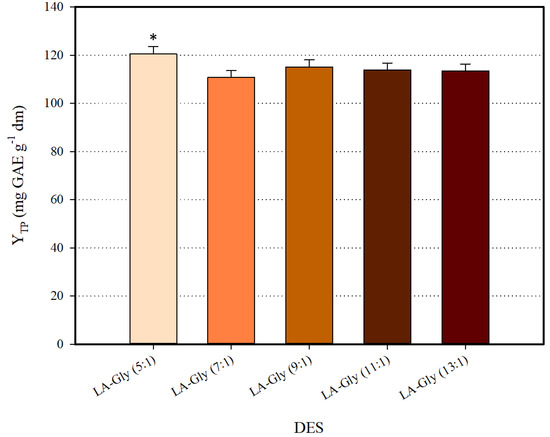
Figure 1.
Screening of HBD:HBA ratio for the selection of the most efficient deep eutectic solvent (DES). Asterisk (*) denotes statistically different value (p < 0.05).
3.2. Assessment of the DES Extraction Efficiency
To better illustrate the efficiency of LA-Gly (5:1), an appraisal was carried out by comparing the DES performance with that of two other green solvents, namely 60% (v/v) aqueous ethanol and water. Extractions with a commonly used solvent, 60% (v/v) aqueous methanol, were also performed. For the appraisal, in addition to YTP, the YTFn, AAR and PR were also considered, and the results are analytically displayed in Table 2. LA-Gly (5:1) gave higher YTP, which was statistically significant (p < 0.05). Regarding YTFn and PR, extraction of SPW with LA-Gly (5:1) also afforded higher but statistically non-significant values, whereas AAR of the LA-Gly (5:1) was lower compared to the extracts obtained with the control solvents. Based on these results, it was deemed that LA-Gly (5:1) was indeed the highest-performic system.

Table 2.
Extraction yields and antioxidant characteristics of the saffron processing waste (SPW) extracts obtained with DES and the control solvents.
3.3. Optimisation of Extraction Performance
Response surface methodology was deployed to assess the effect of three basic extraction variables (CDES, RL/S, SS) on the performance of LA-Gly (5:1) to recover polyphenolic antioxidants. The objective was the fit of polynomial equations (models) to the experimental data, in order to describe effectively the behavior of the data set for making statistical previsions. Assessment of the fitted models was based on the ANOVA (Table 3). By neglecting the non-significant terms, the first-degree equation (mathematical model) was
YTP = 115.32 + 3.24X1 + 8.67X2 + 5.73X3 − 5.11X1X2 − 4.93X1X3.

Table 3.
Statistical data related with the model established by implementing response surface methodology.
The square correlations coefficient (R2) and the p-value are indicators of the total variability around the mean calculated by the model. Measured and predicted YTP values for each material extracted and for each design point are analytically presented in Table 4. Because total R2 of the model was 0.95, and the p value (assuming a confidence interval of 95%) was highly significant (0.0080) (F value for lack-of-fit = 30.1016), Equation (3) showed excellent fitting to the experimental data.

Table 4.
Measured and predicted values of the response for every point of the experimental design implemented.
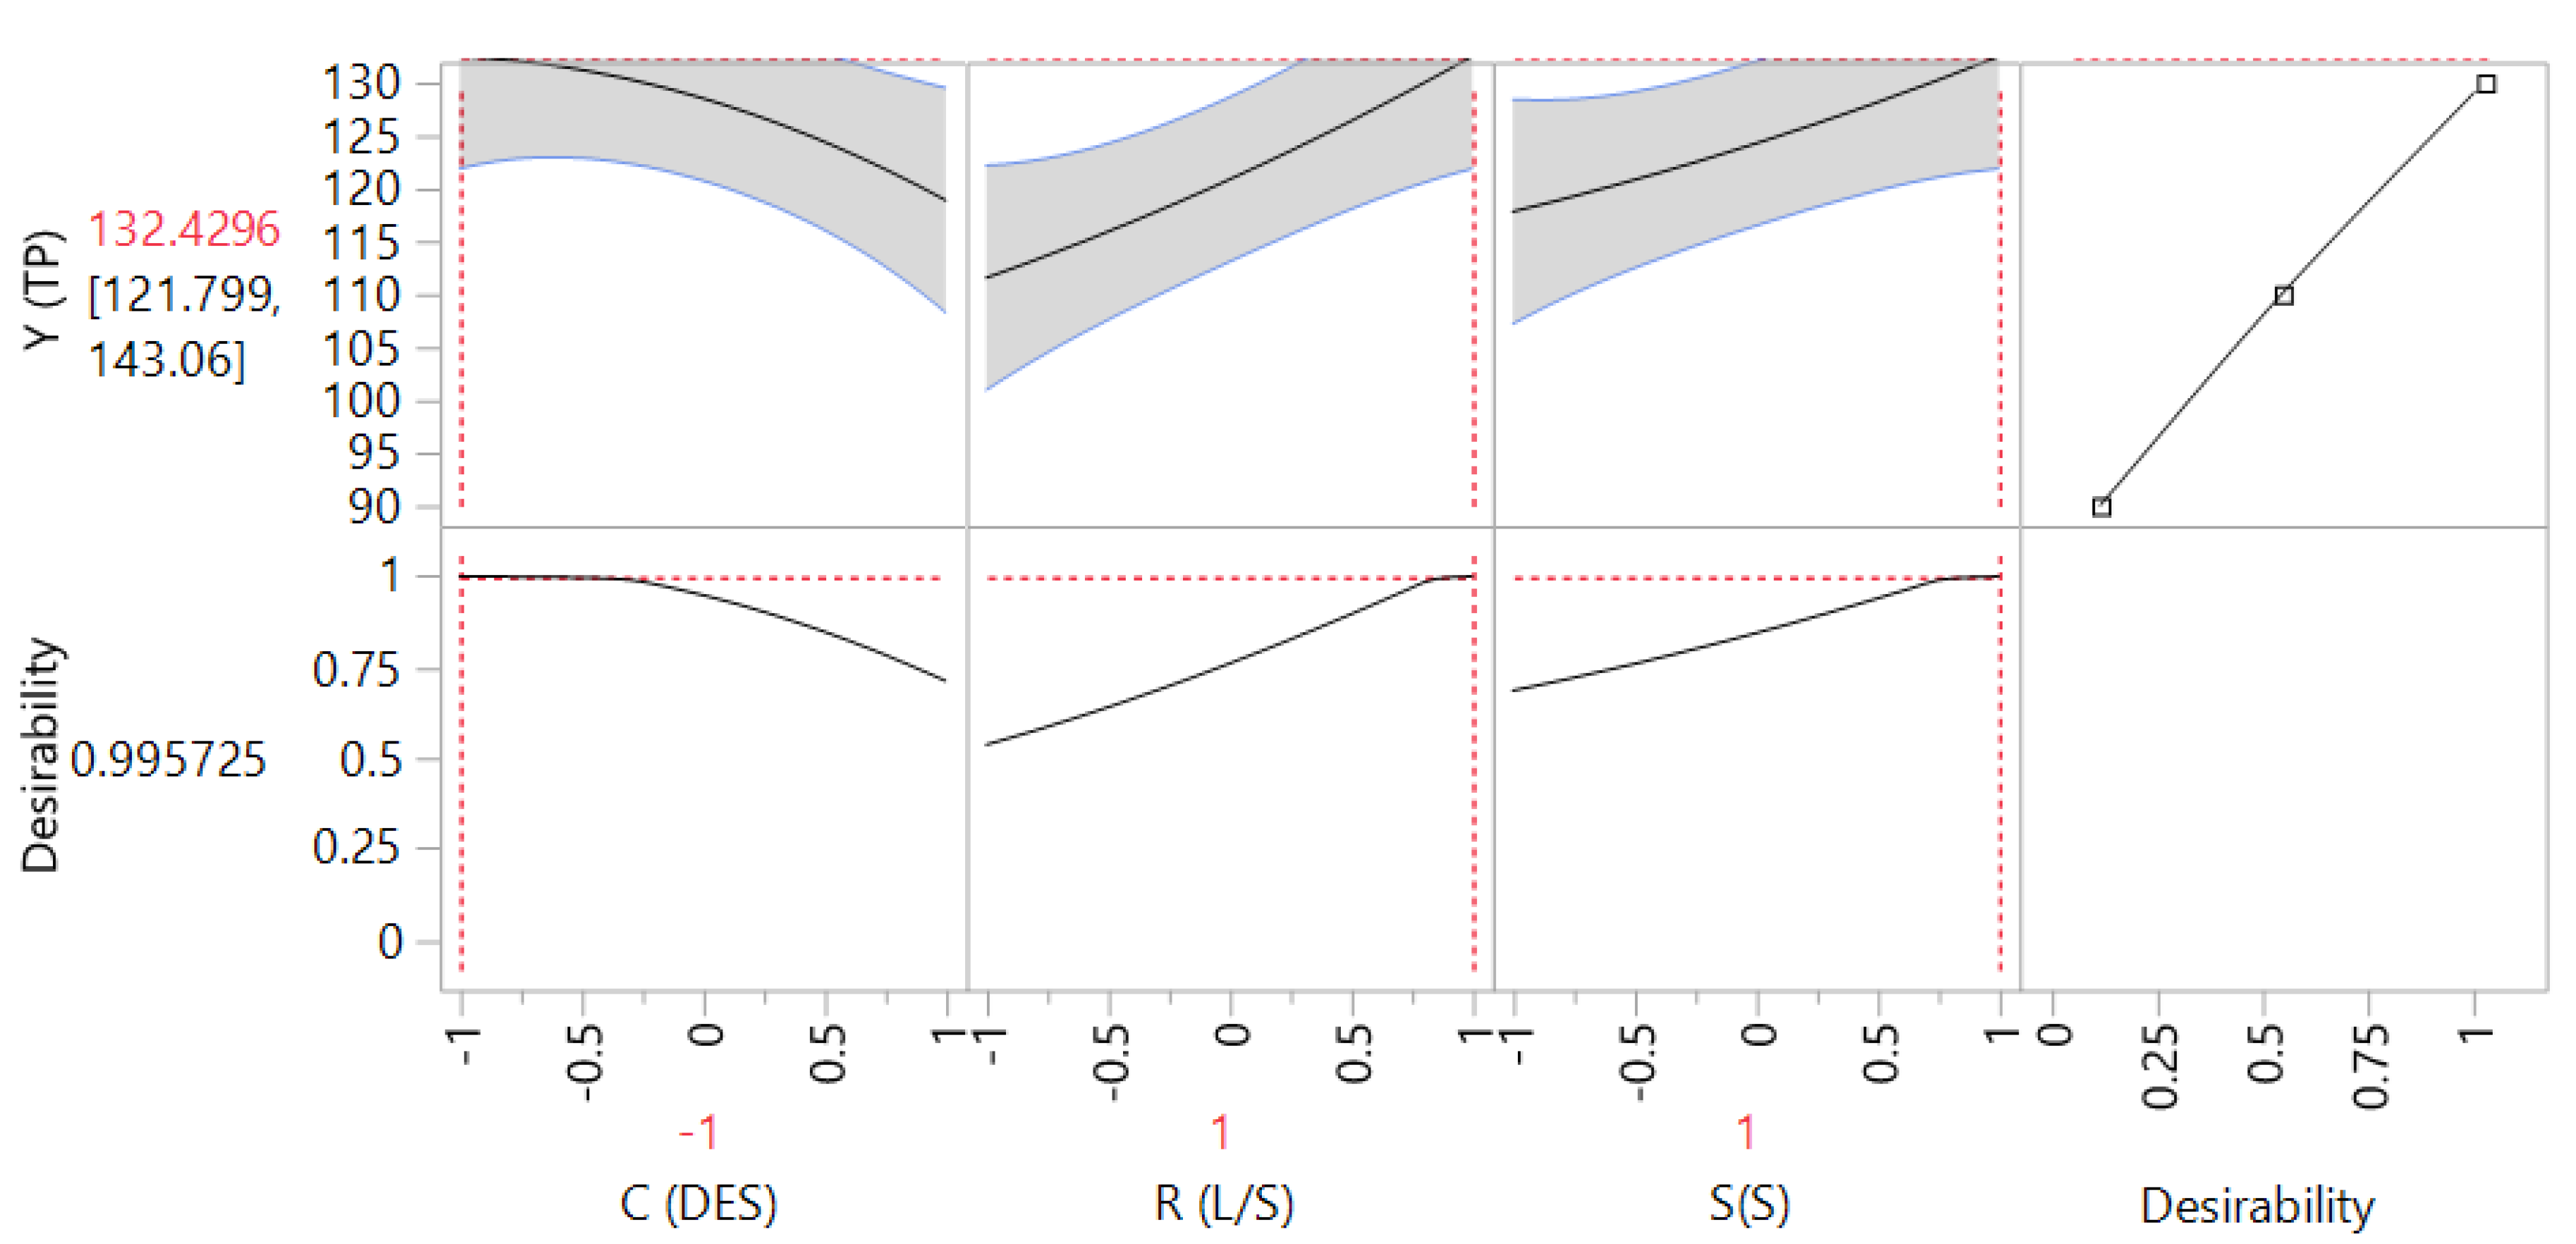
The 3D plots created based on the model are given in Figure 2, to readily portray the effect of the process variables on the response (YTP). The desirability function enabled the simultaneous optimization of the levels of all three variables in order to attain the best system performance (Figure 3), and the sets of conditions to achieve the highest theoretical yield were estimated to be CDES = 55% (w/v), RL/S = 60 mL g−1 and SS = 800 rpm. Under these conditions, the maximum theoretical YTP was 132.43 ± 10.63 mg GAE g−1 dm. To confirm the validity of the model, three extractions of each material were carried out under the optimal conditions. The YTP determined was 128.00 ± 1.94 mg GAE g−1 dm, suggesting that the theoretical optimum settings for CDES, RL/S, and SS may be applied with high reliability.

Figure 2.
Three-dimensional plots displaying the effect of process (independent) variables on the total polyphenol yield (YTP). For variable assignment, see Table 1. Plots (A), (B) and (C) show covariation of variables X1 and X2, X1 and X3, and X2 and X3, respectively.
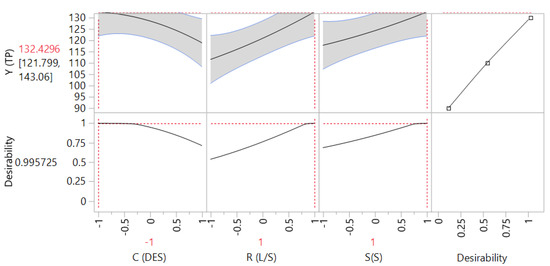
Figure 3.
Desirability function showing the maximum predicted response upon setting process (independent) variable values at the predicted optima.
Judging by the model, CDES (X1) had a direct positive influence on YTP, and the same was seen for RL/S (X2). Likewise, SS (X3) had a positive impact on SPW polyphenol extraction. On the other hand, cross terms CDES (X1) and RL/S (X2), and CDES (X1) and SS (X3) had a negative effect on YTP. The predicted CDES levels implied the use of a significantly higher water amount compared with previous results from polyphenol extraction with DES, which indicated that 80% (w/w) to be the most appropriate CDES for high extraction yield [23,24,25,26]. Suitable DES mixing with water is indispensable for regulation of properties crucial to solid-liquid extraction, such as viscosity and polarity [27]. However, CDES cannot be below a certain level because excessive water amount would cause DES decomposition and therefore the intrinsic DES properties would be abolished [28].
Variable RL/S is a strongly influential factor regarding solid–liquid extraction, as it affects concentration gradient between the solid particles and the liquid phase, which is the driving force for the manifestation of diffusion phenomena. Recently, it was demonstrated that raising RL/S from 10 to 50 mL g−1 may significantly increase diffusivity [29]. Conventional solvent extraction may require RL/S as high as 120 mL g−1 [30,31], but for polyphenol extractions with DES, lower RL/S levels ranging from 29–50 mL g−1 are usually effective [32,33,34]. The optimal RL/S estimated was 60 mL g−1, indicating that higher concentration gradients may be necessary for effective polyphenol leaching into the liquid phase.
In a similar manner, SS was shown to play an important role in solid–liquid extraction, and appropriate SS regulation may give significantly higher extraction yields [29,31]. Sufficiently high SS causes turbulence in the extraction tank, and this in turn may increase mass transfer rate. In this line, SS has been demonstrated to provide increased polyphenol diffusivity [29]. On the other hand, high SS may lead to incomplete diffusivity because higher turbulence could shift the equilibrium toward polyphenol adsorption rather than diffusion. At this point, characteristics such as the viscosity of the liquid phase (solvent), which is tightly associated with RL/S, should also be considered. Such a hypothesis might explain the combined effect observed between SS and CDES (cross term X1X3) for SPW polyphenol extraction.
3.4. Temperature Effects
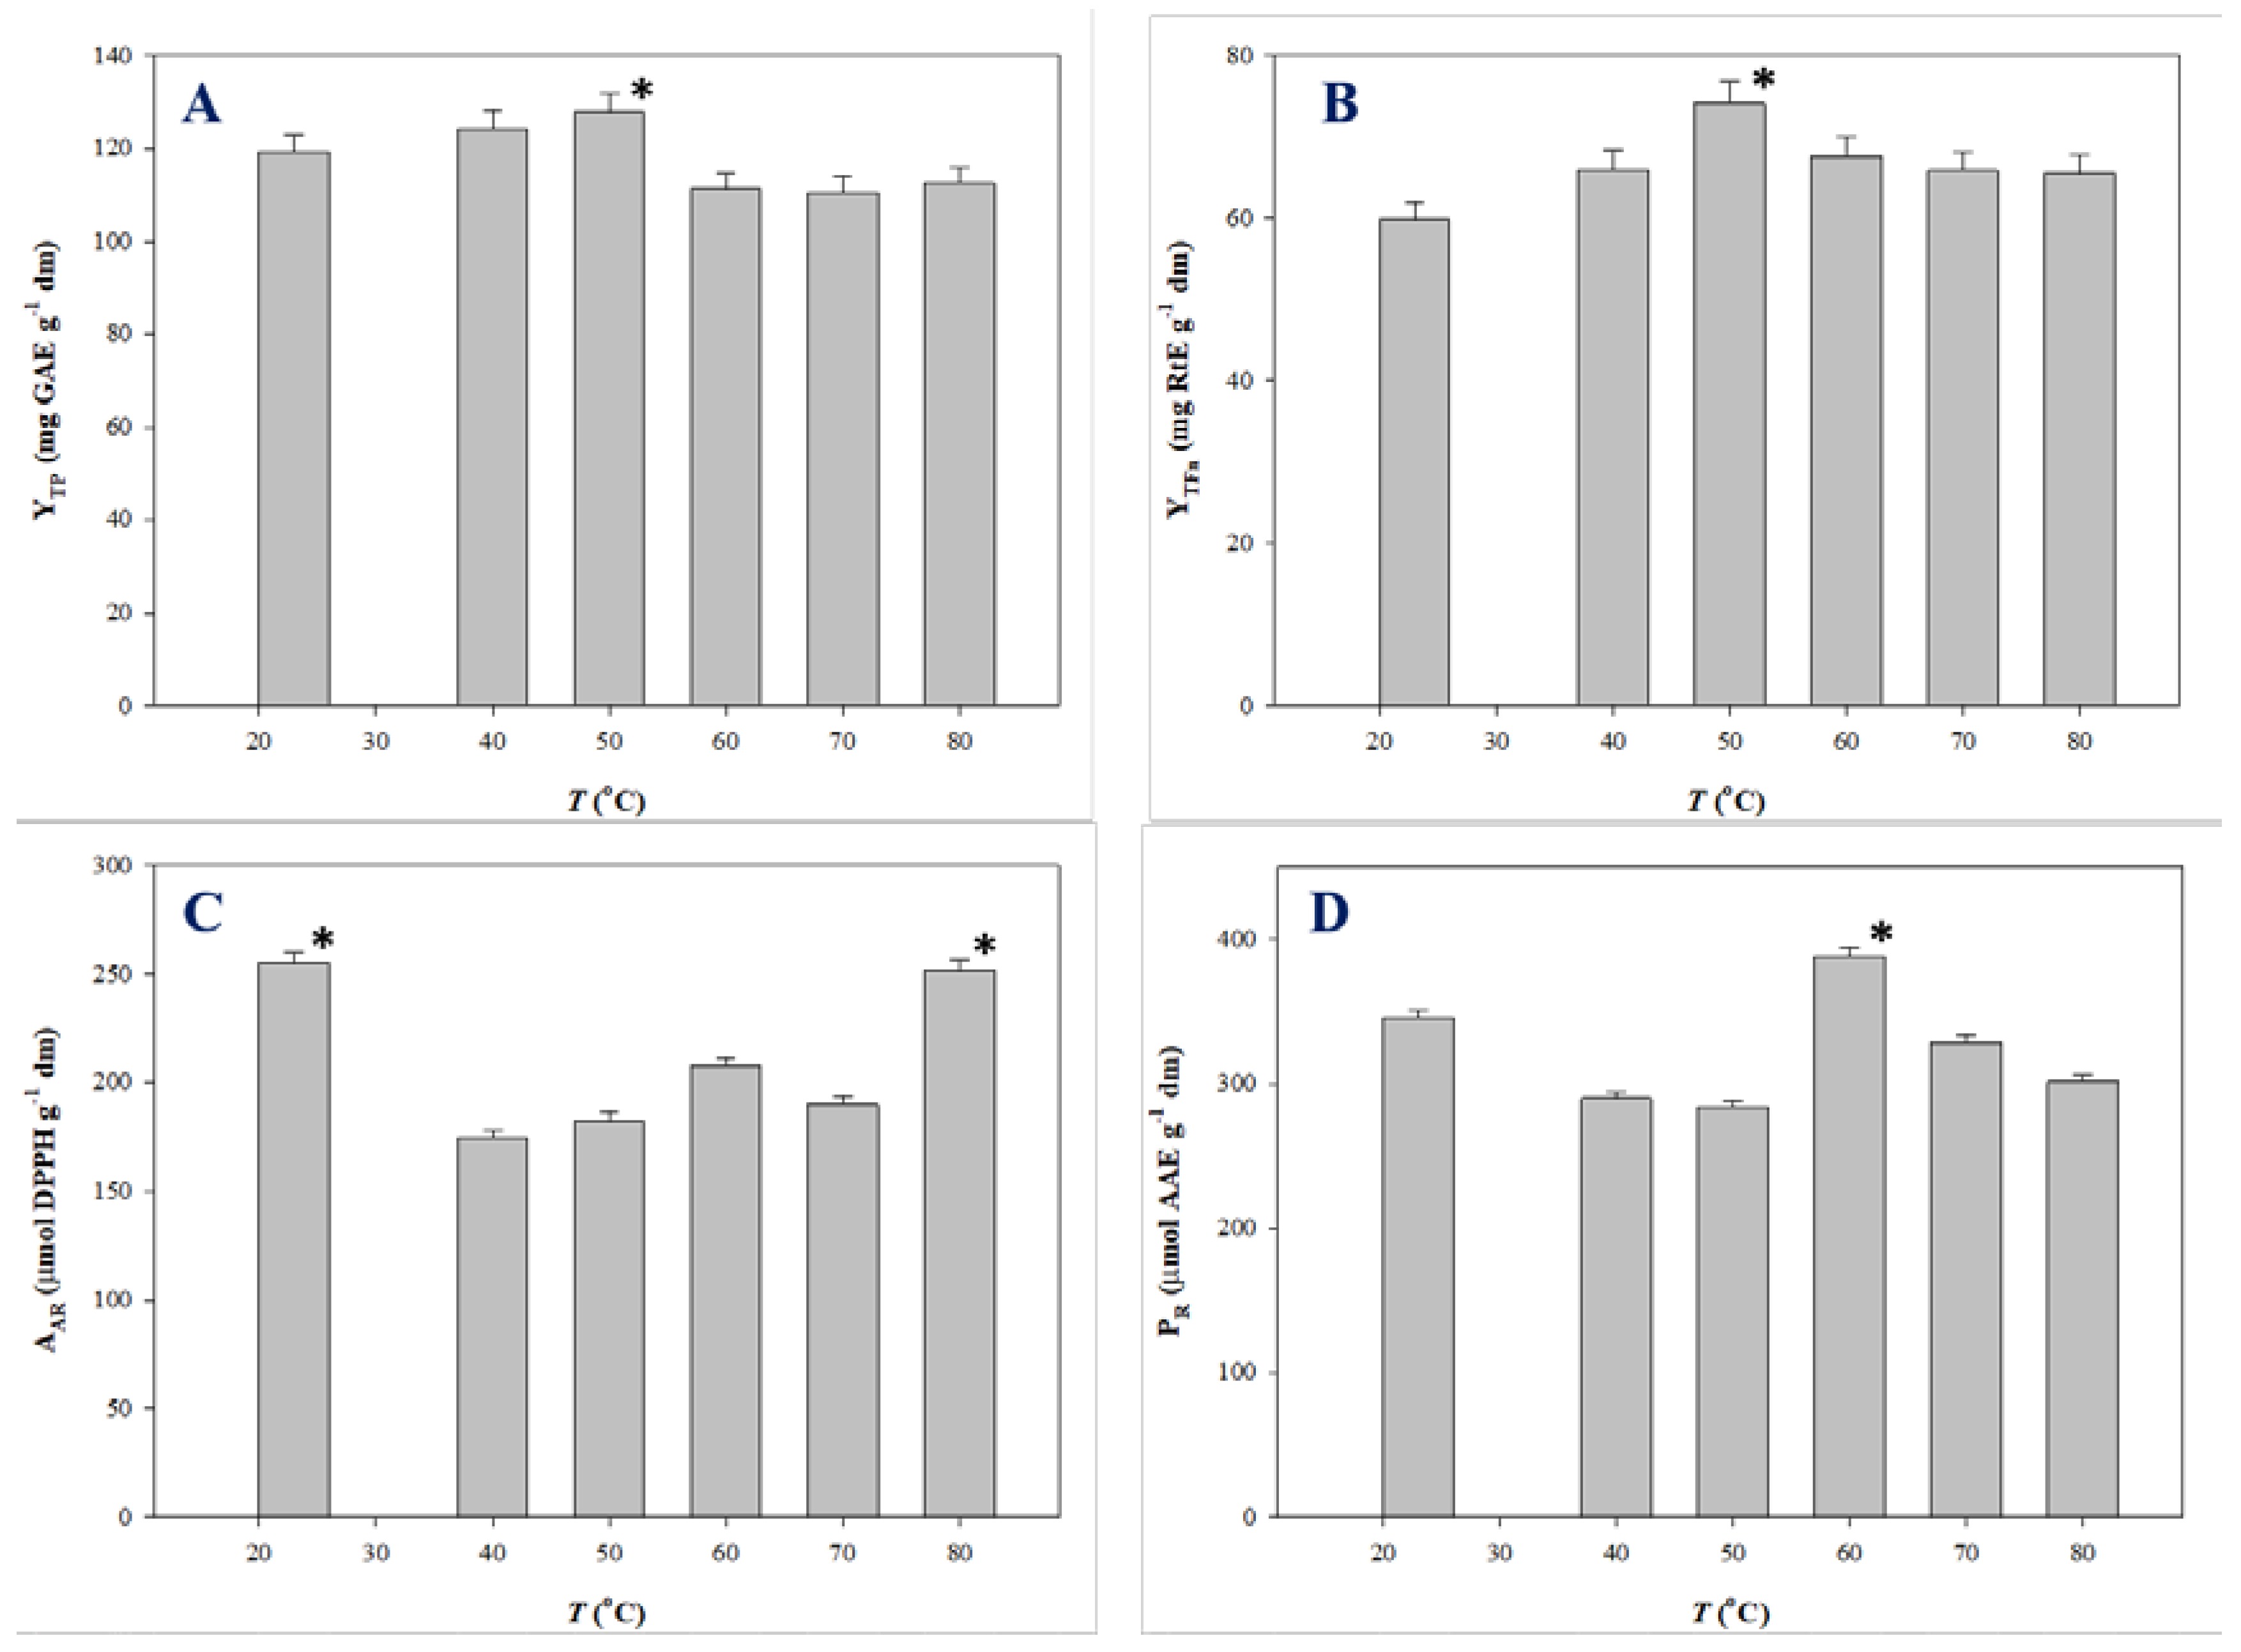
Polyphenols are thermosensitive molecules and in several cases temperature increase does not generate a monotonous effect on the extraction yield and antioxidant activity. Such a behavior was demonstrated for the extraction of onion solid waste [35,36], red grape pomace [37], and Moringa oleifera leaves [25]. Therefore, the impact of temperature on the production of polyphenol-enriched extracts with improved antioxidant characteristics merits thorough investigation. For this reason, extractions under optimal conditions were carried out at temperatures varying from 23 (ambient temperature) to 80 °C, and the extracts produced were assessed by determining YTP, YTFn, AAR, and PR. The outcome of this assay is analytically presented in Figure 4.
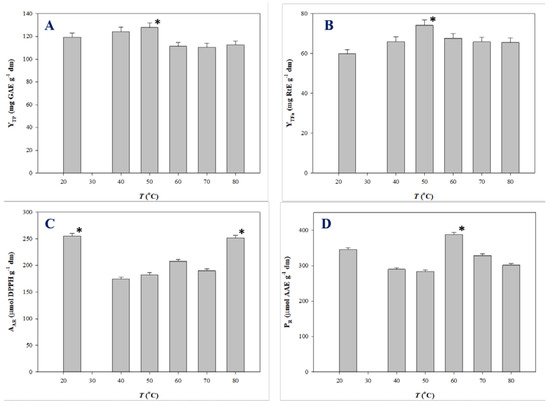
Figure 4.
Variation of YTP (A), YTFn (B), AAR (C), and PR (D) as a function of T. Bars indicate standard deviation. Asterisk (*) denotes statistically different value (p < 0.05).
YTP for SPW extraction peaked at 50 °C (128.03 mg GAE g−1 dm), while a decline was recorded thereafter (Figure 4A). Likewise, maximum YTFn was found at 50 °C (Figure 4B). AAR exhibited fluctuations within a narrow range, the highest AAR being at 23 °C (255.15 μmol DPPH g−1 dm) (Figure 4C). Significant differentiation was seen for the evolution of PR, which gave maximum levels at 60 °C (388.15 μmol AAE g−1 dm) (Figure 4D) Considering all the above parameters, the data obtained suggested that SPW extraction provided polyphenol-enriched extracts with enhanced antioxidant activity at around 50–60 °C. This finding may be evidence of the thermal stability of SPW constituents.
3.5. Polyphenolic Composition
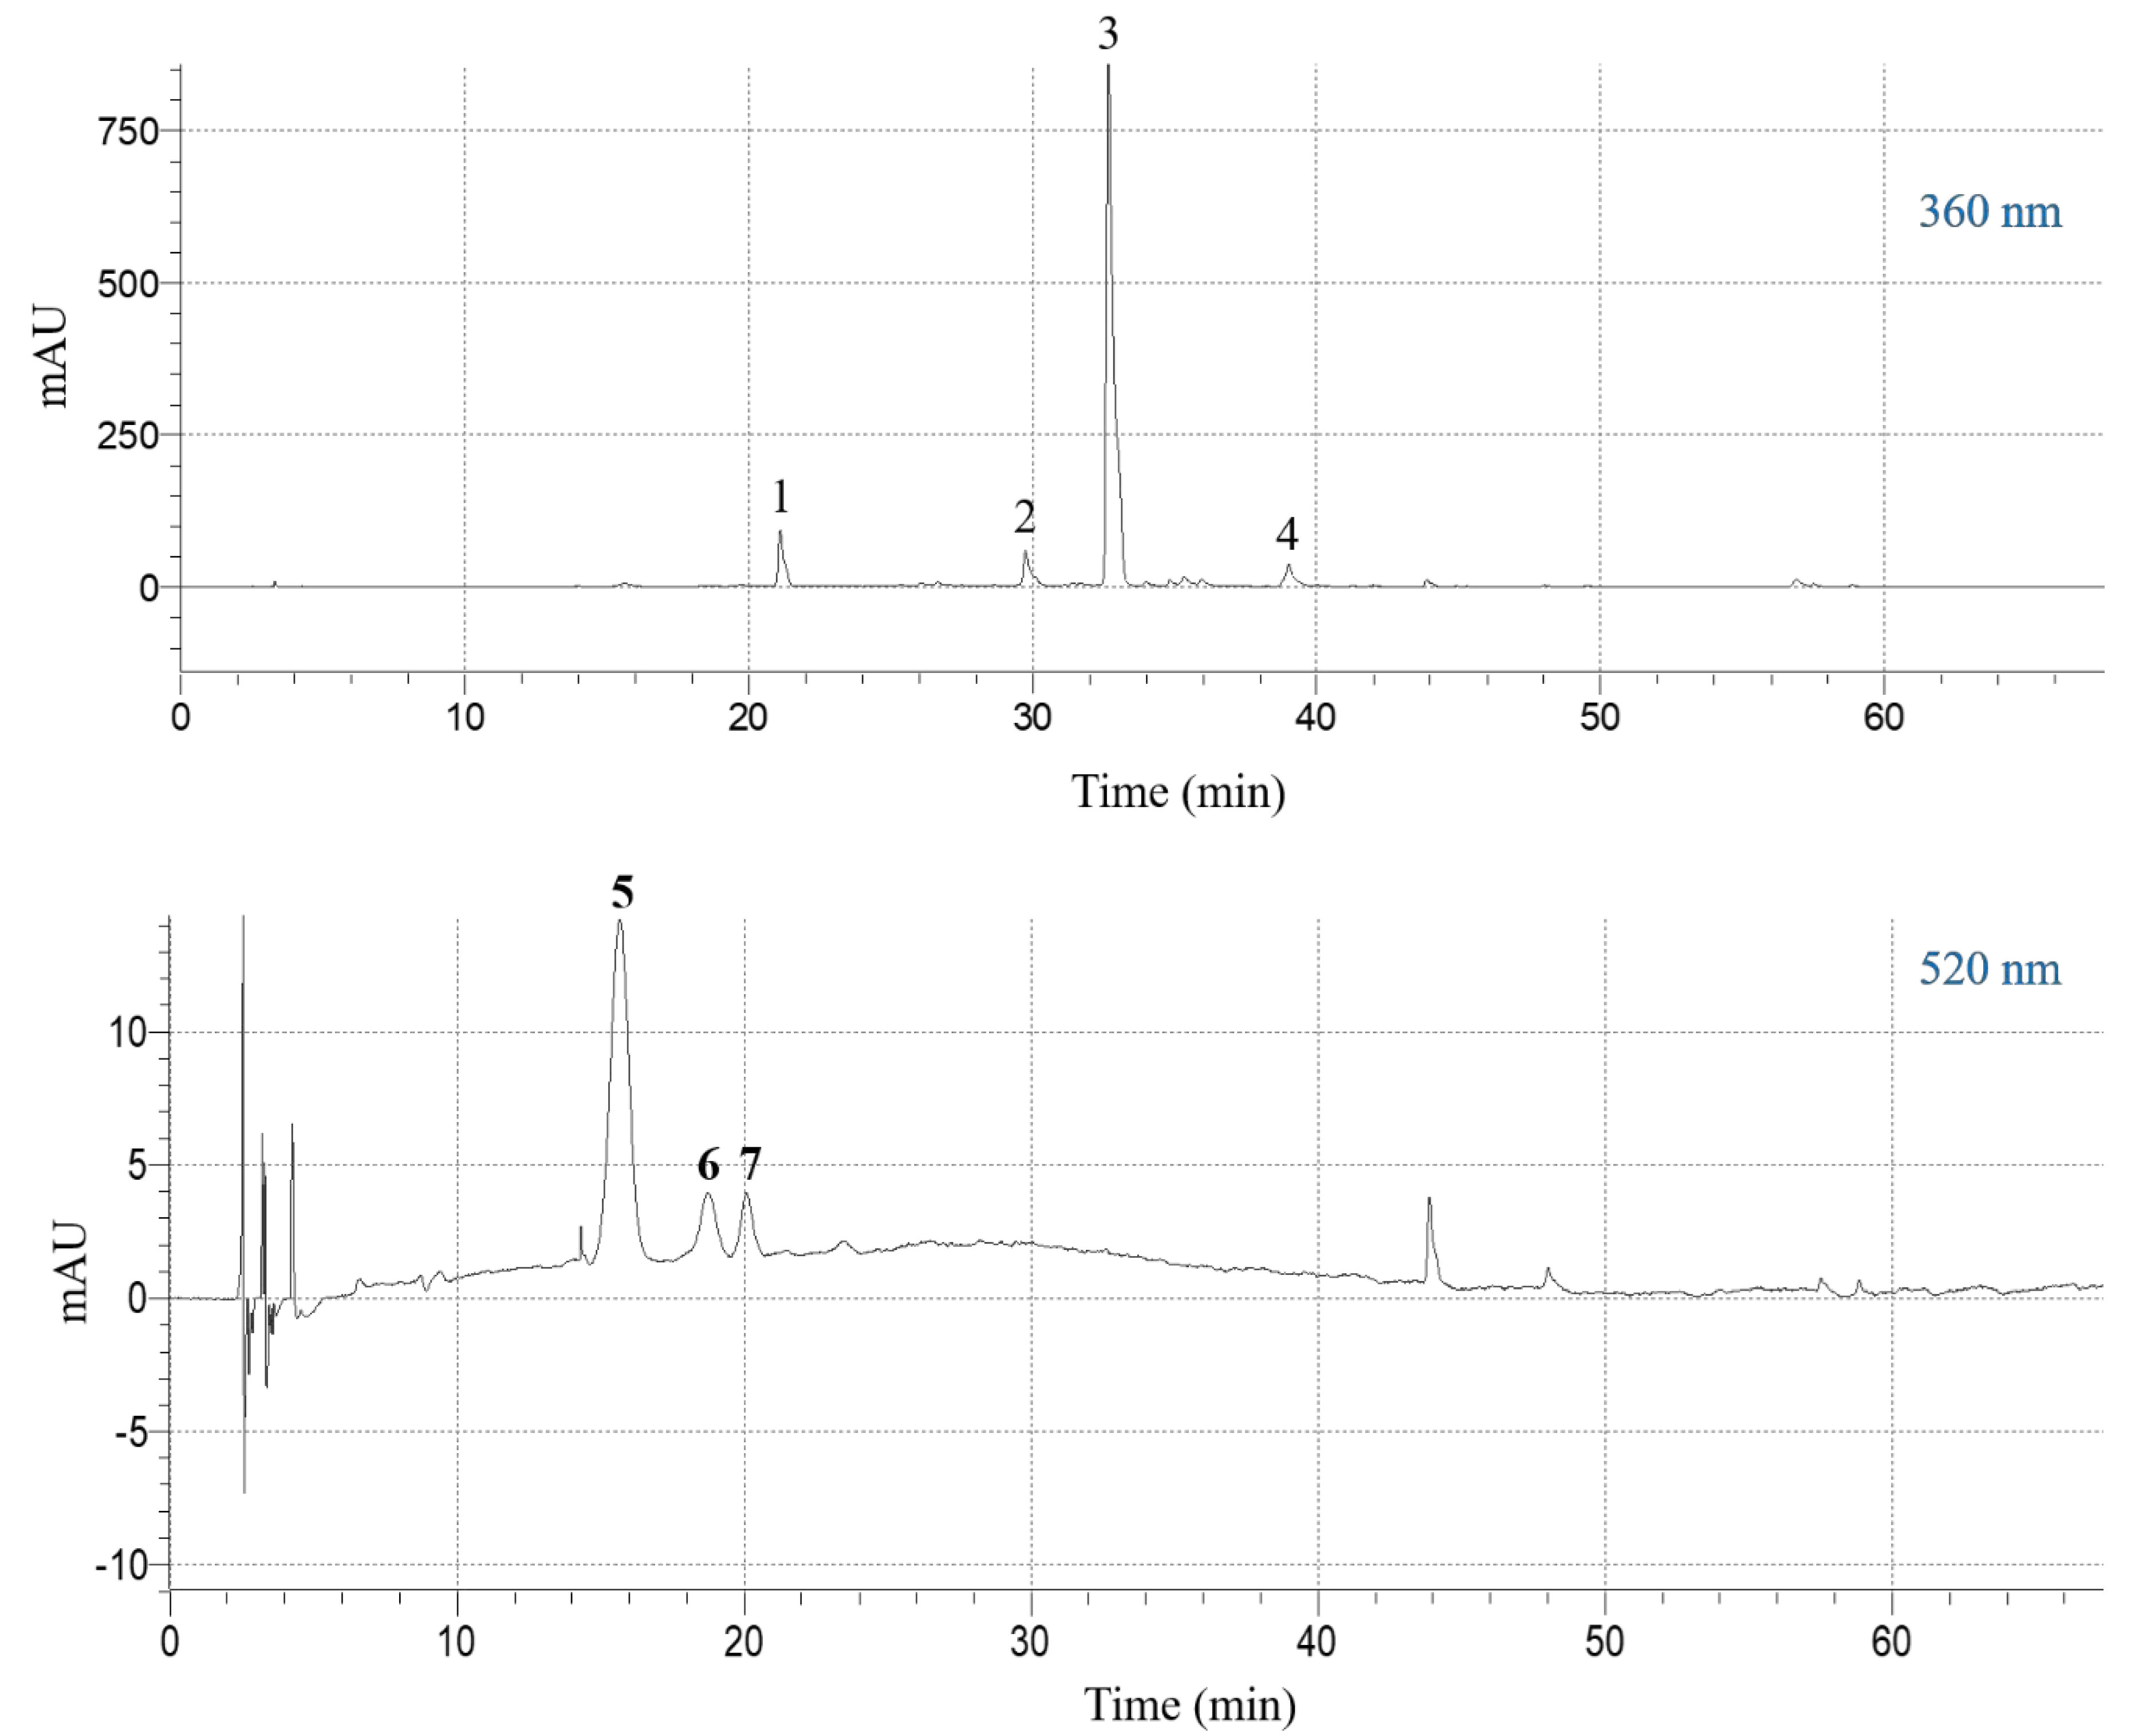
The extract obtained under optimal conditions (CDES = 55% (w/v), RL/S = 60 mL g−1, SS = 800 rpm, T = 50 °C) was analyzed by liquid chromatography-diode array-mass spectrometry, to detect and tentatively identify the major polyphenolic constituents. The compound with retention time (Rt) 15.62 min (peak #5) in the chromatogram monitored at 520 nm (Figure 5), gave a molecular ion at m/z = 627 and a diagnostic fragment at m/z = 465. This peak was identified as delphinidin 3,5-di-O-glucoside (Table 5). Likewise, the peak at 18.72 min (peak #6) yielded a molecular ion at m/z = 641 and a characteristic fragment at m/z = 465, and it was assigned to petunidin 3,5-di-O-glucoside. Finally, the peak with Rt 20.08 min (peak #7) was identified as delphinidin 3-O-glucoside, based on its major peak (m/z = 465) and its fragment at m/z = 303 [38].
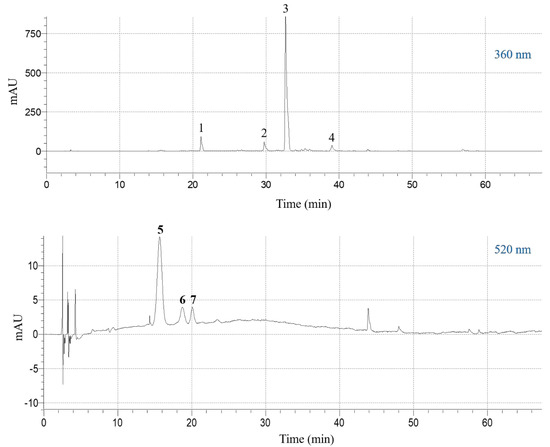
Figure 5.
High-performance liquid chromatography (HPLC) traces of the SPW extract obtained with the DES, under optimal conditions (CDES = 55% (w/v), RL/S = 60 mL g−1, SS = 800 rpm, T = 50 °C). The upper and lower traces were monitored at 360 and 520 nm, respectively. Peak assignment: 1, kaempferol 3-O-sophoroside 7-O-glucoside; 2, quercetin 3-O-sophoroside; 3, kaempferol 3-O-sophoroside; 4, kaempferol 3-O-glucoside; 5, delphinidin 3,5-di-O-glucoside; 6, petunidin 3,5-di-O-glucoside; 7, delphinidin 3-O-glucoside.

Table 5.
Ultraviolet-visual and mass spectrometric data of the major polyphenols detected in the DES extracts of SPW, obtained under optimal conditions.
The chromatogram at 360 nm revealed the existence of four principal constituents (Figure 5). Peak #1 yielded a pseudo-molecular ion at m/z = 773 and three diagnostic fragments at m/z = 611 (loss of glucose) at m/z = 449 (loss of sophorose) and at m/z = 287 (aglycone). This compound was tentatively identified as kaempferol 3-O-sophoroside 7-O-glucoside (Table 5). Similarly, peak #2 gave a pseudo-molecular ion at m/z = 627 and the aglycone ion at m/z = 303 and it was assigned to quercetin 3-O-sophoroside. Peak #3 displayed a pseudo-molecular ion at m/z = 611 and fragments at m/z = 449 (loss of glucose) and m/z = 287 (aglycone), and its structure was assigned to kaempferol 3,7-di-O-glucoside. Peak #4 showed pseudo-molecular and fragment ions at m/z = 449 and 287, respectively, and it was identified as kaempferol 3-O-glucoside [39].
On the ground of the quantitative data presented in Table 6, the flavonol composition of the extract was characterized by relatively high amounts of kaempferol 3-O-sophoroside (36.43 ± 2.55 mg g−1 dm), accompanied by much lower proportions of kaempferol 3-O-sophoroside 7-O-glucoside and quercetin 3-O-sophoroside. Regarding anthocyanins, the profile was dominated by delphinidin 3,5-di-O-glucoside (6.28 ± 0.44 mg g−1 dm). This outcome is in accordance with previous studies [40,41], which showed that the predominant flavonol found in aqueous SPW extract was kaempferol 3-O-sophoroside (30.34 mg g−1 dm), followed by kaempferol 3-O-sophoroside 7-O-glucoside (5.6 mg g−1 dm) and quercetin 3-O-sophoroside (4.01 mg g−1 dm). However, important amounts of delphinidin 3,5-di-O-glucoside (23.19 mg g−1 dm) were determined in ethanolic extract, whereas the aqueous extract was relatively rich in petunidin 3,5-diglucoside (3.97 mg g−1 dm). Data from another investigation were in line, giving values of 12.60 and 3.94 mg g−1 dm, for kaempferol 3-O-sophoroside and delphinidin 3,5-di-O-glucoside, respectively, in water/methanol extracts [38]. Although the polyphenolic composition of SPW could be influenced by the genetic background (variety), the area of origin and sample processing conditions, comparison of the total polyphenol content determined in this study (Table 6) with the values reported in the literature would indicate that SPW extraction with the DES used, under the optimal conditions estimated, an efficient process to produce polyphenol-enriched extracts with important antioxidant activity.

Table 6.
Quantitative values of the major polyphenols detected in the SPW, obtained with the DES under optimal conditions.
4. Conclusions
Saffron processing waste was used as raw material for the recovery of antioxidant polyphenols using a natural deep eutectic solvent composed of L-lactic acid and glycine. It was demonstrated that the HBD:HBA molar ratio can significantly affect extraction yield, hence initial screening of the most appropriate HBD:HBA molar ratio should be a key step in the development of similar processes. Furthermore, the response surface optimization of polyphenol extraction from SPW clearly showed that the proportion of solvent/water, as well as the liquid-to-solid ratio and the stirring speed may crucially affect the extraction performance. Therefore, these variables are to be suitably adjusted in order to maximize extraction yield. Likewise, temperatures higher than 50–60 °C were shown to have a negative impact on the extraction yield, and this is another salient process parameter that should be taken into consideration. SPW extraction under the optimally defined conditions gave extracts rich in polyphenols, the predominant flavonol and anthocyanin being kaempferol 3-O-sophoroside and delphinidin 3,5-di-O-glucoside, respectively. Future work should focus on the stability of SPW extracts in DES, as well as on the bioactivity of the extracts, to fully evaluate their potency as food and cosmetic ingredients and pharmaceutical formulations.
Author Contributions
Conceptualization, S.L. and D.P.M.; formal analysis, A.L., S.G., I.K., O.K., G.B., and E.B.; investigation, A.L., S.G., I.K., O.K., G.B., and E.B.; writing—original draft preparation, S.L. and D.P.M.; writing—review and editing, S.L. and D.P.M.; supervision, S.L. and D.P.M.
Funding
This research was co-financed by the European Union and the Hellenic Ministry of Economy and Development through the Operational Programme Competitiveness, Entrepreneurship and Innovation, under the call RESEARCH—CREATE—INNOVATE (project code: T1EDK-05677).
Acknowledgments
Nektarios Vlahos (Petrana, Kozani) is thanked for providing the saffron processing waste.
Conflicts of Interest
The authors declare no conflict of interest.
Nomenclature
| AAR | antiradical activity (μmol DPPH g−1) |
| PR | reducing power (μmol AAE g−1) |
| RL/S | liquid-to-solid ratio (mL g−1) |
| t | time (min) |
| T | temperature (°C) |
| YTFn | yield in total flavonoids (mg RtE g−1) |
| YTP | yield in total polyphenols (mg GAE g−1) |
| Abbreviations | |
| AAE | ascorbic acid equivalents |
| DES | deep eutectic solvents |
| DPPH | 2,2-diphenyl-1-picrylhydrazyl radical |
| GAE | gallic acid equivalents |
| HBA | hydrogen bond acceptor |
| HBD | hydrogen bond donor |
| TPTZ | 2,4,6-tripyridyl-s-triazine |
References
- Banerjee, J.; Singh, R.; Vijayaraghavan, R.; MacFarlane, D.; Patti, A.F.; Arora, A. Bioactives from fruit processing wastes: Green approaches to valuable chemicals. Food Chem. 2017, 225, 10–22. [Google Scholar] [CrossRef] [PubMed]
- Makris, D.P.; Boskou, D. Plant-Derived Antioxidants as Food Additives. In Plants as a Source of Natural Antioxidants; CABI Publ.: Oxfordshire, UK, 2014; pp. 169–190. [Google Scholar]
- Shahidi, F.; Varatharajan, V.; Oh, W.Y.; Peng, H. Phenolic compounds in agri-food by-products, their bioavailability and health effects. J. Food Bioact 2019, 5, 57–119. [Google Scholar] [CrossRef]
- Chemat, F.; Abert Vian, M.; Ravi, H.K.; Khadhraoui, B.; Hilali, S.; Perino, S.; Tixier, A.S.F. Review of alternative solvents for green extraction of food and natural products: Panorama, principles, applications and prospects. Molecules 2019, 24, 3007. [Google Scholar] [CrossRef] [PubMed]
- Florindo, C.; Lima, F.; Ribeiro, B.D.; Marrucho, I.M. Deep eutectic solvents: Overcoming XXI century challenges. Cur. Opin. Green Sustain. Chem. 2018. [Google Scholar] [CrossRef]
- Bubalo, M.C.; Vidović, S.; Redovniković, I.R.; Jokić, S. New perspective in extraction of plant biologically active compounds by green solvents. Food Bioprod. Process. 2018, 109, 52–73. [Google Scholar] [CrossRef]
- Li, Y.; Kunz, W.; Chemat, F. From Petroleum to Bio-Based Solvents: From Academia to Industry. In Plant Based “Green Chemistry 2.0”; Springer: Berlin/Heidelberg, Germany, 2019; pp. 51–87. [Google Scholar]
- Ghaffari, S.; Roshanravan, N. Saffron; An updated review on biological properties with special focus on cardiovascular effects. Biomed. Pharmacother. 2019, 109, 21–27. [Google Scholar] [CrossRef]
- Moratalla-López, N.; Bagur, M.J.; Lorenzo, C.; Salinas, M.; Alonso, G.L. Bioactivity and bioavailability of the major metabolites of Crocus sativus L. Flower. Molecules 2019, 24, 2827. [Google Scholar] [CrossRef]
- Ahmadian-Kouchaksaraie, Z.; Niazmand, R.; Najafi, M.N. Optimization of the subcritical water extraction of phenolic antioxidants from Crocus sativus petals of saffron industry residues: Box-Behnken design and principal component analysis. Innov. Food Sci. Emerg. Technol. 2016, 36, 234–244. [Google Scholar] [CrossRef]
- Da Porto, C.; Natolino, A. Extraction kinetic modelling of total polyphenols and total anthocyanins from saffron floral bio-residues: Comparison of extraction methods. Food Chem. 2018, 258, 137–143. [Google Scholar] [CrossRef]
- Ahmadian-Kouchaksaraie, Z.; Niazmand, R. Supercritical carbon dioxide extraction of antioxidants from Crocus sativus petals of saffron industry residues: Optimization using response surface methodology. J. Supercrit. Fluids 2017, 121, 19–31. [Google Scholar] [CrossRef]
- Lotfi, L.; Kalbasi-Ashtari, A.; Hamedi, M.; Ghorbani, F. Effects of enzymatic extraction on anthocyanins yield of saffron tepals (Crocus sativus) along with its color properties and structural stability. J. Food Drug Anal. 2015, 23, 210–218. [Google Scholar] [CrossRef]
- Mouratoglou, E.; Malliou, V.; Makris, D.P. Novel glycerol-based natural eutectic mixtures and their efficiency in the ultrasound-assisted extraction of antioxidant polyphenols from agri-food waste biomass. Waste Biomass Valorization 2016, 7, 1377–1387. [Google Scholar] [CrossRef]
- Lakka, A.; Karageorgou, I.; Kaltsa, O.; Batra, G.; Bozinou, E.; Lalas, S.; Makris, D. Polyphenol extraction from Humulus lupulus (hop) using a neoteric glycerol/L-alanine deep eutectic solvent: Optimisation, kinetics and the effect of ultrasound-assisted pretreatment. AgriEngineering 2019, 1, 403–417. [Google Scholar] [CrossRef]
- Bezerra, M.A.; Santelli, R.E.; Oliveira, E.P.; Villar, L.S.; Escaleira, L.A. Response surface methodology (RSM) as a tool for optimization in analytical chemistry. Talanta 2008, 76, 965–977. [Google Scholar] [CrossRef] [PubMed]
- Cicco, N.; Lanorte, M.T.; Paraggio, M.; Viggiano, M.; Lattanzio, V. A reproducible, rapid and inexpensive Folin–Ciocalteu micro-method in determining phenolics of plant methanol extracts. Microchem. J. 2009, 91, 107–110. [Google Scholar] [CrossRef]
- Manousaki, A.; Jancheva, M.; Grigorakis, S.; Makris, D. Extraction of antioxidant phenolics from agri-food waste biomass using a newly designed glycerol-based natural low-transition temperature mixture: A comparison with conventional eco-friendly solvents. Recycling 2016, 1, 194–204. [Google Scholar] [CrossRef]
- Paleologou, I.; Vasiliou, A.; Grigorakis, S.; Makris, D.P. Optimisation of a green ultrasound-assisted extraction process for potato peel (Solanum tuberosum) polyphenols using bio-solvents and response surface methodology. Biomass Convers. Biorefin. 2016, 6, 289–299. [Google Scholar] [CrossRef]
- Sadek, E.S.; Makris, D.P.; Kefalas, P. Polyphenolic composition and antioxidant characteristics of kumquat (Fortunella margarita) peel fractions. Plant Foods Hum. Nutr. 2009, 64, 297. [Google Scholar] [CrossRef]
- Bakirtzi, C.; Triantafyllidou, K.; Makris, D.P. Novel lactic acid-based natural deep eutectic solvents: Efficiency in the ultrasound-assisted extraction of antioxidant polyphenols from common native Greek medicinal plants. J. Appl. Res. Med. Aromat. Plants 2016, 3, 120–127. [Google Scholar] [CrossRef]
- Kottaras, P.; Koulianos, M.; Makris, D. Low-Transition temperature mixtures (LTTMs) made of bioorganic molecules: Enhanced extraction of antioxidant phenolics from industrial cereal solid wastes. Recycling 2017, 2, 3. [Google Scholar] [CrossRef]
- Cui, Q.; Liu, J.Z.; Wang, L.T.; Kang, Y.F.; Meng, Y.; Jiao, J.; Fu, Y.J. Sustainable deep eutectic solvents preparation and their efficiency in extraction and enrichment of main bioactive flavonoids from sea buckthorn leaves. J. Clean. Prod. 2018, 184, 826–835. [Google Scholar] [CrossRef]
- Huang, Y.; Feng, F.; Jiang, J.; Qiao, Y.; Wu, T.; Voglmeir, J.; Chen, Z.G. Green and efficient extraction of rutin from tartary buckwheat hull by using natural deep eutectic solvents. Food Chem. 2017, 221, 1400–1405. [Google Scholar] [CrossRef]
- Karageorgou, I.; Grigorakis, S.; Lalas, S.; Makris, D.P. Enhanced extraction of antioxidant polyphenols from Moringa oleifera Lam. leaves using a biomolecule-based low-transition temperature mixture. Eur. Food Res. Technol. 2017, 243, 1839–1848. [Google Scholar] [CrossRef]
- Athanasiadis, V.; Grigorakis, S.; Lalas, S.; Makris, D.P. Highly efficient extraction of antioxidant polyphenols from Olea europaea leaves using an eco-friendly glycerol/glycine deep eutectic solvent. Waste Biomass Valorization 2018, 9, 1985–1992. [Google Scholar] [CrossRef]
- Liu, Y.; Friesen, J.B.; McAlpine, J.B.; Lankin, D.C.; Chen, S.N.; Pauli, G.F. Natural deep eutectic solvents: Properties, applications, and perspectives. J. Nat. Prod. 2018, 81, 679–690. [Google Scholar] [CrossRef] [PubMed]
- Dai, Y.; Witkamp, G.J.; Verpoorte, R.; Choi, Y.H. Tailoring properties of natural deep eutectic solvents with water to facilitate their applications. Food Chem. 2015, 187, 14–19. [Google Scholar] [CrossRef] [PubMed]
- Shewale, S.; Rathod, V.K. Extraction of total phenolic content from Azadirachta indica or (neem) leaves: Kinetics study. Prep. Biochem. Biotechnol. 2018, 48, 312–320. [Google Scholar] [CrossRef]
- Adjé, F.; Lozano, Y.F.; Lozano, P.; Adima, A.; Chemat, F.; Gaydou, E.M. Optimization of anthocyanin, flavonol and phenolic acid extractions from Delonix regia tree flowers using ultrasound-assisted water extraction. Ind. Crop. Prod. 2010, 32, 439–444. [Google Scholar] [CrossRef]
- Vetal, M.D.; Lade, V.G.; Rathod, V.K. Extraction of ursolic acid from Ocimum sanctum leaves: Kinetics and modeling. Food Bioprod. Process. 2012, 90, 793–798. [Google Scholar] [CrossRef]
- Jancheva, M.; Grigorakis, S.; Loupassaki, S.; Makris, D.P. Optimised extraction of antioxidant polyphenols from Satureja thymbra using newly designed glycerol-based natural low-transition temperature mixtures (LTTMs). J. Appl. Res. Med. Aromat. Plants 2017, 6, 31–40. [Google Scholar] [CrossRef]
- Dedousi, M.; Mamoudaki, V.; Grigorakis, S.; Makris, D. Ultrasound-assisted extraction of polyphenolic antioxidants from olive (Olea europaea) leaves using a novel glycerol/sodium-potassium tartrate low-transition temperature mixture (LTTM). Environments 2017, 4, 31. [Google Scholar] [CrossRef]
- Slim, Z.; Jancheva, M.; Grigorakis, S.; Makris, D.P. Polyphenol extraction from Origanum dictamnus using low-transition temperature mixtures composed of glycerol and organic salts: Effect of organic anion carbon chain length. Chem. Eng. Commun. 2018, 205, 1494–1506. [Google Scholar] [CrossRef]
- Khiari, Z.; Makris, D.P.; Kefalas, P. An investigation on the recovery of antioxidant phenolics from onion solid wastes employing water/ethanol-based solvent systems. Food Bioprocess Technol. 2009, 2, 337. [Google Scholar] [CrossRef]
- Katsampa, P.; Valsamedou, E.; Grigorakis, S.; Makris, D.P. A green ultrasound-assisted extraction process for the recovery of antioxidant polyphenols and pigments from onion solid wastes using Box–Behnken experimental design and kinetics. Ind. Crop. Prod. 2015, 77, 535–543. [Google Scholar] [CrossRef]
- Patsea, M.; Stefou, I.; Grigorakis, S.; Makris, D.P. Screening of natural sodium acetate-based low-transition temperature mixtures (LTTMs) for enhanced extraction of antioxidants and pigments from red vinification solid wastes. Environ. Process. 2017, 4, 123–135. [Google Scholar] [CrossRef]
- Goupy, P.; Vian, M.A.; Chemat, F.; Caris-Veyrat, C. Identification and quantification of flavonols, anthocyanins and lutein diesters in tepals of Crocus sativus by ultra performance liquid chromatography coupled to diode array and ion trap mass spectrometry detections. Ind. Crop. Prod. 2013, 44, 496–510. [Google Scholar] [CrossRef]
- Tuberoso, C.I.; Rosa, A.; Montoro, P.; Fenu, M.A.; Pizza, C. Antioxidant activity, cytotoxic activity and metabolic profiling of juices obtained from saffron (Crocus sativus L.) floral by-products. Food Chem. 2016, 199, 18–27. [Google Scholar] [CrossRef]
- Cusano, E.; Consonni, R.; Petrakis, E.A.; Astraka, K.; Cagliani, L.R.; Polissiou, M.G. Integrated analytical methodology to investigate bioactive compounds in Crocus sativus L. flowers. Phytochem. Anal. 2018, 29, 476–486. [Google Scholar] [CrossRef]
- Serrano-Díaz, J.; Estevan, C.; Sogorb, M.Á.; Carmona, M.; Alonso, G.L.; Vilanova, E. Cytotoxic effect against 3T3 fibroblasts cells of saffron floral bio-residues extracts. Food Chem. 2014, 147, 55–59. [Google Scholar] [CrossRef]
© 2019 by the authors. Licensee MDPI, Basel, Switzerland. This article is an open access article distributed under the terms and conditions of the Creative Commons Attribution (CC BY) license (http://creativecommons.org/licenses/by/4.0/).

