Article

Electrochemical Measures for Determining the Total Antioxidant Capacity of Açaí Pulp (Euterpe oleracea) at a Glassy Carbon Electrode

by
Tabata N. Feijoó
1,
Luis D. Loor-Urgilés
1,
Danyelle M. de Araújo
1,
Elisama V. dos Santos
1,
Marília Oliveira Fonseca Goulart
2 and
Carlos A. Martínez-Huitle
1,*
1
Renewable Energies and Environmental Sustainability Research Group, Institute of Chemistry, Federal University of Rio Grande do Norte, Lagoa Nova, Natal CEP 59078-970, RN, Brazil
2
Instituto de Química e Biotecnologia, Universidade Federal de Alagoas, Av. Lourival Melo Mota s/n, Campus Universitário, Tabuleiro do Martins, Maceio CEP 57072-970, AL, Brazil
*
Author to whom correspondence should be addressed.
Antioxidants 2025, 14(9), 1082; https://doi.org/10.3390/antiox14091082
Submission received: 29 May 2025 / Revised: 27 August 2025 / Accepted: 28 August 2025 / Published: 3 September 2025
(This article belongs to the Special Issue The Electrochemical Tentacles of Oxidative Stress)

Abstract

Antioxidants, such as flavonoids, are influential secondary metabolites that play a significant role in regulating human health. Açaí, known for its potent antioxidant properties, has gained popularity in the nutritional field. However, there is a need for accurate methods to quantify its antioxidant capacity. Therefore, the goal of this investigation was to determine the total antioxidant capacity of frozen açaí pulp by applying the concept of the electrochemical quantitative index (EQI) using the cyclic voltammetry technique. The electrochemical response of ethanolic extracts obtained by a nonconventional ultrasound bath was investigated in the anodic region. The results clearly showed redox behavior at +0.37 V and +0.27 V (vs. Ag/AgCl) for the anodic and cathodic peaks, respectively, when evaluated by cyclic voltammetry at a glassy carbon (GC) electrode. By investigating a constant ethanolic extract concentration (0.2%) and analyzing the scan rate and supporting electrolyte effects, it was determined that the frozen açaí pulp extract presented an EQI of about 2.3 µA/V. Similarly, the concept of the EQI was extended to the use of the differential pulse voltammetry profile of a 0.2% ethanolic açaí extract on different supporting electrolytes, which showed that some experimental conditions needed improvement. Still, maintaining pH with a buffer solution in the anodic region is crucial to ensure reproducibility. The antioxidant capacity was also determined using the 2,2-diphenyl-1-picrylhydrazyl (DPPH) free radical assay to compare the electrochemical results. The Folin–Ciocalteu colorimetric test was applied to determine the total phenolic content of the extract.

Graphical Abstract

1. Introduction

The berry fruit açaí is touted as a “superfruit” due to its high content of antioxidants in both the pulp and the seed. Depending on the area and cultural setting, this plant is referred to as acai, huasaí, or naidí [1,2,3], and it grows mainly along the Amazon River in the states of Pará, Amazonas, and Bahia (Figure 1A), providing a significant economic impact on the rainforest region due to its high demand throughout the country and the whole world. However, around 85% of the fruit is discarded after pulping, as only 15% of the fruit corresponds to the pulp and is utilized for human consumption in the form of juice, energy drinks, açaí bowls, ice creams, and other products. Due to açaí’s high popularity and consumption, roughly 1.7 million tons of berries was collected in 2022, of which 8200 tons was destined for exportation and the rest for local consumption, which means that Brazil generated close to USD 1.16 million from the annual production of açaí alone [2,4]. During this industrial process, significant amounts of commercial products and residues are produced. Then, the identification of new chemical features and applications of açaí, as well as the recovery of nutrients from its residues and their valorization, are promising approaches to promote the transition from the current economy to a circular one.
In general, the health-promoting antioxidant impact of red fruits [5,6,7] like açaí is attributed to their rich content of flavonoids such as catechin, quercetin, and anthocyanins (Figure 1B), which are highly conjugated phenolic compounds produced biosynthetically from phenylalanine. These bioactive compounds, or low-molecular-weight secondary metabolites, primarily act as reducing agents against radical species due to their structural functionality, which enables their stability and shields cells from oxidative damage [8]. There are other indirect mechanistic possibilities for their action as antioxidants, such as the chelation of metallic ions, which limits the availability of metal ions that catalyze harmful reactions [9,10,11,12]. This characteristic is attributed to the oxidation of hydroxyl groups, primarily in the B ring of the flavonoid nucleus (Figure 1B); thus, the number and molecular position of -OH groups influence the antioxidant capacity of samples [13]. The succeeding antioxidant free radical breaks the chain reaction and stops the creation of additional free radicals due to the stability brought about by the flavonoids/other phytochemicals’ radical delocalization.
In this context, investigating the antioxidant potential in natural food matrices is highly relevant, particularly when considering the growing interest in functional foods and clean-label products. Recently, various electrochemical techniques have garnered increased attention as tools for in vitro and in situ investigations related to the determination of the total antioxidant capacity of several fruits, foods, and plant extracts. The application of electrochemical methodologies is made possible by the ability of electrode materials or oxidant compounds to donate or receive electrons [14,15]. Nevertheless, the evaluation of an antioxidant’s capacity by electrochemical methods is often achieved by collecting information regarding its performance in a specific environment, even though its activity involves several mechanisms that do not depend on a single direct process [16,17]. Therefore, electrochemical assays are not universally accepted as reliable techniques, even when the results reported in the existing literature are comparable to those obtained using traditional methods to determine antioxidant activity. Indeed, there is no widely adopted “total antioxidant parameter” as a nutritional index for labeling food and biological fluids. Concerning electron transfer (ET)-based methods for analytical, food chemical, biomedical/clinical, and environmental scientific communities, they can be effectively used to meet specific communities’ needs.
Within this framework, different studies have demonstrated that the electrochemical quantitative index (EQI), mainly achieved by cyclic voltammetry, can be correlated with total antioxidant capacity in ET-based processes, with a confidence [18,19,20,21,22] similar to other traditional methods (spectrophotometric and chromatographic). Electroanalytical approaches can be considered fast methods and hold certain advantages over conventional ones; for instance, they can be selective depending on the properties of the electrode used and the experimental conditions. In the case of electrode materials, they can achieve low detection limits by using small sample amounts [14,23,24], with highly reproducible responses, compactness, low cost, selectivity, sensitivity, portability, and multiplexed and in situ analysis for different inorganic/organic compounds. Nevertheless, some disadvantages can be considered, such as an inability to identify the structure of compounds, which is also a limitation of other methods. However, it is possible to integrate instrumental methods, such as liquid chromatography combined with mass spectrometry (LC-MS). With these hybrid techniques, they become superior due to their lower detection limits and higher sensitivity and accuracy [25]. Despite this, electrochemical techniques are still beneficial in analytical chemistry due to their robustness, affordability, and adaptable nature, providing essential data where some optical and advanced methods may fall short. Therefore, further investigations should be conducted to introduce these strategies into antioxidant research.
Research has been extended to the applicability of other voltammetric analyses, such as differential pulse (DPV) and square wave (SWV) voltammetries, which are electrochemical techniques widely used to collect both the qualitative and quantitative profiles of redox compounds [26], including the mechanisms and kinetics of electron transfer reactions [27]. This information prompts us to explore the feasibility of determining the antioxidant capacity of an ethanolic extract from commercial açaí pulp based on the EQI by measuring the anodic current and potential in CV and DPV using a glassy carbon (GC) electrode.
The commercial açaí pulps used in this study correspond to minimally processed, frozen food-grade products intended for direct human consumption, representing complex natural matrices. To better understand their electrochemical behavior, we investigated the impact of extract concentrations at different scan rates and with various supporting electrolytes, including phosphate buffer solution, sodium chloride, and sodium nitrate, in natural complex samples. Finally, the results were compared with those obtained from the DPPH free radical assay and the Folin–Ciocalteu test to obtain the total phenolic content of the ethanolic extract.
The present study contributes to the growing body of knowledge on the electrochemical determination of antioxidants by exploring its application to commercial açaí pulps, providing insights into their redox behavior under various electrolytic conditions, and evaluating the technique’s analytical potential in natural food matrices.

2. Materials

Chemical Reagents

Monobasic sodium phosphate NaH2PO4 (Sigma-Aldrich, São Paulo, Brazil), dibasic sodium phosphate Na2HPO4 (Dinâmica® Ltda, São Paulo, Brazil), sodium chloride NaCl (Dinâmica® Ltda, São Paulo, Brazil), sodium nitrate NaNO3 (Synth, São Paulo, Brazil), sodium carbonate Na2CO3 (Dinâmica® Ltda, São Paulo, Brazil), gallic acid C7H6O5 (Sigma-Aldrich, São Paulo, Brazil), and ethanol EtOH (Atriom, São Paulo, Brazil) were used. All solutions were prepared with Milli-Q ultra-purified distilled water (resistivity ≥ 18.2 MΩ cm, Millipore at 25 °C) and used without further purification. The stable free radical 2,2-diphenyl-1-picrylhydrazyl (DPPH) was obtained from Sigma-Aldrich (São Paulo, Brazil), and the Folin–Ciocalteu reagent was obtained from Êxodo Científica (São Paulo, Brazil).

3. Methodology

3.1. Extraction and Sample Preparation

Commercially preserved açaí pulp (47.77 g), purchased from the brand Pé de Fruta® (Paraíba, Brazil), was thawed at room temperature and extracted with 10 mL of EtOH 99% in an ultrasonic bath for 15 min, as already reported in the existing literature [21]. The crude material was then centrifuged (NT 810, Novatecnica, Piracicaba, Brazil) at 1000 rpm for 10 min and filtered through an 8 µm pore size filtration paper. No solid residue was obtained from the commercial açaí pulp, which was a fine powder. The sample was stored at −18 °C, after which a 100 µL aliquot was added to the supporting electrolytes, resulting in a total volume of 25 mL and a 0.2% extract concentration for all electrochemical assays. Extraction and sample preparation was performed 48 h before each experiment in the absence of light at room temperature (20 °C).

3.2. Total Phenolic Content (TPC)

The total phenolic content of the ethanolic extract was determined using the Folin–Ciocalteu colorimetric method, following the procedure described by Costa et al., 2024 [28], with slight modifications. Briefly, 0.1 mL of the ethanolic extract was mixed with 6 mL of ultrapure Milli-Q water and 0.5 mL of Folin–Ciocalteu reagent. After 8 min, 1.5 mL of 7.5% (w/v) Na2CO3 solution was added, and the volume was adjusted to 10 mL with ultrapure Milli-Q water. The mixture was kept in the dark at room temperature for 120 min. After the reaction was completed, the resulting solution was diluted 1:10 with ultrapure water, and absorbance was measured at 765 nm using a Thermo Fisher Scientific Model Genesys 180 spectrophotometer (Waltham, MA, USA). A calibration curve was constructed using gallic acid as the standard (0–100 mg mL−1), and the results are expressed as mg of gallic acid equivalents per mL of extract (mg GAE mL−1) and as mg GAE g−1 of fresh pulp.

3.3. DPPH Assay

The antioxidant capacity of açaí was determined by radical scavenging using the DPPH method. Aliquots of 0.30 mL of the extract dissolved in ethanol (0.2% of ethanolic extract) were mixed with 2.7 mL of DPPH solution (40 µg mL−1 in methanol) [29]. The mixture was then homogenized and stored in the dark for 30 min, and measurements were performed at 517 nm using a UV-Vis spectrophotometer (Shimadzu UV 1800, Berlin, Germany). The analyses were performed in triplicate (n = 3) and the percentage inhibition or the EC50 (half maximal inhibitory concentration, which represents antioxidant capacity or antioxidant power) was calculated graphically using an analytical curve in the linear range, plotting the extract concentration versus the corresponding scavenging effect Equation (1) at 30 min [29].
DPPH scavenger effect or EC50 (%) = [(A0 − A1)/A0] × 100
where A0 and A1 correspond to the absorbance at λ = 517 nm of the DPPH radical in the absence and the presence of the antioxidant, respectively [29].

3.4. Electrochemical Assays

All electrochemical measurements were performed in a single-compartment electrochemical cell using the potentiostat/galvanostat model PGSTAT302N. A GC electrode with a 3.0 mm diameter (area = 7.1 mm2) served as the working electrode, while Ag/AgCl (3 M KCl) and a platinum wire were used as the reference and counter electrodes, respectively. Different supporting electrolytes (SEs) were tested, such as NaCl (0.1 M) and NaNO3 (0.1 M), with the pH adjusted using a phosphate buffer solution (PBS, 0.1 M) and without pH adjustment, to avoid the decomposition of active compounds in the extract [21]. Based on the existing literature, most of the antioxidant compounds present in açaí extract are polyphenols, which are bioactive compounds that have oxidation potentials between 0 and +1.0 V (vs Ag/AgCl) [20].
The experimental conditions for cyclic voltammetry (CV) included a potential range from 0 to +0.90 V at a scan rate range from 60 to 240 mV s−1, while those for differential pulse voltammetry (DPV) used a modulation amplitude of 50 mV, a modulation time of 500 ms, step potential of 5 mV, and scan rate of 100 mV s−1. Before each measurement, the GC surface was polished with 0.05 µm alumina powder on a microcloth pad, rinsed thoroughly with distilled water, and then placed in an ultrasonic bath.
The total antioxidant power was evaluated by the determination of the EQI [18,19,20,21,22], estimated via the current responses of the cyclic voltammograms and Equation (2), where Iap and Eap are the anodic current intensity and the oxidation potential,
E Q I = I a p 1 E a p 1 + I a p 2 E a p 2 + + I a p n E a p n

4. Results and Discussions

4.1. Concentration Test

To assess the total antioxidant power of the ethanolic extract, preliminary assays (CV and DPV measurements) were performed in a pH 5 phosphate buffer 0.1 M solution at a GC electrode to understand its electrochemical behavior. As shown in Figure 2A,B, specific electrochemical responses were achieved. In the case of CV, no current signals were registered in the voltammetric profile in the absence of açaí extract in the solution (black solid line in Figure 2A). Meanwhile, when different concentrations of açaí extract were added to the solution, it was possible to observe the presence of a pair of signals, anodic (+0.375 V) and cathodic (+0.280 V) peaks, respectively, related to the electroactive species. When a lower concentration of the ethanolic extract was used (0.012–0.030%), several cycles were registered and no passivation was observed, indicating that no adsorption of any compound was attained at the GC surface. Even when a slight increase in the current response was achieved at both signals with different concentrations of the extract, a good linear relationship of the peak current versus the concentration of açaí extract (0.012% to 0.25%) was revealed (see the inset in Figure 2A). This behavior can be attributed to the presence of antioxidant species in the solution containing redox active functional groups, increasing the current response with an increase in the concentration of the compounds [18,19,20,21,22]. These findings support that analytical curves can be built using information obtained by CV profiles [30,31], as well as the estimation of the EQI to determine antioxidant capacity, as already conducted by other authors [18,19,20,21,22]. Nevertheless, it is relevant to demonstrate if a linear trend is shown by a more accurate protocol, as well as to test other experimental conditions. Thus, the current profiles were acquired by DPV analysis to comprehend the selected range of açai concentrations.
DPV profiles were recorded under the experimental conditions described in Section 2, showing an increase in the current response with an increasing ethanolic extract concentration. However, two behaviors could be observed at different concentration ranges of the extract. On one hand, continuous current increases were attained at lower extract concentrations (Figure 2B). On the other hand, no significant current increases were observed at higher extract concentrations (Figure 2B). In fact, when all current data was plotted as a function of ethanolic extract concentrations, a logarithmic trend was obtained considering both behaviors described above (Figure 2C). Conversely, two linear segments could be associated according to the selected extract concentration (Figure 2C), obtaining the following different correlation coefficients: (i) at lower concentrations (0.005% to 0.03%), there was a value of about 0.97, following a linear relationship, while (ii) at higher concentrations (0.1% to 0.25%), the value of R2 was about 0.96, rather than following a linear relationship. In the former, a more accurate extract concentration range was achieved, resulting in a better sensitivity to lower antioxidant concentrations. Meanwhile, the saturation of the system and electrode surface could be associated with the higher concentrations used, leading to a plateau in the latter. This pattern resembles the characteristics of electrochemical systems, where the response at high concentrations may be limited in the case of saturation of an electrode’s active sites or charge transfer mechanisms [32]. Although the DPV signal appeared to be constant within the extract concentration range of 0.1–0.2%, this information helps to establish the maximum antioxidant capacity that can be measured using a more electrochemically accurate protocol, such as DPV, under specific experimental conditions.

4.2. Supporting Electrolyte Analysis

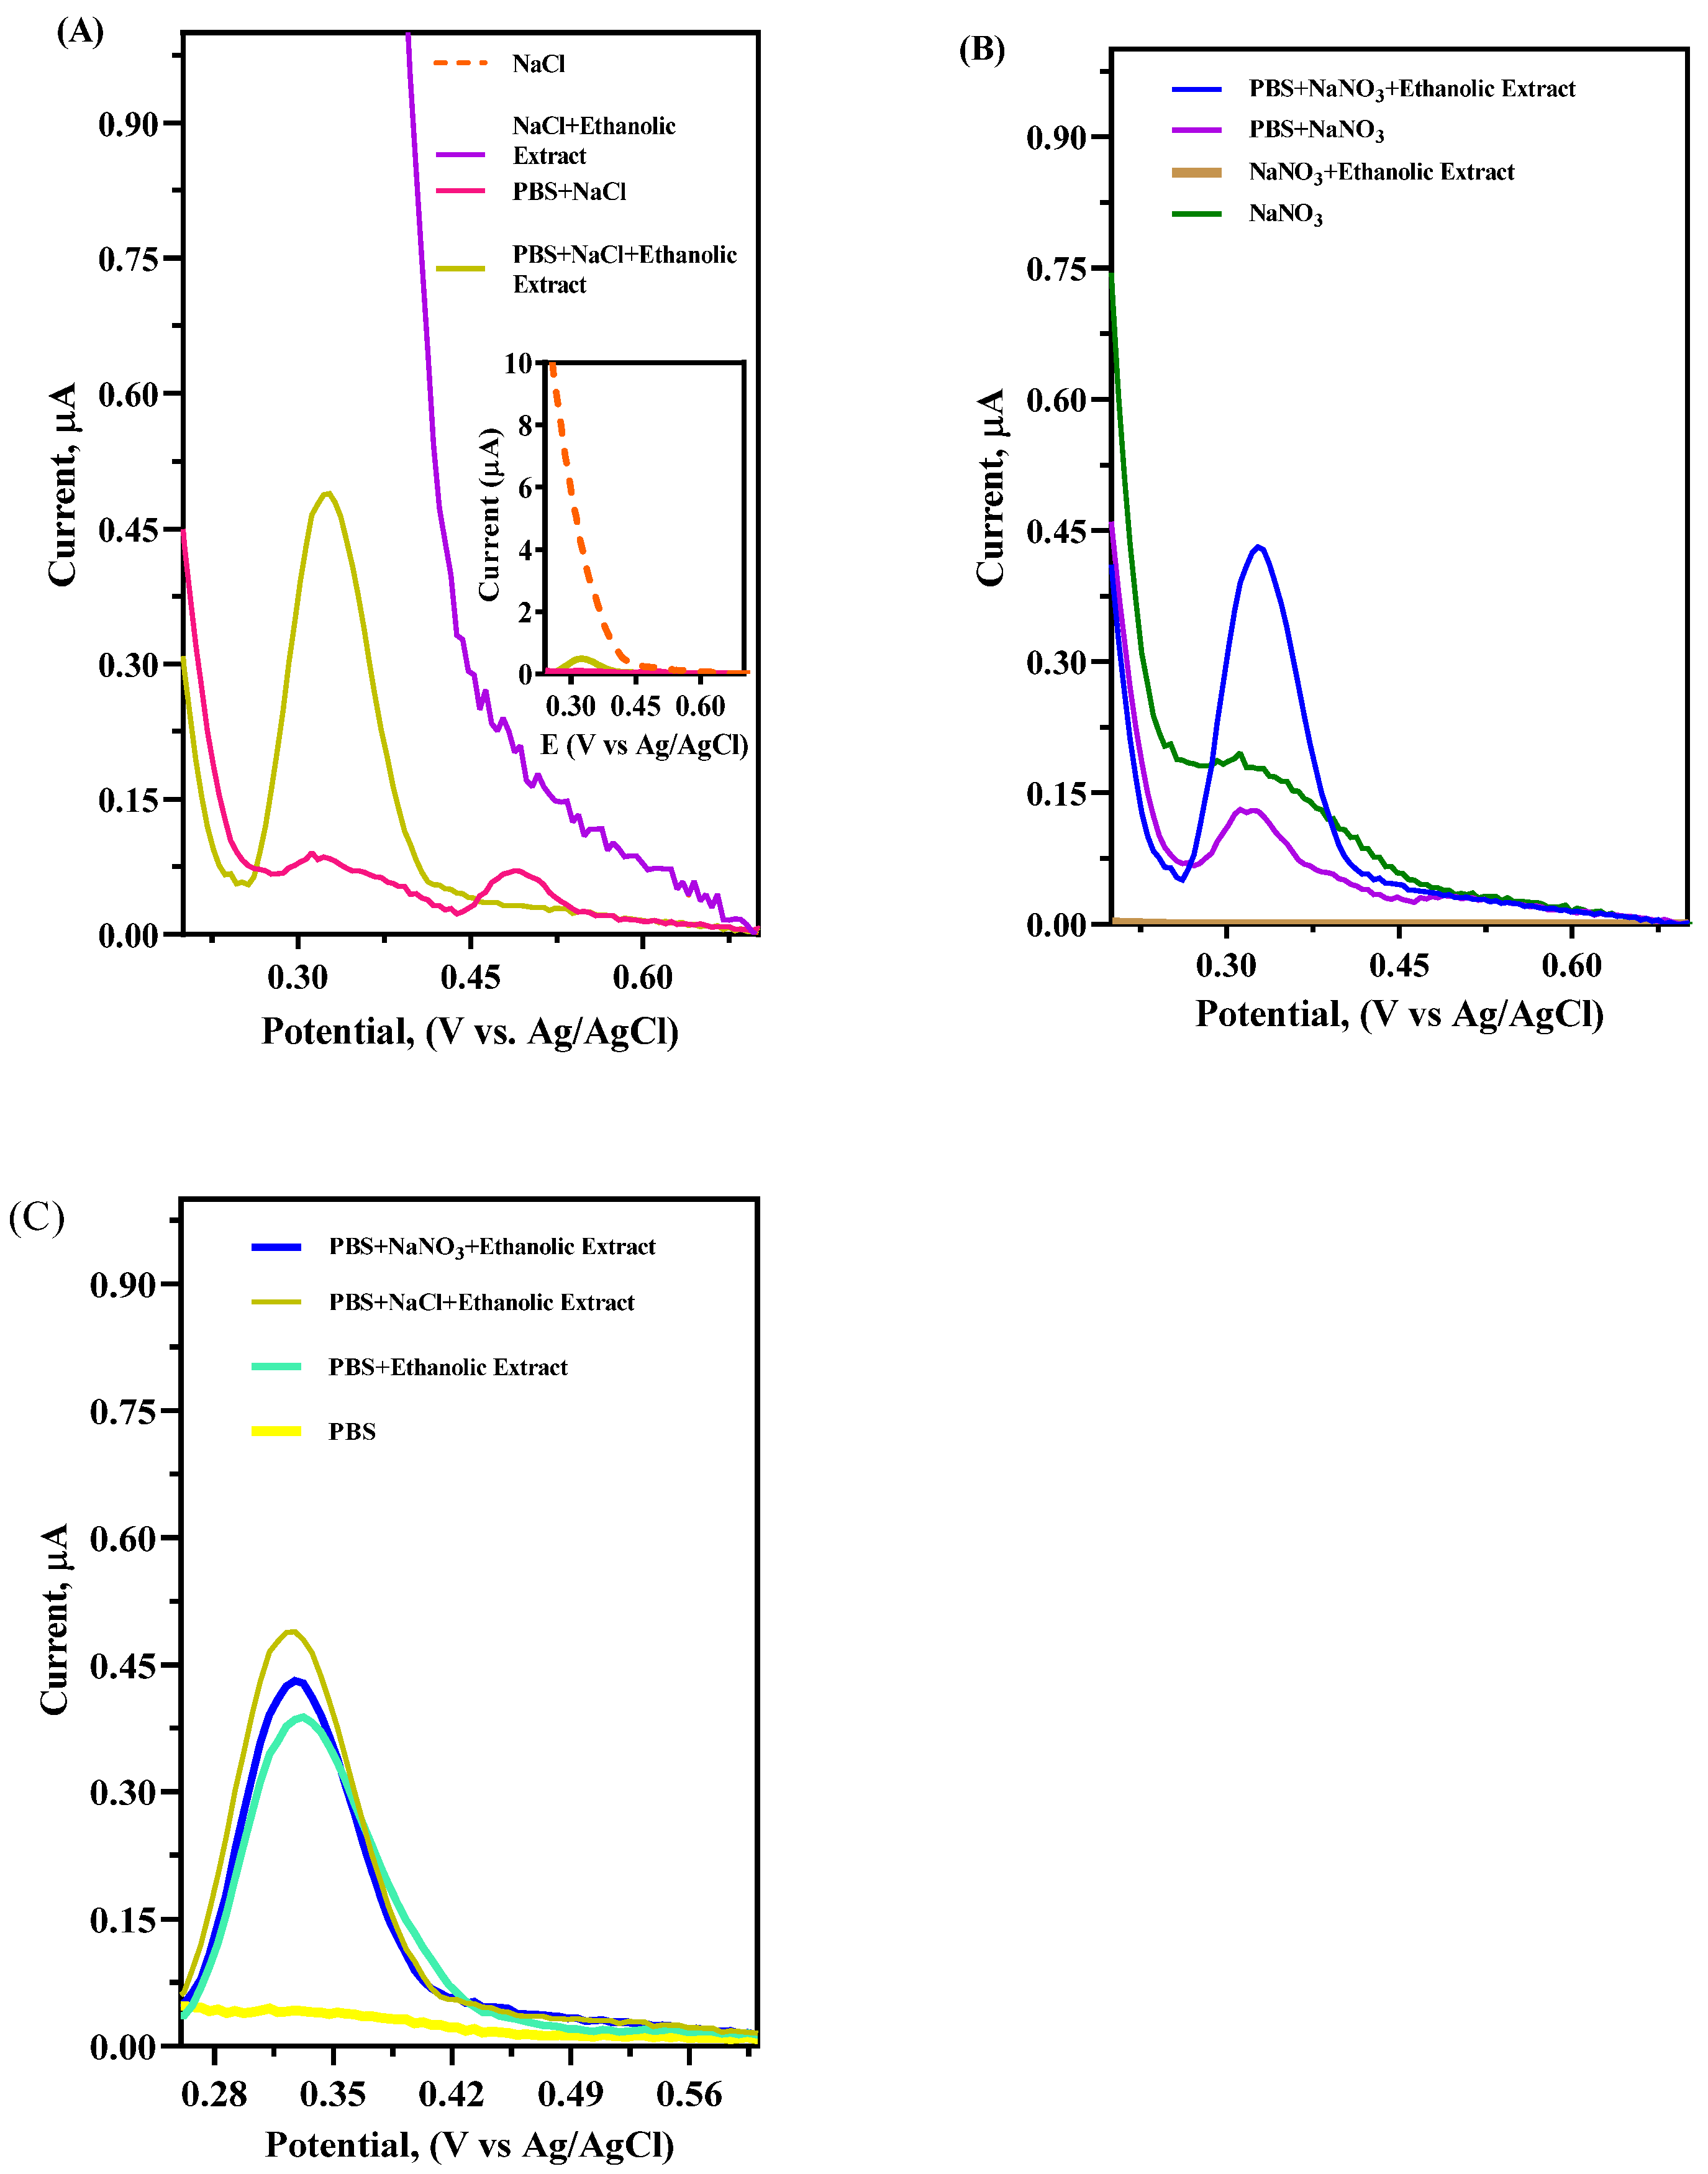
The selection of the appropriate SE for determining the total antioxidant capacity is relevant to facilitate electron transport by modifying the electric field at the electrical double layer [33]. Therefore, the voltammetric response was registered by testing different SEs, such as 0.1 M NaCl and 0.1 M NaNO3, adjusting the pH with 0.1 M phosphate buffer (pH 5) solution (Figure 3) to avoid the decomposition of active compounds in the extract [21]. A potential window for the electrochemical measurements between 0 and +1.0 V (vs Ag/AgCl) [20] was selected, once the bioactive compounds in açaí had oxidation potentials in that range.
Based on the results obtained in all SE solutions, the anodic [22,33,34,35] signal at about +0.33 V (vs. Ag/AgCl) could be attributed to the antioxidants in the sample, as it only appeared when 0.1 mL of the ethanolic extract was added to the solution. Upon performing DPV on açaí extract with PBS, NaCl, NaNO3, PBS + NaCl, and PBS + NaNO3, analogous behavior was observed in all solutions. As shown in Figure 3, the DPV profiles exhibited significant changes depending on the SE used and the adjustment of pH conditions with the PBS solution. The pH values influenced the redox activity of the bioactive compounds at the GC surface. The presence of NaCl enabled achieving a higher peak current response (Figure 3C), and, consequently, it was selected as the SE for the subsequent experiments [21]. Considering this, the use of a strong electrolyte in combination with a buffer solution can be regarded as an essential tool to ensure the reproducibility of the method [15].

4.3. Scan Rate Test

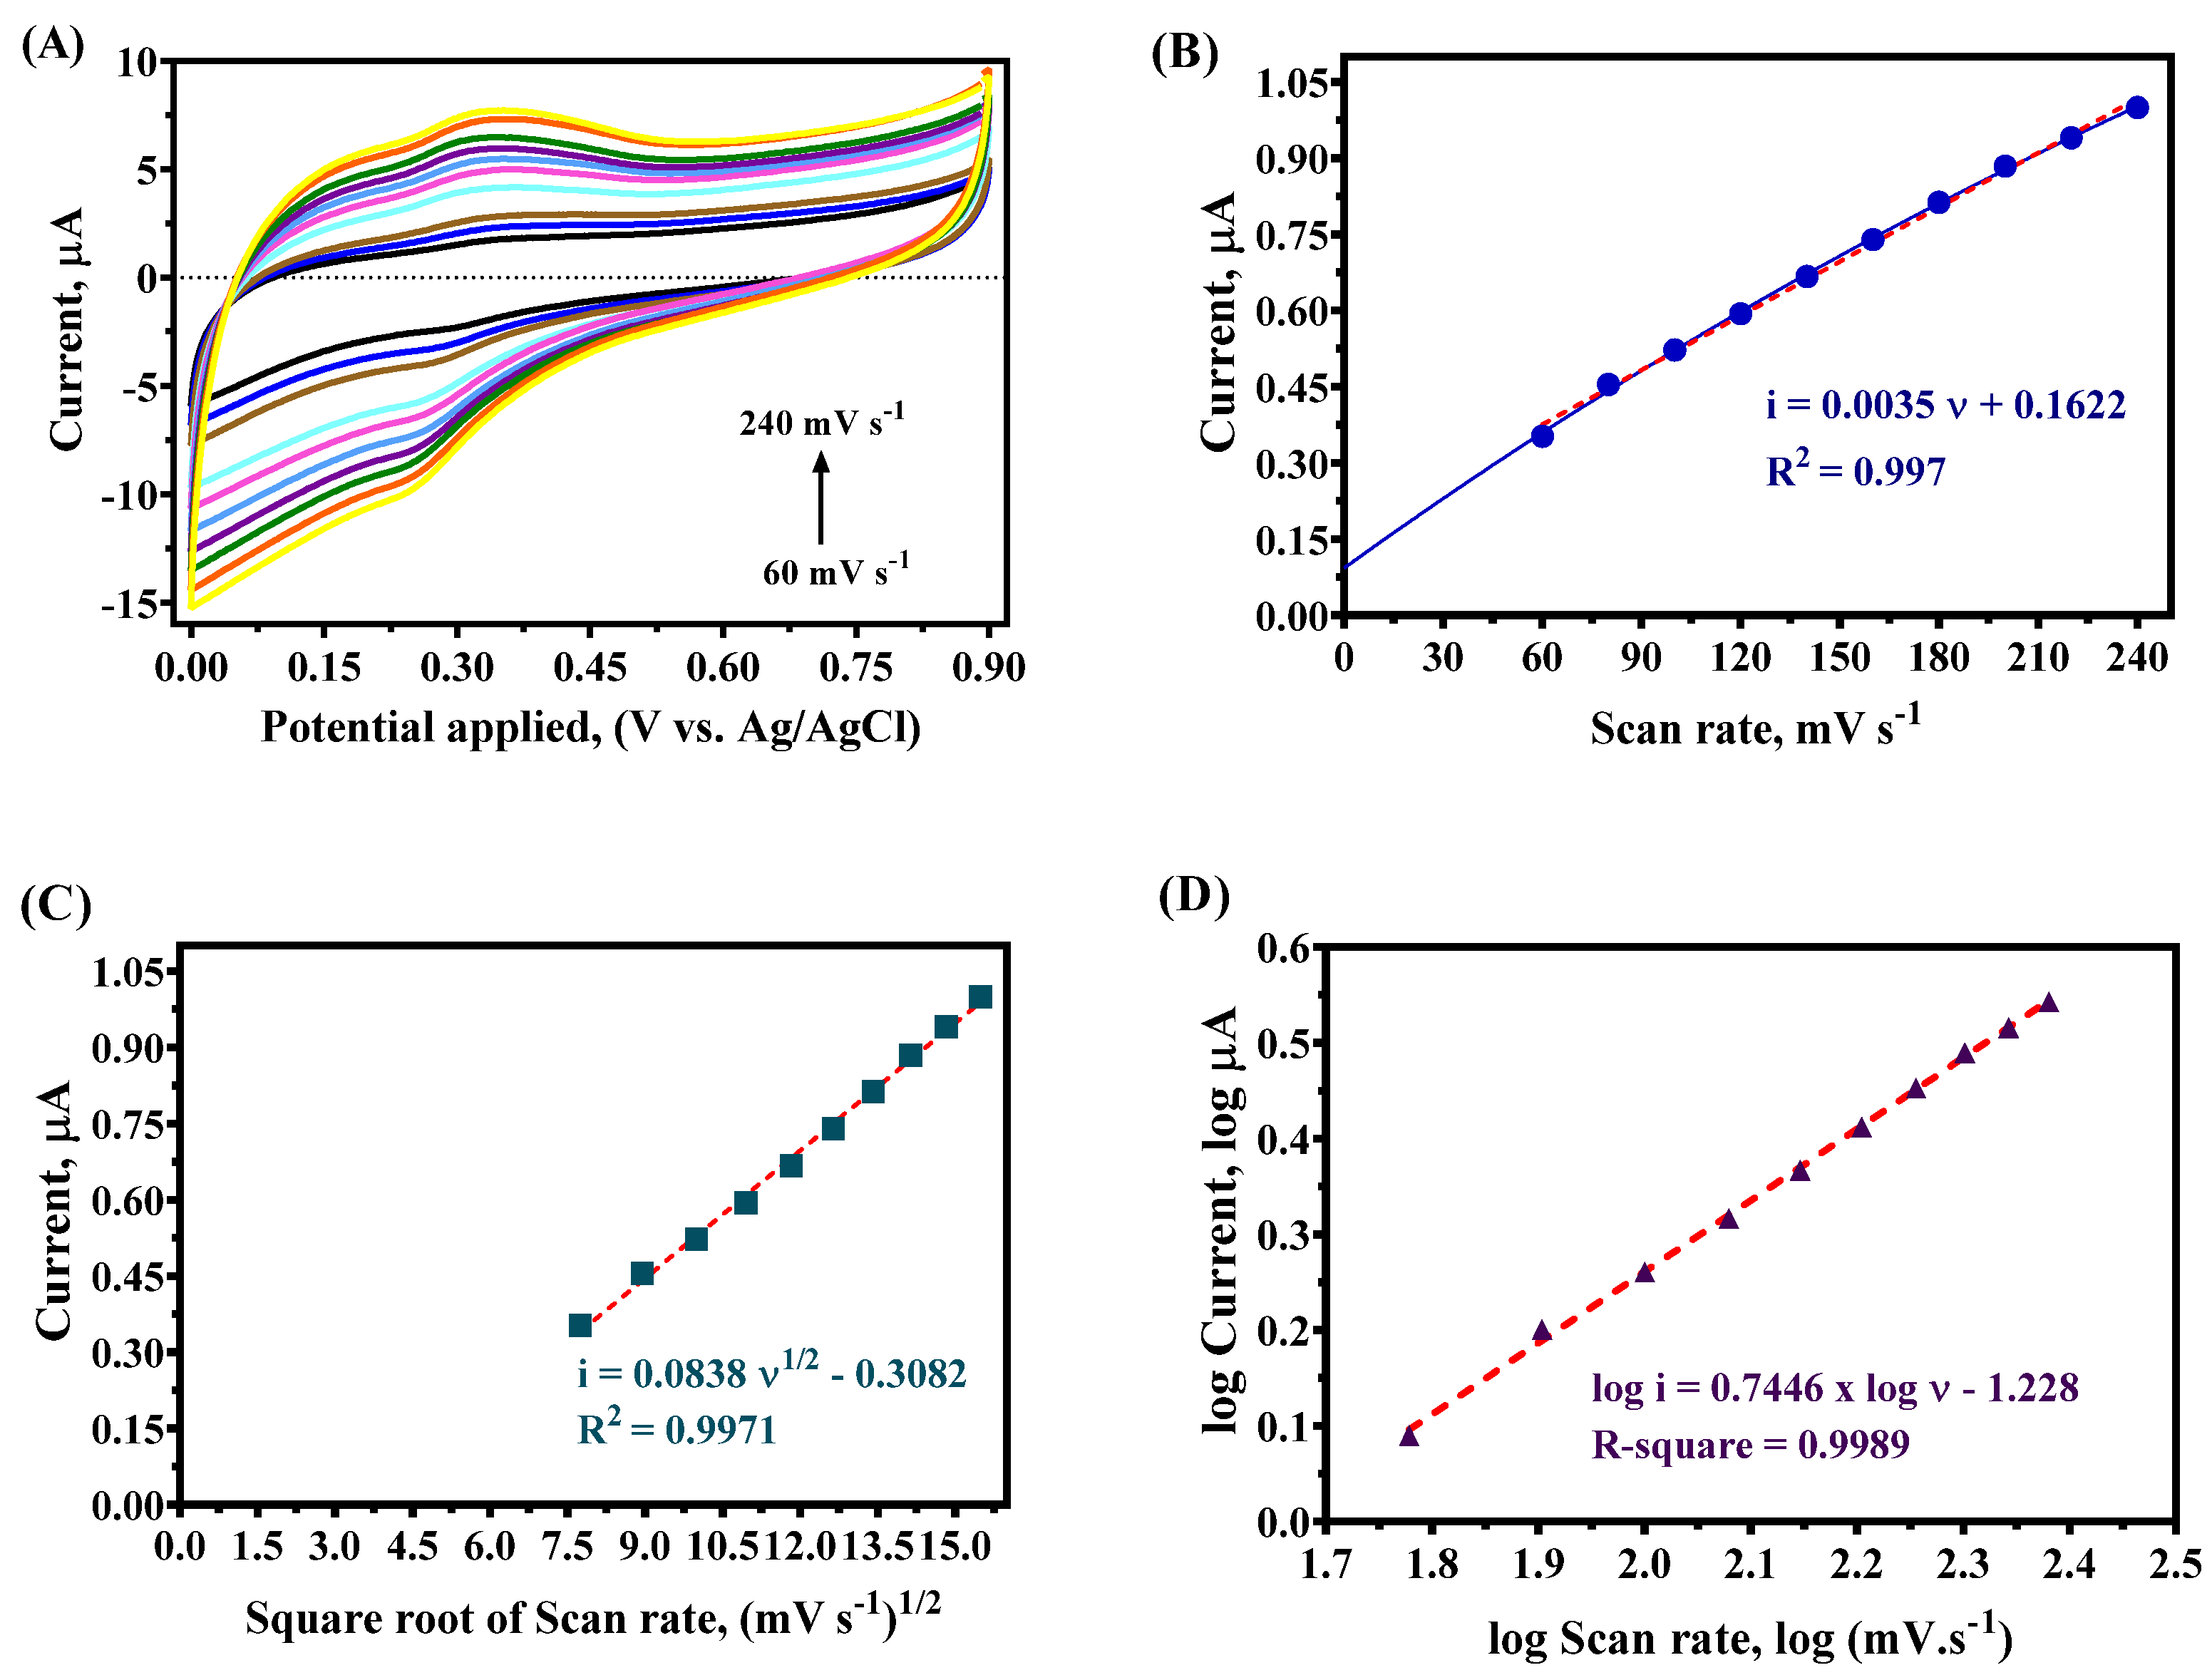
The voltametric profiles of the açaí ethanolic extract in NaCl (pH 5) were registered to investigate the effect of the oxidation and reduction current–potential responses at different scan rates (60 to 240 mV s−1). Figure 4A depicts the oxidative and reductive signals as a function of the scan rate. These findings, also reported in Table 1, clearly reveal a linear correlation between the anodic current and the scan rate (Figure 4B), with a slope of 0.004. However, a slight nonlinear tendency (blue line in Figure 4A) indicates that the process obeyed combined mass transport conditions. Conversely, a stronger linear correlation (0.99) was observed when the anodic current was plotted as a function of the square root of the scan rate (Figure 4C), indicating that the mass transport process could also be driven by diffusion. Following the analysis of the linear relationship between log iap and log n (r2 = 0.99), which exhibited a slope of 0.75, it was determined that a combination of transport mechanisms governed the oxidation process of the extract on the GC surface. This slope, falling between 0.50 (indicative of diffusion control) and 1.0 (indicative of adsorption control), suggests a dual influence of mass transport on the process [35]. Additionally, the study related to the current response at different scan rates with an açaí extract concentration of about 0.2% was consistent and predictable.

4.4. Antioxidant Power

With the GC electrode polarized at a constant scan rate of 100 mV s−1, the Faradaic current recorded throughout the oxidation of the sample was used in a simple CV test to determine the antioxidant capacity of the açaí ethanolic extract based on the EQI. In a potential range from 0 to +0.9 V (vs Ag/AgCl), anodic and cathodic peaks appeared at +0.37 and +0.27 V, respectively, with E1/2 of +0.32 V, corresponding to the quasi-irreversible behavior of some antioxidant compounds present in the sample, as already confirmed by the CV profile when a commercial açaí extract was used (Figure 5). From these results, the EQI value for our ethanolic extract was determined by CV, which was about 2.3 ± 0.90 µA/V.
Meanwhile, the resolution of the oxidation peak was improved by correcting the DPV profile plotted in the inset of Figure 5, allowing us to estimate the EQI value in this work, which was approximately 1.08 ± 0.98 µA/V. Nevertheless, this value is different from data reported in the existing literature (see Table 2). These values were obtained with extracts from other red fruits, but with different protocols. Thus, these differences could be a result of various factors, such as the type of product used, chemical constituents of the sample, sample pre-treatment, interferences, amount of water, and concentration of phenolic compounds, as well as the electrochemical reactions, kinetic effects, and electrochemical protocols used to determine EQI values. For example, lower EQI values were achieved for Rubus spp. and R. glabratus Kunth. Conversely, higher EQI values were reported for blackberry jam fruit and acerola. In any case, the values obtained in our study indicate that the ethanolic extract of açaí has a moderate antioxidant capacity when compared with extracts obtained from other red fruits, as shown in Table 2. Within this framework, CV and DPV parameters could be used to estimate the EQI and, consequently, the antioxidant capacity of the açaí ethanolic extract.

4.5. Total Phenolic Content (TPC)

The TPC of the ethanolic extract of commercial açaí pulp was determined using the calibration equation y = 0.001 × −0.003 (R2 = 0.99), resulting in a value of 0.87 ± 0.01 mg GAE mL−1 of extract or 0.31 ± 0.002 mg GAE g−1 of fresh pulp (wet basis), after considering the dilution factor. This result is consistent with values previously reported for commercial açaí products. For instance, Belda-Galbis and co-workers [37] reported TPC values ranging from 0.70 to 2.1 mg GAE mL−1 in commercial açaí extracts, depending on the concentration. Conversely, Junior et al. [38] lyophilized açaí pulp and obtained a higher TPC value (0.77 mg GAE g−1), while Paz et al. [39] reported 18.08 mg GAE g−1 on a dry weight basis. These variations reflect differences in sample preparation, extraction method, and moisture content. Within this framework, TPC values are associated with the concentration of phenolic compounds capable of undergoing redox reactions with the Folin–Ciocalteu reagent, including anthocyanins and phenolic acids [28]. Although the method does not allow for the identification of specific compounds, previous studies have extensively described the phenolic composition of Euterpe oleracea using chromatographic techniques. The most frequently reported constituents include anthocyanins (e.g., cyanidin-3-glucoside, cyanidin-3-rutinoside, peonidin-3-glucoside, and peonidin-3-rutinoside) [40,41,42,43,44], phenolic acids (e.g., gallic, ferulic, vanillic, protocatechuic, syringic, and ellagic acids) [41,42,44], and other flavonoids, such as quercetin, catechin, rutin, epicatechin, and orientin [21,42,44]. These findings support the assertion that the ethanolic extract retained a significant load of bioactive phenolics, even after commercial processing.

4.6. DPPH Test

A spectrometric assay for radical scavenging activity was also conducted using the same samples (0.2% of ethanolic extract). In this method, the degree of DPPH radical scavenging, resulting from its reduction, indicates the antioxidant capacity. Therefore, the DPPH assay, expressed as EC50 (as described in Section 3.3), demonstrates a direct relationship with antioxidant activity. The EC50 value (in mg mL−1) obtained for the sample was 0.31 ± 0.15. This represents a significant total antioxidant concentration, which is related to the total phenolic concentration, which is directly proportional to the EQI, as previously reported in the literature [29]. The extract contained other chemicals besides flavonoids, including alkaloids, proteins, tannins, steroids, phenols, carbohydrates, and terpenoids, which affect the evaluation of the total phenolic concentration. Thus, the value of EC50 can be affected by the complex composition of the extract.

4.7. Assessment of Antioxidant Activity: Methods, Merits, and Limitations

It is worth noting that even though the EC50 is a standardized method accepted by the scientific community, different values of EC50 have been obtained for other fruits and vegetables, resulting in variations in its direct or indirect relationship with the EQI. Based on the existing literature [45], various techniques have been developed to quantify antioxidant activity (see Table 3), each with distinct mechanisms, advantages, and drawbacks. The most employed methods include DPPH, 2,2′-Azino-bis(3-ethylbenzothiazoline-6-sulfonic acid) (ABTS), ferric reducing antioxidant power (FRAP), oxygen radical absorbance capacity (ORAC), cupric reducing antioxidant capacity (CUPRAC), and TPC assays. Understanding the scope and limitations of these methods is crucial for selecting appropriate assays and interpreting results in both research and industrial settings [45].
Then, according to the information in Table 3, the diversity of antioxidant assays available today underscores the complexity of oxidative chemistry and the challenge of measuring the total antioxidant potential of food and pharmaceutical substances. Each method brings unique advantages tailored for specific sample types and chemical properties, but also carries inherent limitations that restrict universal applicability. For screening purposes, simple assays like DPPH and ABTS are practical. Meanwhile, for more biologically relevant assessments, ORAC offers a better physiological relevance, as indicated in Table 3. Conversely, FRAP and CUPRAC are excellent for reducing capacity quantification, while TPC provides a useful proxy for phenolic-rich matrices [45].
Within this framework, no single method is sufficient to characterize antioxidant activity comprehensively. Thus, a multi-method approach combining radical scavenging, reducing power, and content assays could be practical. Additionally, integrating cell-based and in vivo studies with these methods can provide a more accurate picture of antioxidant efficacy in real biological contexts. By comparing and contrasting these methods with the EQI approach, which is an emerging tool in antioxidant research, as proposed in this investigation, it is clearer that each of them could be used in different analyses. Comparison among them may be unfeasible due to their different mechanisms.
While conventional antioxidant assays measure total antioxidant capacity through radical scavenging or reducing power (see Table 4), the EQI provides molecular-level insight into the redox behavior of antioxidants [45]. For these reasons, these techniques are not mutually exclusive, but complementary. For example, for initial screening, assays like the EQI (by using CV), DPPH, and ABTS are sufficient due to their simplicity and low cost [45]. Meanwhile, the EQI, by DPV analysis, as a moderate or detailed characterization strategy, adds value by elucidating which groups are responsible for antioxidant behavior and their relative potency and ease of oxidation [45]. For regulatory or industry settings, standardized methods like FRAP and TPC are easier to implement, but the EQI (CV or DPV protocols) is gaining attention for its discriminatory power and real-time capabilities.
In studies where multi-component systems (e.g., botanical extracts and complex pharmaceuticals) are involved, combining spectrophotometric and electrochemical assays ensures both comprehensive quantification and compound-specific insights [45]. In this frame, it is possible to conclude that in our investigation, a direct comparison of EC50 values with the EQI could mask reliable information about antioxidant properties. Consequently, the EQI could be correlated with EC50 (as discussed in this work) and other standard antioxidant protocols under the same conditions to obtain a more accurate relationship between the antioxidant power of different samples. Therefore, more studies are needed to use electrochemical analysis for quality assessment and traceability of açai, as well as a detailed characterization protocol.

5. Conclusions

The use of electroanalytical assays (DPV and CV) enabled the quantification of the antioxidant capacity, as measured by the EQI, in a sample of frozen açaí pulp. Furthermore, this is expected to be reproducible and feasible for determining the antioxidant power in plant matrices using a GC electrode in a pH 5 PBS solution with NaCl as the supporting electrolyte. The total antioxidant capacity of the extract was quantified using voltammetric approaches and the DPPH spectrophotometric methodology, obtaining feasible results. Additionally, the Folin–Ciocalteu colorimetric method was applied to determine the total phenolic content, confirming the presence of redox-active phenolic compounds in the extract. This study confirms the strong antioxidant capacity of açaí pulp and that electrochemical assays are a functional, eco-friendly alternative method for quickly detecting antioxidants in food samples. Finally, the EQI represents a mechanistically grounded tool for assessing antioxidant capacity, offering distinct advantages in terms of sensitivity, specificity, and redox profiling. However, due to equipment and expertise requirements, it is not yet a full replacement for simpler and more widely adopted assays such as DPPH, ABTS, and FRAP. In future research, the integration of the EQI with conventional methods is likely to become standard practice, ensuring more reliable and mechanistically meaningful antioxidant evaluations, as performed in this work.

Author Contributions

Conceptualization, T.N.F., L.D.L.-U., D.M.d.A., E.V.d.S. and C.A.M.-H.; data curation, T.N.F., L.D.L.-U., D.M.d.A., E.V.d.S. and M.O.F.G.; formal analysis, T.N.F., L.D.L.-U., D.M.d.A., E.V.d.S. and M.O.F.G.; investigation, T.N.F., L.D.L.-U. and D.M.d.A.; methodology, T.N.F. and D.M.d.A.; resources, E.V.d.S., M.O.F.G. and C.A.M.-H.; supervision, E.V.d.S., M.O.F.G. and C.A.M.-H.; writing—original draft, T.N.F., L.D.L.-U. and C.A.M.-H.; writing—review and editing, T.N.F., M.O.F.G. and C.A.M.-H. All authors have read and agreed to the published version of the manuscript.

Funding

Financial support from Conselho Nacional de Desenvolvimento Científico e Tecnológico (CNPq, Brazil) (408110/2022-8, 102532/2022-2), and from the Fundação de Amparo à Pesquisa do Estado de São Paulo (Brazil), FAPESP 2014/50945-4, and 2019/13113-4, is gratefully acknowledged.

Institutional Review Board Statement

Not applicable.

Informed Consent Statement

Not applicable.

Data Availability Statement

Data will be made available on request.

Acknowledgments

C.A. Martínez-Huitle thanks the FIC-Coquimbo 2021 Project BIP Code 40041020-0 for the financial support and the fellowship related to the Program CNPq 25/2021 Pós-Doutorado Sênior PDS 2021.

Conflicts of Interest

The authors declare no conflicts of interest.

References

  1. Avila-Sosa, R.; Montero-Rodríguez, A.F.; Aguilar-Alonso, P.; Vera-López, O.; Lazcano-Hernández, M.; Morales-Medina, J.C.; Navarro-Cruz, A.R. Antioxidant Properties of Amazonian Fruits: A Mini Review of In Vivo and In Vitro Studies. Oxid. Med. Cell. Longev. 2019, 2019, 8204129. [Google Scholar] [CrossRef]
  2. Silva Cedrim, P.C.A.; Barros, E.M.A.; Do Nascimento, T.G. Antioxidant Properties of Acai (Euterpe oleracea) in the Metabolic Syndrome. Braz. J. Food Technol. 2018, 21, e2017092. [Google Scholar] [CrossRef]
  3. Silveira, J.T.d.; Rosa, A.P.C.d.; Morais, M.G.d.; Victoria, F.N.; Costa, J.A.V. An Integrative Review of Açaí (Euterpe oleracea and Euterpe precatoria): Traditional Uses, Phytochemical Composition, Market Trends, and Emerging Applications. Food Res. Int. 2023, 173, 113304. [Google Scholar] [CrossRef] [PubMed]
  4. IBGE Produção Agrícola Municipal. 2022. Available online: https://sidra.ibge.gov.br/tabela/1613#resultado (accessed on 23 October 2023).
  5. Jobim, M.L.; Barbisan, F.; Fortuna, M.; Teixeira, C.F.; Boligon, A.A.; Ribeiro, E.E.; da Cruz, I.B.M. Açai (Euterpe oleracea, Mart.), an Amazonian fruit has antitumor effects on prostate cancer cells. Arch. Biosci. Health 2019, 1, 61–76. [Google Scholar] [CrossRef]
  6. Yildirim, C.; Aydin, S.; Donertas, B.; Oner, S.; Kilic, F.S. Effects of Euterpe oleracea to Enhance Learning and Memory in a Conditioned Nicotinic and Muscarinic Receptor Response Paradigm by Modulation of Cholinergic Mechanisms in Rats. J. Med. Food 2020, 23, 388–394. [Google Scholar] [CrossRef]
  7. Souza-Monteiro, J.R.; Arrifano, G.P.F.; Queiroz, A.I.D.G.; Mello, B.S.F.; Custodio, C.S.; Macedo, D.S.; Hamoy, M.; Paraense, R.S.O.; Bittencourt, L.O.; Lima, R.R.; et al. Antidepressant and Antiaging Effects of Açaí (Euterpe oleracea Mart.) in Mice. Oxid. Med. Cell. Longev. 2019, 2019, 3614960. [Google Scholar] [CrossRef]
  8. Martínez-Flórez, S.; González-Gallego, J.; Culebras, J.M.; Tuñón, M.J. Los Flavonoides: Propiedades y Acciones Antioxidantes. Nutr. Hosp. 2002, 17, 271–278. [Google Scholar]
  9. George, S.A.; Rajeev, R.; Thadathil, D.A.; Varghese, A. A Comprehensive Review on the Electrochemical Sensing of Flavonoids. Crit. Rev. Anal. Chem. 2023, 53, 1133–1173. [Google Scholar] [CrossRef]
  10. Chiorcea-Paquim, A.M. Electrochemistry of Flavonoids: A Comprehensive Review. Int. J. Mol. Sci. 2023, 24, 15667. [Google Scholar] [CrossRef]
  11. Williams, R.J.; Spencer, J.P.E.; Rice-Evans, C. Flavonoids: Antioxidants or Signalling Molecules? Free Radic. Biol. Med. 2004, 36, 838–849. [Google Scholar] [CrossRef]
  12. Gulcin, İ.; Alwasel, S.H. Metal Ions, Metal Chelators and Metal Chelating Assay as Antioxidant Method. Processes 2022, 10, 132. [Google Scholar] [CrossRef]
  13. Kim, J.S. Flavonoids, an Overview: Chemical Structures, Dietary Sources, and Biological Properties. Food Eng. Prog. 2020, 24, 151–163. [Google Scholar] [CrossRef]
  14. Gil, E.S.; Couto, R.O. Flavonoid Electrochemistry: A Review on the Electroanalytical Applications. Rev. Bras. Farmacogn. 2013, 23, 542–558. [Google Scholar] [CrossRef]
  15. Chiorcea-Paquim, A.M.; Enache, T.A.; De Souza Gil, E.; Oliveira-Brett, A.M. Natural Phenolic Antioxidants Electrochemistry: Towards a New Food Science Methodology. Compr. Rev. Food Sci. Food Saf. 2020, 19, 1680–1726. [Google Scholar] [CrossRef]
  16. Amidi, S.; Mojab, F.; Moghaddam, A.B.; Tabib, K.; Kobarfard, F. A Simple Electrochemical Method for the Rapid Estimation of Antioxidant Potentials of Some Selected Medicinal Plants. Iran. J. Pharm. Res. 2012, 11, 117–121. [Google Scholar]
  17. Kilmartin, P.A.; Zou, H.; Waterhouse, A.L. A Cyclic Voltammetry Method Suitable for Characterizing Antioxidant Properties of Wine and Wine Phenolics. J. Agric. Food Chem. 2001, 49, 1957–1965. [Google Scholar] [CrossRef]
  18. Diniz, G.C.; Pinheiro Gomes, V.T.R.; de Assis, M.; Alejandro Figueroa, S.J.; Ferreira Torquato, I.; de Freitas Borges, L.G.; Aguilar Vitorino, H.; de Lima, R.B.; Suller Garcia, M.A.; de Araujo Rodrigues, I. Electrochemical Sensitivity Improvement by the Cooperation between Pt and Ru for Total Antioxidant Evaluation in Natural Extracts. Chemosensors 2023, 11, 314. [Google Scholar] [CrossRef]
  19. Masek, A.; Zaborski, M.; Chrzescijanska, E. Electrooxidation of Flavonoids at Platinum Electrode Studied by Cyclic Voltammetry. Food Chem. 2011, 127, 699–704. [Google Scholar] [CrossRef]
  20. Osorio-Valencia, A.I.; de Jesús Franco-Mejía, J.; Hoyos-Arbeláez, J.A.; Blandón-Naranjo, L.; Vega-Castro, O.A.; del Carmen Contreras-Calderón, J. Evaluation of Antioxidant Capacity in Different Food Matrices through Differential Pulse Voltammetry and Its Correlation with Spectrophotometric Methods. J. Appl. Electrochem. 2023, 53, 2495–2505. [Google Scholar] [CrossRef]
  21. Gomes, S.M.C.; Ghica, M.E.; Rodrigues, I.A.; De Souza Gil, E.; Oliveira-Brett, A.M. Flavonoids Electrochemical Detection in Fruit Extracts and Total Antioxidant Capacity Evaluation. Talanta 2016, 154, 284–291. [Google Scholar] [CrossRef]
  22. Méndez-Durazno, C.; Cisneros-Perez, P.A.; Loja-Ojeda, B.A.; Monge-Sevilla, R.; Romero-Estévez, D.; Fernández, L.; Espinoza-Montero, P.J. Antioxidant Capacity through Electrochemical Methods and Chemical Composition of Oenocarpus Bataua and Gustavia Macarenensis from the Ecuadorian Amazon. Antioxidants 2023, 12, 318. [Google Scholar] [CrossRef]
  23. de Macêdo, I.Y.L.; Garcia, L.F.; Oliveira Neto, J.R.; de Siqueira Leite, K.C.; Ferreira, V.S.; Ghedini, P.C.; de Souza Gil, E. Electroanalytical Tools for Antioxidant Evaluation of Red Fruits Dry Extracts. Food Chem. 2017, 217, 326–331. [Google Scholar] [CrossRef]
  24. Piljac-Žegarac, J.; Valek, L.; Stipčević, T.; Martinez, S. Electrochemical Determination of Antioxidant Capacity of Fruit Tea Infusions. Food Chem. 2010, 121, 820–825. [Google Scholar] [CrossRef]
  25. Demir, E. Sensitive and Selective Pathway of Total Antioxidant Capacity in Commercially Lemon, Watermelon and Mango-Pineapple Cold Teas by Square Wave Adsorptive Stripping Voltammetry. Gazi Univ. J. Sci. 2019, 32, 1123–1136. [Google Scholar] [CrossRef]
  26. Alam, M.W.; Najeeb, J.; Naeem, S.; Usman, S.M.; Nahvi, I.; Alismail, F.; Abuzir, A.; Farhan, M.; Nawaz, A. Electrochemical Methodologies for Investigating the Antioxidant Potential of Plant and Fruit Extracts: A Review. Antioxidants 2022, 11, 1205. [Google Scholar] [CrossRef] [PubMed]
  27. Hoyos-Arbeláez, J.; Vázquez, M.; Contreras-Calderón, J. Electrochemical Methods as a Tool for Determining the Antioxidant Capacity of Food and Beverages: A Review. Food Chem. 2017, 221, 1371–1381. [Google Scholar] [CrossRef] [PubMed]
  28. da Costa, D.S.; Bragotto, A.P.A.; de Carvalho, L.M.; Amado, L.L.; Lima, R.R.; Rogez, H. Analysis of Polyphenols, Anthocyanins and Toxic Elements in Açaí Juice (Euterpe oleracea Mart.): Quantification and in Vivo Assessment of the Antioxidant Capacity of Clarified Açaí Juice. Meas. Food 2024, 14, 100149. [Google Scholar] [CrossRef]
  29. Gomes, S.M.C.; Fernandes, I.P.G.; Shekhawat, N.S.; Kumbhat, S.; Oliveira-Brett, A.M. Calligonum Polygonoides Linnaeus Extract: HPLC-EC and Total Antioxidant Capacity Evaluation. Electroanalysis 2015, 27, 293–301. [Google Scholar] [CrossRef]
  30. Campanella, L.; Martini, E.; Rita, G.; Tomassetti, M. Antioxidant Capacity of Dry Vegetal Extracts Checked by Voltammetric Method. J. Food Agric. Environ. 2006, 4, 135–144. [Google Scholar]
  31. Muhammad, H.; Tahiri, I.A.; Qasim, M.; Versiani, M.A.; Hanif, M.; Gul, B.; Ali, S.T.; Ahmed, S. Electrochemical Determination of Antioxidant Activity and HPLC Profiling of Some Dry Fruits. Monatsh. Chem. 2019, 150, 1195–1203. [Google Scholar] [CrossRef]
  32. Monteiro, M.K.S.; Paiva, S.S.M.; da Silva, D.R.; Vilar, V.J.P.; Martínez-Huitle, C.A.; dos Santos, E.V. Novel Cork-Graphite Electrochemical Sensor for Voltammetric Determination of Caffeine. J. Electroanal. Chem. 2019, 839, 283–289. [Google Scholar] [CrossRef]
  33. Ahmadpour, S.; Tashkhourian, J.; Hemmateenejad, B. A Chemometric Investigation on the Influence of the Nature and Concentration of Supporting Electrolyte on Charging Currents in Electrochemistry. J. Electroanal. Chem. 2020, 871, 114296. [Google Scholar] [CrossRef]
  34. de Mello e Silva, G.N.; Batista Rodrigues, E.S.; Lopes de Macêdo, I.Y.; Vicente Gil, H.P.; Campos, H.M.; Ghedini, P.C.; Cardozo da Silva, L.; Batista, E.A.; Lopes de Araújo, G.; Vaz, B.G.; et al. Blackberry Jam Fruit (Randia formosa (Jacq.) K. Schum): An Amazon Superfruit with in Vitro Neuroprotective Properties. Food Biosci. 2022, 50, 102084. [Google Scholar] [CrossRef]
  35. Monteiro, M.K.S.; Da Silva, D.R.; Quiroz, M.A.; Vilar, V.J.P.; Martínez-Huitle, C.A.; Dos Santos, E.V. Applicability of Cork as Novel Modifiers to Develop Electrochemical Sensor for Caffeine Determination. Materials 2020, 14, 37. [Google Scholar] [CrossRef]
  36. Monge-Sevilla, R.D.; Fernández, L.; Espinoza-Montero, P.J.; Méndez-Durazno, C.; Cisneros-Pérez, P.A.; Romero-Estévez, D.; Bolaños-Méndez, D.; Alvarez-Paguay, J.; Jadán, M. Chemical Composition and Antioxidant Properties of Native Ecuadorian Fruits: Rubus glabratus Kunth, Vaccinium floribundum Kunth, and Opuntia soederstromiana. Heliyon 2024, 10, e30593. [Google Scholar] [CrossRef]
  37. Belda-Galbis, C.M.; Jiménez-Carretón, A.; Pina-Pérez, M.C.; Martínez, A.; Rodrigo, D. Antimicrobial Activity of Açaí against Listeria innocua. Food Control 2015, 53, 212–216. [Google Scholar] [CrossRef]
  38. Junior, C.; Maria Martins Siqueira, L.; Luiza de Barros Souza Campos, A.; Cristina Seabra Pires, F.; Caroline Rodrigues Ferreira, M.; Paula de Souza Silva, A.; Gama Ortiz Menezes, E.; Nayara de Farias Ramos, I.; Salim Khayat, A.; de Arimateia Rodrigues do Rêgo, J.; et al. Evaluation of Bioactive Compounds and Antioxidant and Cytotoxic Effects of Oil and Pulp without Açaí Fat (Euterpe oleracea) Obtained by Supercritical Extraction. Foods 2024, 13, 2819. [Google Scholar] [CrossRef]
  39. Paz, M.; Gúllon, P.; Barroso, M.F.; Carvalho, A.P.; Domingues, V.F.; Gomes, A.M.; Becker, H.; Longhinotti, E.; Delerue-Matos, C. Brazilian Fruit Pulps as Functional Foods and Additives: Evaluation of Bioactive Compounds. Food Chem. 2015, 172, 462–468. [Google Scholar] [CrossRef]
  40. Gordon, A.; Cruz, A.P.G.; Cabral, L.M.C.; De Freitas, S.C.; Taxi, C.M.A.D.; Donangelo, C.M.; De Andrade Mattietto, R.; Friedrich, M.; Da Matta, V.M.; Marx, F. Chemical Characterization and Evaluation of Antioxidant Properties of Açaí Fruits (Euterpe oleraceae Mart.) during Ripening. Food Chem. 2012, 133, 256–263. [Google Scholar] [CrossRef]
  41. Carvalho, A.V.; Ferreira Ferreira da Silveira, T.; Mattietto, R.D.A.; Padilha de Oliveira, M.D.S.; Godoy, H.T. Chemical Composition and Antioxidant Capacity of Açaí (Euterpe oleracea) Genotypes and Commercial Pulps. J. Sci. Food Agric. 2017, 97, 1467–1474. [Google Scholar] [CrossRef]
  42. Garzón, G.A.; Narváez-Cuenca, C.E.; Vincken, J.P.; Gruppen, H. Polyphenolic Composition and Antioxidant Activity of Açai (Euterpe oleracea Mart.) from Colombia. Food Chem. 2017, 217, 364–372. [Google Scholar] [CrossRef]
  43. Luz, J.R.D.D.; Barbosa, E.A.; Sousa, R.M.D.; Oliveira, M.L.D.A.; Dias, M.F.S.; Alves, I.R.; Souza, G.C.D.; Ferreira, E.F.B.; Guzmán-Pincheira, C.; Almeida, M.D.G.; et al. Phytochemical Profiling of Processed Açaí Pulp (Euterpe oleracea) Through Mass Spectrometry and Its Protective Effects Against Oxidative Stress in Cardiomyocytes and Rats. Antioxidants 2025, 14, 642. [Google Scholar] [CrossRef]
  44. de Souza Silva, A.P.; de Camargo, A.C.; Lazarini, J.G.; Carvalho, G.R.; de Alencar, S.M. How Does in Vitro Gastrointestinal Digestion Affect the Biological Activities and Phenolic Profile of Açaí (Euterpe oleracea) and Inajá (Maximiliana maripa) by-Products? Food Chem. 2025, 484, 144364. [Google Scholar] [CrossRef]
  45. Gulcin, İ. Antioxidants: A Comprehensive Review. Arch. Toxicol. 2025, 99, 1893–1997. [Google Scholar] [CrossRef]
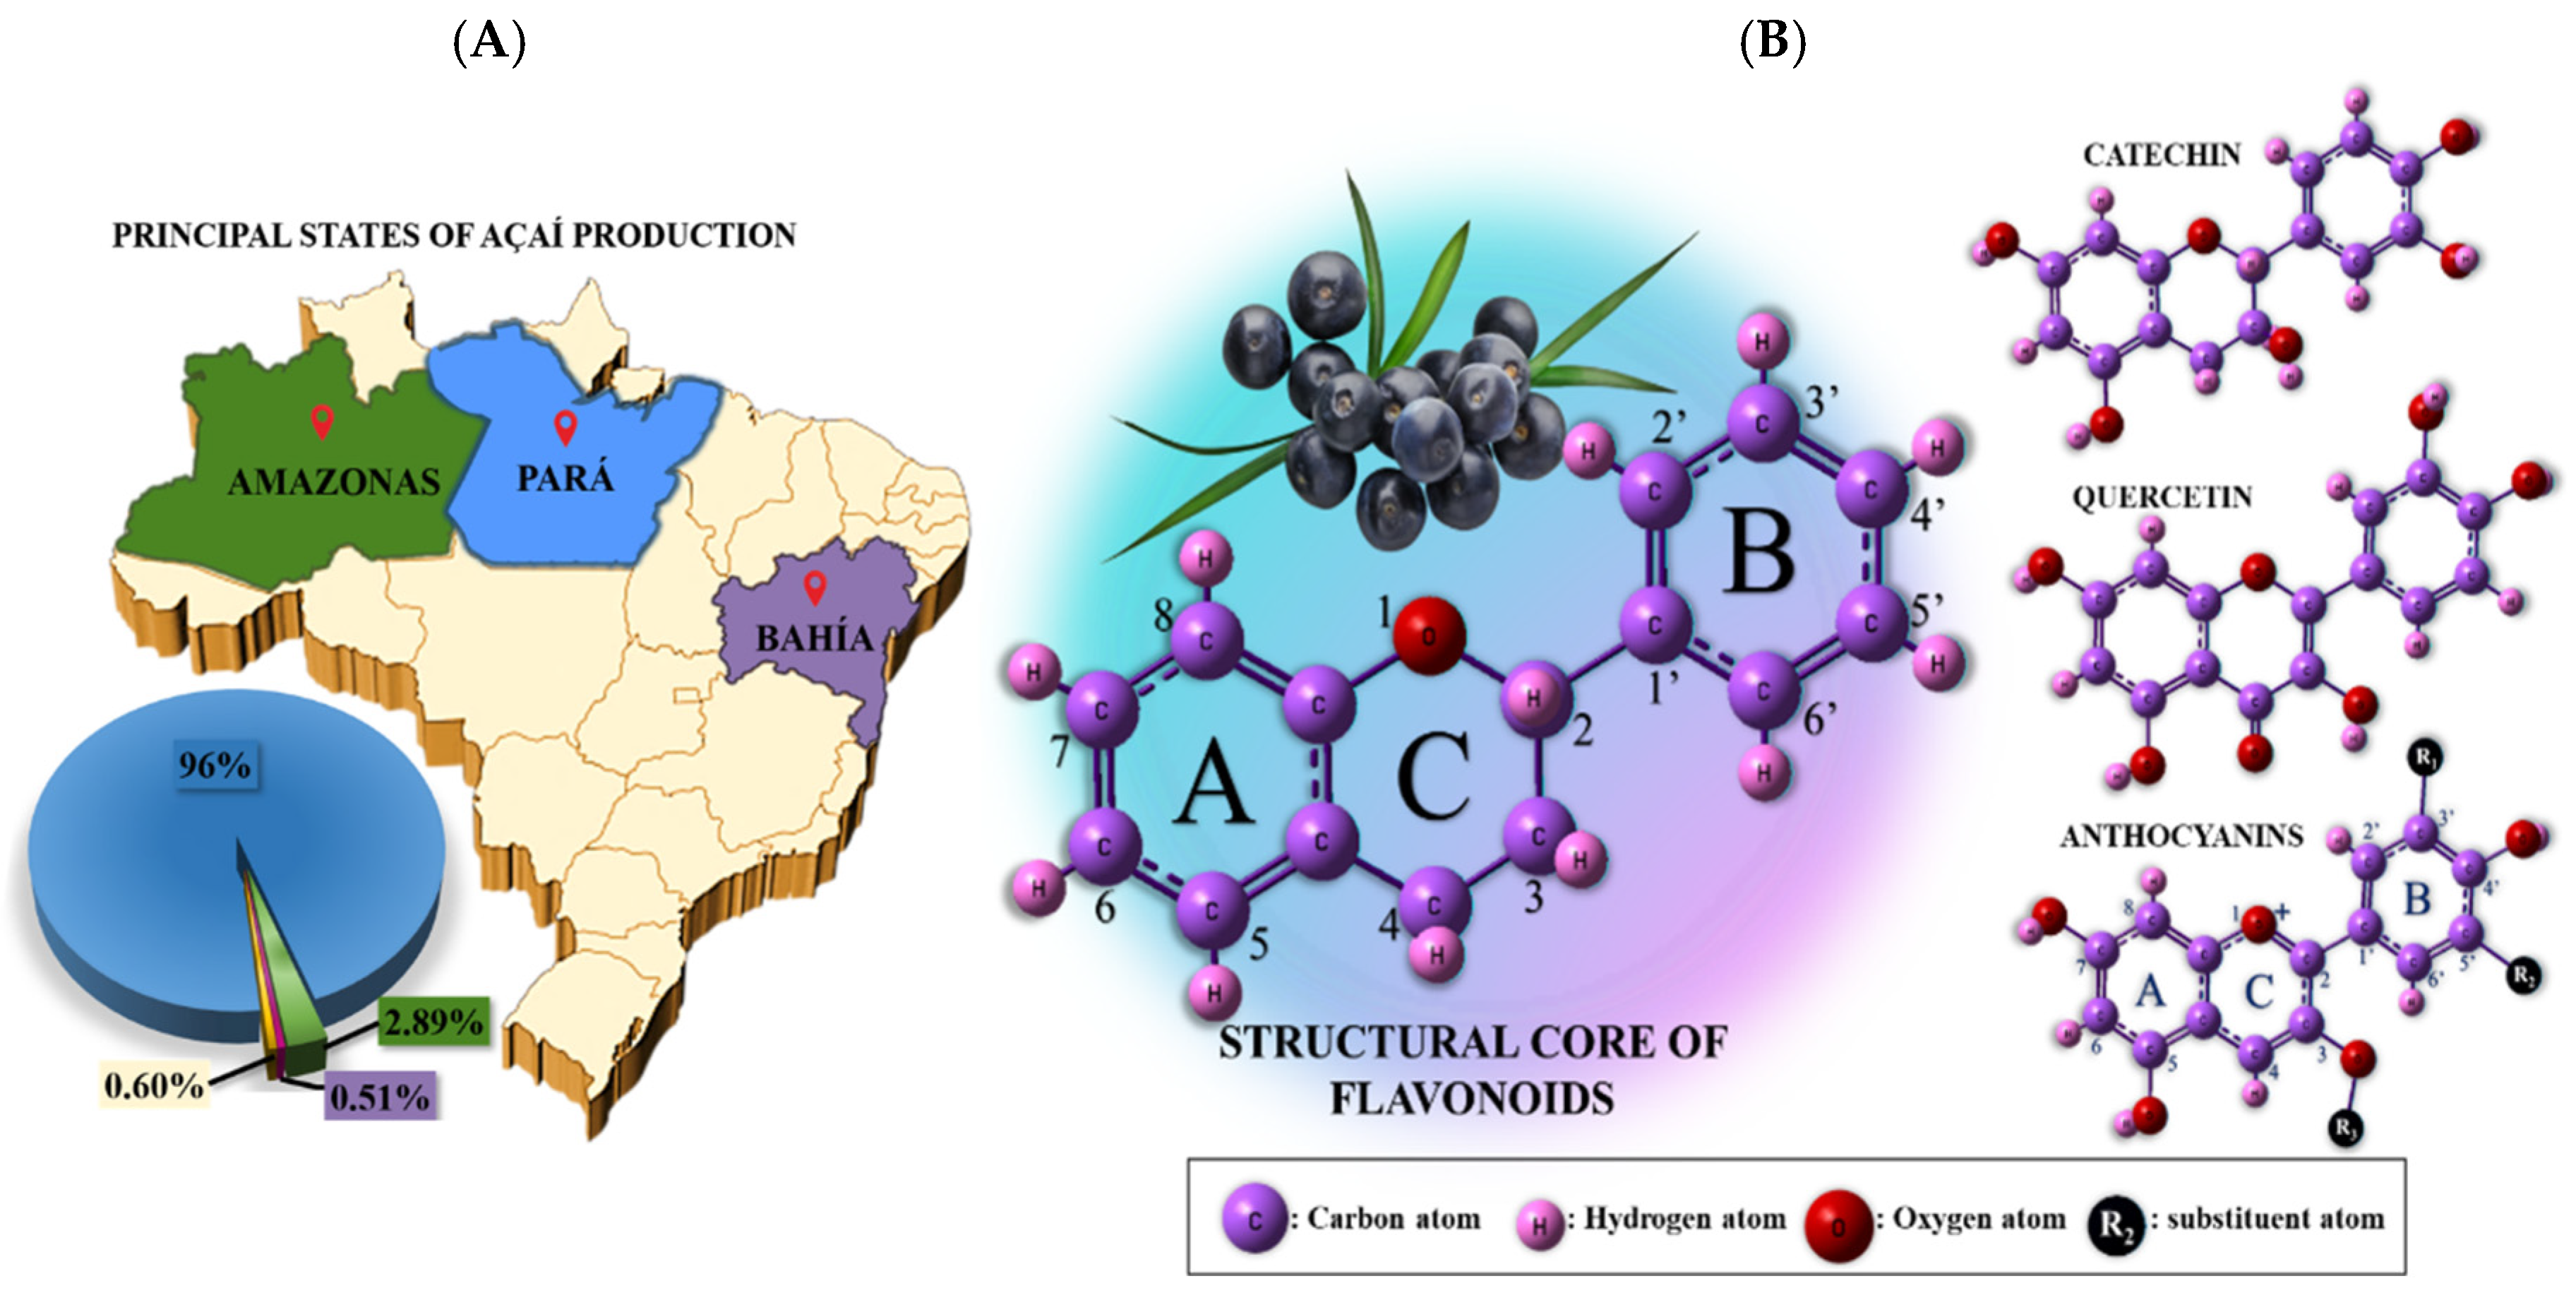
Figure 1. (A) Map of Brazil highlighting the central regions of açaí production. (B) Açaí fruit and its main flavonoid’s components.
Antioxidants 14 01082 g001
Figure 2. (A) CV and (B) DPV profiles at GC electrode in phosphate buffer solution (0.1 M) pH 5 with different concentrations of commercial açaí pulp extract at scan rate 100 mV s−1, the inset plot in CV measurements shows the analytical curve obtained. (C) Analytical curve of the anodic peak current obtained by DPV measurements at different ethanolic extract concentrations. In (A), the red dashed line represents the linear fit of the experimental data, whereas in (C), the red dashed lines indicate the two linear segments identified within the logarithmic curve.
Antioxidants 14 01082 g002aAntioxidants 14 01082 g002b
Figure 3. DVP profiles at different SE solutions with GC electrode adding 0.1 M phosphate buffer solution (pH 5) with açaí pulp extract (0.2%) at scan rate 100 mV s−1: (A) NaCl (0.1 M); (B) NaNO3 (0.1 M); and (C) comparative plots. The inset in Figure 3A corresponds to the zoom area for PBS + SE + Ethanolic extract profile.
Antioxidants 14 01082 g003
Figure 4. (A) CV profiles of ethanolic extract of açaí (0.2%) at different scan rates from 60 to 240 mV s−1 in PBS with NaCl using GC electrode. (B) Scan rate plot as a function of the current peak, (C) square root of scan rate plot as a function of the current peak, and (D) logarithm of scan rate plot as a function of the logarithm of the current peak in PBS with NaCl and ethanolic extract of açaí (0.2%). The red dashed line in (BD) represent the linear fit of the experimental data.
Antioxidants 14 01082 g004
Figure 5. Cyclic voltammogram at GC electrode with açaí extract (0.2%) in phosphate buffer solution (0.1 M), pH 5, and sodium chloride (0.1 M) at scan rate 100 mV s−1. The inset graph shows differential pulse voltammograms under the same conditions as CV.
Antioxidants 14 01082 g005
Table 1. Values obtained from the investigation of the effect of the current/potential signals (Figure 4) at 0.2% concentration of the ethanolic extract of açaí as a function of scan rate at GC electrode (7.2 mm2).
ѵ, mV s−1Eap, VEcp, VE = |EcpEap|iap, µAicp, µAi = |icpiap|
600.3610.3020.0590.957−1.1312.088
800.3680.2920.0761.301−1.4982.799
1000.3700.2870.0831.586−1.8373.423
1200.3730.2830.0901.976−2.2024.178
1400.3800.2610.1202.291−2.7435.033
1600.3830.2580.1252.572−3.0145.586
1800.3850.2480.1372.825−3.4726.298
2000.3920.2460.1463.119−3.7816.901
2200.4000.2460.1543.405−4.0567.461
2400.4020.2390.1643.647−4.4748.122
iap and icp are the anodic and cathodic current peaks, Eap and Ecp are the anodic and cathodic potential peaks, and ѵ is the scan rate.
Table 2. Electrochemical quantitative index (EQI) obtained for different fruits with a GC as a working electrode.
FruitElectrochemical AssayEQI, µA/VReference
Blackberry jam fruit (Randia formosa (Jacq.) K. Shum)SWV6.78[34]
Acerola CV5.80[23]
Blackberry (Rubus spp.)DPV0.738[21]
Mora de monte (R. glabratus Kunth)DPV2.26 × 10−5[36]
AçaíCV6.9[23]
Spray-dried açaí powderDPV0.168[21]
AçaíDPV1.08In this work
CV2.30
CV: cyclic voltammetry; DPV: differential pulse voltammetry; SWV: square wave voltammetry.
Table 3. Comparative summary of the antioxidant activity methods in existing literature [45].
MethodMechanismSample SuitabilityAdvantagesDisadvantagesLimitationsUsefulness
DPPHElectron or H-donation to DPPH radicalLipophilicSimple, fast, cost-effectiveNot suitable for hydrophilic antioxidants; sensitive to light/pHPoor correlation to biological systemsGood for rapid screening
ABTSElectron donation to ABTS•+ radicalHydrophilic and lipophilicBroad-range applicability, stableRequires pre-oxidation; possible overestimationNon-physiological radicalsExcellent for general antioxidant profiling
FRAPReduction of Fe3+ to Fe2+HydrophilicReproducible, easyOnly reducing power; acidic pH requiredNot suitable for all antioxidantsUseful for total reducing capacity
ORACScavenging of peroxyl radicalsBiological fluids, extractsPhysiologically relevant radicals, kinetic dataTime-consuming, costly, fluorescent probe neededSensitive to conditions, reproducibility issuesIdeal for biological antioxidant capacity
CUPRACReduction of Cu2+ to Cu+Hydrophilic and lipophilicStable reagents, broad compatibilityCan have interferencesNot widely used, Cu not biologically relevantEffective for mixed antioxidant systems
TPCReaction with Folin–Ciocalteu reagentPhenolic compoundsQuick, correlates with phenolic contentNon-specific, including non-phenolicsNot a true antioxidant assayUseful for phenolic content estimation
Table 4. Comparison of EQI with conventional antioxidant assays [45].
FeatureEQIDPPHABTSFRAPORACCUPRACTPC
PrincipleElectron transfer (redox potential and current)Radical scavengingRadical scavengingReducing powerPeroxyl radical scavengingCu2+ reducing powerTotal reducing compounds
Measurement TypeElectrochemicalSpectrophotometricSpectrophotometricSpectrophotometricFluorescenceSpectrophotometricSpectrophotometric
KineticsFast; real-time responseEnd-pointEnd-pointEnd-pointKineticEnd-pointEnd-point
SensitivityHigh for electroactive compoundsModerateModerateModerateHighModerateModerate
SelectivitySelective for electroactive antioxidantsNon-selectiveNon-selectiveNon-selectiveMore selectiveNon-selectivePoor selectivity
Biological RelevanceModerate; mimics oxidative mechanismsLowLow–ModerateLowHighModerateIndirect
Cost and SimplicityRequires potentiostat; moderate trainingSimple and cheapModerateSimpleExpensive instrumentationModerateVery simple
Solubility RangeHydrophilic and lipophilic (depends on electrode material)Mostly lipophilicBothHydrophilicHydrophilicBothHydrophilic
ReproducibilityHigh, if properly standardizedVariableVariableGoodVariableGoodVariable
Disclaimer/Publisher’s Note: The statements, opinions and data contained in all publications are solely those of the individual author(s) and contributor(s) and not of MDPI and/or the editor(s). MDPI and/or the editor(s) disclaim responsibility for any injury to people or property resulting from any ideas, methods, instructions or products referred to in the content.