1. Introduction
Camellia oleifera Abel., a woody oil plant of the Theaceae family native to China, is one of the world’s four major woody oil crops, along with olive, oil palm, and coconut [
1]. The processing of its fruits yields a substantial amount of seed shells, accounting for approximately 60% of the fresh fruit weight [
2]. Currently, these shells remain largely underutilized—commonly disposed of by incineration or limited to low-value lignin extraction—leading to significant resource waste and environmental concerns [
3].
Plant polyphenols are recognized for their notable biological activities, including antioxidant, anti-inflammatory, and antimicrobial properties [
4], presenting opportunities for innovative applications in sectors such as pharmaceuticals and cosmetics [
5]. Previous studies have identified
C. oleifera shells as a rich source of polyphenols, comprising 8.2–12.5% of their dry weight, and containing compounds such as rutin, hyperoside, licorice flavanone, proanthocyanidin, and isoquercitrin, with radical scavenging capacities reaching up to 89.3% [
6].
The purification of bioactive compounds from crude plant extracts is crucial for both natural medicine research and industrial applications. However, conventional extraction techniques face considerable limitations: heat reflux may degrade thermolabile compounds due to prolonged high temperatures; supercritical CO
2 extraction entails high operational costs [
7]; and enzyme-assisted extraction suffers from issues related to stability and scalability [
8]. Moreover, most existing studies focus merely on crude extract preparation, which falls short of industrial requirements for high-purity polyphenol products. These attributes make the UAE a highly promising method for industrial-scale polyphenol extraction.
In this context, ultrasound-assisted extraction (UAE) offers distinct advantages, such as reduced solvent consumption (by 30–50%), shorter processing times (over 60% faster), lower energy input, and improved preservation of bioactive compounds—aligning effectively with green chemistry principles [
9,
10].
This study aims to optimize UAE for the recovery of polyphenols from C. oleifera shells using Box–Behnken response surface methodology (RSM), examining the interactive effects of ultrasonic time, ethanol concentration, and liquid-to-material ratio on extraction yield. The obtained polyphenols were further purified through dynamic adsorption with macroporous resin and characterized via high-performance liquid chromatography coupled with quadrupole/Orbitrap high-resolution mass spectrometry (HPLC-Q-Exactive-MS). In vitro assays were conducted to assess their antioxidant, anti-inflammatory, whitening, and antimicrobial properties. Our work not only establishes an efficient and scalable UAE protocol for the valorization of C. oleifera shells but also provides a methodological framework for the high-value, sustainable utilization of analogous agroforestry byproducts. This approach underscores their significant potential in enhancing antioxidant performance, thereby supporting the application of natural antioxidants in the realm of sustainable resource recovery.
2. Materials and Methods
2.1. Chemicals and Reagents
All chemicals and reagents used were of analytical grade unless otherwise stated. ABTS+·, DPPH, sodium selenite (chemically pure), trichloroacetic acid, trichloromethane, anhydrous ethanol, n-butanol, nitric acid, sodium carbonate, anhydrous dextrose, phenol, sulfate, cholesterol, magnesium sulfate, calcium chloride, methanol, and acetonitrile were sourced from Chengdu Cologne Chemical Co., Ltd. (Chengdu, China). The CCK-8, ROS, and Griess detection kits were procured from Chengdu Gaoxin District Yiyuan Experimental Consumables Business Department (Chengdu, China). The RPMI-1640 medium was purchased from HyClone (a Cytiva company) (Marlborough, MA, USA). Tryptone, peptone, yeast extract, and agar powder were obtained from Oxoid Ltd. (Hampshire, IL, USA). The HPLC-Q-Exactive-MS analysis was performed on an instrument from Biotech Pack Co., Ltd. (Beijing, China).
Microbial strains (Escherichia coli, Staphylococcus aureus, Pseudomonas aeruginosa, Bacillus subtilis, and Candida albicans) were obtained from the Department of Bioengineering and Applied Biology, Sichuan Agricultural University. Human umbilical vein endothelial cells (HUVECs) and mouse macrophage cells (RAW264.7) were obtained from the Chinese Academy of Sciences (Shanghai, China).
2.2. Sample Preparation
Fresh C. oleifera shells were collected from the experimental field in Tianquan County, Sichuan Province, in 2023. The samples were washed, dried, ground (60-mesh sieve), and stored at −20 °C until use.
2.3. UAE of Polyphenols
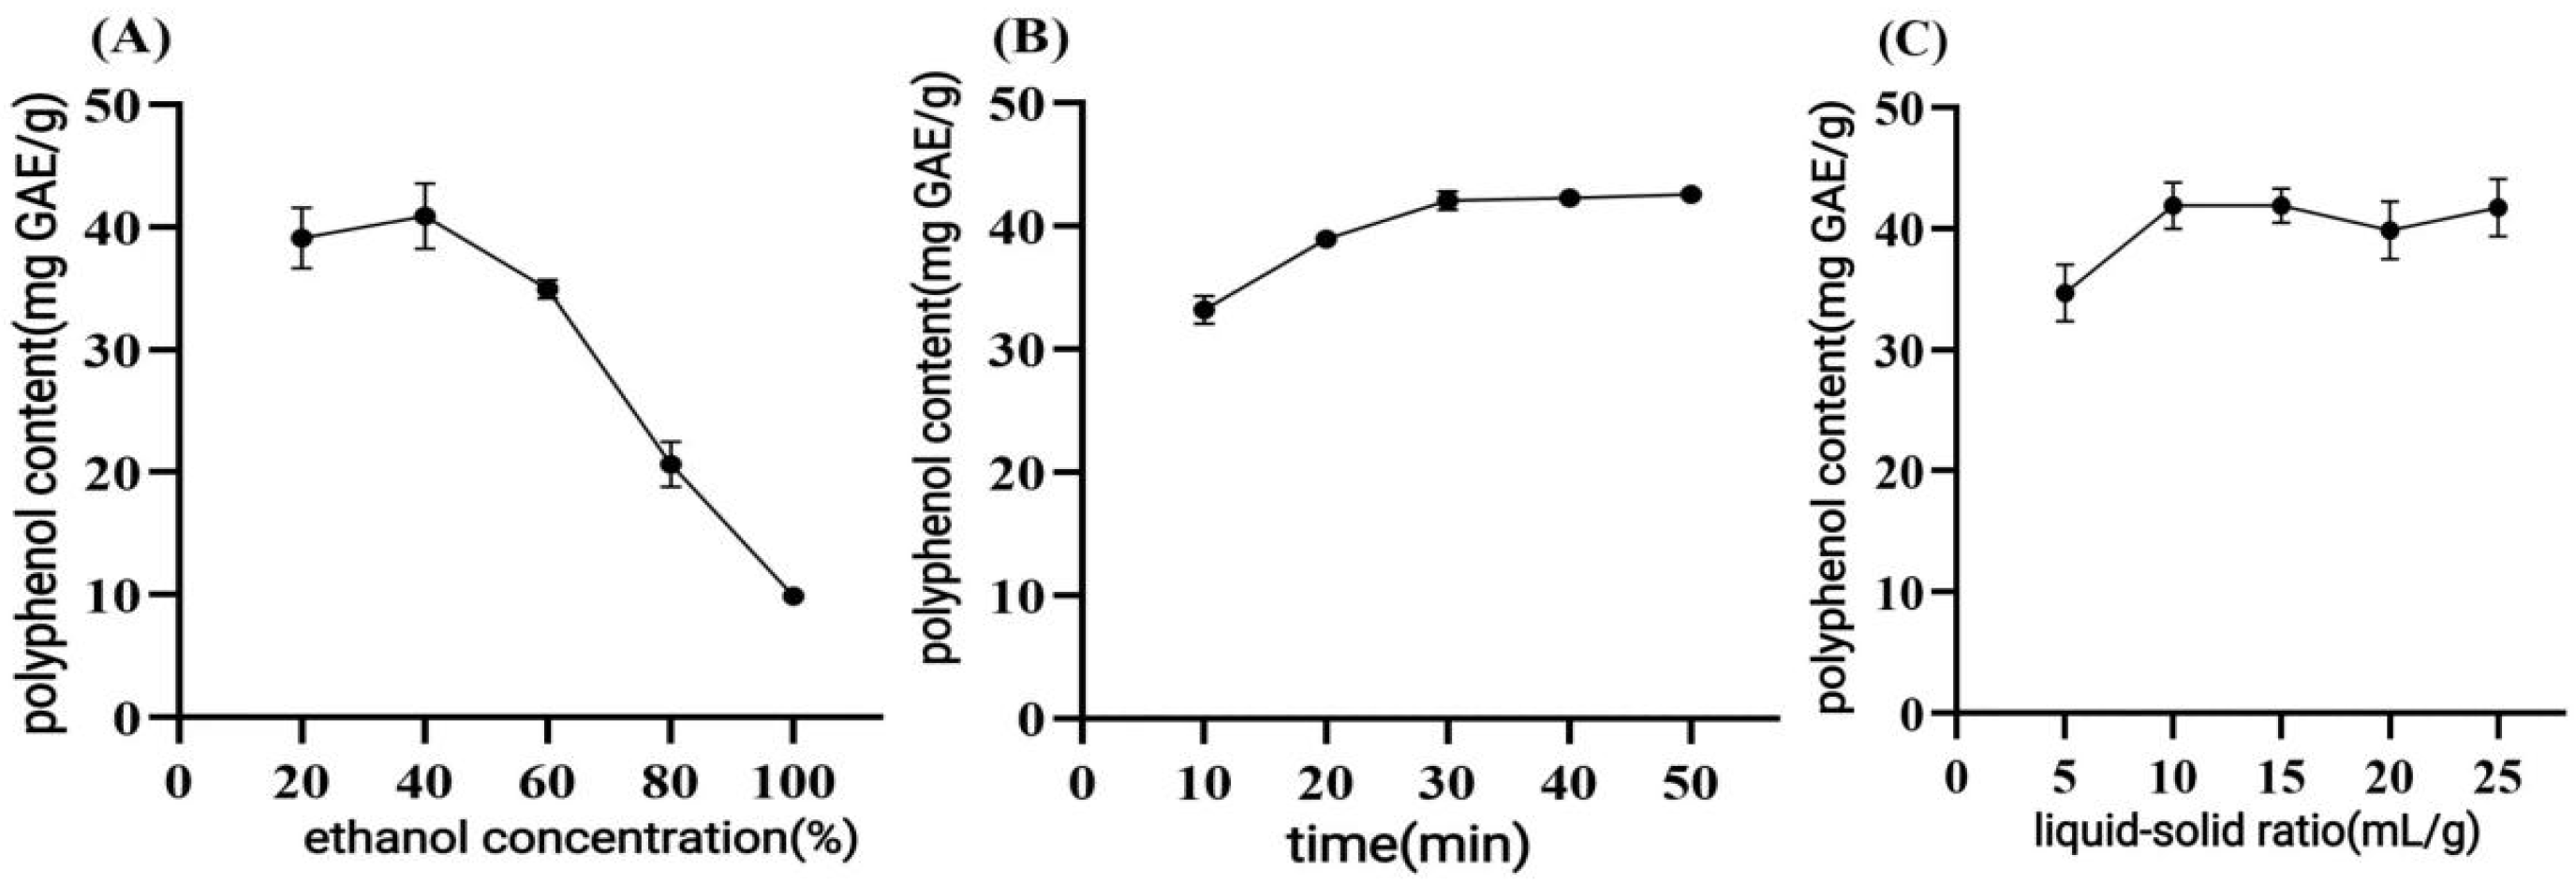
Polyphenol extraction was performed using an ultrasonic cleaner (KH7200DB, Kunshan Wo Chuang Ultrasonic Instruments Co., Ltd., Kunshan, China) with fixed parameters: power (270 W) and temperature (55 °C). To investigate the effects of different factor levels on the polyphenol extraction rate (
Table 1).
2.3.1. Box–Behnken Design (BBD)
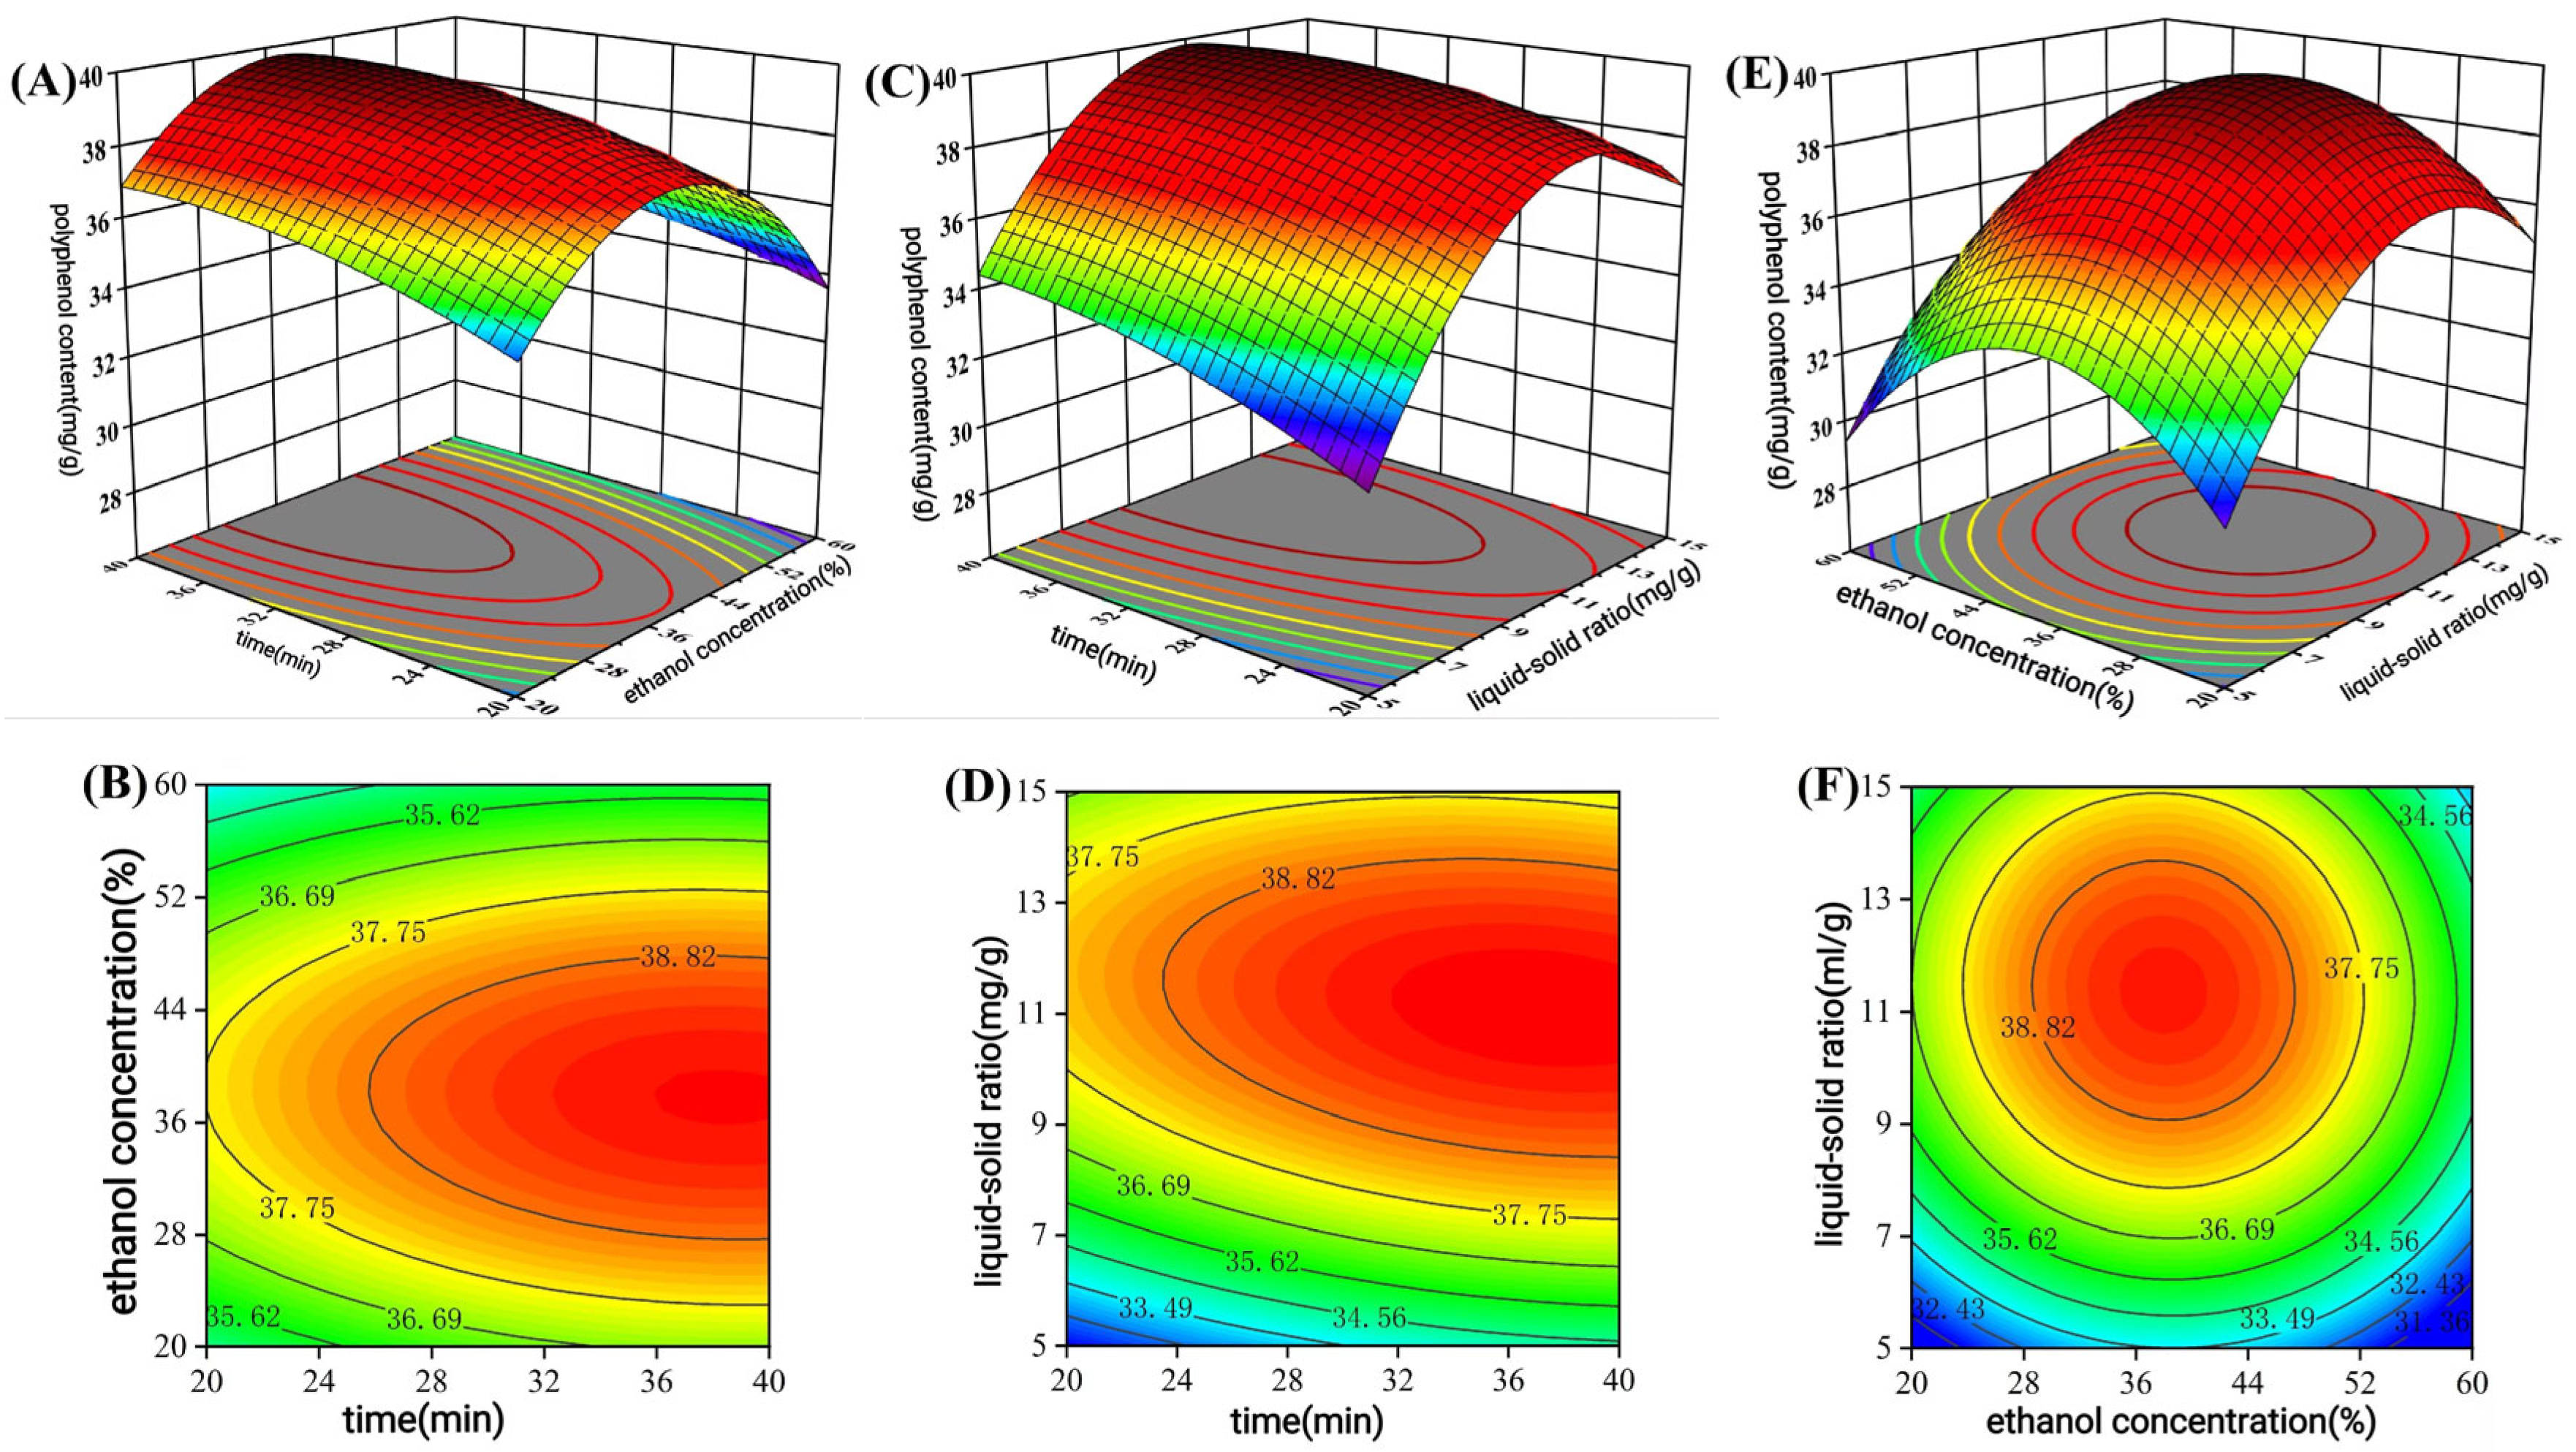
A Box–Behnken design (three factors, three levels) was then employed for optimization (
Table 2).
2.3.2. Polyphenol Quantification
Total polyphenol content (TPC) was determined using the Folin–Ciocalteu method [
11], according to Equation (1):
where C = concentration (μg/mL), V = volume (mL), N = dilution factor, and M = sample weight (g).
2.4. Optimization of Polyphenol Purification Process
2.4.1. Preparation of Crude Polyphenol
The extract was concentrated by rotary evaporation and freeze-dried.
2.4.2. Static Adsorption–Desorption Experiments of Macroporous Resins
Determination of Polyphenol Adsorption and Desorption Rates
Weighed 1.0 g (dry weight) of the pretreated macroporous resin was mixed with 25 mL of the
C. oleifera polyphenol solution to be purified (9 mg/mL) in a sealed container, then shaken at 25 °C at 150 rpm for 24 h. The polyphenol content of the supernatant was determined. After filtration, the resin was washed with ultrapure water to remove surface moisture and then mixed with 25 mL of 70% ethanol. The mixture was sealed and shaken under the same conditions for 24 h before determining the polyphenol content in the supernatant. The adsorption rate was calculated according to Equation (2), and the desorption rate according to Equation (3).
where A = adsorption rate; D = desorption rate; C
0 = content before adsorption (mg/mL); C
1 = content after adsorption (mg/mL); C
2 = content after desorption (mg/mL).
Construction of Static Adsorption–Desorption Profiles
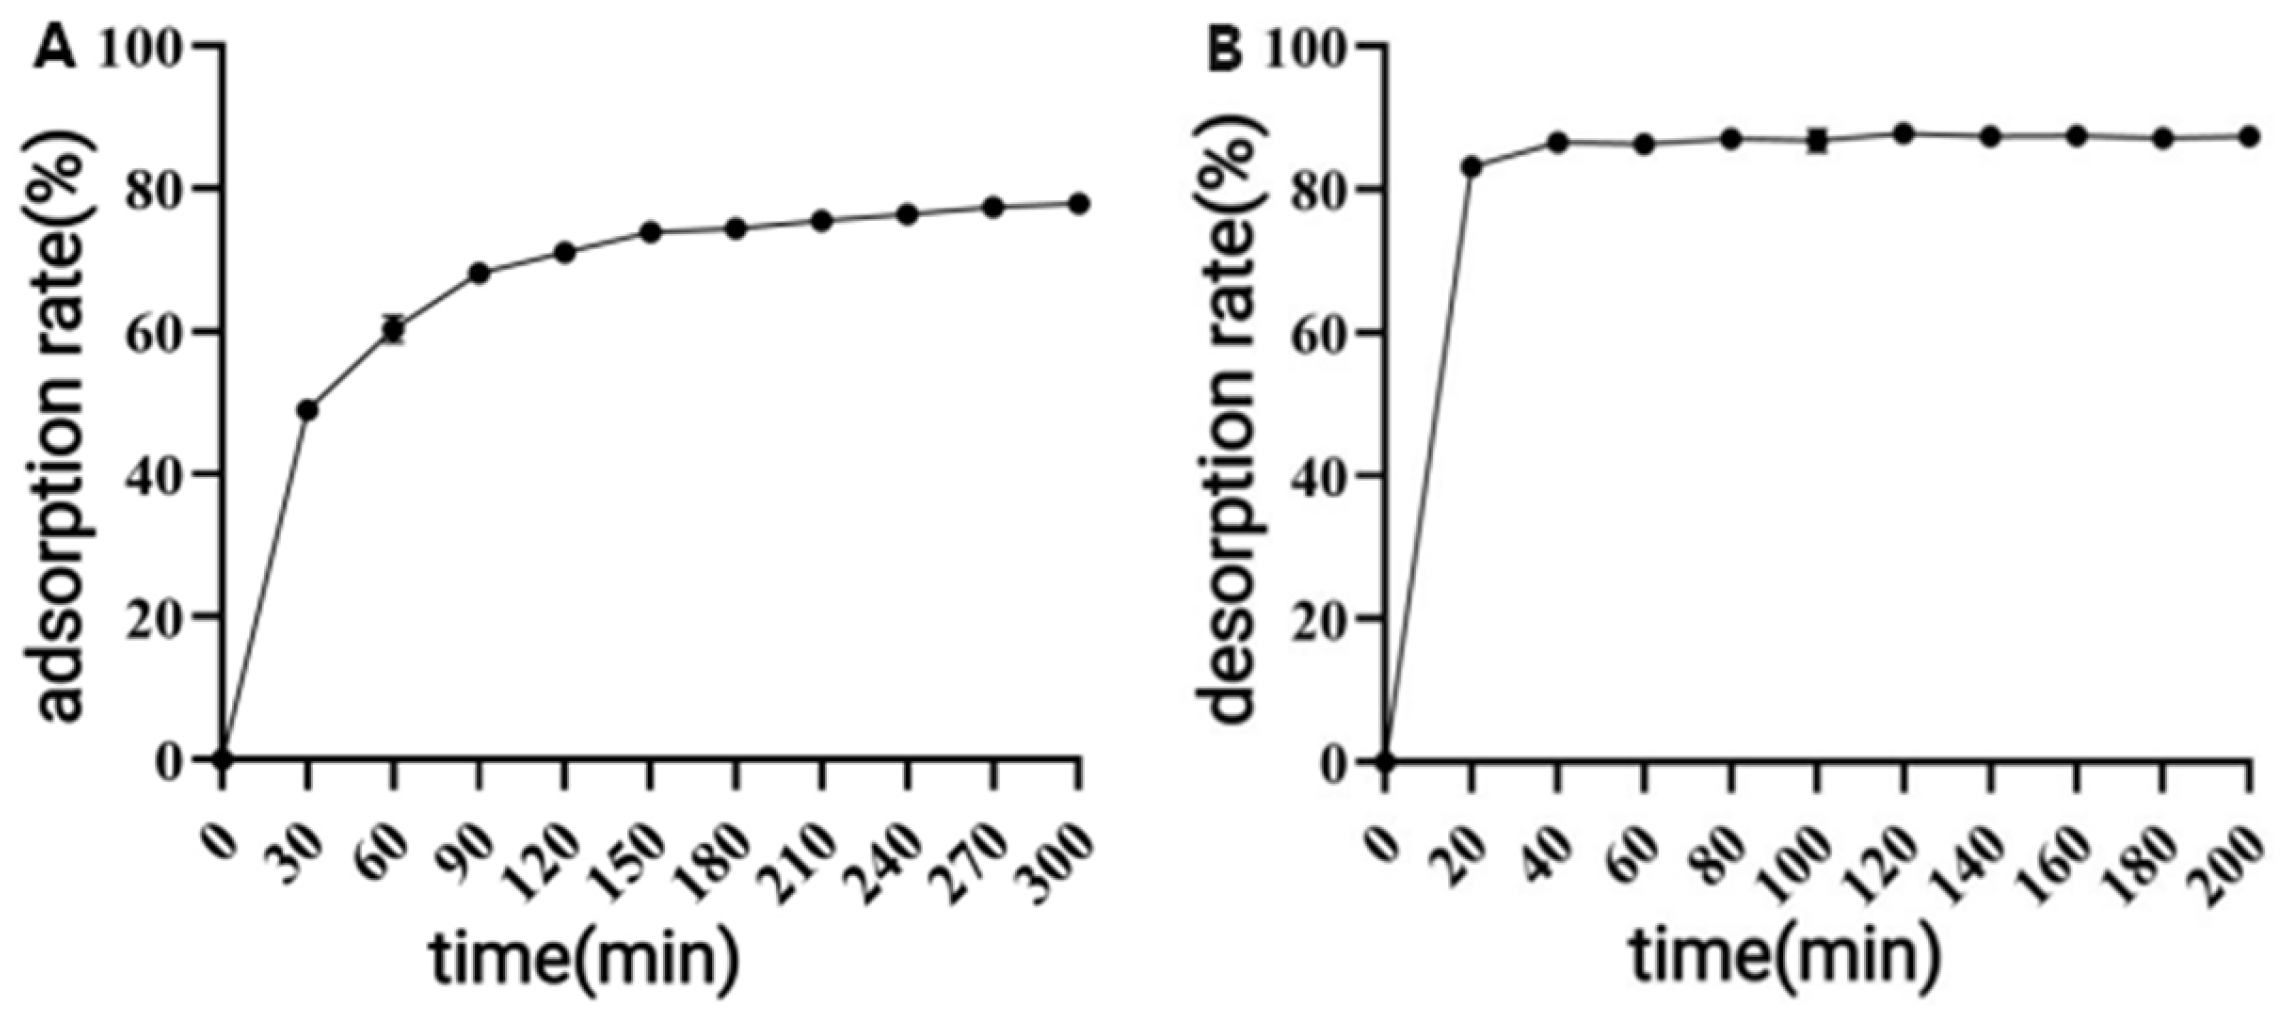
Adsorption was performed by mixing 1.0 g of resin with 25 mL of a 9 mg/mL (pH 2) solution of polyphenol to be purified under the same conditions. The polyphenol concentration in the supernatant was measured every 30 min until equilibrium was reached. The adsorption rate was calculated, and the adsorption kinetic curve was plotted. After adsorption, the resin was washed with ultrapure water, and desorption was performed by adding 25 mL of 70% ethanol under the same conditions. The polyphenol concentration was measured at 20 min intervals until equilibrium was reached. The desorption rate was calculated, and the desorption kinetic curve was plotted.
Study on the Adsorption and Desorption Characteristics of Macroporous Resin for Polyphenols
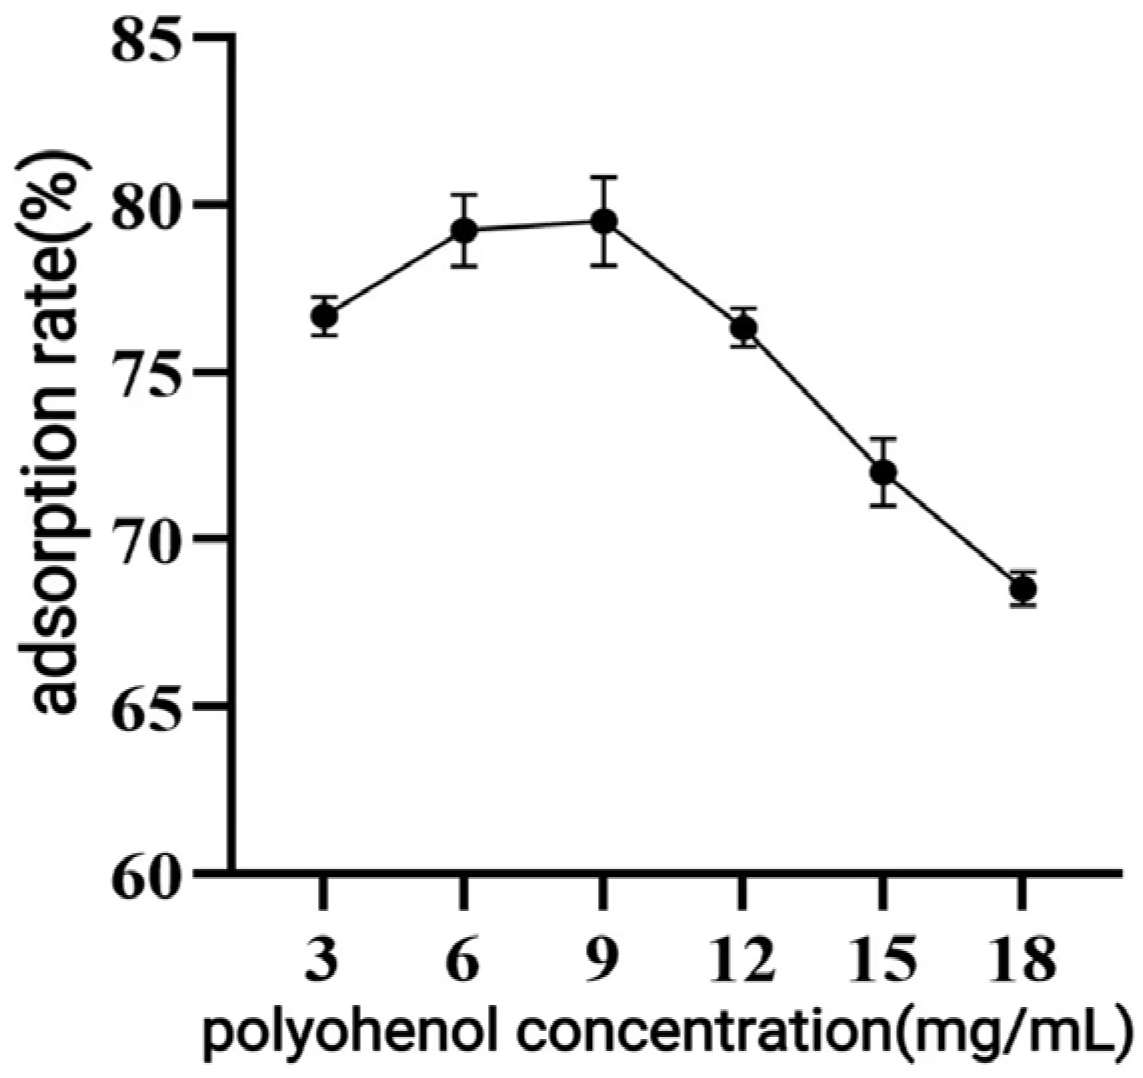
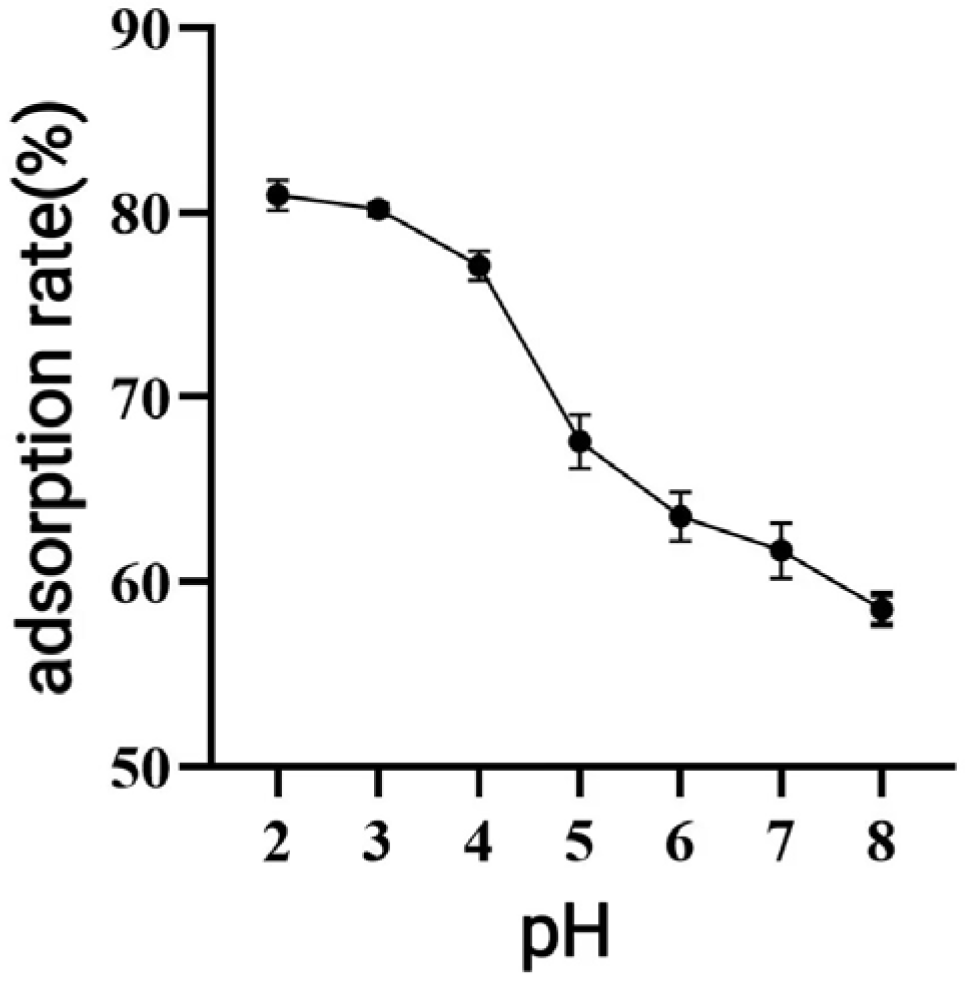
Weighing 1.0 g of pretreated resin and 25 mL of a solution of polyphenol to be purified with different concentrations (3–18 mg/mL, pH 2) or different pH (2–8, 9 mg/mL), the adsorption was carried out at 25 °C and 150 rpm. The adsorption rate was determined to evaluate the effect of concentration and pH of the upper sample solution. The adsorption saturated resin was washed with ultrapure water and desorbed with 25 mL of ethanol solutions at varying concentrations (10–90%) under the same conditions for 24 h. The desorption rate was calculated by determining the polyphenol content of the desorbed liquid to determine the optimal desorption conditions.
2.4.3. Dynamic Adsorption–Desorption Experiments of Macroporous Resin
A certain amount of pretreated macroporous resin was loaded into a 1.5 cm × 30 cm chromatography column according to the wet loading method and pressed with ultrapure water until the height of the column bed remained unchanged (the column volume was 15 mL).
Determination of Leakage Curve
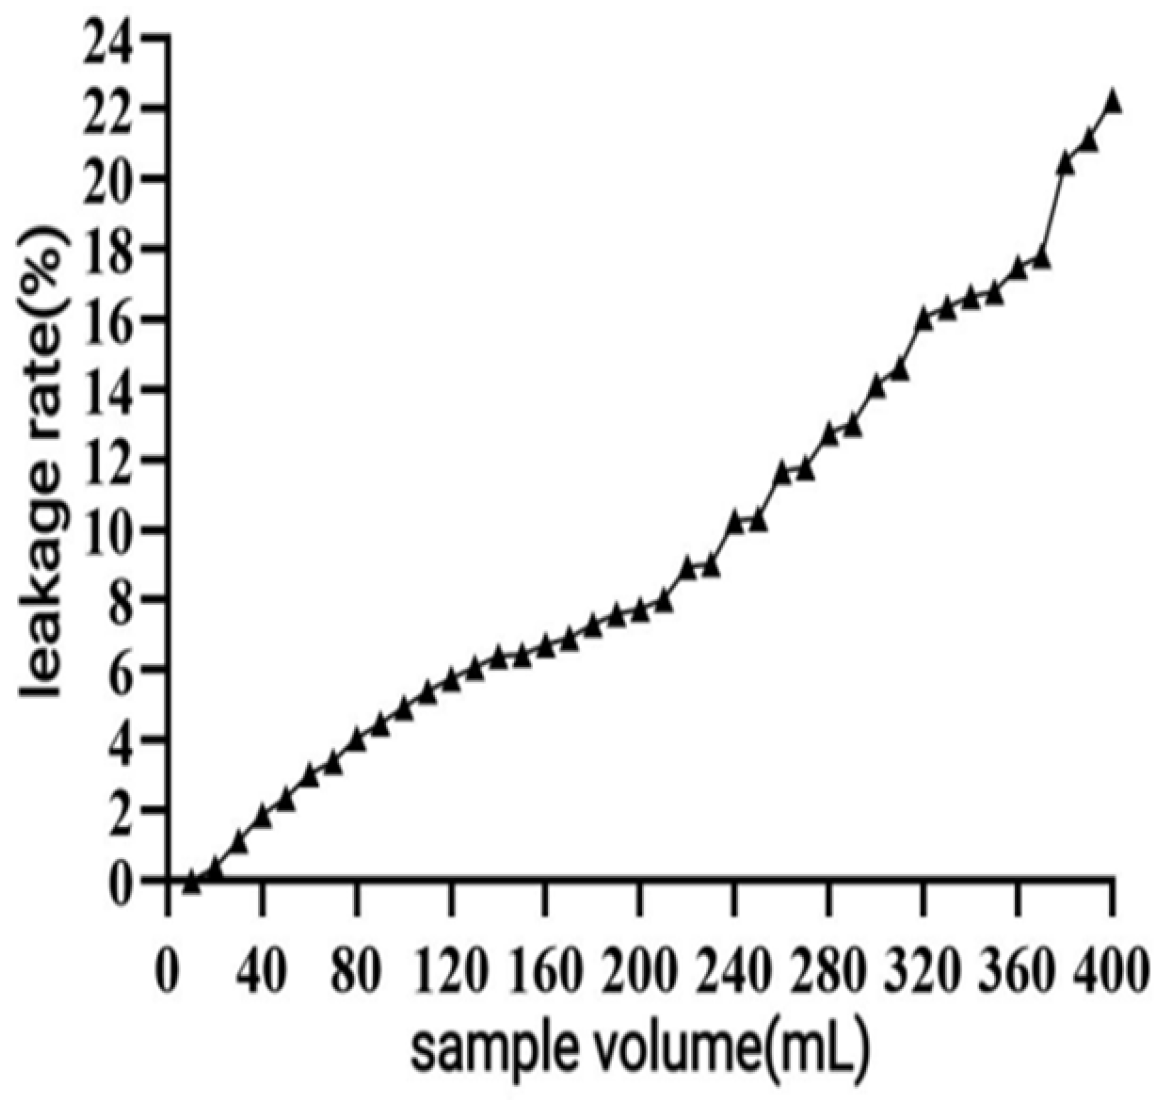
400 mL of the liquid to be purified was up-sampled at a flow rate of 1 mL/min, the effluent was picked up, and another centrifuge tube was changed after every 7.5 mL (0.5 BV) until the polyphenol concentration of the effluent reached 10% of the concentration of the up-sampled liquid (the leakage point), and the leakage curve was plotted.
Determination of Elution Curve
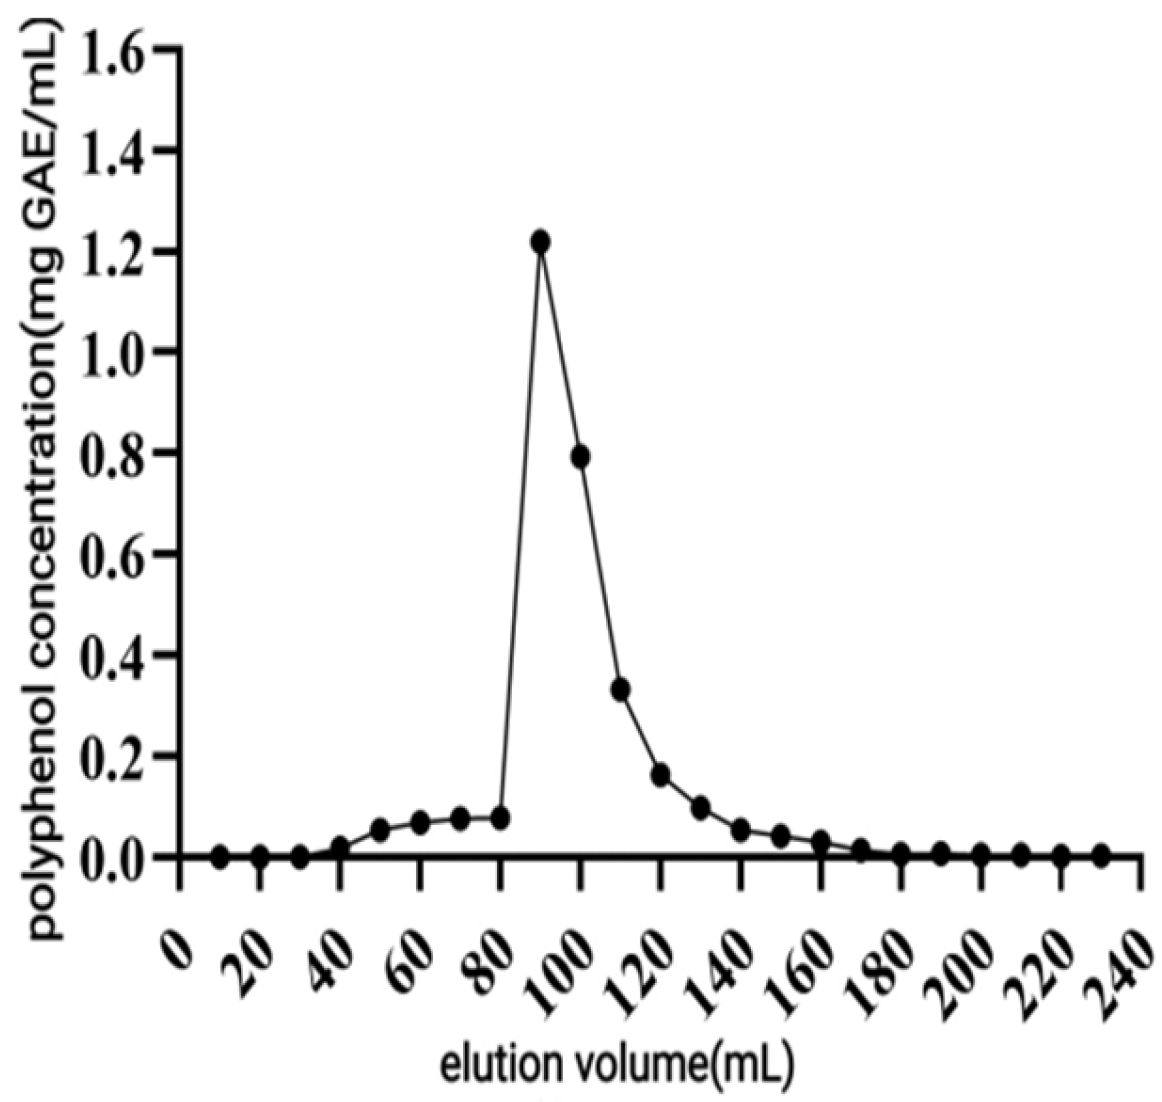
Take 100 mL of C. oleifera shell polyphenol to be purified solution at a rate of 1 mg/mL for the upper sample after the ultrapure water cleaning until the effluent is colorless. Elution was carried out with 70% ethanol at 0.5, 1, 1.5, and 2 mL/min, respectively. The polyphenol content of the eluate was determined, and the elution curve was plotted.
Effect of Elution Speed on the Desorption Efficiency of Macroporous Resin
The C. oleifera shell polyphenol was purified in a solution at a speed of 1.0 mL/min for the up-sampling, and the deionized water was cleaned until the effluent became colorless. Using 70% ethanol as the eluent, the elution was carried out at a speed of 1.0 mL/min, and the polyphenol concentration of the eluent was measured to determine the elution speed.
Validation of the Optimal Process
According to the optimal process conditions derived from the screening, three sets of parallel tests were conducted to determine the polyphenol content of the eluate and calculate the purity and recovery of CPCS before and after purification.
2.5. HPLC-Q-Exactive-MS Analysis
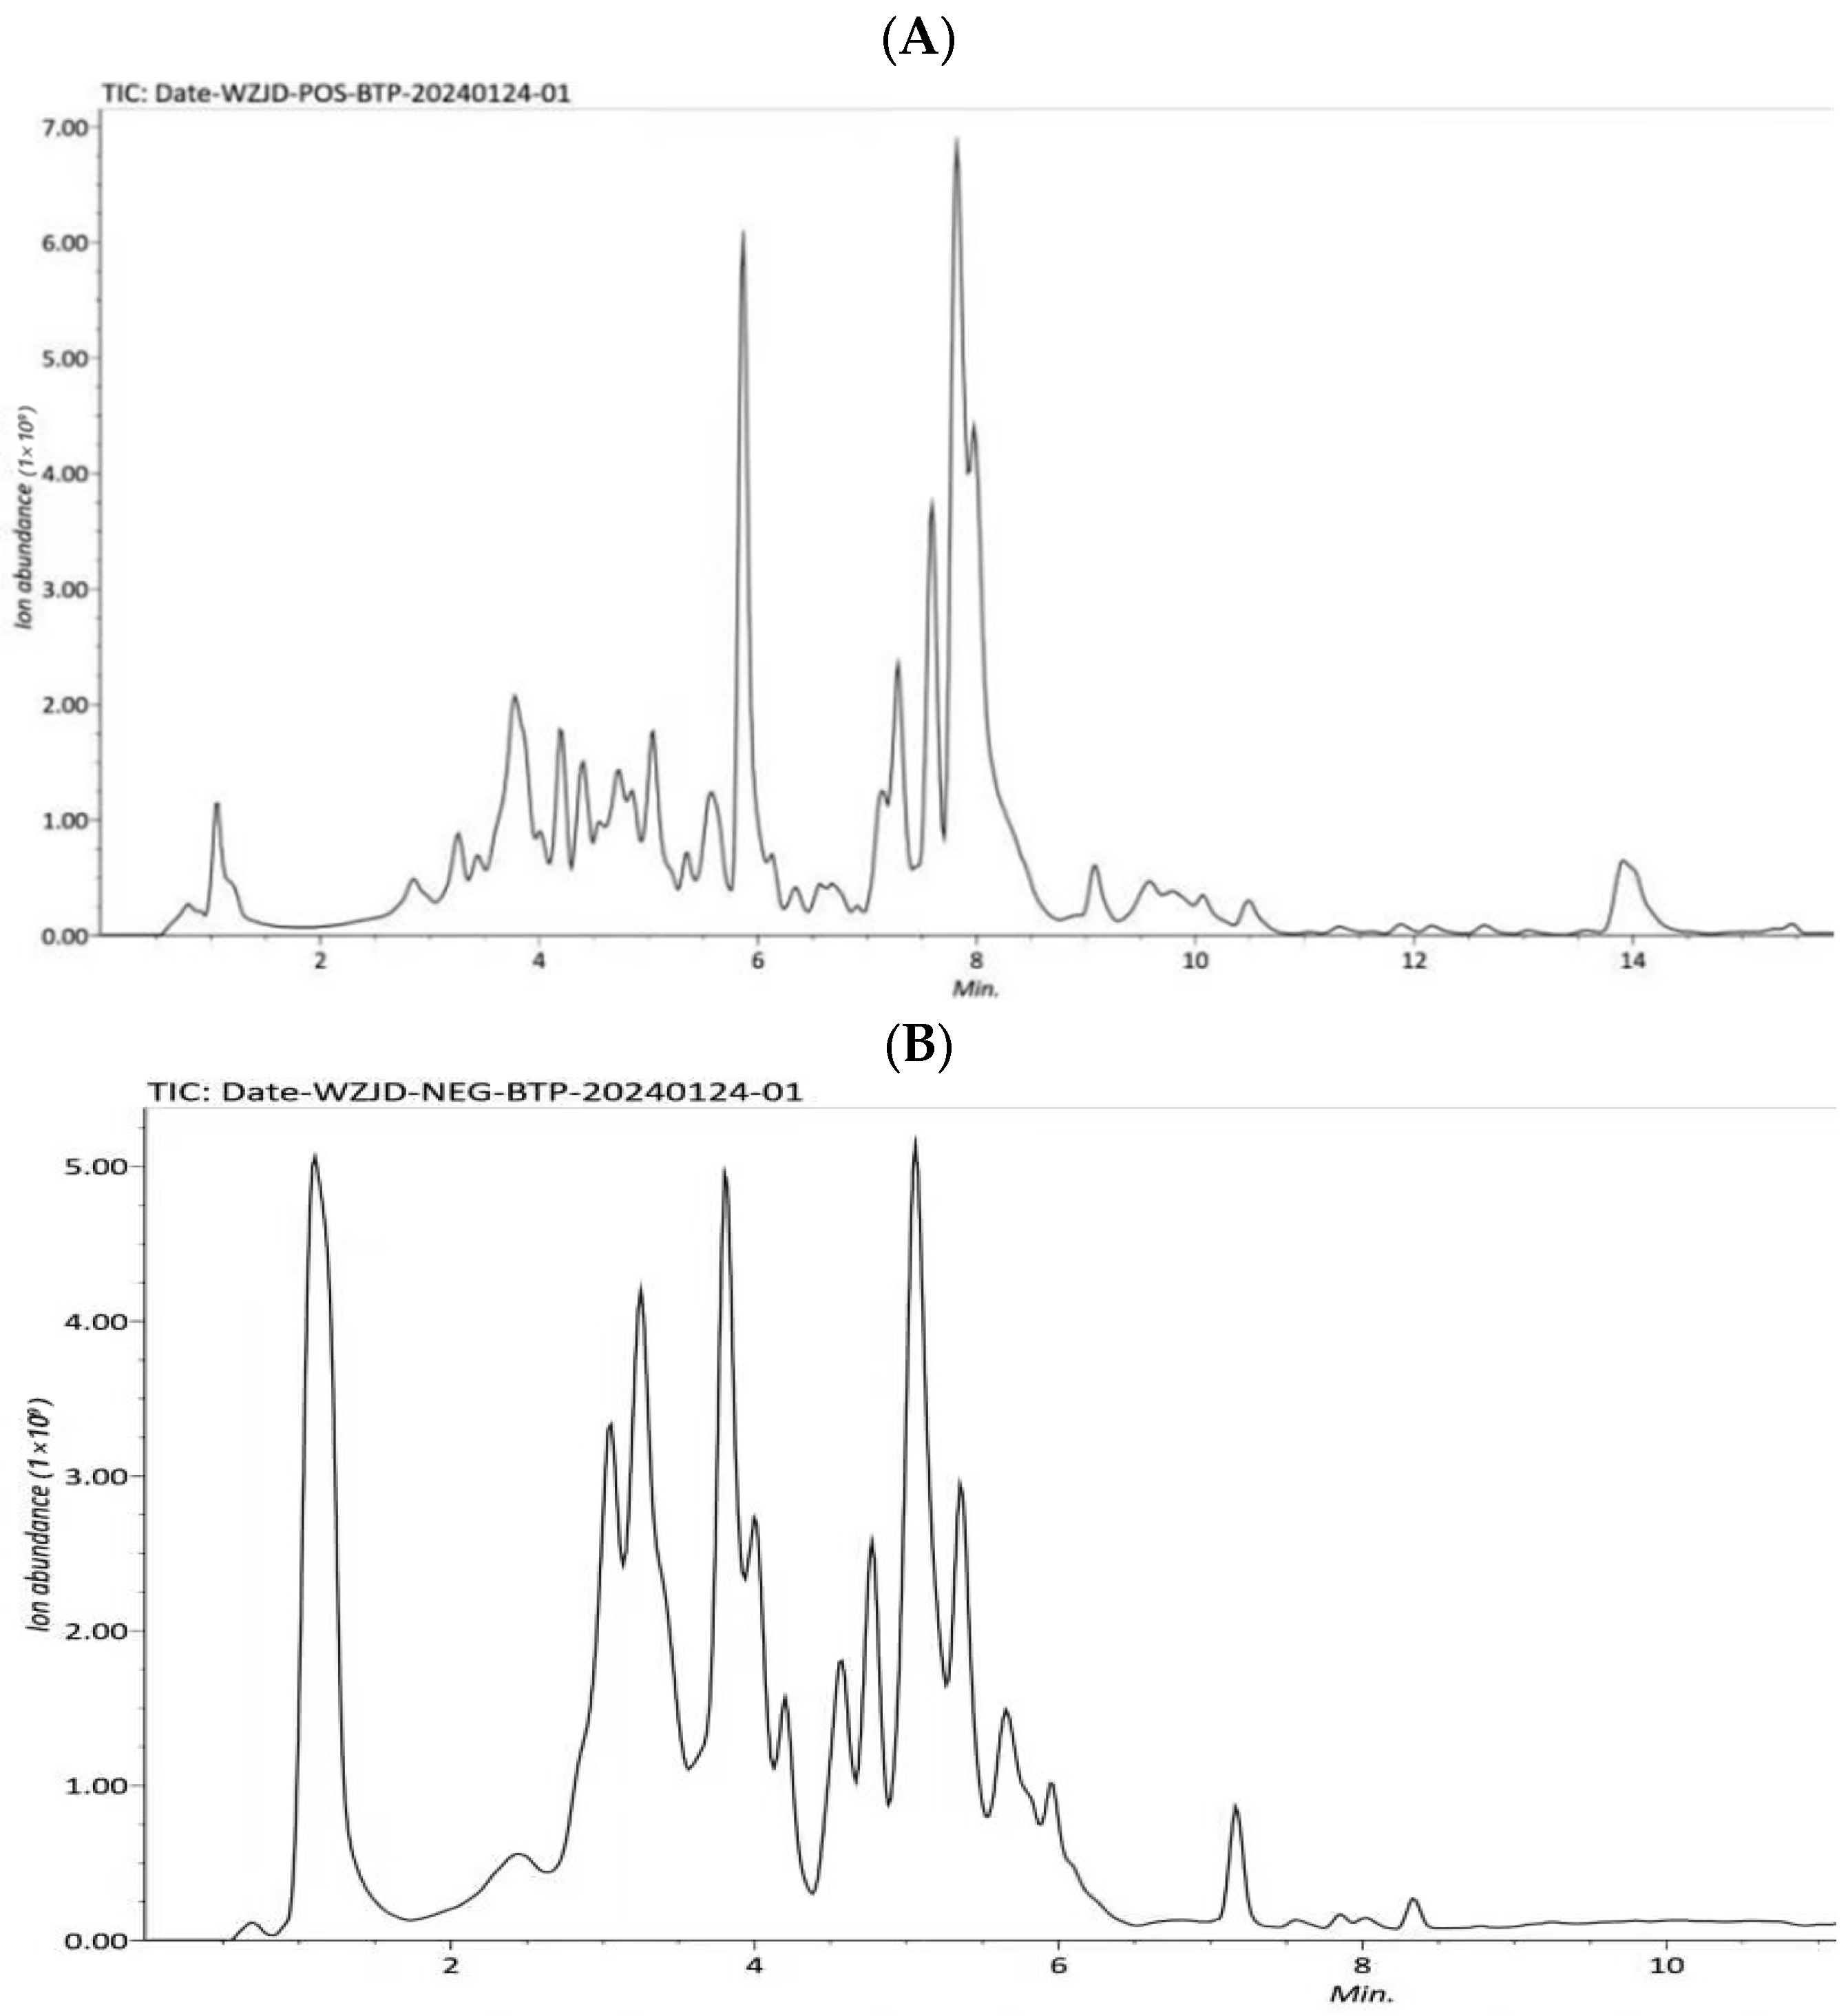
The analysis of CPCS was performed using HPLC-Q-Exactive-MS. The separation was carried out on a Waters HSS T3 column (2.1 mm × 100 mm, 1.7 μm) with a column temperature of 40 °C. The flow rate was set at 0.3 mL/min, and the injection volume was 5 μL. Mobile phase A consisted of an aqueous formic acid solution (0.1%), while mobile phase B was pure methanol (100%). The elution program was as follows: 0–1 min, 2–2% B; 1–5.5 min, 2–100% B; 5.5–14 min, 100–100% B; 14–15 min, 100–2% B; 15–16 min, 2–2% B.
2.6. In Vitro Antioxidant Capacities
2.6.1. ABTS+·/DPPH Radical Scavenging Capacity
ABTS
+· radical scavenging capacity of the extracts was determined according to a study provided by Re et al. [
12] and optimized. ABTS
+· stock solution (7.4 mmol/L) and potassium persulfate stock solution (2.6 mmol/L) were mixed in equal quantities and left in the dark for 12 h. Before use, the ABTS
+· radical solution was diluted with PBS buffer to an absorbance of 0.70 ± 0.02 at 734 nm. 100 μL solution was added to 96 wells with an equal volume of extraction sample solution (or Vc). The absorbance of the mixture was measured at 734 nm after storage in the dark for 6 min. The clearance was calculated according to Equation (6):
where A
0 = absorbance of blank group; A
1 = absorbance after reaction with ABTS
+· working solution; A
2 = background absorbance after mixing with ultrapure water.
DPPH radical scavenging assay of the extract was detected with a slight adjustment to the method of Ou et al. [
13]. The polyphenol extracts or Vc (70 μL) and 0.4 mmol/L DPPH solution (140 μL) were added into a 96-well plate and shaken and mixed, then left in the dark for 30 min. The absorbance of the mixture was measured at 517 nm. The clearance rate was calculated according to the equation (same as the ABTS
+· equation).
2.6.2. Hydroxyl Radical (·OH) Scavenging
An adapted experiment to assess the ability to scavenge ·OH radicals was carried out by the procedure outlined by Wang et al. [
14] and optimized: 0.50 mL of 0.15 mol/L FeSO
4 was mixed with 0.50 mL of 9 mmol/L H
2O
2 solution, and incubated in the lucifuge for 5 min, then 0.20 mL of 2 mmol/L salicylic acid-ethanol solution and 0.10 mL of the extracted sample solution or Vc was added in turn, following thorough mixing and incubating in the lucifuge at 37 °C for 60 min. Determine the absorbance of the solution at a wavelength of 510 nm. The scavenging activity was calculated according to Equation (7):
where A
0 = absorbance of blank group; A
1 = absorbance of sample; A
2 = background absorbance of sample.
2.6.3. Reducing Power
A volume of 0.2 mL of sample or VC solution was mixed with 0.5 mL of 0.2 mol/L PBS (pH 7.4) and 0.5 mL of 1% potassium ferricyanide solution. After this mixture was heated in a water bath at 50 °C for 20 min, a volume of 0.5 mL of 10% TCA was added and cooled at 0 °C for 5 min. 0.4 mL of 0.1% ferric chloride solution and 2 mL of distilled water were added, and then the solution absorbance was measured spectrophotometrically at 700 nm.
2.6.4. Cytoprotection Against Oxidative Stress
HUVEC Culture and Sample Preparation
HUVEC were cultured in RPMI-1640 medium containing 10% fetal bovine serum and 1% penicillin (37 °C, 5% CO2). When the cell density reached 85%, the cells were digested with trypsin for 2 min, and fresh medium was used to terminate the digestion and collect the cells, which were washed twice with PBS, centrifuged at 1200 r/min for 3 min, and passaged at a 1:2 ratio.
The experimental samples were dissolved in DMSO and prepared as a 1600 μg/mL master mix (final concentration of DMSO < 0.05%) using RPMI-1640 medium, filtered through a 0.45 μm filter membrane, and then diluted twofold to 25 μg/mL for reserve.
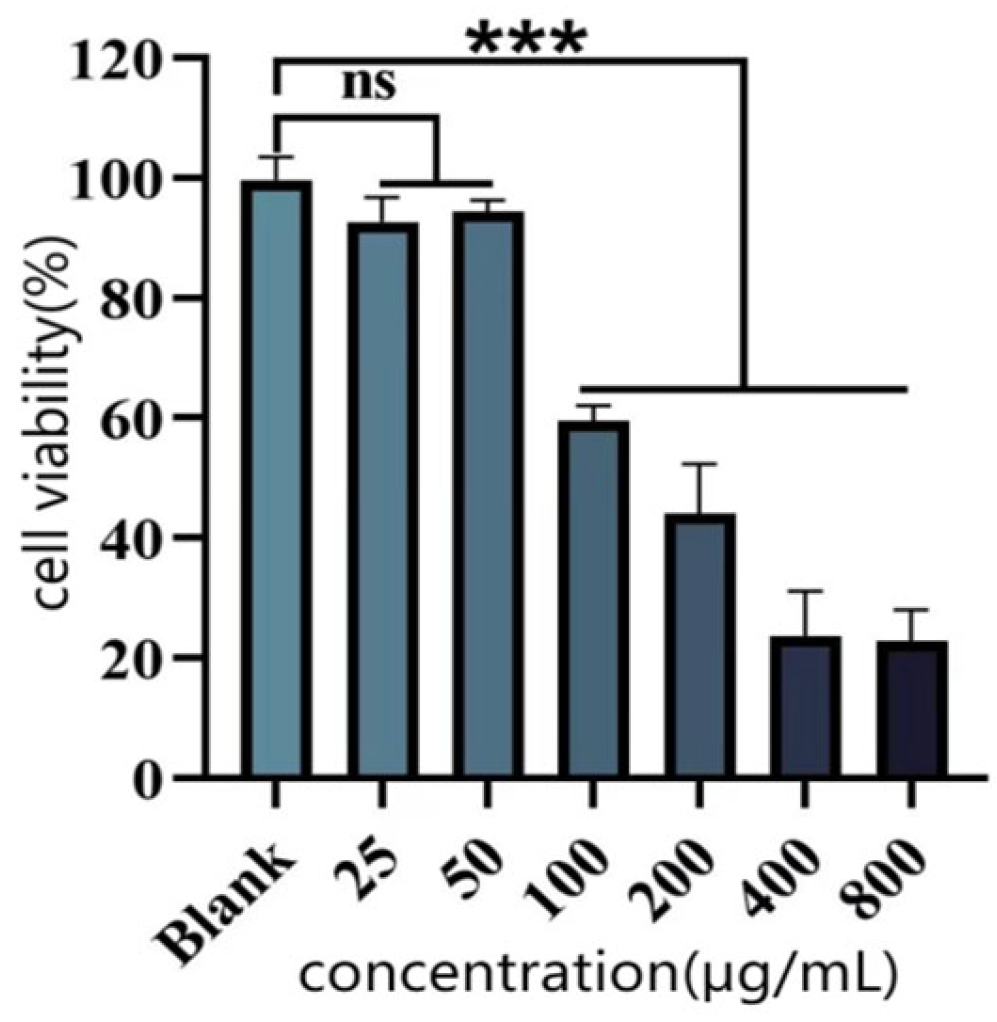
Cytotoxicity Assay (CCK-8 Method)
The CCK-8 assay was employed to assess the effect of purified polyphenols from
C. oleifera shells on the viability of HUVEC (using RPMI-1640 medium containing 10% fetal bovine serum and 1% penicillin, routinely cultured at 37 °C in a 5% CO
2 incubator) were inoculated in 96-well plates at a density of 5 × 10
3 cells/well, and cultured for 12 h to affix the walls, different concentrations of polyphenols were added and treated for 24 h. The medium was aspirated and discarded, and 100 μL of fresh medium containing 10% CCK-8 was added. After incubation for 45 min, the absorbance at 450 nm was measured. The cell viability was calculated by the following Equation (8):
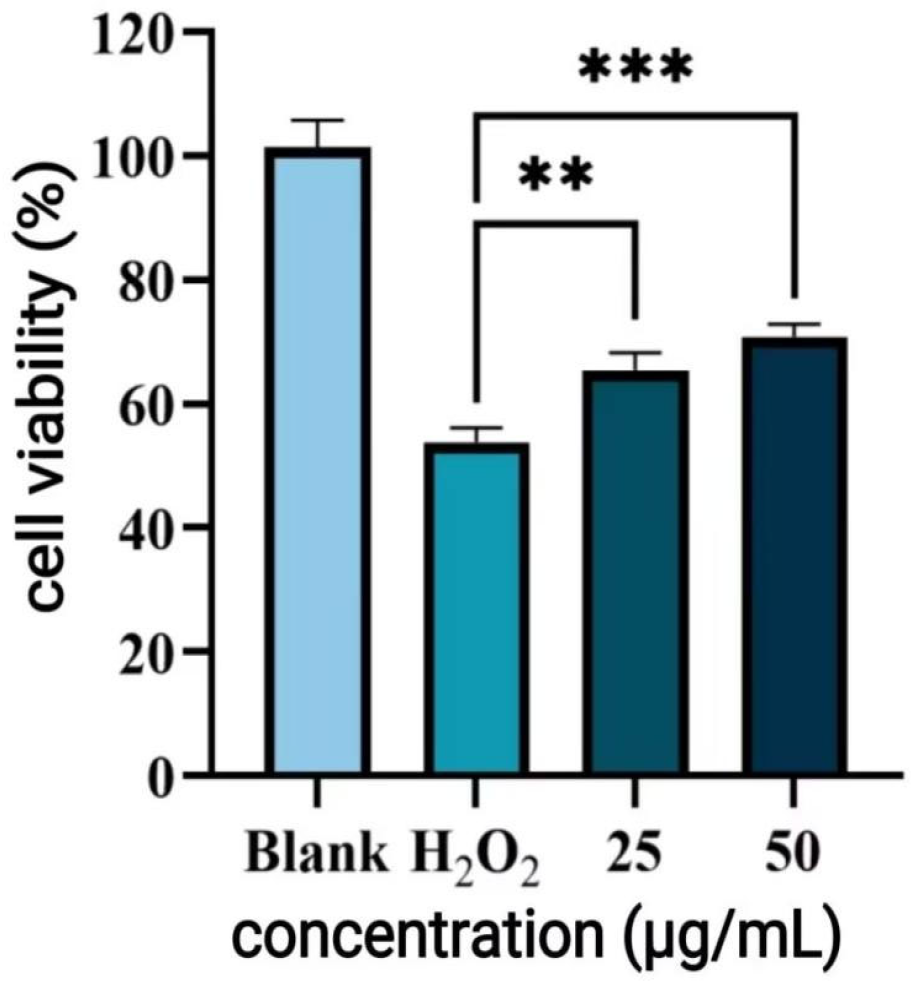
H2O2 Induced Damage
After pre-incubation of HUVEC with polyphenols for 24 h, 100 μM of H2O2 solution was added to 100 μL of culture for 5 h. Cell viability was determined by Equation (8).
Measurements of Intracellular Reactive Oxygen Species (ROS)
Referring to the method of J. Das et al. [
15]. The HUVEC were exposed to DCFH-DA, and the fluorescence intensity was subsequently analyzed by flow cytometry. The overall intracellular ROS levels were quantified as the mean DCF fluorescence intensity of the cells.
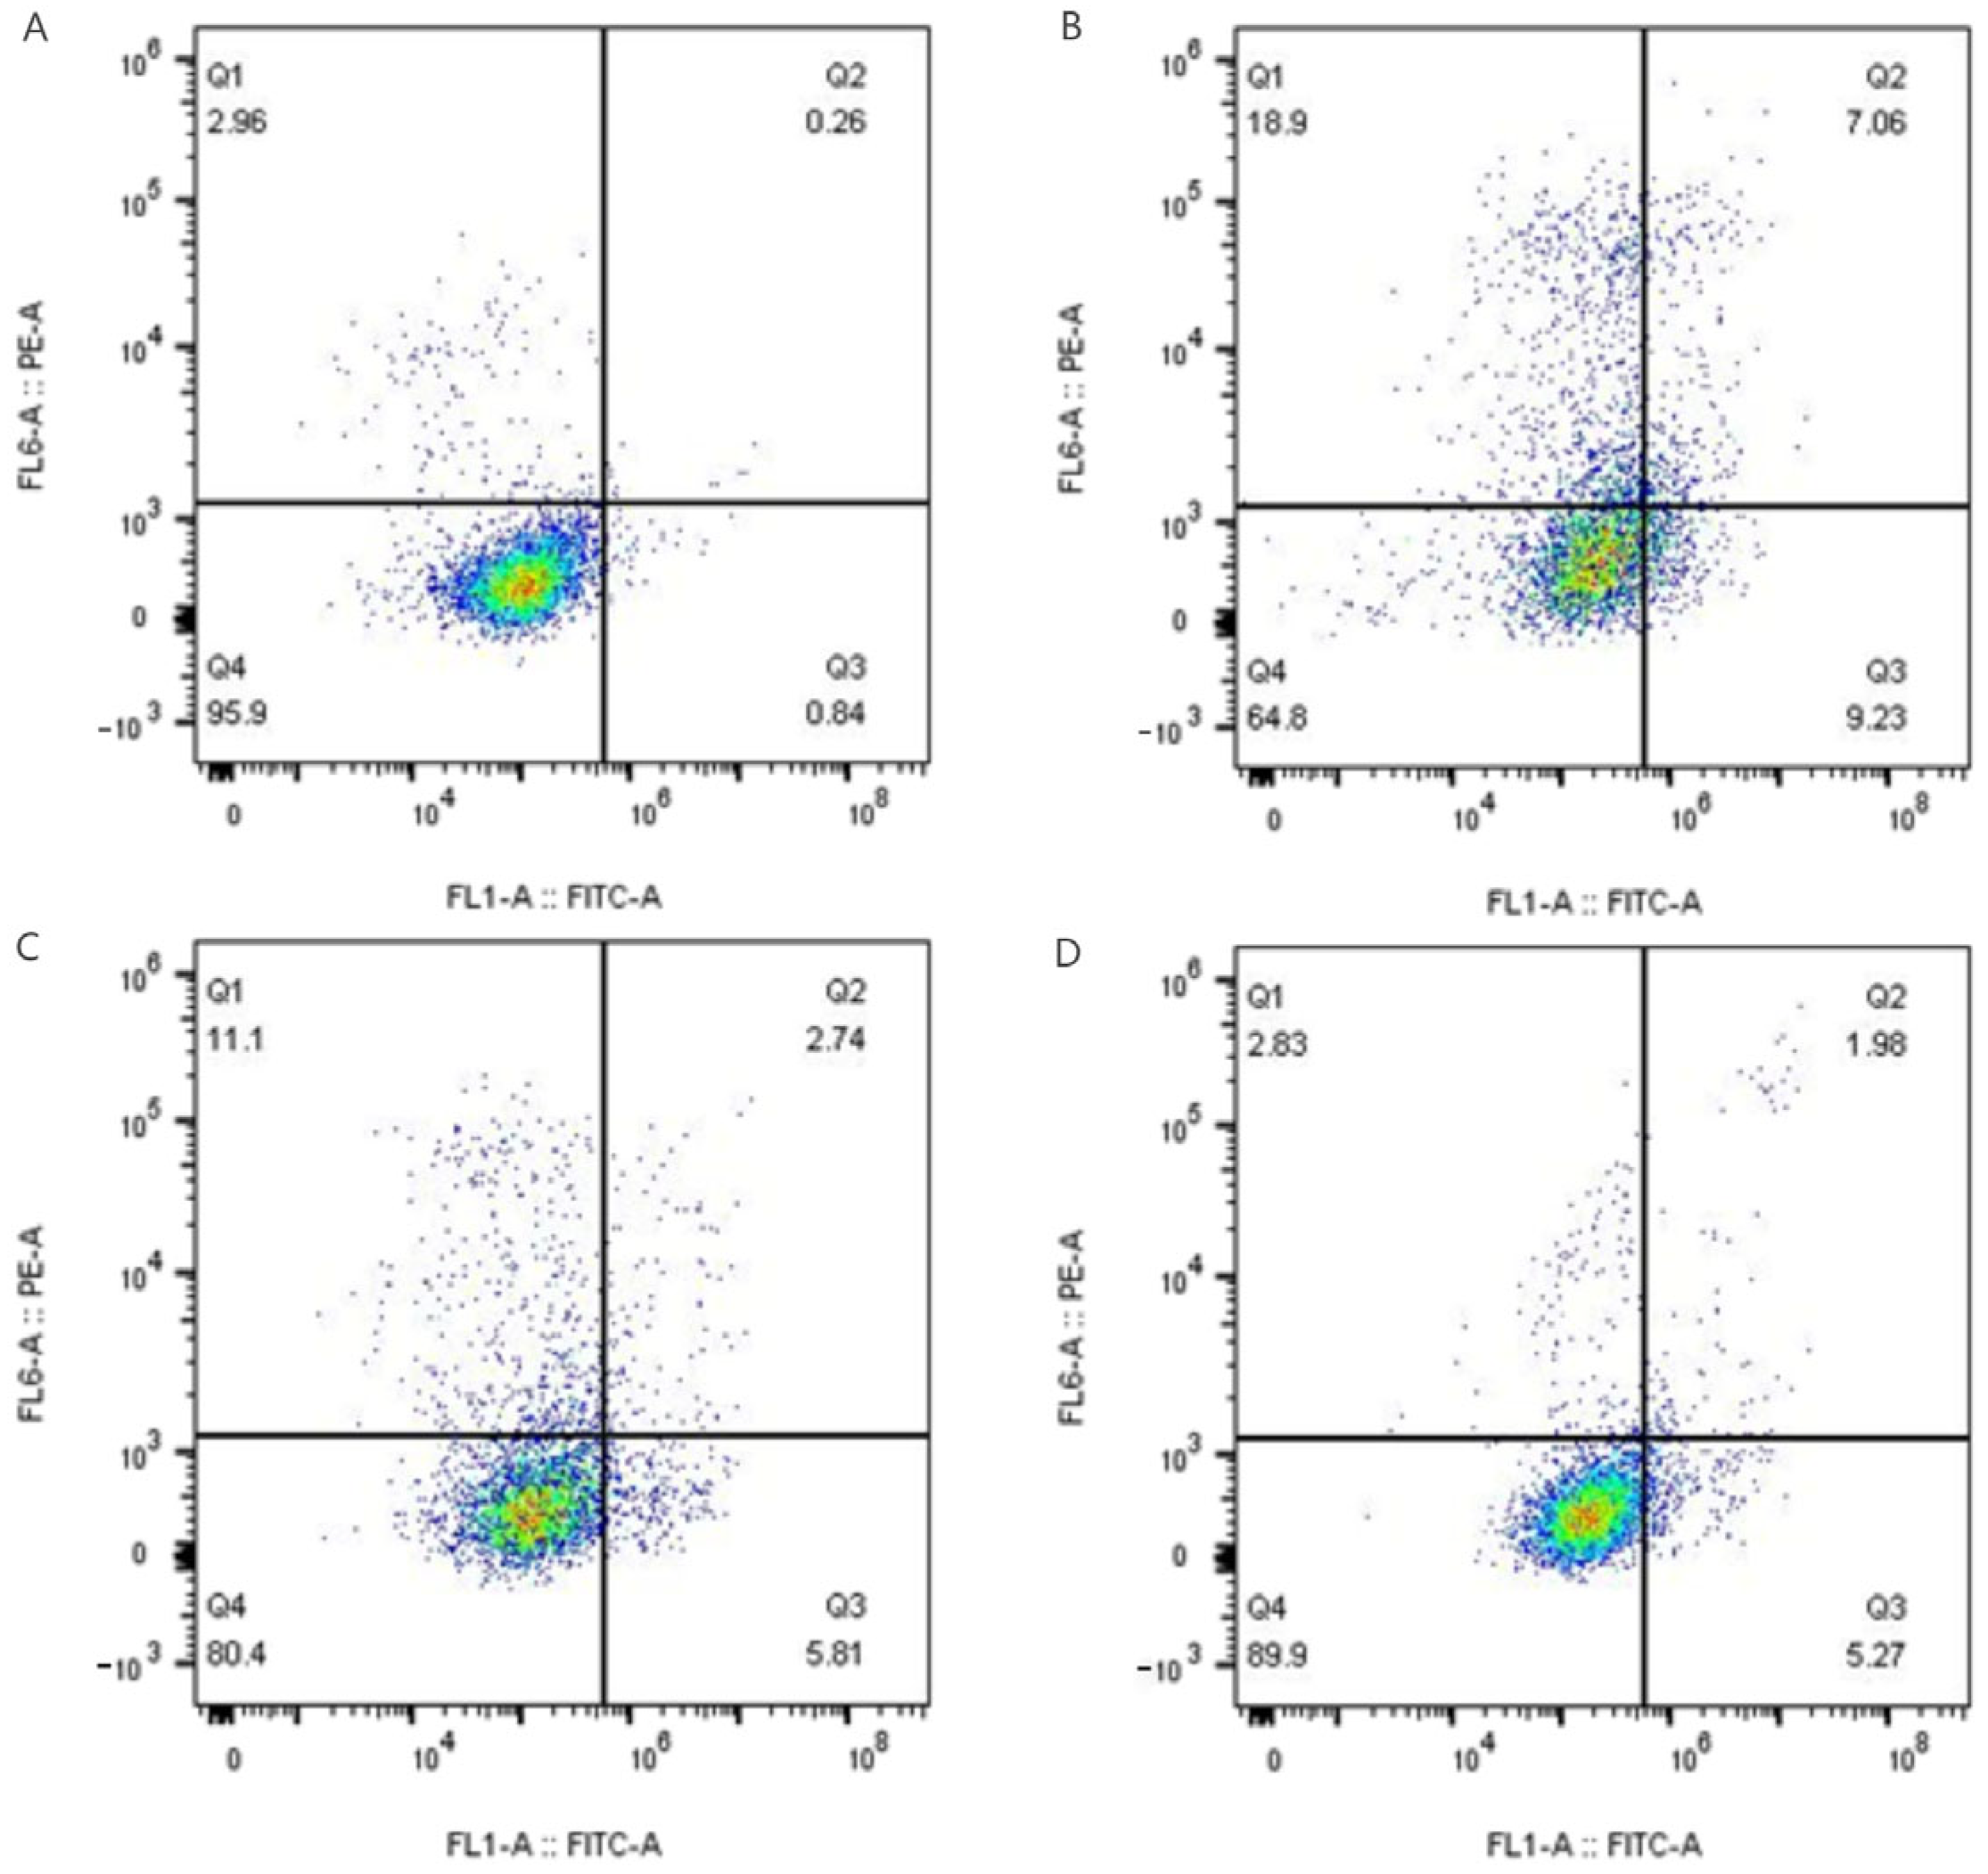
Detection of Apoptosis
Referring to the method of Yean Leng Loke et al. [
16]. HUVEC were seeded in 96-well plates at 50 μL/well at a density of 1 × 10
5 cells/mL and placed in a 37 °C, 5% CO
2 incubator for 12 h to make the cells adhere. 50 μL of different concentrations of the sample solution to be tested was added to each well to continue incubation for 24 h. Then, the medium was discarded, and 100 μL of 100 μM H
2O
2 solution was added to each well to induce oxidative damage, and the incubation was continued for 5 h. The cells were collected with 1× binding solution.
After the cells were collected, they were resuspended to a volume of 100 μL with 1× binding buffer, and 5 μL of Annexin V-FITC (Annexin V Conjugates for Apoptosis Detection, InvitrogenTM, Waltham, MA, USA) was added and incubated for 10 min at room temperature away from light, followed by the addition of 1 μL of propidium iodide (PI, 100 μg) and 1 μL of propylene iodide (PI, 100 μg). Finally, 300 μL of binding buffer was added to dilute the samples, which were immediately analyzed using a flow cytometer (Accuri C6).
2.7. Tyrosinase Inhibitory Activity
Based on the tyrosinase dopa rate oxidation method [
17], the reaction group was constructed by combining 1 mg/mL L-dopa solution (pH 6.8 PBS preparation), 100 U/mL tyrosinase solution (stored on ice), and 1 mg/mL sample solution according to the system in
Table 3, and the absorbance was measured at 475 nm after incubation at 37 °C and protected from light for 10 min to calculate the rate of inhibition according to Equation (9):
2.8. Determination of Bacteriostatic Activity
2.8.1. Zone of Inhibition Measurement
This study examined the antimicrobial effects of the sample solutions against bacterial strains, namely Gram-positive
S. aureus ATCC 25923 and Gram-negative
E. coli ATCC 25922, which were determined by the agar diffusion method [
18], and all the experiments were repeated three times.
2.8.2. MIC Determination
The minimum inhibitory concentration (MIC) of the optimized sample solution was calculated using the two-fold dilution method (diluting the sample solution to a final concentration range of 16–0.125 mg/mL).
2.9. Anti-Inflammatory Activity
2.9.1. RAW264.7 Cell Culture and Sample Preparation
The RAW264.7 cell culture system is the same as
Section 2.6.4 HUVEC Culture and Sample Preparation, and passaging was performed when the cell density reached 70%.
Samples were prepared as in
Section 2.6.4 HUVEC Culture and Sample Preparation (final dilution concentration of 50 μg/mL).
Dexamethasone (50 μg/mL, dissolved in anhydrous ethanol, final concentration < 0.05%) was used as a positive control.
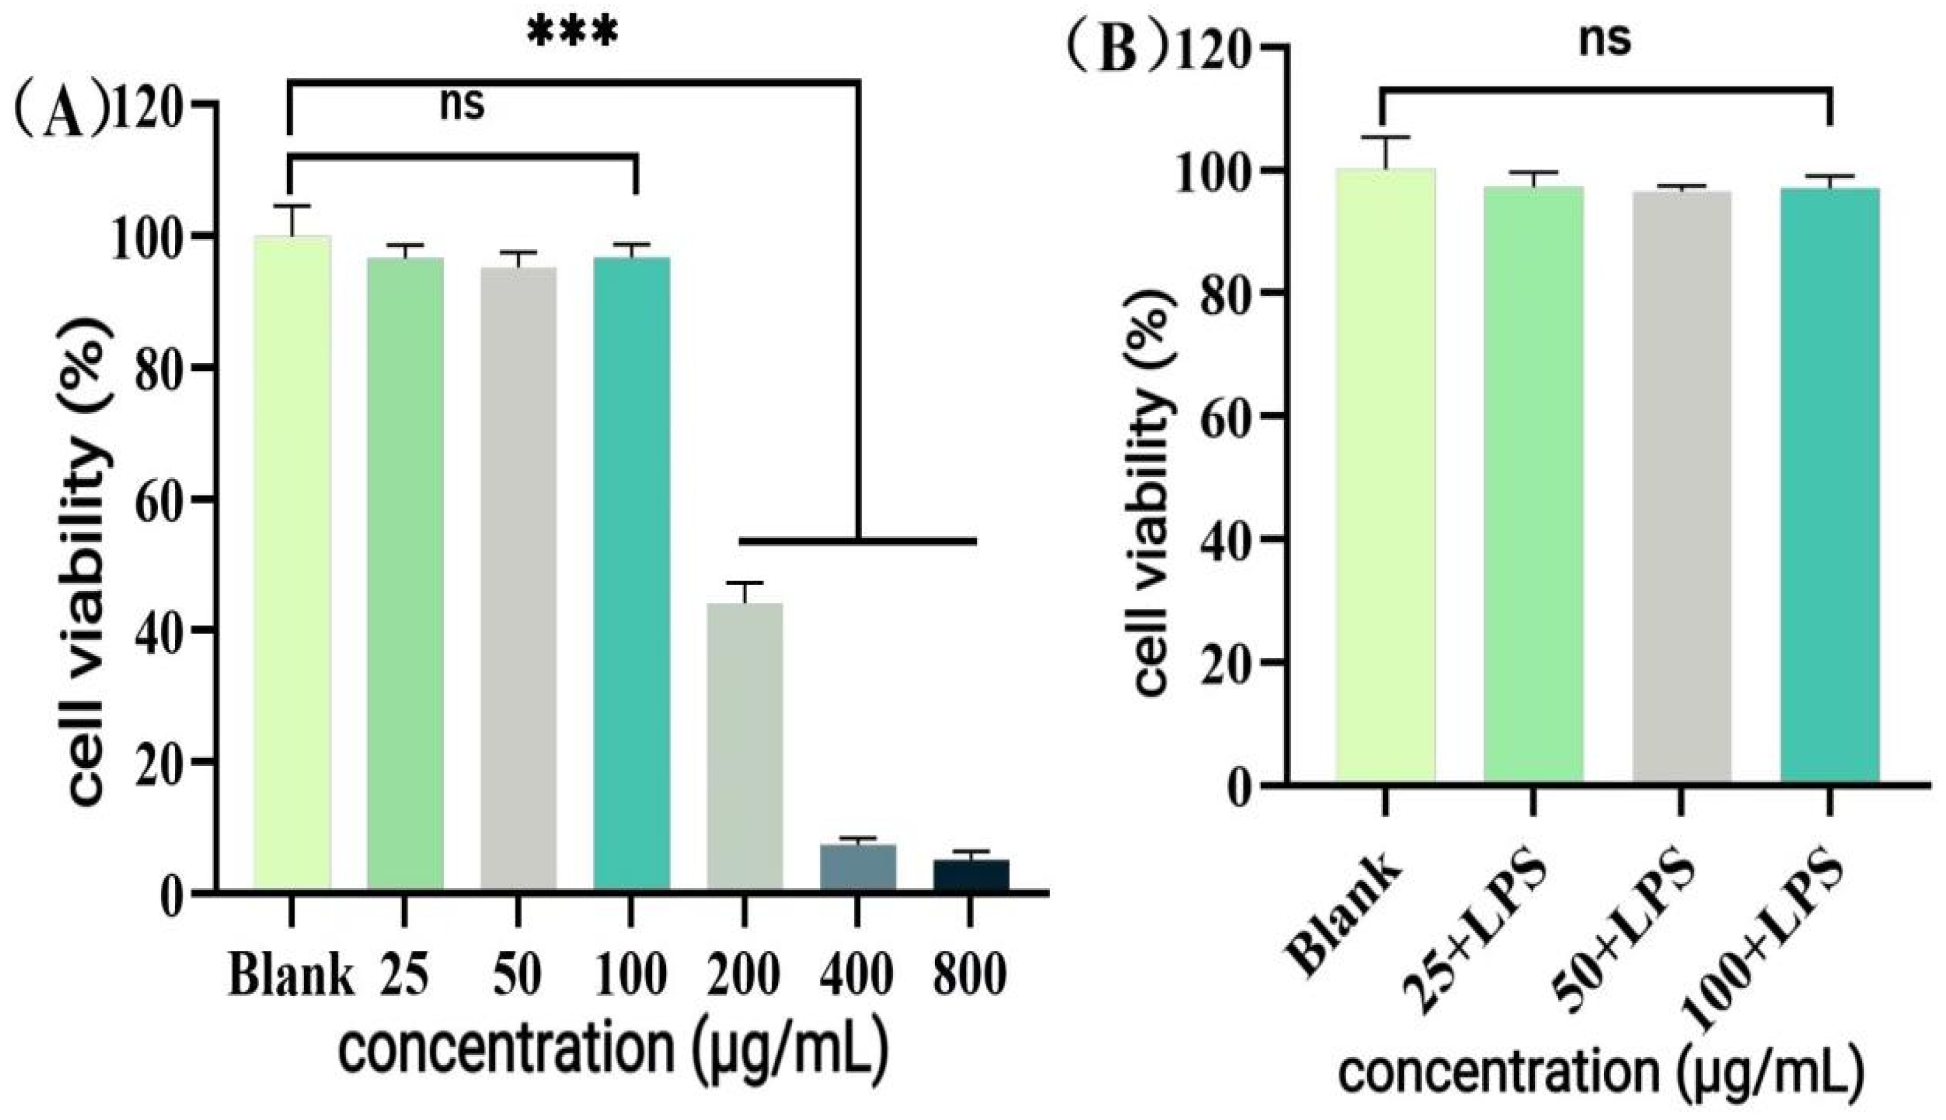
2.9.2. Cell Viability Assay
Determination of RAW264.7 cell viability using the method described in
Section 2.6.4 Cytotoxicity Assay (CCK-8 Method).
2.9.3. Determination of NO Content (Griess Method)
1 × 10
5 cells/mL of RAW264.7 cells were seeded into 96-well plates (50 μL/well), pre-cultivated in an incubator with 5% CO
2 at 37 °C for 12 h, and then added with different concentrations of sample solution (50 μL/well). Sodium nitrite was used as the standard, and the standard curve was plotted according to the instructions of the reagent kit, and NO content was calculated according to Equation (10):
where A
1 = absorbance after reaction with Griess reagent; A
0 = background absorbance of the medium with Griess reagent; K = slope of the standard curve fitted with sodium nitrite.
2.10. Statistical Analysis
The data were collected in triplicate and presented as mean ± standard deviation (SD). Statistical significance (p < 0.05) was identified by one-way analysis of variance (ANOVA) using GraphPad Prism9 (GraphPad Software, Inc., La Jolla, CA, USA).
4. Discussion
Ultrasonic-assisted solvent extraction is an environmentally friendly method in which ultrasonic cavitation effectively disrupts the cell wall and enhances mass transfer, resulting in shorter processing time, lower solvent consumption, and higher extraction rate compared to traditional solvent extraction methods [
19]. The correct selection of process parameters can maximize cost savings and improve the extraction efficiency. During the single-factor experiments for extraction optimization, the TPC values were observed to rise as the ultrasound power increased from 100 W to 270 W, beyond which further power increase resulted in a decline. This may be because increasing the ultrasonic power enhances the hydrodynamic effect, making it easier to rupture the cell wall and improve the yield [
20]. However, excessive ultrasound power may lead to the formation of more bubbles in the solvent during cavitation, which may reduce the yield and effectiveness of ultrasound energy delivered to the medium [
21]. Consistent with the influence of power, our preliminary experiments indicated that the yield of CPCS increased with rising ultrasonic temperature, peaking at 50 °C. This phenomenon may be attributed to enhanced solubility and dispersion of polyphenols in water at higher temperatures. However, high temperatures can easily lead to a decrease in the stability and biological activity of polyphenolic compounds and degradation [
22]. The trend of increasing extraction yield within the ethanol concentration range of 0–40% can be attributed to the role of ethanol in disrupting hydrophobic interactions and hydrogen bonds between polyphenols and cellular structural components—such as polysaccharides and proteins—thereby improving the solubility and release of polyphenolic compounds [
23]. However, when the ethanol concentration exceeded 40%, the extraction efficiency declined. This decrease may be due to the reduced polarity of the extraction solvent, which compromises its ability to dissolve polar polyphenols. Additionally, high ethanol levels could induce protein denaturation and promote the formation of insoluble complexes, further impeding mass transfer and solute diffusion [
24]. The initial stage of ultrasonication time optimization revealed that the extraction yield increased with time due to enhanced cavitation and mechanical effects that promote cell wall rupture and solute diffusion [
25]. Beyond 30 min, however, prolonged exposure likely induced oxidative degradation of thermolabile polyphenols [
26]. In studying the influence of the L/M ratios, an appropriate increase in solvent volume was shown to improve mass transfer by reducing viscosity and enhancing interaction; however, excessively high ratios led to matrix over-swelling, potentially trapping compounds and lowering efficiency. Moreover, although ultrasound-assisted extraction (UAE) enhances the release of soluble components, an overly dilute system requires more energy and time to reach operational temperature, potentially leading to thermal degradation of polyphenols. Additionally, large solvent volumes can lead to saturated extraction solutions where further dissolution is limited, thereby lowering the overall yield per unit solvent [
27]. Ding et al. compared the extraction efficiencies of different solvent systems for polyphenols from
C. oleifera fruit hull [
28]. They found that traditional ethanol extraction at 50% concentration yielded 28.4 mg/g. In contrast, a low eutectic solvent system reached 35.6 mg/g. In the present study, 38% ethanol was used to achieve an extraction rate of 40.05 ± 0.58 mg GAE/g dw. This result may be attributed to the precise optimization of the synergistic effect between ethanol concentration and the liquid-to-material ratio through response surface methodology. This finding is also consistent with the conclusion reported by Sun et al. [
29], who stated that “an ethanol concentration of 30–40% provides the best polarity match for polyphenol extraction.” By optimizing the microwave-assisted ethanol extraction process for polyphenols from
C. oleifera seed meal using the Box–Behnken model, they successfully increased the extraction yield from 26.5 mg/g to 38.9 mg/g. The higher extraction efficiency in our study may be due to the structural differences between materials.
C. oleifera shells have a looser fiber structure than the seed meal. This structure makes it easier for ultrasonic cavitation to destroy the cell wall. It is also more conducive to polyphenol solubilization.
When macroporous resin was used for purification, the adsorption capacity increased with the rise in TPC at low sample concentrations, owing to the increased number of available active sites associated with polyphenols [
30]. However, with further TPC increases, more impurities were adsorbed on the AB-8 resin, resulting in competition for active sites between the polyphenols and the impurities, which led to a slight drop in adsorption capacity. The pH of polyphenol solutions significantly influences both the molecular forms of polyphenols and their adsorption affinity to resins [
31], thereby affecting the overall adsorption efficiency. As demonstrated in
Figure 5, the adsorption rate decreased as pH increased, with the highest adsorption observed under acidic conditions at pH = 2. As demonstrated in
Figure 5, the adsorption rate decreased as pH increased, with the highest adsorption observed under acidic conditions at pH = 2. This phenomenon can be attributed to the phenolic hydroxyl groups in the polyphenolic compounds, which tend to dissociate H
+ ions and exhibit acidic properties. Under appropriately acidic conditions, the dissociation of H
+ from polyphenols is suppressed, promoting their existence in neutral molecular (or salt) forms. This molecular state facilitates hydrogen bonding with the resin matrix, thereby enhancing the adsorption efficiency of macroporous resins. Conversely, in alkaline environments, OH
− ions neutralize the dissociated H
+ from phenolic hydroxyl groups, converting polyphenols into anionic species. This ionic form weakens the physical interactions (e.g., hydrogen bonding and van der Waals forces) with the resin adsorption sites, ultimately reducing the adsorption capacity [
31]. As shown in
Figure 6, the yield started to drop as the ethanol concentration rose above 70%. This decline was caused by the growing polarity gap between polyphenols and solvents, which lowered polyphenol solubility [
32]. In the early stage of the dynamic adsorption–desorption experiment, the macroporous resin exhibited complete adsorption of polyphenols due to its sufficient number of active sites. As the resin gradually reached saturation, its adsorption capacity diminished, resulting in an increase in leakage. A significant decrease in desorption rate (
p < 0.05) was observed when the elution speed exceeded 1.5 mL/min, attributable to insufficient contact time for effective polyphenol elution. At the other extreme, an elution speed below 0.5 mL/min unnecessarily prolongs the process and increases the risk of polyphenol re-adsorption. After purification under optimized conditions using AB-8 macroporous resin, the polyphenol purity in CPCS increased substantially from 24.93% to 57.72%, with a recovery rate of 77.19%. These results confirm the significant purification effect of AB-8 resin on CPCS, which is likely attributable to the removal of competing components such as lipid-soluble impurities, thereby increasing the effective concentration of polyphenols.
The compositional analysis of P-CPCS was performed using HPLC-Q-Exactive-MS. Notably, the flavonoid profile comprised several subclasses with renowned bioactivities: Flavonol glycosides, including rutin, isoquercitrin, and hyperoside, are well-established potent antioxidants. Flavan-3-ols, such as proanthocyanidins [
33], catechins [
34], and epicatechins, are key antioxidants found abundantly in green tea. Aglycones: including quercetin [
35], kaempferol, lignans, catechins [
36], which are known for their broad anti-inflammatory and antimicrobial properties [
37]. Furthermore, the identified phenolic acids, e.g., chlorogenic acid, neochlorogenic acid, caffeic acid, and gallic acid, are recognized for their ability to scavenge free radicals and enhance the body’s endogenous antioxidant defense systems [
38]. The presence of this diverse spectrum of bioactive compounds, each with documented individual activities, strongly suggests that P-CPCS possesses a significant potential for exerting synergistic antioxidant, anti-inflammatory, and antimicrobial effects. Therefore, based on the identification of these active components and their known pharmacological mechanisms, this study conducted a systematic evaluation of the antioxidant, anti-inflammatory, antibacterial, and other biological activities of P-CPCS.
Consistent with the goal of enrichment, the purified P-CPCS exhibited markedly enhanced antioxidant capacity compared to the crude extract. The significantly lower IC
50 values against ABTS
+· and DPPH radicals demonstrate that the purification process successfully increased the specific activity. This boost in efficacy is likely due to the dual effect of concentrating known antioxidant polyphenols (e.g., chlorogenic acid) and removing inert impurities, confirming that the observed activity originates primarily from the polyphenolic components. These findings validate the purification strategy and highlight the potential of P-CPCS as a high-value, natural antioxidant for countering oxidative stress in various applications. The content of ROS in cells under oxidative stress was significantly increased, further damaging the cells. As tea polyphenols have been shown to mitigate H
2O
2-induced oxidative damage by enhancing SOD activity and reducing ROS [
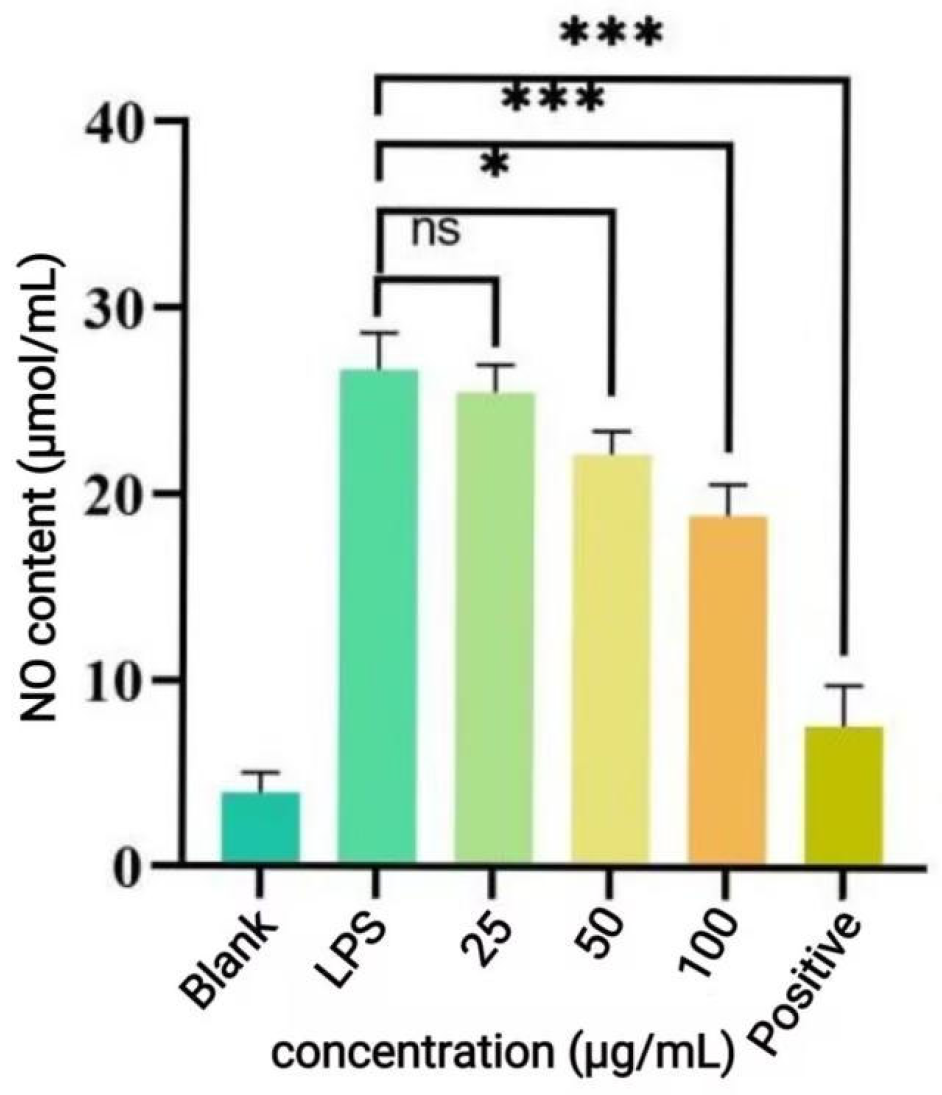
39], it is reasonable to hypothesize that the cytoprotective effect of P-CPCS observed in this study operates through a similar mechanism, potentially involving the activation of endogenous antioxidant enzymes and cellular defense systems. The precise molecular pathways, however, warrant further investigation. Macrophages are an important immune cell and play a pivotal role during inflammation in host defenses against pathogen infection. Lipopolysaccharide (LPS) can induce the polarization of RAW264.7 cells into M1-type cells, which are commonly used to construct cellular inflammation models. Inflammation, as the defensive response of body, is characterized by fluid accumulation and infiltration of inflammatory mediators (such as leukocytes) at the site of inflammation [
40,
41]. To evaluate the anti-inflammatory activity of P-CPCS, we employed a well-established cellular model wherein lipopolysaccharide (LPS) induces an inflammatory response in RAW264.7 macrophages. In this model, the overproduction of nitric oxide (NO) serves as a key indicator of inflammation. Our results demonstrate that P-CPCS significantly suppressed LPS-induced NO release, indicating potent anti-inflammatory efficacy. This anti-inflammatory activity is likely interrelated with the antioxidant properties of P-CPCS, given the pathological crosstalk between oxidative stress and inflammation. Excessive ROS generated during oxidative stress can activate pro-inflammatory signaling pathways like NF-κB [
42,
43], which in turn upregulates inducible NO synthase (iNOS) and further amplifies ROS production, creating a vicious cycle [
44,
45]. This study found that P-CPCS exhibit significant antioxidant and anti-inflammatory activity. Preliminary research suggests that these active components may exert their effects by regulating key intracellular signal transduction pathways. Studies have shown that flavonols such as quercetin and myricetin exhibit anti-inflammatory activity in RAW264.7 macrophages. Among these, quercetin may exert protective effects by activating the Nrf2 pathway and inhibiting the production of pro-inflammatory factors [
46]; chlorogenic acid may regulate oxidative stress and inflammatory responses by modulating multiple signal pathways such as NF-κB and MAPK [
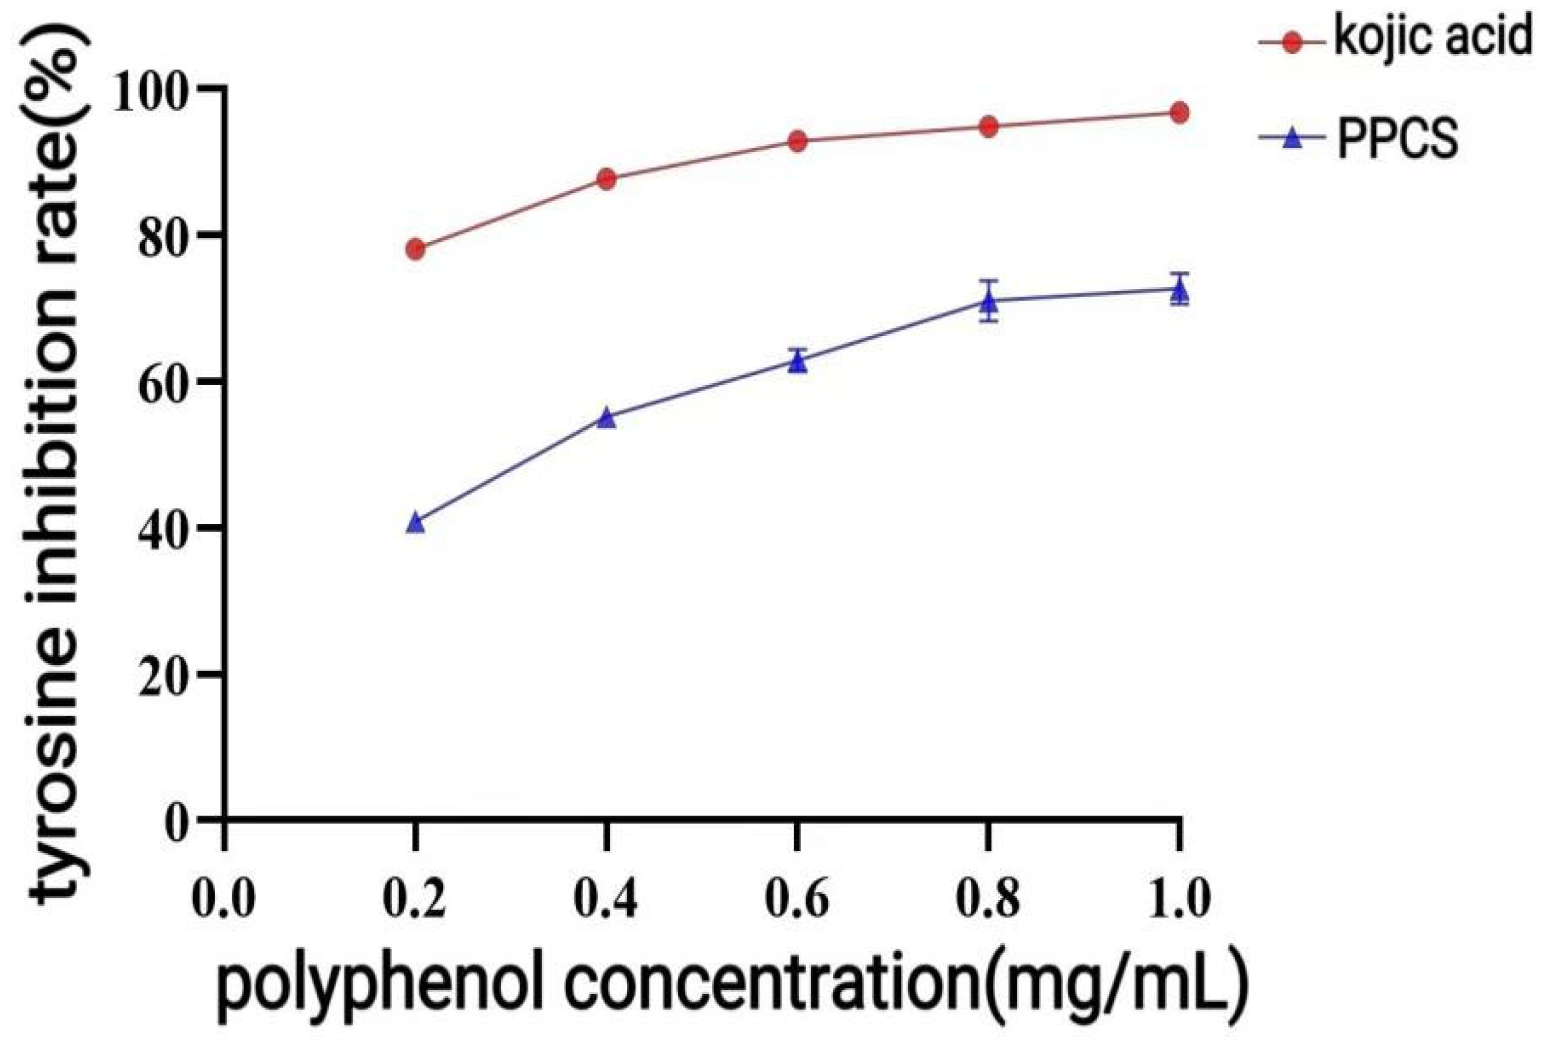
47]; and proanthocyanidins may exert their effects by scavenging free radicals and regulating MAPK and other signaling pathways. These active components likely function via synergistic interactions affecting multiple targets and pathways, collectively constituting the mechanistic basis for the antioxidant and anti-inflammatory properties of CPCS. The potent inhibition of tyrosinase by P-CPCS suggests significant skin-whitening potential. Mechanistically, this activity may parallel that of oleuropein, which functions by downregulating key melanogenic proteins (TRP, TRP1, TRP2, and MITF) via modulation of the CREB and MAPK signaling pathways [
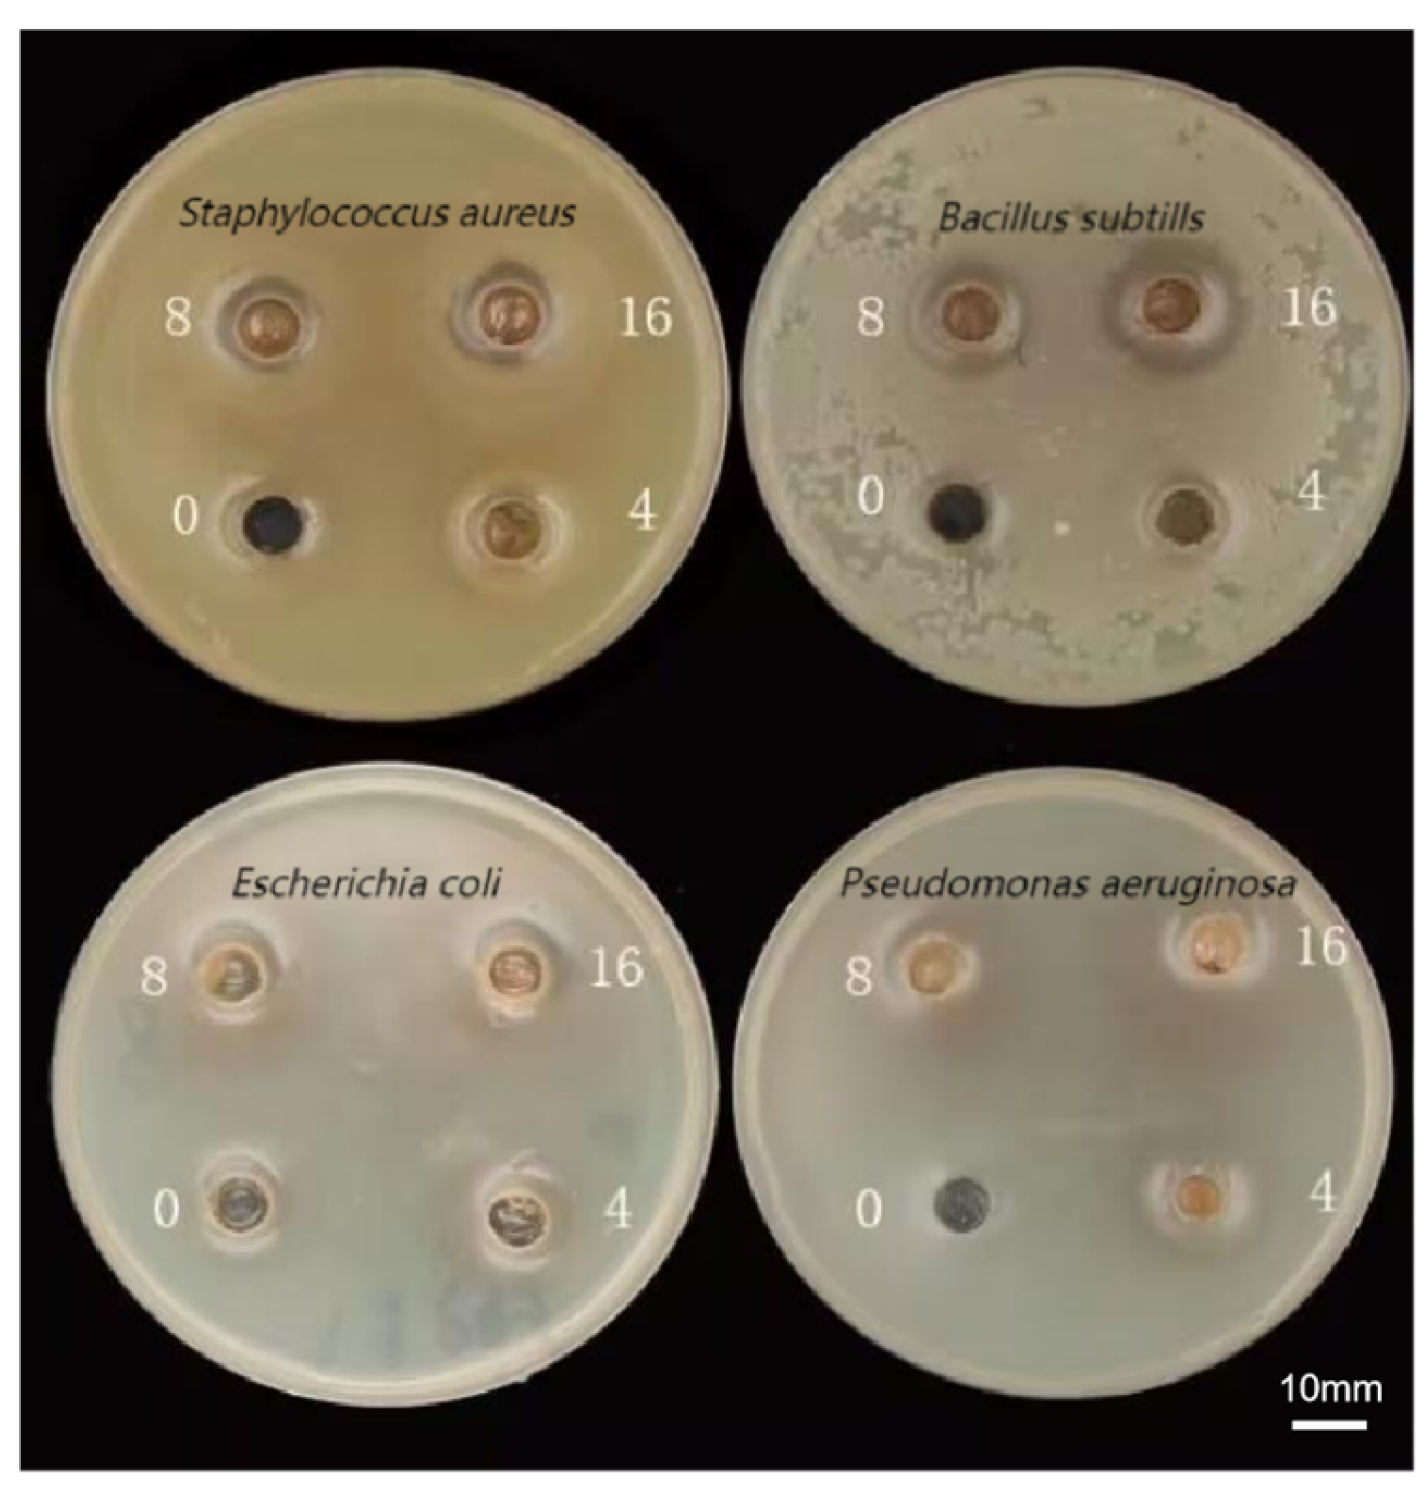
48]. It is hypothesized that P-CPCS exhibits a strong skin-lightening activity via a mechanism analogous to that of oleuropein. P-CPCS exhibited notable antibacterial activity, particularly against Gram-positive bacteria. This effect can be mechanistically explained by its capacity to disrupt bacterial cell integrity. For instance, luteolin—a flavonoid present in P-CPCS—has been documented to cause significant damage to the cell wall and membrane in
Listeria [
49]. Consistent with this view, it is inferred that P-CPCS exerts its antibacterial action through a similar mechanism, likely involving dose-dependent disruption of membrane morphology, leading to cell lysis and leakage of intracellular contents. Gram-negative bacteria showed higher resistance, presumably owing to the Gram-negative outer membrane (OM) being impermeable to many molecules, and expression of numerous MDR efflux pumps that effectively reduce the intracellular concentration of the given drug [
50].
