

Determination of Nitric Oxide and Its Metabolites in Biological Tissues Using Ozone-Based Chemiluminescence Detection: A State-of-the-Art Review

Abstract
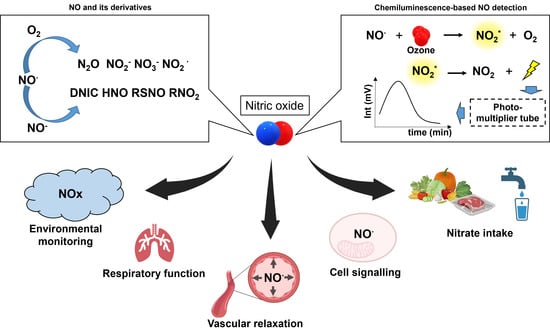
1. Introduction
2. NO and Its Biologically Relevant Derivatives

3. Measurement of •NO Metabolites Using Chemiluminescence
3.1. Reduction of Nitrite, RSNO, and RNNO with Tri-Iodide, Cys/CuCl, and Hydroquinone/Quinone
3.2. Measurement of Nitrate with Vanadium Chloride
3.3. Measurement of NO-Heme with Ferricyanide

| Reaction Solution | Conditions | Target NO Metabolites | References |
|---|---|---|---|
| Iodine/iodide | 60 mM I−/6 to 20 mM I2/1M HCl, RT | NO2−, RNNO, RSNO; RNNO, RSNO with the addition of sulfanilamide and HgCl2 | [44] |
| 56 mM I−/2 mM I2, 4 mM CuCl, CH3COOH, 68 °C | [49] | ||
| 45 mM I−/10 mM I2, CH3COOH, 60 °C | [10] | ||
| Cysteine/CuCl | 1 mM L-cysteine/0.1 mM CuCl | RSNO | [45] |
| Hydroquinone/quinone | 0.1 M hydroquinone/0.01 M quinone | RSNO | [44] |
| VCl3/H+ | 0.1 M vanadium(III) in 2 M HCl | NO3−, NO2−, RNNO, RSNO | [50] |
| Ferricyanide | 0.2 M ferricyanide in PBS, pH 7.5 | NO-heme | [48] |
| 0.05 M ferricyanide in PBS, pH 7.5 | [20] |
4. Multi-Level Analytical Approaches for a Comprehensive Analysis of •NO Metabolites
4.1. Chemiluminescence Coupled with Chromatography or Mass Spectrometry (MS)
4.1.1. Gas Chromatography
4.1.2. Liquid Chromatography
4.1.3. Mass Spectrometry
4.2. Coupled with Microdialysis
4.3. Coupled with Flow Injection Analysis
5. Advantages and Disadvantages of Chemiluminescence for Detecting •NO Species in Biological Specimens
5.1. Advantages
5.2. Pitfalls
6. Alternatives for the Detection of •NO Species in Biological Samples
6.1. Electrochemical Sensors (Electrodes)
6.2. Fluorescence
6.3. Electron Paramagnetic Resonance (EPR)
6.4. Membrane Inlet Mass Spectrometry
6.5. UV-Visible Spectrophotometry for •NO Determination
6.6. Griess Assay
| Method | Common Applications | Applications | Analytical Parameters | References |
|---|---|---|---|---|
| Electrochemical sensors | Direct on-line •NO detection with electrooxidation or electroreduction | Real-time •NO quantification in biological systems; •NO detection in tissues and cells | Sensitivity: 3.5–106 pA per 1 µM change in •NO concentration | [87,88] |
| Fluorescence | Indirect detection of •NO with the formation of a fluorescent molecule | Detection of •NO in cells and tissues | Limit of detection: 3–5 nM; Sensitivity: matrix-dependent | [90,91,92] |
| Electron paramagnetic resonance | Indirect detection of •NO; direct detection of HbNO and dinitrosyl iron complex | •NO and HbNO detection in cells and tissues | Limit of detection: 500 nM | [93,94,95] |
| Mass spectrometry | Detection of •NO with multiple ion detection | •NO detection in aqueous solution | Limit of detection: 10 nM | [96] |
| UV-visible spectrophotometry | Indirect detection of •NO with oxyhemoglobin oxidation | •NO formation in cells and tissues | Limit of detection: 0.2 nmol/min | [97,103] |
| Griess assay | Determination of nitrite and nitrate with the formation of an azo dye in acidic condition | Determination of nitrite levels in biological systems | Limit of detection: 1–2 µM | [98,104] |
7. Practical Considerations about Choosing CLD as Detection Method
8. Successful Application in Different Fields
9. Summary and Conclusions
Author Contributions
Funding
Institutional Review Board Statement
Informed Consent Statement
Data Availability Statement
Acknowledgments
Conflicts of Interest
References
- Wardman, P. Fluorescent and luminescent probes for measurement of oxidative and nitrosative species in cells and tissues: Progress, pitfalls, and prospects. Free Radic. Biol. Med. 2007, 43, 995–1022. [Google Scholar] [CrossRef]
- Kalyanaraman, B.; Darley-Usmar, V.; Davies, K.J.; Dennery, P.A.; Forman, H.J.; Grisham, M.B.; Mann, G.E.; Moore, K.; Roberts, L.J., 2nd; Ischiropoulos, H. Measuring reactive oxygen and nitrogen species with fluorescent probes: Challenges and limitations. Free Radic. Biol. Med. 2012, 52, 1–6. [Google Scholar] [CrossRef] [PubMed]
- Albrecht, H.O. Über die Chemiluminescenz des Aminophthalsäurehydrazids. Z. Für Phys. Chem. 1928, 136U, 321–330. [Google Scholar] [CrossRef]
- Whitehead, T.P.; Thorpe, G.H.G.; Carter, T.J.N.; Groucutt, C.; Kricka, L.J. Enhanced luminescence procedure for sensitive determination of peroxidase-labelled conjugates in immunoassay. Nature 1983, 305, 158–159. [Google Scholar] [CrossRef]
- Radi, R.; Cosgrove, T.P.; Beckman, J.S.; Freeman, B.A. Peroxynitrite-induced luminol chemiluminescence. Biochem. J. 1993, 290 Pt 1, 51–57. [Google Scholar] [CrossRef] [PubMed]
- Kooy, N.W.; Royall, J.A. Agonist-induced peroxynitrite production from endothelial cells. Arch. Biochem. Biophys. 1994, 310, 352–359. [Google Scholar] [CrossRef] [PubMed]
- Radi, R.; Peluffo, G.; Alvarez, M.N.; Naviliat, M.; Cayota, A. Unraveling peroxynitrite formation in biological systems. Free Radic. Biol. Med. 2001, 30, 463–488. [Google Scholar] [CrossRef] [PubMed]
- Moller, M.N.; Rios, N.; Trujillo, M.; Radi, R.; Denicola, A.; Alvarez, B. Detection and quantification of nitric oxide-derived oxidants in biological systems. J. Biol. Chem. 2019, 294, 14776–14802. [Google Scholar] [CrossRef] [PubMed]
- Fontijn, A.; Sabadell, A.J.; Ronco, R.J. Homogeneous chemiluminescent measurement of nitric oxide with ozone. Implications for continuous selective monitoring of gaseous air pollutants. Anal. Chem. 1970, 42, 575–579. [Google Scholar] [CrossRef]
- Feelisch, M.; Rassaf, T.; Mnaimneh, S.; Singh, N.; Bryan, N.S.; Jourd’Heuil, D.; Kelm, M. Concomitant S-, N-, and heme-nitros(yl)ation in biological tissues and fluids: Implications for the fate of NO in vivo. FASEB J. 2002, 16, 1775–1785. [Google Scholar] [CrossRef]
- Palmer, R.M.; Ferrige, A.G.; Moncada, S. Nitric oxide release accounts for the biological activity of endothelium-derived relaxing factor. Nature 1987, 327, 524–526. [Google Scholar] [CrossRef] [PubMed]
- Ignarro, L.J.; Buga, G.M.; Wood, K.S.; Byrns, R.E.; Chaudhuri, G. Endothelium-derived relaxing factor produced and released from artery and vein is nitric oxide. Proc. Natl. Acad. Sci. USA 1987, 84, 9265–9269. [Google Scholar] [CrossRef]
- Furchgott, R.F.; Cherry, P.D.; Zawadzki, J.V.; Jothianandan, D. Endothelial cells as mediators of vasodilation of arteries. J. Cardiovasc. Pharmacol. 1984, 6 (Suppl. 2), S336–S343. [Google Scholar] [CrossRef]
- Kelm, M.; Feelisch, M.; Spahr, R.; Piper, H.M.; Noack, E.; Schrader, J. Quantitative and kinetic characterization of nitric oxide and EDRF released from cultured endothelial cells. Biochem. Biophys. Res. Commun. 1988, 154, 236–244. [Google Scholar] [CrossRef]
- Doyle, M.P.; Hoekstra, J.W. Oxidation of nitrogen oxides by bound dioxygen in hemoproteins. J. Inorg. Biochem. 1981, 14, 351–358. [Google Scholar] [CrossRef] [PubMed]
- Lewis, R.S.; Tannenbaum, S.R.; Deen, W.M. Kinetics of N-Nitrosation in Oxygenated Nitric Oxide Solutions at Physiological pH: Role of Nitrous Anhydride and Effects of Phosphate and Chloride. J. Am. Chem. Soc. 1995, 117, 3933–3939. [Google Scholar] [CrossRef]
- Cortese-Krott, M.M.; Koning, A.; Kuhnle, G.G.C.; Nagy, P.; Bianco, C.L.; Pasch, A.; Wink, D.A.; Fukuto, J.M.; Jackson, A.A.; van Goor, H.; et al. The Reactive Species Interactome: Evolutionary Emergence, Biological Significance, and Opportunities for Redox Metabolomics and Personalized Medicine. Antioxid. Redox Signal. 2017, 27, 684–712. [Google Scholar] [CrossRef] [PubMed]
- Goldstein, S.; Czapski, G. Kinetics of Nitric Oxide Autoxidation in Aqueous Solution in the Absence and Presence of Various Reductants. The Nature of the Oxidizing Intermediates. J. Am. Chem. Soc. 1995, 117, 12078–12084. [Google Scholar] [CrossRef]
- Goldstein, S.; Czapski, G. Mechanism of the Nitrosation of Thiols and Amines by Oxygenated •NO Solutions: the Nature of the Nitrosating Intermediates. J. Am. Chem. Soc. 1996, 118, 3419–3425. [Google Scholar] [CrossRef]
- Bryan, N.S.; Rassaf, T.; Maloney, R.E.; Rodriguez, C.M.; Saijo, F.; Rodriguez, J.R.; Feelisch, M. Cellular targets and mechanisms of nitros(yl)ation: An insight into their nature and kinetics in vivo. Proc. Natl. Acad. Sci. USA 2004, 101, 4308–4313. [Google Scholar] [CrossRef]
- Moller, M.N.; Li, Q.; Vitturi, D.A.; Robinson, J.M.; Lancaster, J.R., Jr.; Denicola, A. Membrane “lens” effect: Focusing the formation of reactive nitrogen oxides from the *NO/O2 reaction. Chem. Res. Toxicol. 2007, 20, 709–714. [Google Scholar] [CrossRef]
- Jourd’heuil, D.; Jourd’heuil, F.L.; Feelisch, M. Oxidation and nitrosation of thiols at low micromolar exposure to nitric oxide. Evidence for a free radical mechanism. J. Biol. Chem. 2003, 278, 15720–15726. [Google Scholar] [CrossRef]
- Toledo, J.C., Jr.; Bosworth, C.A.; Hennon, S.W.; Mahtani, H.A.; Bergonia, H.A.; Lancaster, J.R., Jr. Nitric oxide-induced conversion of cellular chelatable iron into macromolecule-bound paramagnetic dinitrosyliron complexes. J. Biol. Chem. 2008, 283, 28926–28933. [Google Scholar] [CrossRef] [PubMed]
- Bartberger, M.D.; Liu, W.; Ford, E.; Miranda, K.M.; Switzer, C.; Fukuto, J.M.; Farmer, P.J.; Wink, D.A.; Houk, K.N. The reduction potential of nitric oxide (NO) and its importance to NO biochemistry. Proc. Natl. Acad. Sci. USA 2002, 99, 10958–10963. [Google Scholar] [CrossRef] [PubMed]
- Smulik, R.; Debski, D.; Zielonka, J.; Michalowski, B.; Adamus, J.; Marcinek, A.; Kalyanaraman, B.; Sikora, A. Nitroxyl (HNO) reacts with molecular oxygen and forms peroxynitrite at physiological pH. Biological Implications. J. Biol. Chem. 2014, 289, 35570–35581. [Google Scholar] [CrossRef]
- Blough, N.V.; Zafiriou, O.C. Reaction of superoxide with nitric oxide to form peroxonitrite in alkaline aqueous solution. Inorg. Chem. 1985, 24, 3502–3504. [Google Scholar] [CrossRef]
- Ferrer-Sueta, G.; Campolo, N.; Trujillo, M.; Bartesaghi, S.; Carballal, S.; Romero, N.; Alvarez, B.; Radi, R. Biochemistry of Peroxynitrite and Protein Tyrosine Nitration. Chem. Rev. 2018, 118, 1338–1408. [Google Scholar] [CrossRef]
- Herold, S.; Shivashankar, K. Metmyoglobin and methemoglobin catalyze the isomerization of peroxynitrite to nitrate. Biochemistry 2003, 42, 14036–14046. [Google Scholar] [CrossRef]
- Romero, N.; Radi, R.; Linares, E.; Augusto, O.; Detweiler, C.D.; Mason, R.P.; Denicola, A. Reaction of human hemoglobin with peroxynitrite. Isomerization to nitrate and secondary formation of protein radicals. J. Biol. Chem. 2003, 278, 44049–44057. [Google Scholar] [CrossRef]
- Joshi, M.S.; Ferguson, T.B., Jr.; Han, T.H.; Hyduke, D.R.; Liao, J.C.; Rassaf, T.; Bryan, N.; Feelisch, M.; Lancaster, J.R., Jr. Nitric oxide is consumed, rather than conserved, by reaction with oxyhemoglobin under physiological conditions. Proc. Natl. Acad. Sci. USA 2002, 99, 10341–10346. [Google Scholar] [CrossRef] [PubMed]
- Rosier, B.T.; Buetas, E.; Moya-Gonzalvez, E.M.; Artacho, A.; Mira, A. Nitrate as a potential prebiotic for the oral microbiome. Sci. Rep. 2020, 10, 12895. [Google Scholar] [CrossRef]
- Millar, T.M.; Stevens, C.R.; Benjamin, N.; Eisenthal, R.; Harrison, R.; Blake, D.R. Xanthine oxidoreductase catalyses the reduction of nitrates and nitrite to nitric oxide under hypoxic conditions. FEBS Lett. 1998, 427, 225–228. [Google Scholar] [CrossRef]
- Li, H.; Cui, H.; Liu, X.; Zweier, J.L. Xanthine oxidase catalyzes anaerobic transformation of organic nitrates to nitric oxide and nitrosothiols: Characterization of this mechanism and the link between organic nitrate and guanylyl cyclase activation. J. Biol. Chem. 2005, 280, 16594–16600. [Google Scholar] [CrossRef] [PubMed]
- Kapil, V.; Haydar, S.M.; Pearl, V.; Lundberg, J.O.; Weitzberg, E.; Ahluwalia, A. Physiological role for nitrate-reducing oral bacteria in blood pressure control. Free Radic. Biol. Med. 2013, 55, 93–100. [Google Scholar] [CrossRef] [PubMed]
- Lundberg, J.O.; Weitzberg, E. Nitric oxide signaling in health and disease. Cell 2022, 185, 2853–2878. [Google Scholar] [CrossRef]
- Jansson, E.A.; Huang, L.; Malkey, R.; Govoni, M.; Nihlen, C.; Olsson, A.; Stensdotter, M.; Petersson, J.; Holm, L.; Weitzberg, E.; et al. A mammalian functional nitrate reductase that regulates nitrite and nitric oxide homeostasis. Nat. Chem. Biol. 2008, 4, 411–417. [Google Scholar] [CrossRef]
- Keller, T.C.S.t.; Lechauve, C.; Keller, A.S.; Brooks, S.; Weiss, M.J.; Columbus, L.; Ackerman, H.; Cortese-Krott, M.M.; Isakson, B.E. The role of globins in cardiovascular physiology. Physiol. Rev. 2022, 102, 859–892. [Google Scholar] [CrossRef]
- Cosby, K.; Partovi, K.S.; Crawford, J.H.; Patel, R.P.; Reiter, C.D.; Martyr, S.; Yang, B.K.; Waclawiw, M.A.; Zalos, G.; Xu, X.; et al. Nitrite reduction to nitric oxide by deoxyhemoglobin vasodilates the human circulation. Nat. Med. 2003, 9, 1498–1505. [Google Scholar] [CrossRef]
- LoBue, A.; Heuser, S.K.; Lindemann, M.; Li, J.; Rahman, M.; Kelm, M.; Stegbauer, J.; Cortese-Krott, M.M. Red blood cell endothelial nitric oxide synthase: A major player in regulating cardiovascular health. Br. J. Pharmacol. 2023. [Google Scholar] [CrossRef]
- Jia, L.; Bonaventura, C.; Bonaventura, J.; Stamler, J.S. S-nitrosohaemoglobin: A dynamic activity of blood involved in vascular control. Nature 1996, 380, 221–226. [Google Scholar] [CrossRef]
- Gladwin, M.T.; Schechter, A.N.; Shelhamer, J.H.; Pannell, L.K.; Conway, D.A.; Hrinczenko, B.W.; Nichols, J.S.; Pease-Fye, M.E.; Noguchi, C.T.; Rodgers, G.P.; et al. Inhaled nitric oxide augments nitric oxide transport on sickle cell hemoglobin without affecting oxygen affinity. J. Clin. Investig. 1999, 104, 937–945. [Google Scholar] [CrossRef] [PubMed]
- Wang, X.; Bryan, N.S.; MacArthur, P.H.; Rodriguez, J.; Gladwin, M.T.; Feelisch, M. Measurement of nitric oxide levels in the red cell: Validation of tri-iodide-based chemiluminescence with acid-sulfanilamide pretreatment. J. Biol. Chem. 2006, 281, 26994–27002. [Google Scholar] [CrossRef]
- MacArthur, P.H.; Shiva, S.; Gladwin, M.T. Measurement of circulating nitrite and S-nitrosothiols by reductive chemiluminescence. J. Chromatogr. B Analyt. Technol. Biomed. Life Sci. 2007, 851, 93–105. [Google Scholar] [CrossRef]
- Samouilov, A.; Zweier, J.L. Development of chemiluminescence-based methods for specific quantitation of nitrosylated thiols. Anal. Biochem. 1998, 258, 322–330. [Google Scholar] [CrossRef]
- Fang, K.; Ragsdale, N.V.; Carey, R.M.; MacDonald, T.; Gaston, B. Reductive assays for S-nitrosothiols: Implications for measurements in biological systems. Biochem. Biophys. Res. Commun. 1998, 252, 535–540. [Google Scholar] [CrossRef] [PubMed]
- Smarason, A.K.; Allman, K.G.; Young, D.; Redman, C.W. Elevated levels of serum nitrate, a stable end product of nitric oxide, in women with pre-eclampsia. Br. J. Obstet. Gynaecol. 1997, 104, 538–543. [Google Scholar] [CrossRef] [PubMed]
- Abu-Alghayth, M.; Vanhatalo, A.; Wylie, L.J.; McDonagh, S.T.; Thompson, C.; Kadach, S.; Kerr, P.; Smallwood, M.J.; Jones, A.M.; Winyard, P.G. S-nitrosothiols, and other products of nitrate metabolism, are increased in multiple human blood compartments following ingestion of beetroot juice. Redox Biol. 2021, 43, 101974. [Google Scholar] [CrossRef] [PubMed]
- Gladwin, M.T.; Wang, X.; Reiter, C.D.; Yang, B.K.; Vivas, E.X.; Bonaventura, C.; Schechter, A.N. S-Nitrosohemoglobin is unstable in the reductive erythrocyte environment and lacks O2/NO-linked allosteric function. J. Biol. Chem. 2002, 277, 27818–27828. [Google Scholar] [CrossRef]
- Marley, R.; Feelisch, M.; Holt, S.; Moore, K. A chemiluminescense-based assay for S-nitrosoalbumin and other plasma S-nitrosothiols. Free Radic. Res. 2000, 32, 1–9. [Google Scholar] [CrossRef]
- Ewing, J.F.; Janero, D.R. Specific S-nitrosothiol (thionitrite) quantification as solution nitrite after vanadium(III) reduction and ozone-chemiluminescent detection. Free Radic. Biol. Med. 1998, 25, 621–628. [Google Scholar] [CrossRef]
- Yan, Y.; Shi, P.; Song, W.; Bi, S. Chemiluminescence and Bioluminescence Imaging for Biosensing and Therapy: In Vitro and In Vivo Perspectives. Theranostics 2019, 9, 4047–4065. [Google Scholar] [CrossRef] [PubMed]
- Huang, C.; Zhou, W.; Wu, R.; Guan, W.; Ye, N. Recent Advances in Nanomaterial-Based Chemiluminescence Probes for Biosensing and Imaging of Reactive Oxygen Species. Nanomaterials 2023, 13, 1726. [Google Scholar] [CrossRef] [PubMed]
- Fujinari, E.M.; Manes, J.D. Nitrogen-specific detection of peptides in liquid chromatography with a chemiluminescent nitrogen detector. J. Chromatogr. A 1994, 676, 113–120. [Google Scholar] [CrossRef]
- Brannegan, D.; Ashraf-Khorassani, M.; Taylor, L.T. High-performance liquid chromatography coupled with chemiluminescence nitrogen detection for the study of ethoxyquin antioxidant and related organic bases. J. Chromatogr. Sci. 2001, 39, 217–221. [Google Scholar] [CrossRef] [PubMed]
- Kashihira, N.; Makino, K.; Kirita, K.; Watanabe, Y. Chemiluminescent nitrogen detector-gas chromatography and its application to measurement of atmospheric ammonia and amines. J. Chromatogr. A 1982, 239, 617–624. [Google Scholar] [CrossRef]
- Fujinari, E.M. Gas chromatography-chemiluminescent nitrogen detection: GC-CLND. In Developments in Food Science; Wetzel, D.L.B., Charalambous, G., Eds.; Elsevier: Amsterdam, The Netherlands, 1998; Volume 39, pp. 385–424. [Google Scholar]
- Toraman, H.E.; Franz, K.; Ronsse, F.; Van Geem, K.M.; Marin, G.B. Quantitative analysis of nitrogen containing compounds in microalgae based bio-oils using comprehensive two-dimensional gas-chromatography coupled to nitrogen chemiluminescence detector and time of flight mass spectrometer. J. Chromatogr. A 2016, 1460, 135–146. [Google Scholar] [CrossRef] [PubMed]
- Kocak, D.; Ozel, M.Z.; Gogus, F.; Hamilton, J.F.; Lewis, A.C. Determination of volatile nitrosamines in grilled lamb and vegetables using comprehensive gas chromatography—Nitrogen chemiluminescence detection. Food Chem. 2012, 135, 2215–2220. [Google Scholar] [CrossRef] [PubMed]
- Ozel, M.Z.; Hamilton, J.F.; Lewis, A.C. New sensitive and quantitative analysis method for organic nitrogen compounds in urban aerosol samples. Environ. Sci. Technol. 2011, 45, 1497–1505. [Google Scholar] [CrossRef]
- Fujinari, E.M.; Damon Manes, J. Nitrogen-specific liquid chromatography detection of nucleotides and nucleosides by HPLC-CLND. In Developments in Food Science; Charalambous, G., Ed.; Elsevier: Amsterdam, The Netherlands, 1995; Volume 37, pp. 379–396. [Google Scholar]
- Robbat, A.; Corso, N.P.; Liu, T.Y. Evaluation of a nitrosyl-specific gas-phase chemiluminescence detector with high-performance liquid chromatography. Anal. Chem. 1988, 60, 173–174. [Google Scholar] [CrossRef]
- Fujinari, E.M.; Courthaudon, L.O. Nitrogen-specific liquid chromatography detector based on chemiluminescence: Application to the analysis of ammonium nitrogen in waste water. J. Chromatogr. A 1992, 592, 209–214. [Google Scholar] [CrossRef]
- Fujinari, E.M.; Manes, J.D.; Bizanek, R. Peptide content determination of crude synthetic peptides by reversed-phase liquid chromatography and nitrogen-specific detection with a chemiluminescent nitrogen detector. J. Chromatogr. A 1996, 743, 85–89. [Google Scholar] [CrossRef]
- Hayakawa, K.; Lu, C.; Mizukami, S.; Toriba, A.; Tang, N. Determination of 1-nitropyrene metabolites by high-performance liquid chromatography with chemiluminescence detection. J. Chromatogr. A 2006, 1107, 286–289. [Google Scholar] [CrossRef] [PubMed]
- Tsikas, D. Simultaneous derivatization and quantification of the nitric oxide metabolites nitrite and nitrate in biological fluids by gas chromatography/mass spectrometry. Anal. Chem. 2000, 72, 4064–4072. [Google Scholar] [CrossRef]
- Shin, S.; Fung, H.L. Evaluation of an LC-MS/MS assay for 15N-nitrite for cellular studies of L-arginine action. J. Pharm. Biomed. Anal 2011, 56, 1127–1131. [Google Scholar] [CrossRef]
- Corens, D.; Carpentier, M.; Schroven, M.; Meerpoel, L. Liquid chromatography–mass spectrometry with chemiluminescent nitrogen detection for on-line quantitative analysis of compound collections: Advantages and limitations. J. Chromatogr. A 2004, 1056, 67–75. [Google Scholar] [CrossRef]
- Taylor, E.W.; Jia, W.; Bush, M.; Dollinger, G.D. Accelerating the drug optimization process: Identification, structure elucidation, and quantification of in vivo metabolites using stable isotopes with LC/MSn and the chemiluminescent nitrogen detector. Anal. Chem. 2002, 74, 3232–3238. [Google Scholar] [CrossRef] [PubMed]
- Cornelius, J.; Tran, T.; Turner, N.; Piazza, A.; Mills, L.; Slack, R.; Hauser, S.; Alexander, J.S.; Grisham, M.B.; Feelisch, M.; et al. Isotope tracing enhancement of chemiluminescence assays for nitric oxide research. Biol. Chem. 2009, 390, 181–189. [Google Scholar] [CrossRef]
- Delgado, J.M.; DeFeudis, F.V.; Roth, R.H.; Ryugo, D.K.; Mitruka, B.M. Dialytrode for long term intracerebral perfusion in awake monkeys. Arch. Int. Pharmacodyn. Ther. 1972, 198, 9–21. [Google Scholar] [PubMed]
- Yao, D.; Vlessidis, A.G.; Evmiridis, N.P.; Evangelou, A.; Karkabounas, S.; Tsampalas, S. Luminol chemiluminescense reaction: A new method for monitoring nitric oxide in vivo. Anal. Chim. Acta 2002, 458, 281–289. [Google Scholar] [CrossRef]
- Trojanowicz, M.; Pyszynska, M. Flow-Injection Methods in Water Analysis-Recent Developments. Molecules 2022, 27, 1410. [Google Scholar] [CrossRef] [PubMed]
- Aoki, T.; Fukuda, S.; Hosoi, Y.; Mukai, H. Rapid flow injection analysis method for successive determination of ammonia, nitrite, and nitrate in water by gas-phase chemiluminescence. Anal. Chim. Acta 1997, 349, 11–16. [Google Scholar] [CrossRef]
- Hendgen-Cotta, U.; Grau, M.; Rassaf, T.; Gharini, P.; Kelm, M.; Kleinbongard, P. Reductive gas-phase chemiluminescence and flow injection analysis for measurement of the nitric oxide pool in biological matrices. Methods Enzymol. 2008, 441, 295–315. [Google Scholar] [CrossRef]
- Dai, K.; Vlessidis, A.G.; Evmiridis, N.P. Dialysis membrane sampler for on-line flow injection analysis/chemiluminescence-detection of peroxynitrite in biological samples. Talanta 2003, 59, 55–65. [Google Scholar] [CrossRef]
- Gill, A.; Zajda, J.; Meyerhoff, M.E. Comparison of electrochemical nitric oxide detection methods with chemiluminescence for measuring nitrite concentration in food samples. Anal. Chim. Acta 2019, 1077, 167–173. [Google Scholar] [CrossRef] [PubMed]
- Potter, M.N.; Green, J.R.; Mutus, B. Fluorescein isothiocyanate, a platform for the selective and sensitive detection of S-Nitrosothiols and hydrogen sulfide. Talanta 2022, 237, 122981. [Google Scholar] [CrossRef]
- Yao, D.; Vlessidis, A.G.; Evmiridis, N.P. Determination of nitric oxide in biological samples. Microchim. Acta 2004, 147, 1–20. [Google Scholar] [CrossRef]
- Garside, C. A chemiluminescent technique for the determination of nanomolar concentrations of nitrate and nitrite in seawater. Mar. Chem. 1982, 11, 159–167. [Google Scholar] [CrossRef]
- Kallakunta, V.M.; Slama-Schwok, A.; Mutus, B. Protein disulfide isomerase may facilitate the efflux of nitrite derived S-nitrosothiols from red blood cells. Redox Biol. 2013, 1, 373–380. [Google Scholar] [CrossRef]
- Doctor, A.; Platt, R.; Sheram, M.L.; Eischeid, A.; McMahon, T.; Maxey, T.; Doherty, J.; Axelrod, M.; Kline, J.; Gurka, M.; et al. Hemoglobin conformation couples erythrocyte S-nitrosothiol content to O2 gradients. Proc. Natl. Acad. Sci. USA 2005, 102, 5709–5714. [Google Scholar] [CrossRef] [PubMed]
- Stamler, J.S.; Jaraki, O.; Osborne, J.; Simon, D.I.; Keaney, J.; Vita, J.; Singel, D.; Valeri, C.R.; Loscalzo, J. Nitric oxide circulates in mammalian plasma primarily as an S-nitroso adduct of serum albumin. Proc. Natl. Acad. Sci. USA 1992, 89, 7674–7677. [Google Scholar] [CrossRef] [PubMed]
- Gladwin, M.T.; Shelhamer, J.H.; Schechter, A.N.; Pease-Fye, M.E.; Waclawiw, M.A.; Panza, J.A.; Ognibene, F.P.; Cannon, R.O., 3rd. Role of circulating nitrite and S-nitrosohemoglobin in the regulation of regional blood flow in humans. Proc. Natl. Acad. Sci. USA 2000, 97, 11482–11487. [Google Scholar] [CrossRef] [PubMed]
- Yang, B.K.; Vivas, E.X.; Reiter, C.D.; Gladwin, M.T. Methodologies for the sensitive and specific measurement of S-nitrosothiols, iron-nitrosyls, and nitrite in biological samples. Free Radic. Res. 2003, 37, 1–10. [Google Scholar] [CrossRef] [PubMed]
- Piknova, B.; Park, J.W.; Cassel, K.S.; Gilliard, C.N.; Schechter, A.N. Measuring Nitrite and Nitrate, Metabolites in the Nitric Oxide Pathway, in Biological Materials using the Chemiluminescence Method. J. Vis. Exp. 2016, 118, e54879. [Google Scholar] [CrossRef]
- Bateman, R.M.; Ellis, C.G.; Freeman, D.J. Optimization of nitric oxide chemiluminescence operating conditions for measurement of plasma nitrite and nitrate. Clin. Chem. 2002, 48, 570–573. [Google Scholar] [CrossRef] [PubMed]
- Brown, M.D.; Schoenfisch, M.H. Electrochemical Nitric Oxide Sensors: Principles of Design and Characterization. Chem. Rev. 2019, 119, 11551–11575. [Google Scholar] [CrossRef] [PubMed]
- Shibuki, K. An electrochemical microprobe for detecting nitric oxide release in brain tissue. Neurosci. Res. 1990, 9, 69–76. [Google Scholar] [CrossRef] [PubMed]
- Wang, H.; Yuan, B.; Yin, T.; Qin, W. Alternative coulometric signal readout based on a solid-contact ion-selective electrode for detection of nitrate. Anal. Chim. Acta 2020, 1129, 136–142. [Google Scholar] [CrossRef]
- Wiersma, J.H. 2,3-Diaminonaphthalene as a spectrophotometric and fluorometric reagent for the determination of nitrite ion. Anal. Lett. 1970, 3, 123–132. [Google Scholar] [CrossRef]
- Kojima, H.; Sakurai, K.; Kikuchi, K.; Kawahara, S.; Kirino, Y.; Nagoshi, H.; Hirata, Y.; Nagano, T. Development of a fluorescent indicator for nitric oxide based on the fluorescein chromophore. Chem. Pharm. Bull. 1998, 46, 373–375. [Google Scholar] [CrossRef]
- Li, J.; LoBue, A.; Heuser, S.K.; Leo, F.; Cortese-Krott, M.M. Using diaminofluoresceins (DAFs) in nitric oxide research. Nitric Oxide 2021, 115, 44–54. [Google Scholar] [CrossRef]
- Kleschyov, A.L.; Mollnau, H.; Oelze, M.; Meinertz, T.; Huang, Y.; Harrison, D.G.; Munzel, T. Spin trapping of vascular nitric oxide using colloid Fe(II)-diethyldithiocarbamate. Biochem. Biophys. Res. Commun. 2000, 275, 672–677. [Google Scholar] [CrossRef] [PubMed]
- Joseph, J.; Kalyanaraman, B.; Hyde, J.S. Trapping of nitric oxide by nitronyl nitroxides: An electron spin resonance investigation. Biochem. Biophys. Res. Commun. 1993, 192, 926–934. [Google Scholar] [CrossRef] [PubMed]
- Piknova, B.; Gladwin, M.T.; Schechter, A.N.; Hogg, N. Electron paramagnetic resonance analysis of nitrosylhemoglobin in humans during NO inhalation. J. Biol. Chem. 2005, 280, 40583–40588. [Google Scholar] [CrossRef]
- Goodwin, J.M.; Chrestensen, C.A.; Moomaw, E.W. Detection of Nitric Oxide by Membrane Inlet Mass Spectrometry. Methods Mol. Biol. 2018, 1747, 35–47. [Google Scholar] [CrossRef] [PubMed]
- Feelisch, M.; Noack, E.A. Correlation between nitric oxide formation during degradation of organic nitrates and activation of guanylate cyclase. Eur. J. Pharmacol. 1987, 139, 19–30. [Google Scholar] [CrossRef] [PubMed]
- Griess, P. Bemerkungen zu der Abhandlung der HH. Weselsky und Benedikt “Ueber einige Azoverbindungen”. Eur. J. Inorg. Chem. 1879, 12, 426–428. [Google Scholar] [CrossRef]
- Green, L.C.; Wagner, D.A.; Glogowski, J.; Skipper, P.L.; Wishnok, J.S.; Tannenbaum, S.R. Analysis of nitrate, nitrite, and [15N]nitrate in biological fluids. Anal. Biochem. 1982, 126, 131–138. [Google Scholar] [CrossRef]
- Tanaka, S.; Akaike, T.; Fang, J.; Beppu, T.; Ogawa, M.; Tamura, F.; Miyamoto, Y.; Maeda, H. Antiapoptotic effect of haem oxygenase-1 induced by nitric oxide in experimental solid tumour. Br. J. Cancer 2003, 88, 902–909. [Google Scholar] [CrossRef]
- Bryan, N.S.; Grisham, M.B. Methods to detect nitric oxide and its metabolites in biological samples. Free Radic. Biol. Med. 2007, 43, 645–657. [Google Scholar] [CrossRef] [PubMed]
- Kleinbongard, P.; Dejam, A.; Lauer, T.; Jax, T.; Kerber, S.; Gharini, P.; Balzer, J.; Zotz, R.B.; Scharf, R.E.; Willers, R.; et al. Plasma nitrite concentrations reflect the degree of endothelial dysfunction in humans. Free Radic. Biol. Med. 2006, 40, 295–302. [Google Scholar] [CrossRef]
- Kelm, M.; Schrader, J. Control of coronary vascular tone by nitric oxide. Circ. Res. 1990, 66, 1561–1575. [Google Scholar] [CrossRef]
- Guevara, I.; Iwanejko, J.; Dembinska-Kiec, A.; Pankiewicz, J.; Wanat, A.; Anna, P.; Golabek, I.; Bartus, S.; Malczewska-Malec, M.; Szczudlik, A. Determination of nitrite/nitrate in human biological material by the simple Griess reaction. Clin. Chim. Acta 1998, 274, 177–188. [Google Scholar] [CrossRef]
- Nagababu, E.; Rifkind, J.M. Measurement of plasma nitrite by chemiluminescence. Methods Mol. Biol. 2010, 610, 41–49. [Google Scholar] [CrossRef]
- Leo, F.; Suvorava, T.; Heuser, S.K.; Li, J.; LoBue, A.; Barbarino, F.; Piragine, E.; Schneckmann, R.; Hutzler, B.; Good, M.E.; et al. Red Blood Cell and Endothelial eNOS Independently Regulate Circulating Nitric Oxide Metabolites and Blood Pressure. Circulation 2021, 144, 870–889. [Google Scholar] [CrossRef]
- Kleinbongard, P.; Rassaf, T.; Dejam, A.; Kerber, S.; Kelm, M. Griess method for nitrite measurement of aqueous and protein-containing samples. Methods Enzymol. 2002, 359, 158–168. [Google Scholar] [CrossRef]
- Giustarini, D.; Rossi, R.; Milzani, A.; Dalle-Donne, I. Nitrite and nitrate measurement by Griess reagent in human plasma: Evaluation of interferences and standardization. Methods Enzymol. 2008, 440, 361–380. [Google Scholar] [CrossRef]
- Tsikas, D. Analysis of nitrite and nitrate in biological fluids by assays based on the Griess reaction: Appraisal of the Griess reaction in the L-arginine/nitric oxide area of research. J. Chromatogr. B Analyt. Technol. Biomed. Life Sci. 2007, 851, 51–70. [Google Scholar] [CrossRef] [PubMed]
- Hunter, R.A.; Storm, W.L.; Coneski, P.N.; Schoenfisch, M.H. Inaccuracies of nitric oxide measurement methods in biological media. Anal. Chem. 2013, 85, 1957–1963. [Google Scholar] [CrossRef] [PubMed]
- Brizzolari, A.; Dei Cas, M.; Cialoni, D.; Marroni, A.; Morano, C.; Samaja, M.; Paroni, R.; Rubino, F.M. High-Throughput Griess Assay of Nitrite and Nitrate in Plasma and Red Blood Cells for Human Physiology Studies under Extreme Conditions. Molecules 2021, 26, 4569. [Google Scholar] [CrossRef] [PubMed]
- Robbins, R.A.; Floreani, A.A.; Von Essen, S.G.; Sisson, J.H.; Hill, G.E.; Rubinstein, I.; Townley, R.G. Measurement of exhaled nitric oxide by three different techniques. Am. J. Respir. Crit. Care Med. 1996, 153, 1631–1635. [Google Scholar] [CrossRef]
- Binding, N.; Muller, W.; Czeschinski, P.A.; Witting, U. NO chemiluminescence in exhaled air: Interference of compounds from endogenous or exogenous sources. Eur. Respir. J. 2000, 16, 499–503. [Google Scholar] [CrossRef]
- Bates, J.N. Nitric oxide measurement by chemiluminescence detection. Neuroprotocols 1992, 1, 141–149. [Google Scholar] [CrossRef]
- Kuik, F.; Kerschbaumer, A.; Lauer, A.; Lupascu, A.; von Schneidemesser, E.; Butler, T.M. Top–down quantification of NOx emissions from traffic in an urban area using a high-resolution regional atmospheric chemistry model. Atmos. Chem. Phys. 2018, 18, 8203–8225. [Google Scholar] [CrossRef]
- Suarez-Bertoa, R.; Astorga, C. Impact of cold temperature on Euro 6 passenger car emissions. Environ. Pollut. 2018, 234, 318–329. [Google Scholar] [CrossRef]
- Joseph, D.W.; Spicer, C.W. Chemiluminescence method for atmospheric monitoring of nitric acid and nitrogen oxides. Anal. Chem. 1978, 50, 1400–1403. [Google Scholar] [CrossRef]
- Tian, Y.; Wang, K.-K.; Yang, G.-P.; Li, P.-F.; Liu, C.-Y.; Ingeniero, R.C.O.; Bange, H.W. Continuous Chemiluminescence Measurements of Dissolved Nitric Oxide (NO) and Nitrogen Dioxide (NO2) in the Ocean Surface Layer of the East China Sea. Environ. Sci. Technol. 2021, 55, 3668–3675. [Google Scholar] [CrossRef]
- Kanda, Y.; Taira, M. Flow-Injection Analysis Method for the Determination of Nitrite and Nitrate in Natural Water Samples Using a Chemiluminescence NOx Monitor. Anal. Sci. 2003, 19, 695–699. [Google Scholar] [CrossRef] [PubMed][Green Version]
- Bijay, S.; Craswell, E. Fertilizers and nitrate pollution of surface and ground water: An increasingly pervasive global problem. SN Appl. Sci. 2021, 3, 518. [Google Scholar] [CrossRef]
- Gustafsson, L.E.; Leone, A.M.; Persson, M.G.; Wiklund, N.P.; Moncada, S. Endogenous nitric oxide is present in the exhaled air of rabbits, guinea pigs and humans. Biochem. Biophys. Res. Commun. 1991, 181, 852–857. [Google Scholar] [CrossRef]
- Alving, K.; Weitzberg, E.; Lundberg, J.M. Increased amount of nitric oxide in exhaled air of asthmatics. Eur. Respir. J. 1993, 6, 1368–1370. [Google Scholar] [CrossRef] [PubMed]
- Malmstrom, R.E.; Tornberg, D.C.; Settergren, G.; Liska, J.; Angdin, M.; Lundberg, J.O.; Weitzberg, E. Endogenous nitric oxide release by vasoactive drugs monitored in exhaled air. Am. J. Respir. Crit. Care Med. 2003, 168, 114–120. [Google Scholar] [CrossRef]
- Berry, M.; Hargadon, B.; Morgan, A.; Shelley, M.; Richter, J.; Shaw, D.; Green, R.H.; Brightling, C.; Wardlaw, A.J.; Pavord, I.D. Alveolar nitric oxide in adults with asthma: Evidence of distal lung inflammation in refractory asthma. Eur. Respir. J. 2005, 25, 986–991. [Google Scholar] [CrossRef] [PubMed]
- Sen, P.; Khatri, S.B.; Tejwani, V. Measuring exhaled nitric oxide when diagnosing and managing asthma. Cleve. Clin. J. Med. 2023, 90, 363–370. [Google Scholar] [CrossRef] [PubMed]
- Ashworth, A.; Mitchell, K.; Blackwell, J.R.; Vanhatalo, A.; Jones, A.M. High-nitrate vegetable diet increases plasma nitrate and nitrite concentrations and reduces blood pressure in healthy women. Public. Health Nutr. 2015, 18, 2669–2678. [Google Scholar] [CrossRef] [PubMed]
- Miller, G.D.; Marsh, A.P.; Dove, R.W.; Beavers, D.; Presley, T.; Helms, C.; Bechtold, E.; King, S.B.; Kim-Shapiro, D. Plasma nitrate and nitrite are increased by a high-nitrate supplement but not by high-nitrate foods in older adults. Nutr. Res. 2012, 32, 160–168. [Google Scholar] [CrossRef]
- Kapil, V.; Milsom, A.B.; Okorie, M.; Maleki-Toyserkani, S.; Akram, F.; Rehman, F.; Arghandawi, S.; Pearl, V.; Benjamin, N.; Loukogeorgakis, S.; et al. Inorganic nitrate supplementation lowers blood pressure in humans: Role for nitrite-derived NO. Hypertension 2010, 56, 274–281. [Google Scholar] [CrossRef]
- Larsen, F.J.; Ekblom, B.; Sahlin, K.; Lundberg, J.O.; Weitzberg, E. Effects of dietary nitrate on blood pressure in healthy volunteers. N. Engl. J. Med. 2006, 355, 2792–2793. [Google Scholar] [CrossRef] [PubMed]
- Kleinbongard, P.; Dejam, A.; Lauer, T.; Rassaf, T.; Schindler, A.; Picker, O.; Scheeren, T.; Godecke, A.; Schrader, J.; Schulz, R.; et al. Plasma nitrite reflects constitutive nitric oxide synthase activity in mammals. Free Radic. Biol. Med. 2003, 35, 790–796. [Google Scholar] [CrossRef] [PubMed]
- Milsom, A.B.; Fernandez, B.O.; Garcia-Saura, M.F.; Rodriguez, J.; Feelisch, M. Contributions of nitric oxide synthases, dietary nitrite/nitrate, and other sources to the formation of NO signaling products. Antioxid. Redox Signal. 2012, 17, 422–432. [Google Scholar] [CrossRef]
- Lauer, T.; Preik, M.; Rassaf, T.; Strauer, B.E.; Deussen, A.; Feelisch, M.; Kelm, M. Plasma nitrite rather than nitrate reflects regional endothelial nitric oxide synthase activity but lacks intrinsic vasodilator action. Proc. Natl. Acad. Sci. USA 2001, 98, 12814–12819. [Google Scholar] [CrossRef]
- Wood, K.C.; Cortese-Krott, M.M.; Kovacic, J.C.; Noguchi, A.; Liu, V.B.; Wang, X.; Raghavachari, N.; Boehm, M.; Kato, G.J.; Kelm, M.; et al. Circulating blood endothelial nitric oxide synthase contributes to the regulation of systemic blood pressure and nitrite homeostasis. Arterioscler. Thromb. Vasc. Biol. 2013, 33, 1861–1871. [Google Scholar] [CrossRef] [PubMed]
- Park, J.W.; Piknova, B.; Huang, P.L.; Noguchi, C.T.; Schechter, A.N. Effect of blood nitrite and nitrate levels on murine platelet function. PLoS ONE 2013, 8, e55699. [Google Scholar] [CrossRef] [PubMed]
- Dominic, P.; Ahmad, J.; Bhandari, R.; Pardue, S.; Solorzano, J.; Jaisingh, K.; Watts, M.; Bailey, S.R.; Orr, A.W.; Kevil, C.G.; et al. Decreased availability of nitric oxide and hydrogen sulfide is a hallmark of COVID-19. Redox Biol. 2021, 43, 101982. [Google Scholar] [CrossRef] [PubMed]
- Kumari, A.; Bhatoee, M.; Singh, P.; Kaladhar, V.C.; Yadav, N.; Paul, D.; Loake, G.J.; Gupta, K.J. Detection of Nitric Oxide from Chickpea Using DAF Fluorescence and Chemiluminescence Methods. Curr. Protoc. 2022, 2, e420. [Google Scholar] [CrossRef] [PubMed]
- Picetti, R.; Deeney, M.; Pastorino, S.; Miller, M.R.; Shah, A.; Leon, D.A.; Dangour, A.D.; Green, R. Nitrate and nitrite contamination in drinking water and cancer risk: A systematic review with meta-analysis. Environ. Res. 2022, 210, 112988. [Google Scholar] [CrossRef]
- Tannenbaum, S.R.; Correa, P. Nitrate and gastric cancer risks. Nature 1985, 317, 675–676. [Google Scholar] [CrossRef] [PubMed]
- D’Amore, T.; Di Taranto, A.; Berardi, G.; Vita, V.; Iammarino, M. Nitrate as food additives: Reactivity, occurrence, and regulation. In Nitrate Handbook; CRC Press: Boca Raton, FL, USA, 2022; pp. 281–300. [Google Scholar]
- Ziarati, P.; Zahedi, M.; Shirkhan, F.; Mostafidi, M. Potential health risks and concerns of high levels of nitrite and nitrate in food sources. SF Pharma J. 2018, 1, 2. [Google Scholar]
- Kapil, V.; Khambata, R.S.; Robertson, A.; Caulfield, M.J.; Ahluwalia, A. Dietary nitrate provides sustained blood pressure lowering in hypertensive patients: A randomized, phase 2, double-blind, placebo-controlled study. Hypertension 2015, 65, 320–327. [Google Scholar] [CrossRef] [PubMed]
- Verma, N.; Tiwari, S.; Singh, V.P.; Prasad, S.M. Nitric oxide in plants: An ancient molecule with new tasks. Plant Growth Regul. 2020, 90, 1–13. [Google Scholar] [CrossRef]


| 1. Pretreatment |
Stabilization reagent is prepared for organs, tissues, and cell lysates by adding
|
Differentiation assistant reagent: measurements in tri-iodide reductive solution in…
|
| 2. Avoid contamination |
Nitrite contamination is everywhere; therefore, pay attention to…
|
| 3. Minimum time before storage |
The scavenging of nitrite can be really fast; therefore,
|
| 4. Sample storage |
|
| 5. Measurement procedure |
I. Prepare the reductive/oxidative solution.
|
| 6. Technical issues |
|
| 7. pH |
|
Disclaimer/Publisher’s Note: The statements, opinions and data contained in all publications are solely those of the individual author(s) and contributor(s) and not of MDPI and/or the editor(s). MDPI and/or the editor(s) disclaim responsibility for any injury to people or property resulting from any ideas, methods, instructions or products referred to in the content. |
© 2024 by the authors. Licensee MDPI, Basel, Switzerland. This article is an open access article distributed under the terms and conditions of the Creative Commons Attribution (CC BY) license (https://creativecommons.org/licenses/by/4.0/).
Share and Cite
Li, J.; LoBue, A.; Heuser, S.K.; Cortese-Krott, M.M. Determination of Nitric Oxide and Its Metabolites in Biological Tissues Using Ozone-Based Chemiluminescence Detection: A State-of-the-Art Review. Antioxidants 2024, 13, 179. https://doi.org/10.3390/antiox13020179
Li J, LoBue A, Heuser SK, Cortese-Krott MM. Determination of Nitric Oxide and Its Metabolites in Biological Tissues Using Ozone-Based Chemiluminescence Detection: A State-of-the-Art Review. Antioxidants. 2024; 13(2):179. https://doi.org/10.3390/antiox13020179
Chicago/Turabian StyleLi, Junjie, Anthea LoBue, Sophia K. Heuser, and Miriam M. Cortese-Krott. 2024. "Determination of Nitric Oxide and Its Metabolites in Biological Tissues Using Ozone-Based Chemiluminescence Detection: A State-of-the-Art Review" Antioxidants 13, no. 2: 179. https://doi.org/10.3390/antiox13020179
APA StyleLi, J., LoBue, A., Heuser, S. K., & Cortese-Krott, M. M. (2024). Determination of Nitric Oxide and Its Metabolites in Biological Tissues Using Ozone-Based Chemiluminescence Detection: A State-of-the-Art Review. Antioxidants, 13(2), 179. https://doi.org/10.3390/antiox13020179