Figure 7.
Effect of coriander oil and metformin (50 mg/kg/day, PO) on pancreatic apoptosis marker, BAX in dexamethasone-induced insulin resistance in rats (RI). Photomicrograph of a pancreatic sections of (A) the control group displaying few of the islet cells are BAX positive cells; (B) the IR group displaying most of the islet cells are BAX positive cells; (C) metformin group showing some of the islet cells are BAX positive cells; (D) coriander oil (low dose group, 0.5 mL/kg, PO) displaying many of the islet cells are BAX positive cells; (E) coriander oil (high dose group, 1 mL/kg, PO) displaying some of the islet cells are BAX positive cells (Avidine biotin peroxidase stain with Hx counter stain ×400, scale bar = 50 µm); (F) Bar graph showing the difference in number of immunopositive BAX cells in islets of Langerhans per field in all studied groups which was quantified ×400. Results were analyzed by one-way ANOVA followed by the Post-hoc Tukey test. Results are shown in mean ± SEM (n = 6). *, @, #, $ p < 0.05 compared to normal, IR, metformin, and high dose coriander oil (CO 1) groups, respectively.
![Antioxidants 13 01410 g007]()
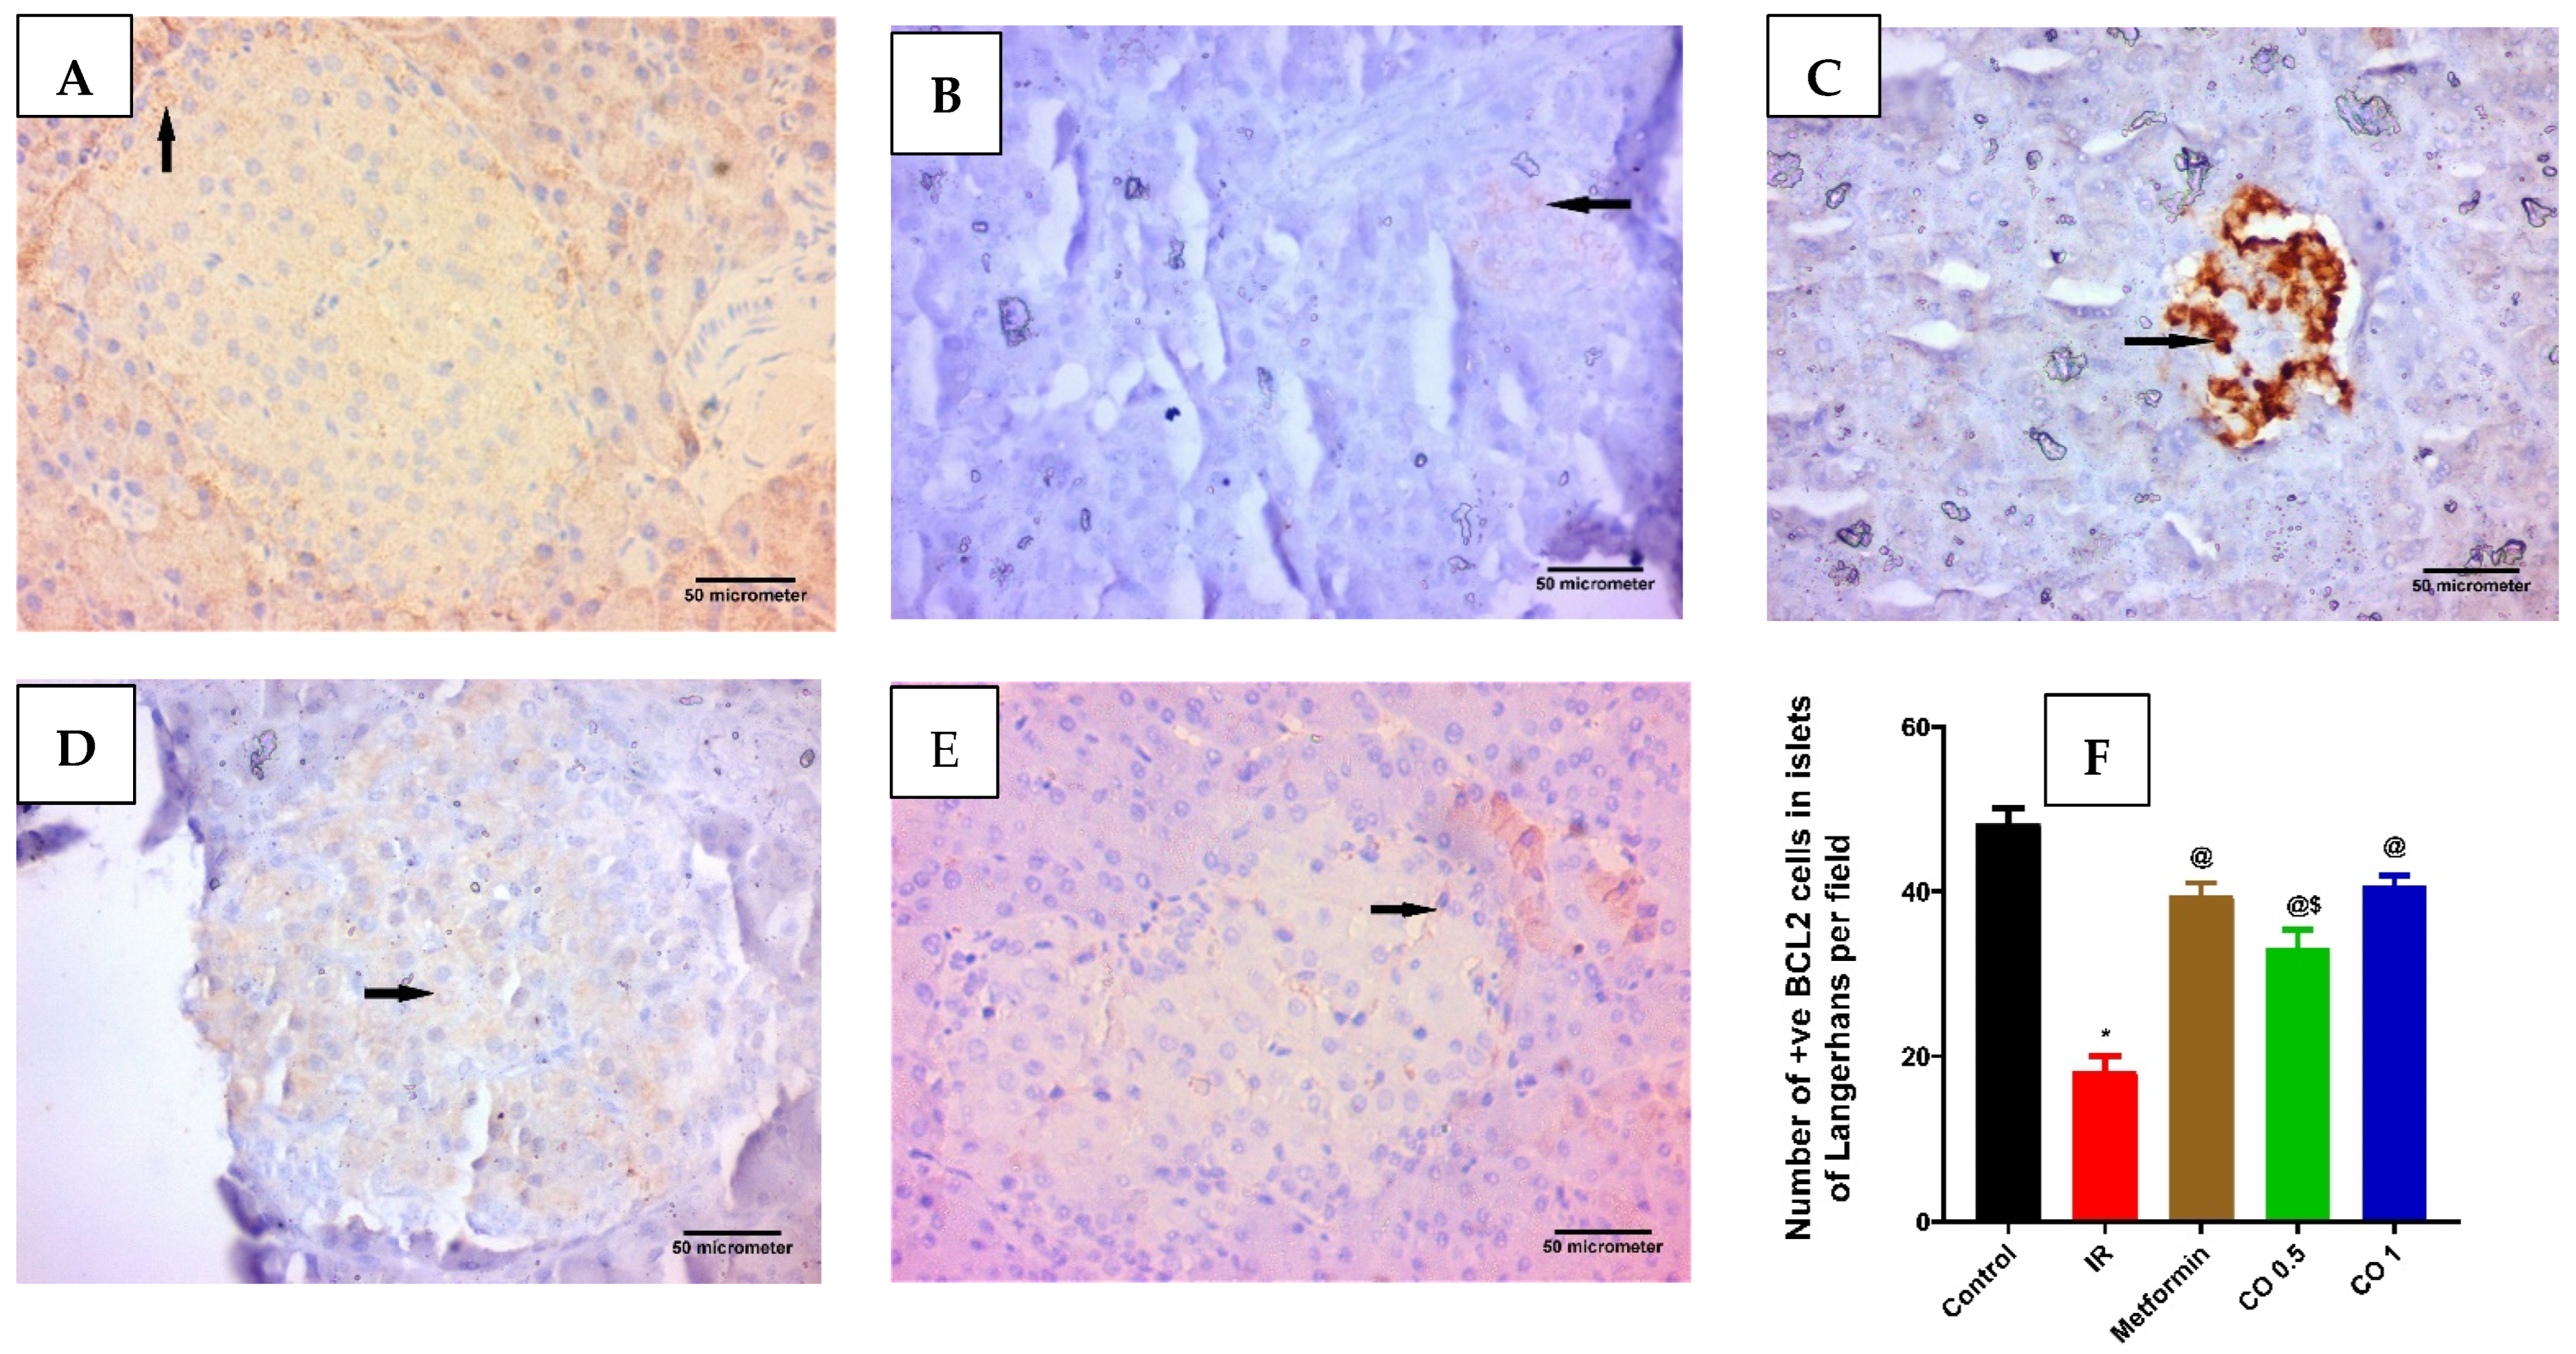
Figure 8.
Effect of Effect of coriander oil and metformin on pancreatic anti-apoptotic marker, BCL2 in dexamethasone-induced insulin resistance in rats (RI). Photomicrograph of a pancreatic sections (A) control group displaying most of the islet cells are BCL2 positive cells; (B) IR group displaying few of the islet cells are BCL2 positive cells; (C) metformin group (50 mg/kg/day, PO) displaying many of the islet cells are BCL2 positive cells; (D) coriander oil group (low dose, (CO 0.5 mL/kg, PO)) displaying some of the islet cells are BCL2 positive cells; (E) coriander oil group (high dose, (CO 1 mL/kg, PO)) displaying many of the islet cells are BCL2 positive cells (Avidine biotin peroxidase stain with Hx counter stain ×400, scale bar = 50 µm); (F) Bar graph showing the difference in number of immunopositive BCL2 cells in islets of Langerhans per field in all studied groups that were quantified at ×400. Results were analyzed by one-way ANOVA followed by the post-hoc Tukey test. Results are shown in mean ± SEM (n = 6). *, @, $ p < 0.05 compared to normal, IR, and high dose coriander oil (CO 1) groups, respectively.
![Antioxidants 13 01410 g008]()

