
Gas Plasma Exposure Alters Microcirculation and Inflammation during Wound Healing in a Diabetic Mouse Model

 , , and
Abstract
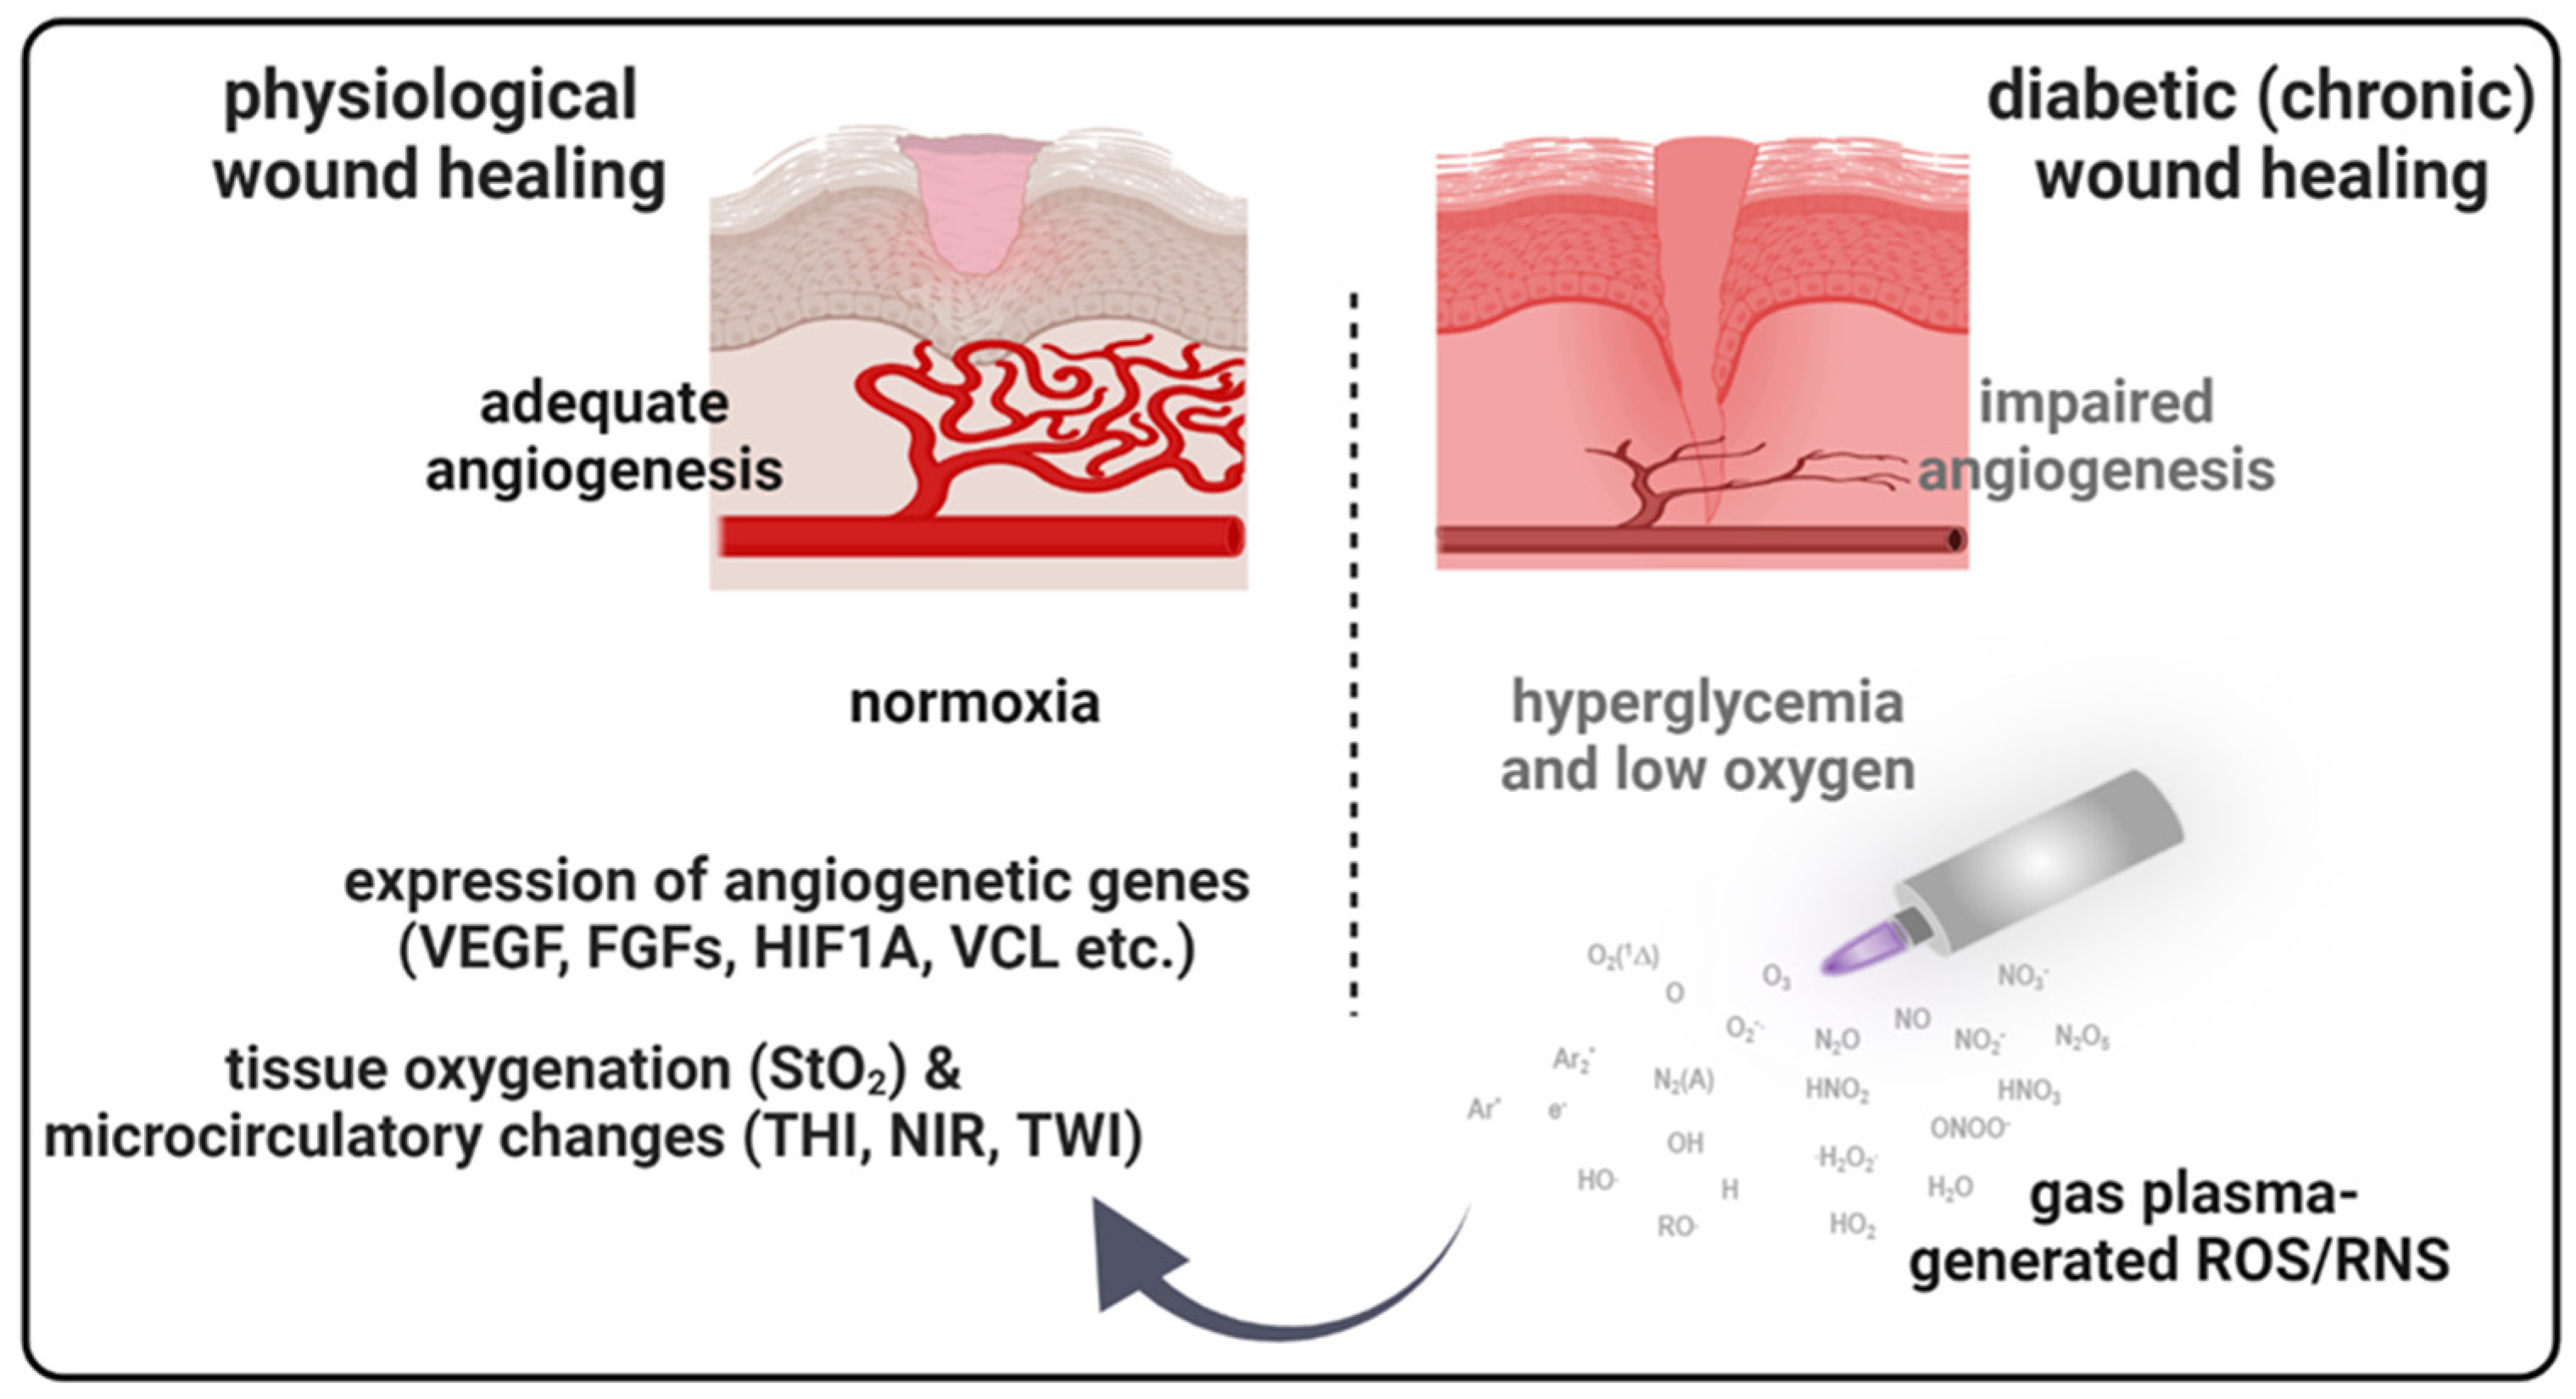
1. Introduction
2. Material and Methods
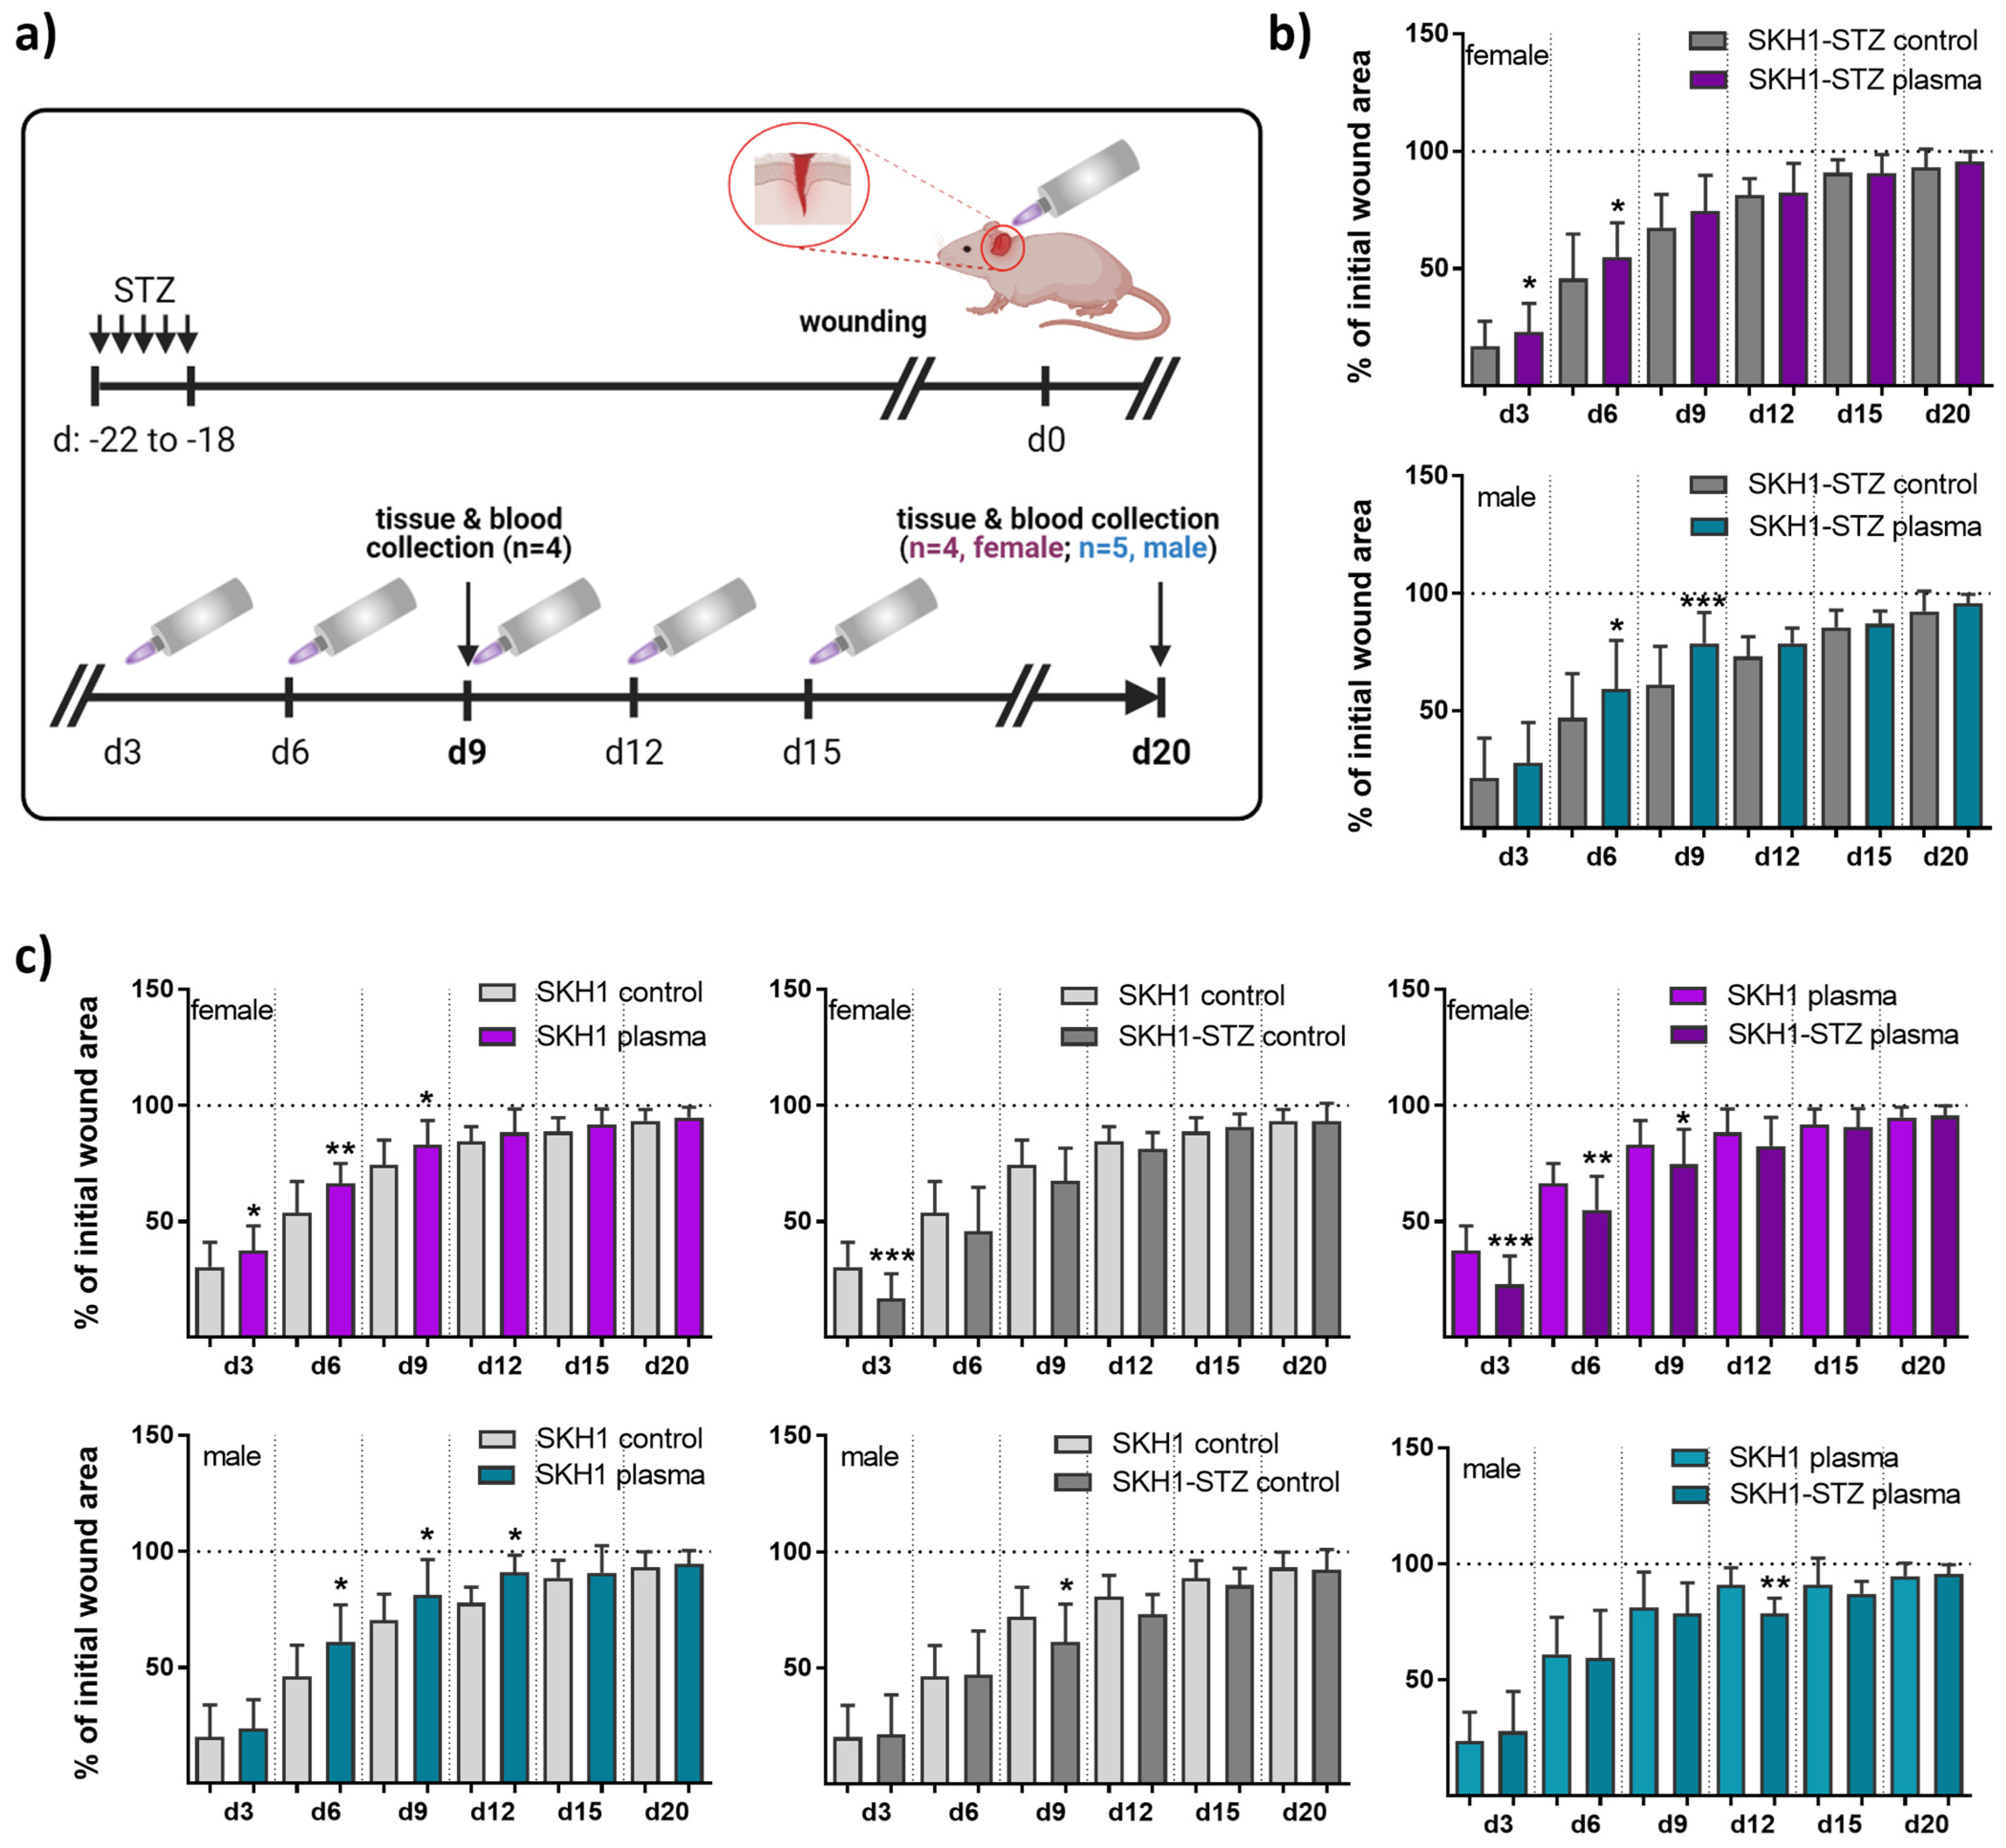
2.1. Animals and Wounding
2.2. Medical Gas Plasma Treatment and Wound Closure Measurements
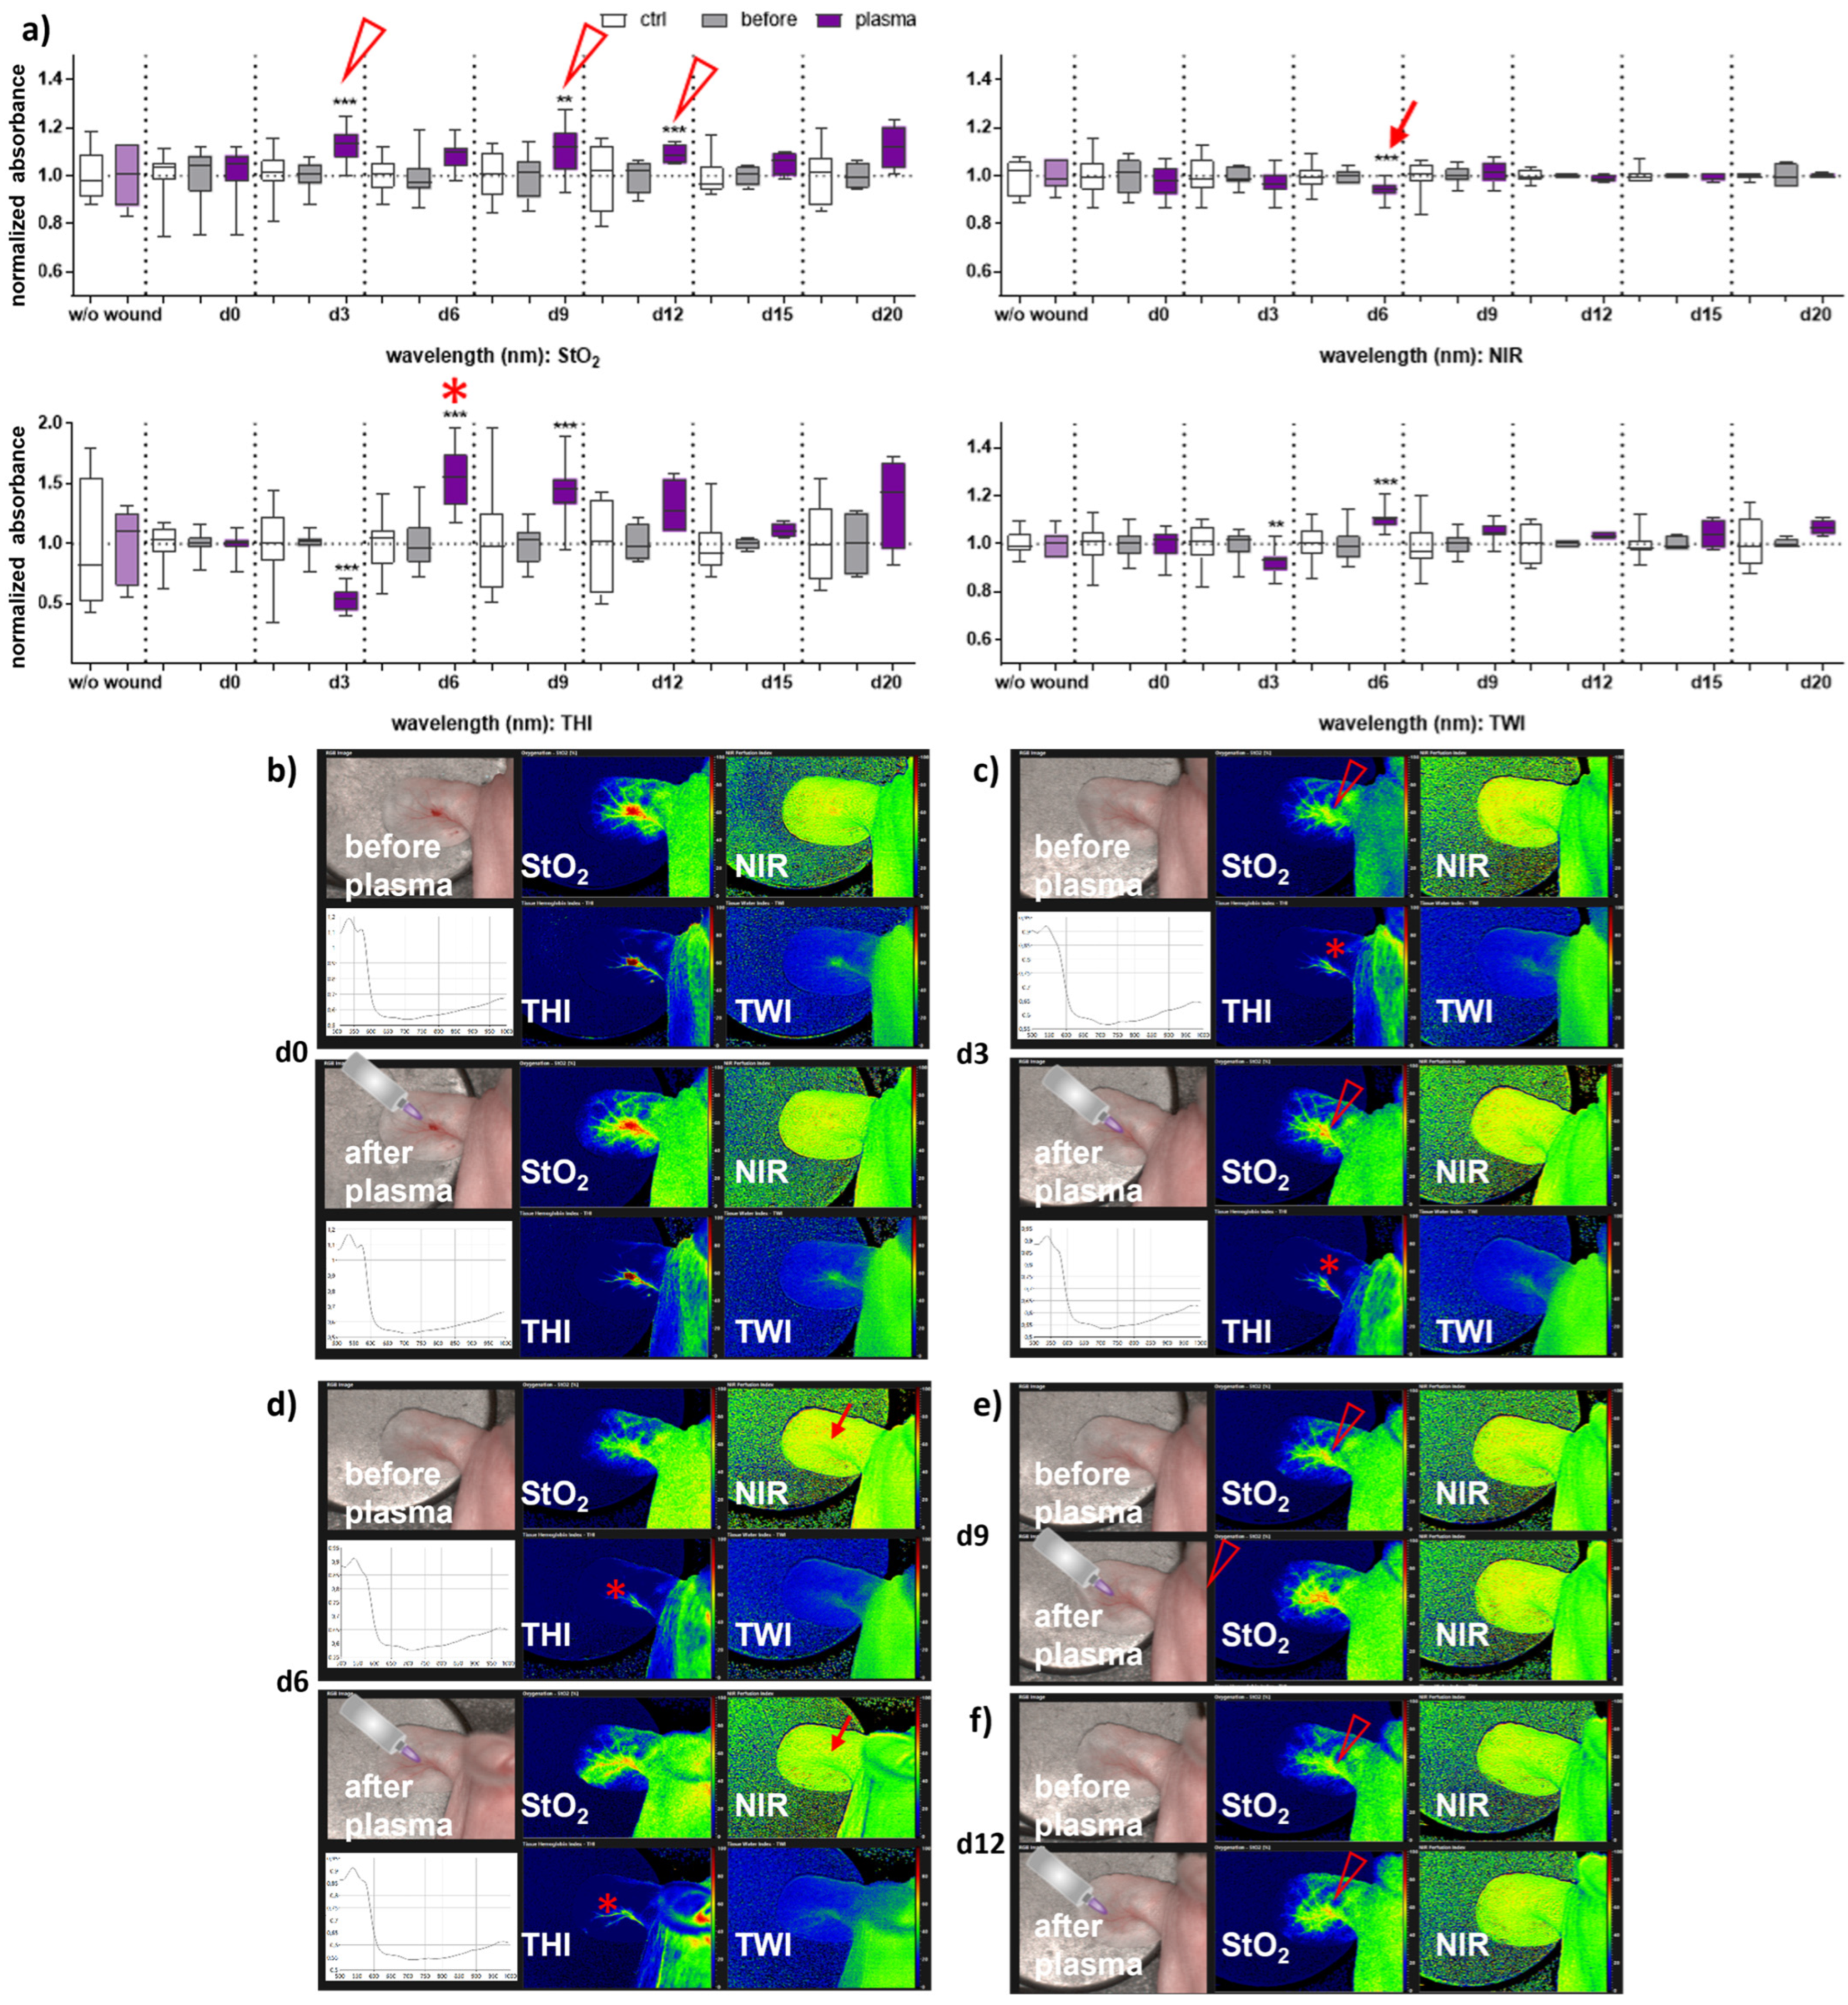
2.3. Hyperspectral Imaging (HSI) System
2.4. Skin Cell Isolation and Homogenization of Ear Tissue
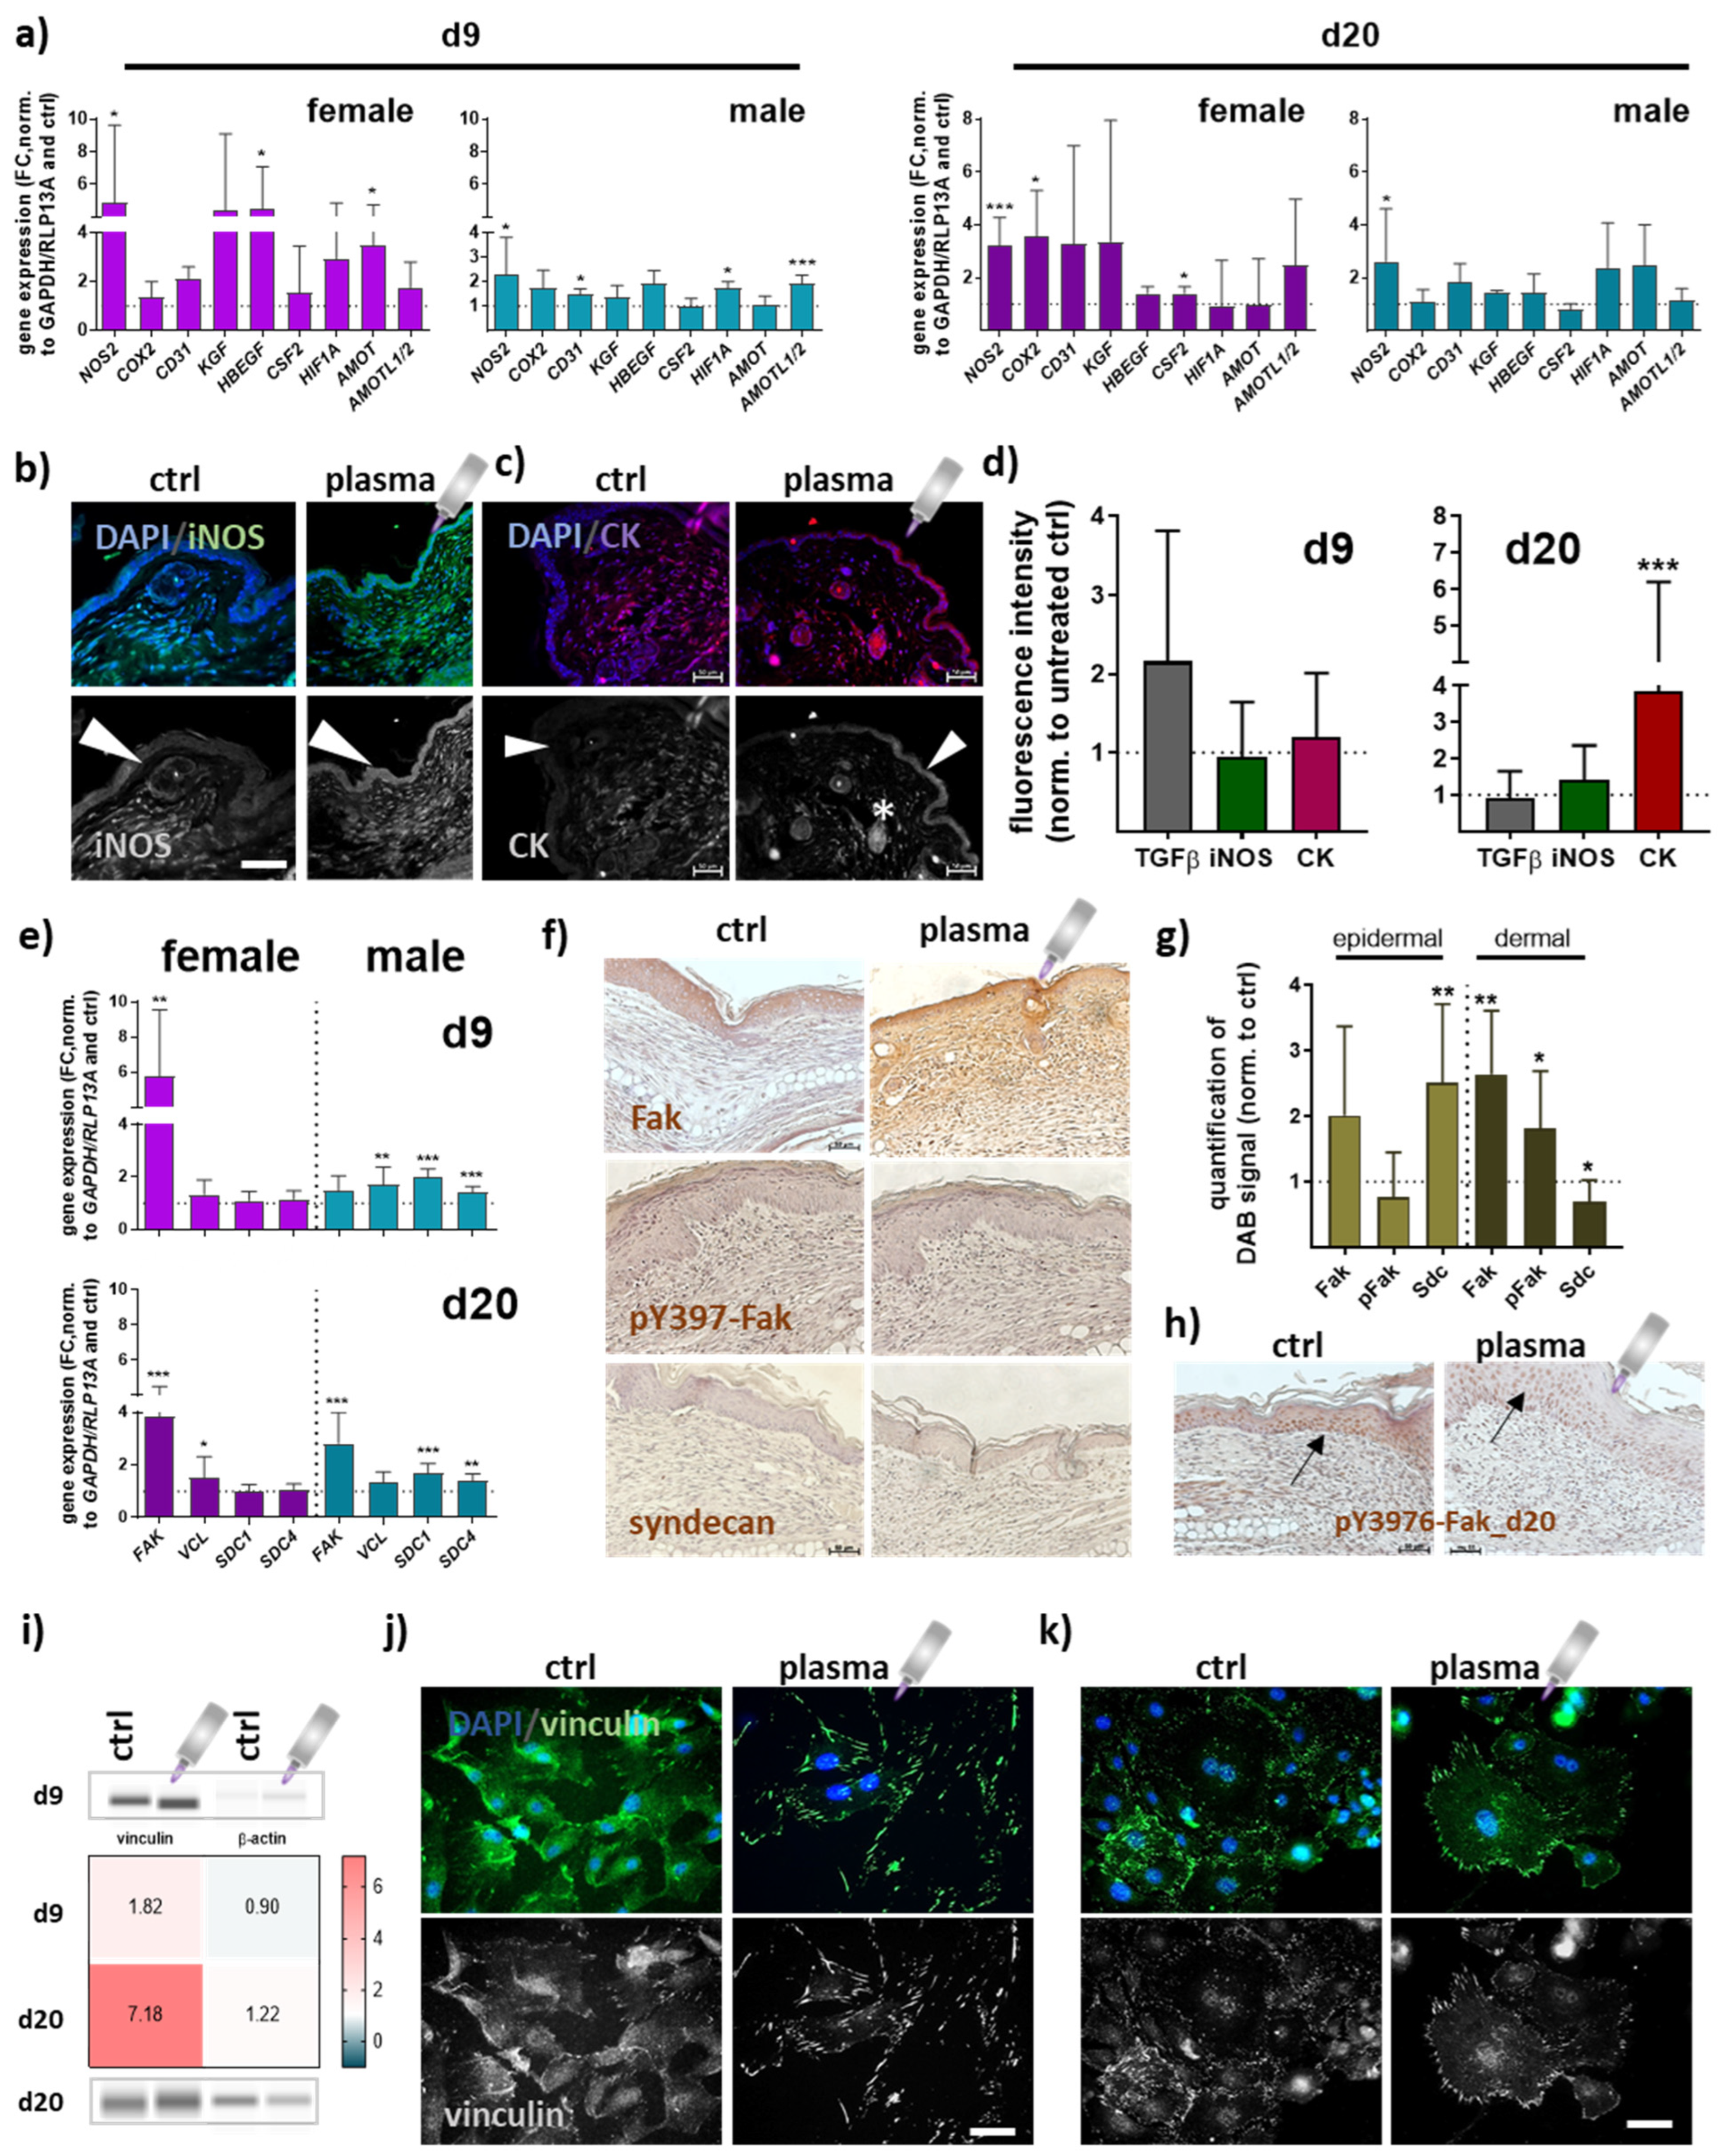
2.5. RNA Extraction and Quantitative PCR Analysis
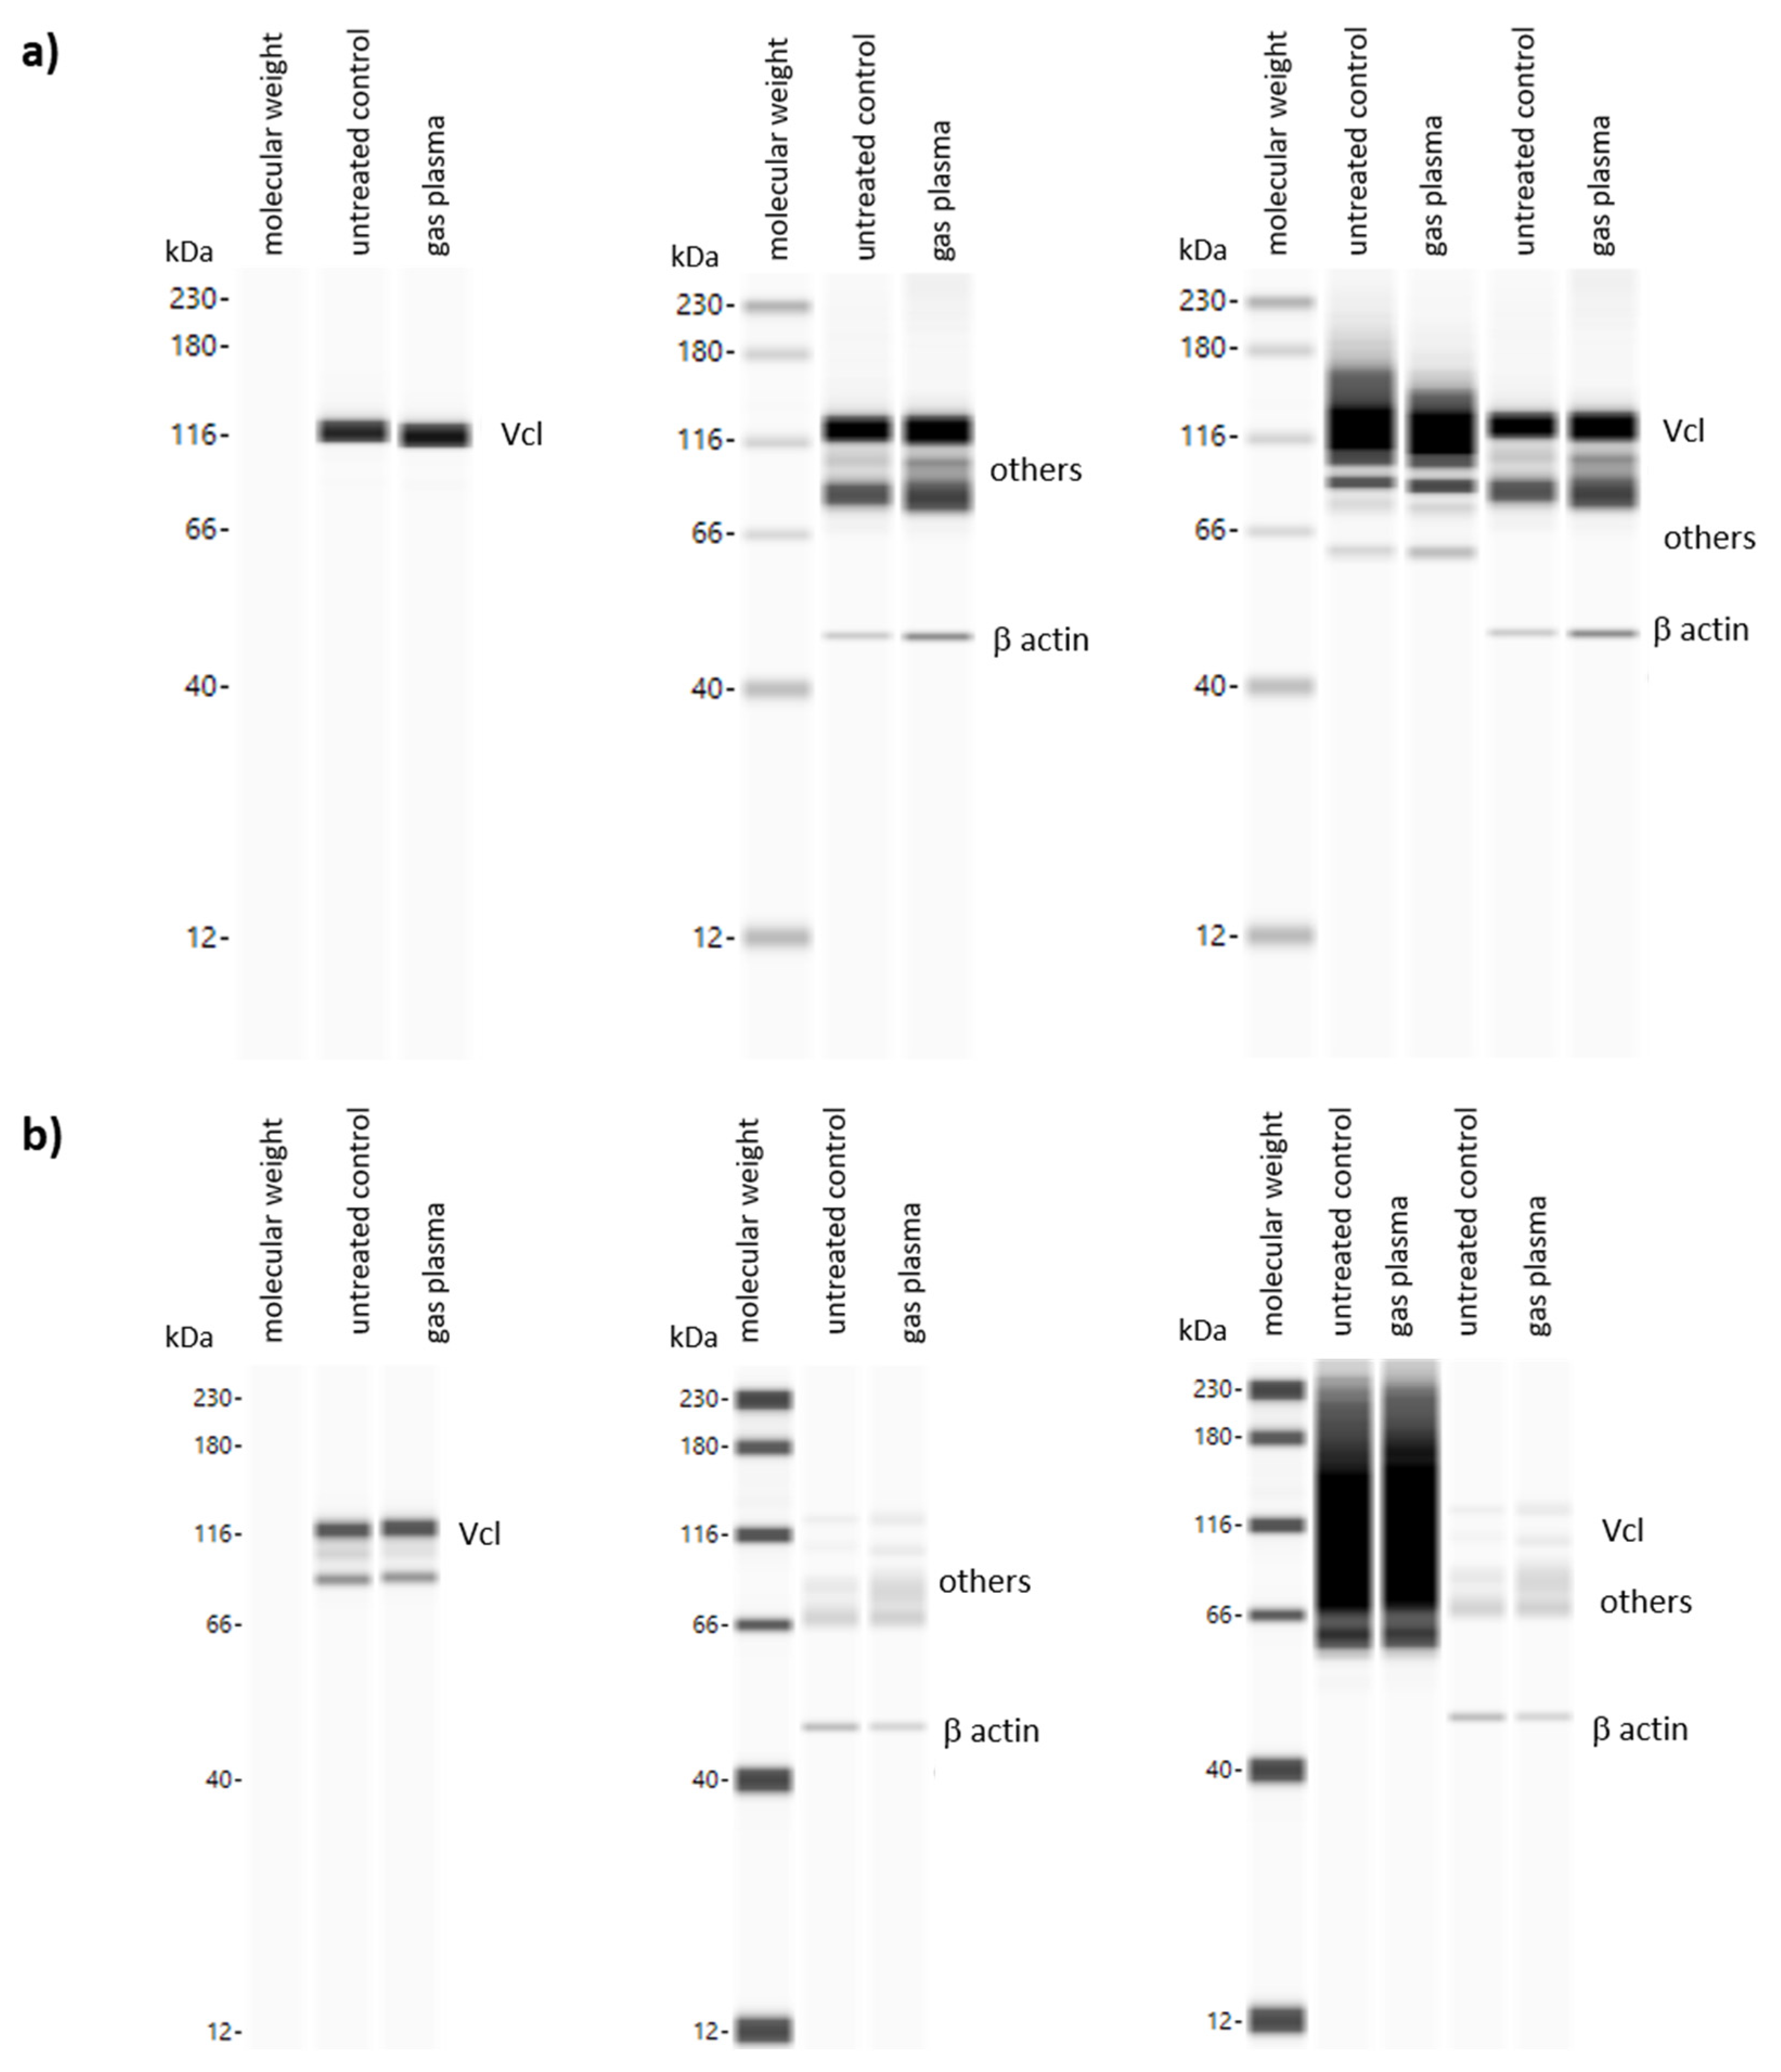
2.6. Protein Analyses Using WES Quantification System or Immunohistochemical Staining
2.7. Bead-Based Cytokine and Chemokine Profiling in Blood Serum and Protein Lysates
2.8. Statistical Analysis
3. Results
3.1. Gas Plasma-Treated Diabetic Wounds Showed Faster Healing Responses
3.2. Gas Plasma-Treated Wounds Showed Different Microcirculatory Parameters
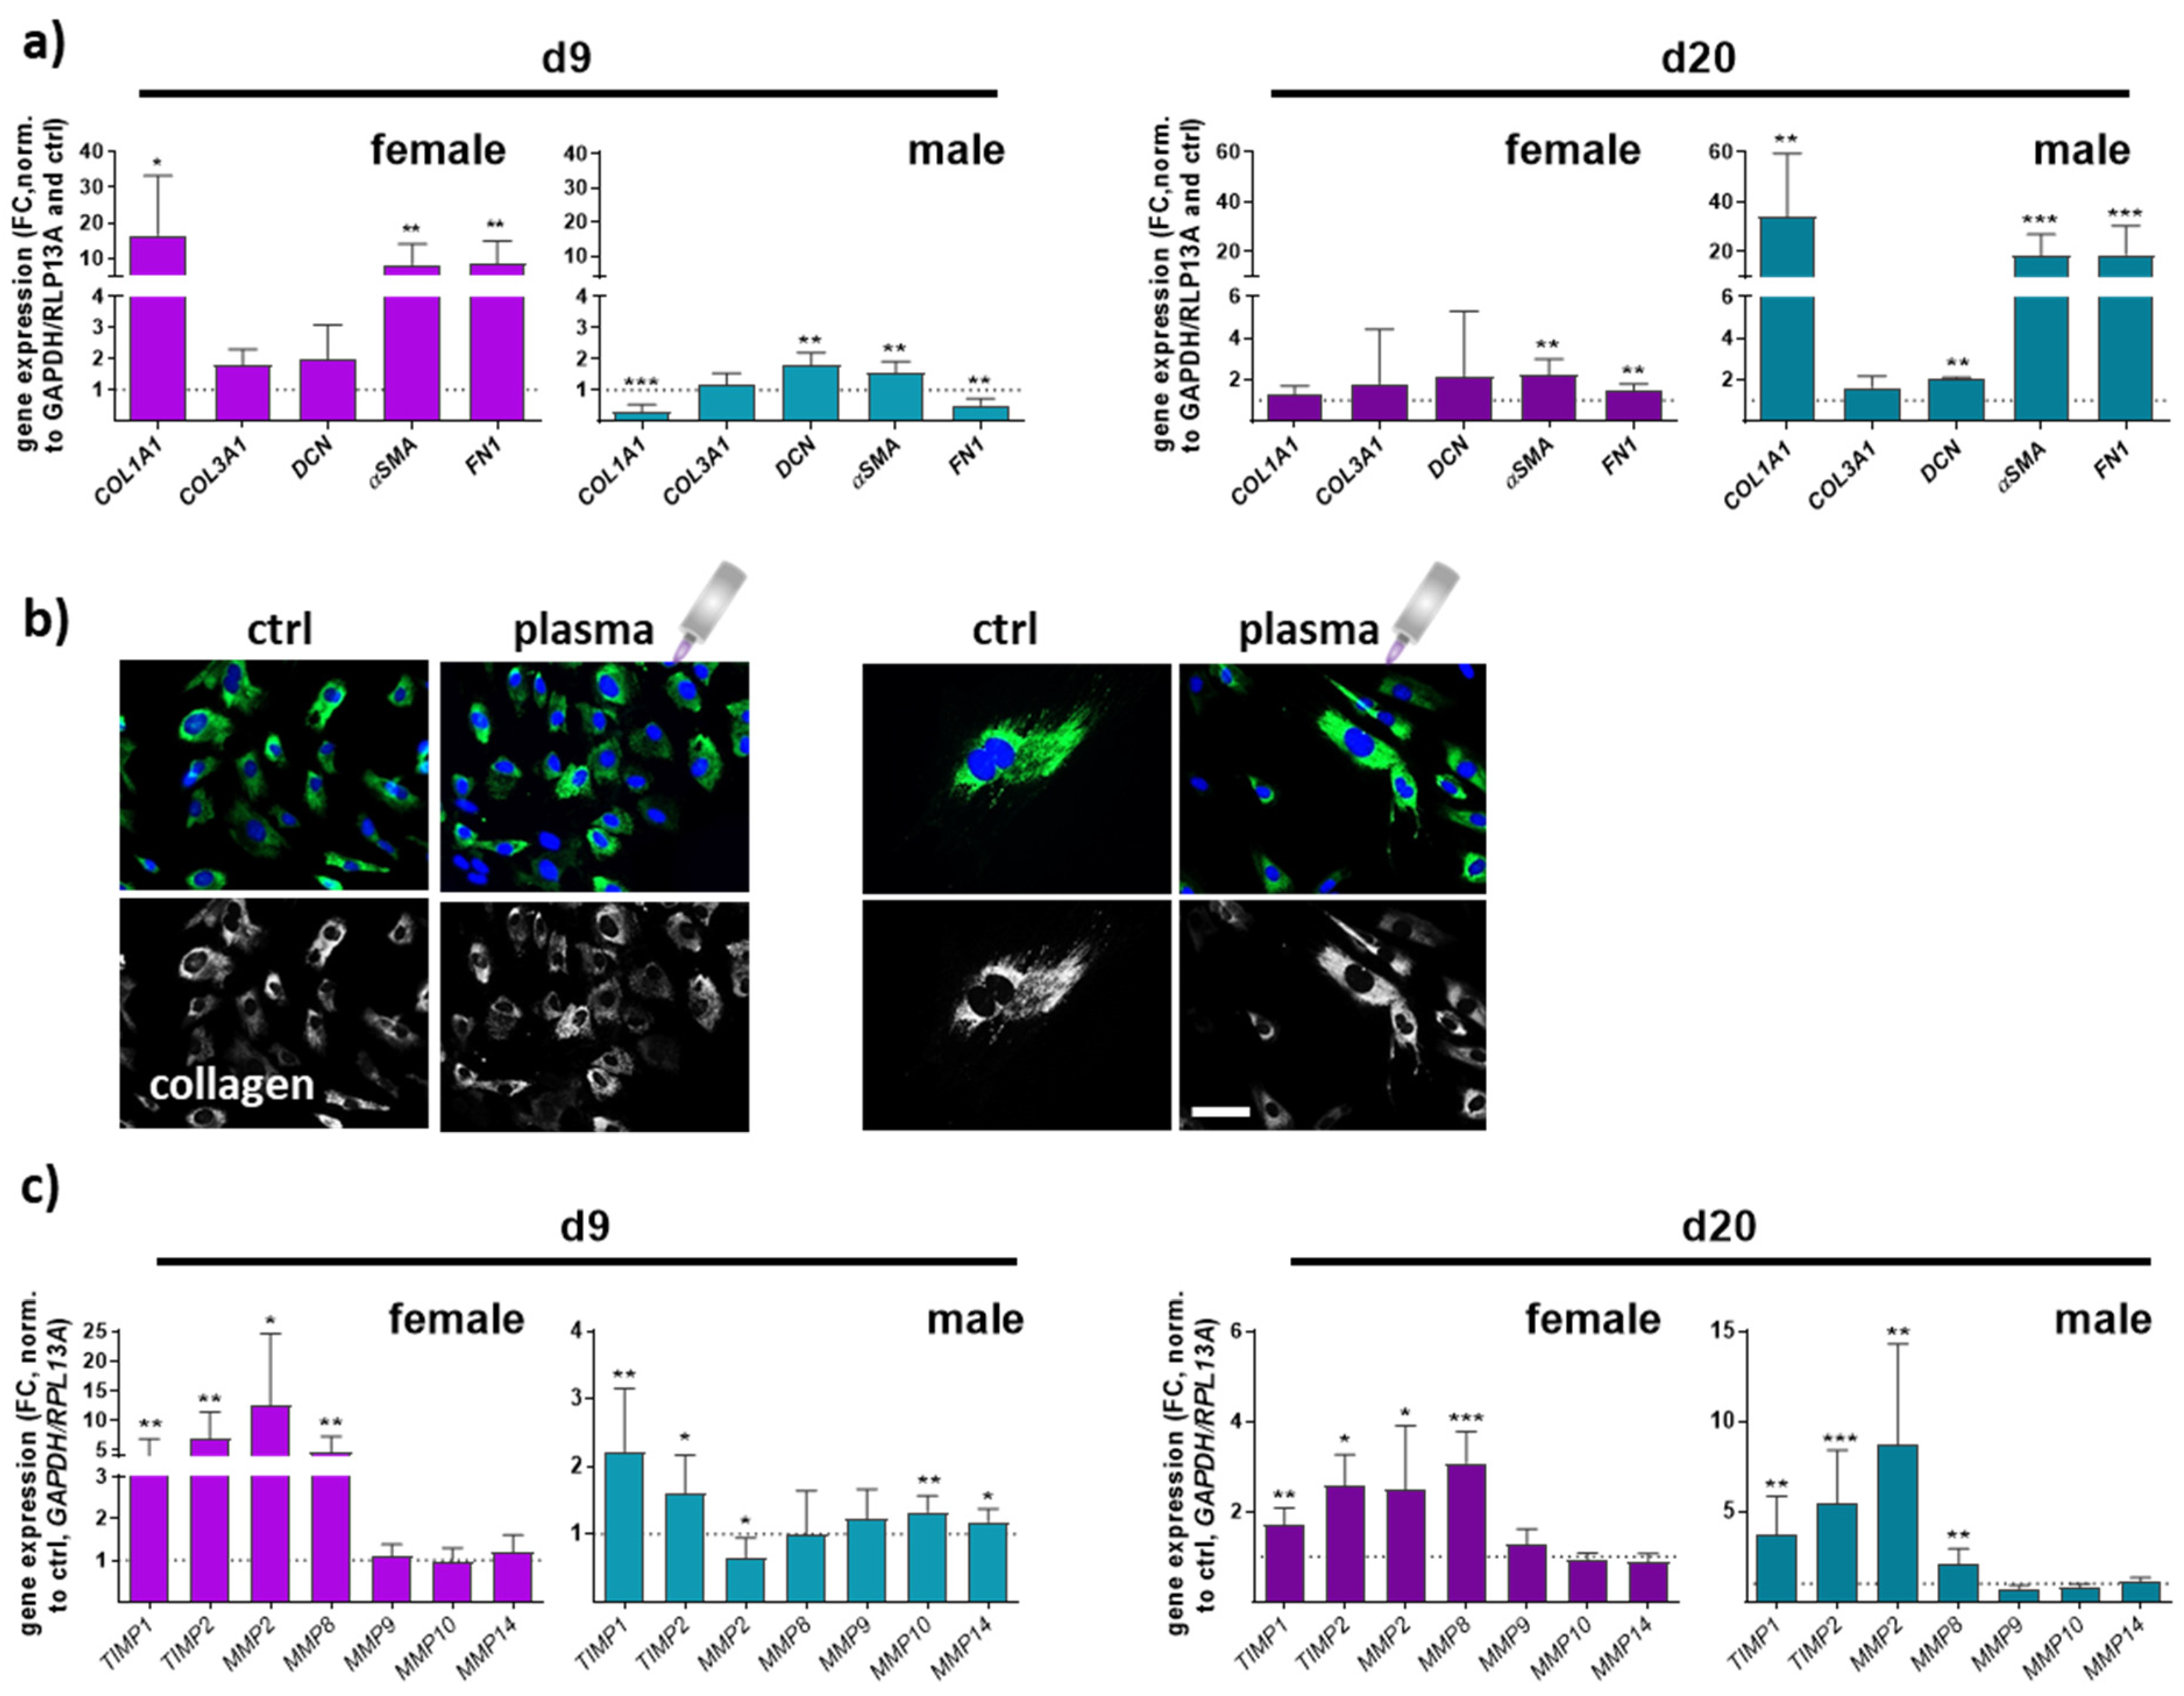
3.3. Gene and Protein Expression of Angiogenic Factors in Newly Regenerated Tissue of Healing Wounds Were Significantly Altered with Gas Plasma Therapy
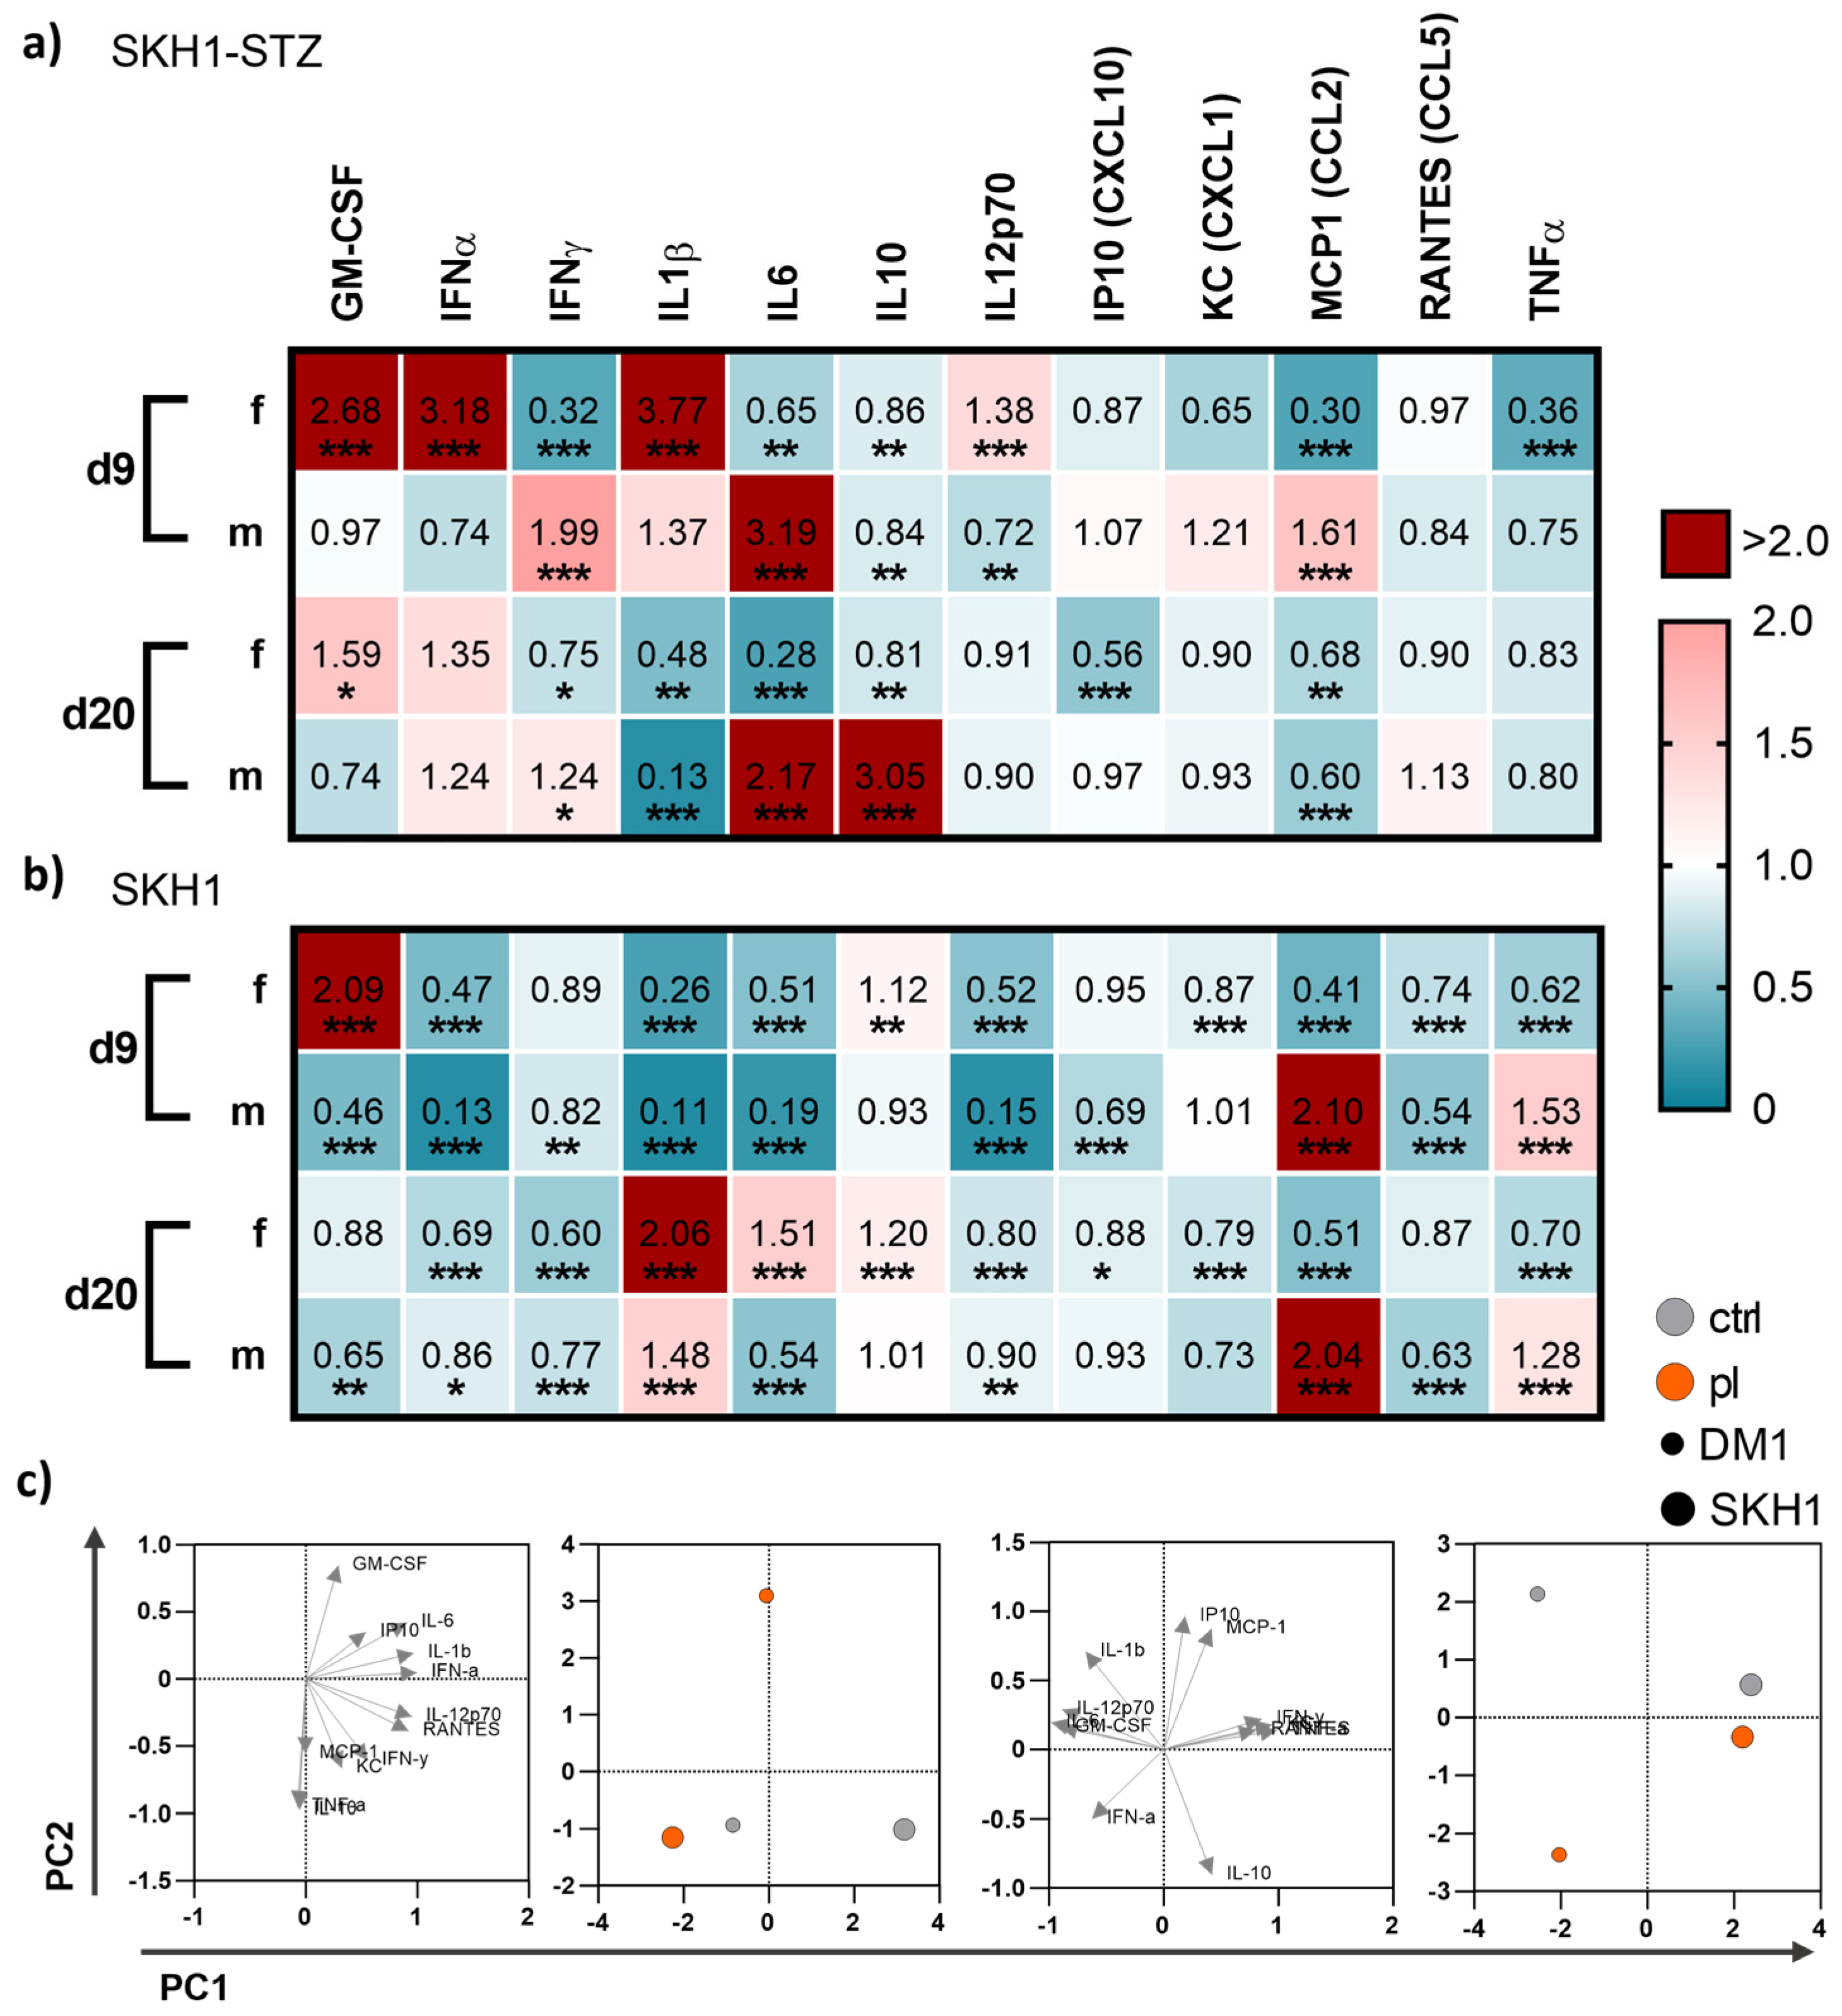
3.4. Medical Gas Plasma Modified Systemic Cytokine and Growth Factor Levels
4. Discussion
5. Conclusions
Author Contributions
Funding
Institutional Review Board Statement
Informed Consent Statement
Data Availability Statement
Acknowledgments
Conflicts of Interest
Appendix A

| Gene Name | Gene ID | Primer Sequences (3′-5′) |
|---|---|---|
| nitric oxide synthase 2 (inducible) | NOS2 (iNOS) | CCT GGT ACG GGC ATT GCT GCT CAT GCG GCC TCC TTT |
| cyclooxygenase 2 | COX2 | TGC CTG GTC TGA TGA TGT ATG CCA AGT AGT CGC ACA CTC TGT TGT GCT |
| platelet endothelial cell adhesion molecule 1 | CD31 (PECAM1) | CTG CCA GTC CGA AAA TGG AAC CTT CAT CCA CCG GGG CTA TC |
| keratinocyte growth factor | KGF | ACC TGA GGA TTG ACA AAC GAG G CCA CGG TCC TGA TTT CCA TGA |
| hypoxia-inducible factor 1A | HIF1A | GGG GAG GAC GAT GAA CAT CAA GGG TGG TTT CTT GTA CCC ACA |
| angiomotin | AMOT | CCG CCA GAA TACC CTT TCA AG GGT TCA GGC GAT GCT CAC TA |
| angiomotin like 1/2 | AMOTL1/2 | CCT TGC GAG CCT GTG CTT A AAG TCT GGG TAG AAG TAG GCG |
| vinculin | VCL | GCT TCAGTC AGACCC ATA CTC G AGG TAA GCA GTA GGT CAG ATG T |
| focal adhesion kinase | FAK/PTK2 | GAG TAC GTC CCT ATG GTG AAG G CTC GAT CTC TCG ATG AGT GCT |
| syndecan 1 | SDC1 | AAC GGG CCT CAA CAG TCA G CCG TGC GGA TGA GAT GTG A |
| syndecan 4 | SDC4 | TTT GCC GTT TTC CTG ATC CTG TTG CCC AAG TCG TAA CTG CC |
| collagen 1A1 | COL1A1 | GCT CCT CTT AGG GGC CAC T ATT GGG GAC CCT TAG GCC AT |
| collagen 3A1 | COL3A1 | CTG TAA CAT GGA AAC TGG GGA AA CCA TAG CTG AAC TGA AAA CCA CC |
| decorin | DCN | GTC ATC TTC GAG TGG TGC AGT CAA GGT TGTGTCGGGTGGAAA |
| smooth muscle actin α | αSMA | CCC AGA CAT CAG GGA GTA ATG G TCT ATC GGA TAC TTC AGC GTC A |
| fibronectin 1 | FN1 | GCT CAG CAA ATC GTG CAG C CTA GGT AGG TCC GTT CCC ACT |
| matrix metalloproteinase 2 | MNMP2 | GAC ATA CAT CTT TGC AGG AGA CAA G TCT GCG ATG AGC TTA GGG AAA |
| matrix metalloproteinase 8 | MNMP8 | CTT ACC TCG GAT CGT AGT GGA CCC CAA CTA ACC CTC TTG AAG T |
| matrix metalloproteinase 9 | MNMP9 | CCT GGA ACT CAC ACG ACA TCT TC TGG AAA CTC ACA CGC CAG AA |
| matrix metalloproteinase 10 | MNMP10 | GAG CCA CTA GCC ATC CTG G CTG AGC AAG ATC CAT GCT TGG |
| matrix metalloproteinase 14 | MNMP14 | ACC CACACACAACGCTCAC GCC TGT CAC TTG TAA ACC ATA GA |
| inhibitor of matrix metalloproteinase 1 | TIMP1 | GCG TTT TGC AAT GCAGACG ATT CCC GGA ATC CAC CTCC |
| inhibitor of matrix metalloproteinase 2 | TIMP2 | GCC AAA GCA GTG AGC GAG AAG CAC ACT GCT GAA GAG GGG GC |
| glyceraldehyde 3-phosphate dehydrogenase | GAPDH | CAT GGC CTC CAA GGA GTA AG TGT GAG GGA GAT GCT CAG TG |
| ribosomal protein 13A | RLP13A | AGC CTA CCA GAA AGT TTG CTT AC GCT TCT TCT TCC GAT AGT GCA TC |
| β actin | ACTB | TTG CTG ACA GGA TGC AGA AG ACA TCT GCT GGA AGG TGG AC |
References
- Martin, P. Wound Healing—Aiming for Perfect Skin Regeneration. Science 1997, 276, 75–81. [Google Scholar] [CrossRef] [PubMed]
- Gonzalez, A.C.; Costa, T.F.; Andrade, Z.A.; Medrado, A.R. Wound Healing—A Literature Review. An. Bras. Dermatol. 2016, 91, 614–620. [Google Scholar] [CrossRef] [PubMed]
- Richmond, N.A.; Maderal, A.D.; Vivas, A.C. Evidence-Based Management of Common Chronic Lower Extremity Ulcers. Dermatol. Ther. 2013, 26, 187–196. [Google Scholar] [CrossRef] [PubMed]
- Rohm, T.V.; Meier, D.T.; Olefsky, J.M.; Donath, M.Y. Inflammation in Obesity, Diabetes, and Related Disorders. Immunity 2022, 55, 31–55. [Google Scholar] [CrossRef] [PubMed]
- Ylitalo, K.R.; Sowers, M.; Heeringa, S. Peripheral Vascular Disease and Peripheral Neuropathy in Individuals with Cardiometabolic Clustering and Obesity: National Health and Nutrition Examination Survey 2001–2004. Diabetes Care 2011, 34, 1642–1647. [Google Scholar] [CrossRef] [PubMed]
- Eisenbud, D.E. Oxygen in Wound Healing: Nutrient, Antibiotic, Signaling Molecule, and Therapeutic Agent. Clin. Plast. Surg. 2012, 39, 293–310. [Google Scholar] [CrossRef] [PubMed]
- Koivisto, L.; Häkkinen, L.; Larjava, H. Re-Epithelialization of Wounds. Endod. Top. 2011, 24, 59. [Google Scholar] [CrossRef]
- Zechner, D.; Knapp, N.; Bobrowski, A.; Radecke, T.; Genz, B.; Vollmar, B. Diabetes Increases Pancreatic Fibrosis During Chronic Inflammation. Exp. Biol. Med. 2014, 239, 670–676. [Google Scholar] [CrossRef]
- Furman, B.L. Streptozotocin-Induced Diabetic Models in Mice and Rats. Curr. Protoc. 2021, 1, e78. [Google Scholar] [CrossRef]
- Wu, J.; Yan, L.J. Streptozotocin-Induced Type 1 Diabetes in Rodents as a Model for Studying Mitochondrial Mechanisms of Diabetic Beta Cell Glucotoxicity. Diabetes Metab. Syndr. Obes. 2015, 8, 181–188. [Google Scholar] [CrossRef]
- Saiko, G.; Lombardi, P.; Au, Y.; Queen, D.; Armstrong, D.; Harding, K. Hyperspectral Imaging in Wound Care: A Systematic Review. Int. Wound J. 2020, 17, 1840–1856. [Google Scholar] [CrossRef] [PubMed]
- Wahabzada, M.; Besser, M.; Khosravani, M.; Kuska, M.T.; Kersting, K.; Mahlein, A.K.; Sturmer, E. Monitoring Wound Healing in a 3d Wound Model by Hyperspectral Imaging and Efficient Clustering. PLoS ONE 2017, 12, e0186425. [Google Scholar] [CrossRef] [PubMed]
- Schmidt, A.; Niesner, F.; von Woedtke, T.; Bekeschus, S. Hyperspectral Imaging of Wounds Reveals Augmented Tissue Oxygenation Following Cold Physical Plasma Treatment in Vivo. IEEE Trans. Radiat. Plasma Med. Sci. 2021, 5, 412. [Google Scholar] [CrossRef]
- Daeschlein, G.; Rutkowski, R.; Lutze, S.; von Podewils, S.; Sicher, C.; Wild, T.; Metelmann, H.R.; von Woedkte, T.; Junger, M. Hyperspectral Imaging: Innovative Diagnostics to Visualize Hemodynamic Effects of Cold Plasma in Wound Therapy. Biomed. Tech. 2018, 63, 603–608. [Google Scholar] [CrossRef] [PubMed]
- Rutkowski, R.; Schuster, M.; Unger, J.; Seebauer, C.; Metelmann, H.R.; Woedtke, T.V.; Weltmann, K.D.; Daeschlein, G. Hyperspectral Imaging for In Vivo Monitoring of Cold Atmospheric Plasma Effects on Microcirculation in Treatment of Head and Neck Cancer and Wound Healing. Clin. Plasma Med. 2017, 7–8, 52. [Google Scholar] [CrossRef]
- Kolimi, P.; Narala, S.; Nyavanandi, D.; Youssef, A.A.A.; Dudhipala, N. Innovative Treatment Strategies to Accelerate Wound Healing: Trajectory and Recent Advancements. Cells 2022, 11, 2439. [Google Scholar] [CrossRef] [PubMed]
- Bekeschus, S.; Kramer, A.; Schmidt, A. Gas Plasma-Augmented Wound Healing in Animal Models and Veterinary Medicine. Molecules 2021, 26, 5682. [Google Scholar] [CrossRef] [PubMed]
- Weidinger, A.; Kozlov, A.V. Biological Activities of Reactive Oxygen and Nitrogen Species: Oxidative Stress Versus Signal Transduction. Biomolecules 2015, 5, 472–484. [Google Scholar] [CrossRef]
- Bekeschus, S.; von Woedtke, T.; Emmert, S.; Schmidt, A. Medical Gas Plasma-Stimulated Wound Healing: Evidence and Mechanisms. Redox Biol. 2021, 46, 102116. [Google Scholar] [CrossRef]
- Stratmann, B.; Costea, T.C.; Nolte, C.; Hiller, J.; Schmidt, J.; Reindel, J.; Masur, K.; Motz, W.; Timm, J.; Kerner, W.; et al. Effect of Cold Atmospheric Plasma Therapy Vs Standard Therapy Placebo on Wound Healing in Patients with Diabetic Foot Ulcers: A Randomized Clinical Trial. JAMA Netw. Open 2020, 3, e2010411. [Google Scholar] [CrossRef]
- Amini, M.R.; Sheikh Hosseini, M.; Fatollah, S.; Mirpour, S.; Ghoranneviss, M.; Larijani, B.; Mohajeri-Tehrani, M.R.; Khorramizadeh, M.R. Beneficial Effects of Cold Atmospheric Plasma on Inflammatory Phase of Diabetic Foot Ulcers; a Randomized Clinical Trial. J. Diabetes Metab. Disord. 2020, 19, 895–905. [Google Scholar] [CrossRef] [PubMed]
- Mirpour, S.; Fathollah, S.; Mansouri, P.; Larijani, B.; Ghoranneviss, M.; Mohajeri Tehrani, M.; Amini, M.R. Cold Atmospheric Plasma as an Effective Method to Treat Diabetic Foot Ulcers: A Randomized Clinical Trial. Sci. Rep. 2020, 10, 10440. [Google Scholar] [CrossRef] [PubMed]
- Schmidt, A.; Bekeschus, S.; Jablonowski, H.; Barton, A.; Weltmann, K.D.; Wende, K. Role of Ambient Gas Composition on Cold Physical Plasma-Elicited Cell Signaling in Keratinocytes. Biophys. J. 2017, 112, 2397–2407. [Google Scholar] [CrossRef] [PubMed]
- Schmidt, A.; Rödder, K.; Hasse, S.; Masur, K.; Toups, L.; Lillig, C.H.; von Woedtke, T.; Wende, K.; Bekeschus, S. Redox-Regulation of Activator Protein 1 Family Members in Blood Cancer Cell Lines Exposed to Cold Physical Plasma-Treated Medium. Plasma Process. Polym. 2016, 13, 1179. [Google Scholar] [CrossRef]
- Schmidt, A.; Bekeschus, S.; Wende, K.; Vollmar, B.; von Woedtke, T. A Cold Plasma Jet Accelerates Wound Healing in a Murine Model of Full-Thickness Skin Wounds. Exp. Dermatol. 2017, 26, 156–162. [Google Scholar] [CrossRef] [PubMed]
- Miebach, L.; Freund, E.; Cecchini, A.L.; Bekeschus, S. Conductive Gas Plasma Treatment Augments Tumor Toxicity of Ringer’s Lactate Solutions in a Model of Peritoneal Carcinomatosis. Antioxidants 2022, 11, 1439. [Google Scholar] [CrossRef] [PubMed]
- van der Velden, L.A.; Schaafsma, H.E.; Manni, J.J.; Ramaekers, F.C.; Kuijpers, W. Cytokeratin Expression in Normal and (Pre)Malignant Head and Neck Epithelia: An Overview. Head. Neck 1993, 15, 133–146. [Google Scholar] [CrossRef]
- Watanabe, S.; Osumi, M.; Ohnishi, T.; Ichikawa, E.; Takahashi, H. Changes in Cytokeratin Expression in Epidermal Keratinocytes During Wound Healing. Histochem. Cell Biol. 1995, 103, 425–433. [Google Scholar] [CrossRef]
- Izard, T.; Brown, D.T. Mechanisms and Functions of Vinculin Interactions with Phospholipids at Cell Adhesion Sites. J. Biol. Chem. 2016, 291, 2548–2555. [Google Scholar] [CrossRef]
- Ojeh, N.; Hiilesvuo, K.; Warri, A.; Salmivirta, M.; Henttinen, T.; Maatta, A. Ectopic Expression of Syndecan-1 in Basal Epidermis Affects Keratinocyte Proliferation and Wound Re-Epithelialization. J. Investig. Dermatol. 2008, 128, 26–34. [Google Scholar] [CrossRef]
- Schmidt, A.; Liebelt, G.; Niessner, F.; von Woedtke, T.; Bekeschus, S. Gas Plasma-Spurred Wound Healing Is Accompanied by Regulation of Focal Adhesion, Matrix Remodeling, and Tissue Oxygenation. Redox Biol. 2021, 38, 101809. [Google Scholar] [CrossRef] [PubMed]
- Patel, S.; Srivastava, S.; Singh, M.R.; Singh, D. Mechanistic Insight into Diabetic Wounds: Pathogenesis, Molecular Targets and Treatment Strategies to Pace Wound Healing. Biomed. Pharmacother. 2019, 112, 108615. [Google Scholar] [CrossRef] [PubMed]
- Dunnill, C.; Patton, T.; Brennan, J.; Barrett, J.; Dryden, M.; Cooke, J.; Leaper, D.; Georgopoulos, N.T. Reactive Oxygen Species (Ros) and Wound Healing: The Functional Role of Ros and Emerging Ros-Modulating Technologies for Augmentation of the Healing Process. Int. Wound J. 2017, 14, 89–96. [Google Scholar] [CrossRef] [PubMed]
- Niethammer, P.; Grabher, C.; Look, A.T.; Mitchison, T.J. A Tissue-Scale Gradient of Hydrogen Peroxide Mediates Rapid Wound Detection in Zebrafish. Nature 2009, 459, 996–999. [Google Scholar] [CrossRef] [PubMed]
- Tur, E.; Bolton, L.; Constantine, B.E. Topical Hydrogen Peroxide Treatment of Ischemic Ulcers in the Guinea Pig: Blood Recruitment in Multiple Skin Sites. J. Am. Acad. Dermatol. 1995, 33, 217–221. [Google Scholar] [CrossRef] [PubMed]
- Brem, H.; Tomic-Canic, M. Cellular and Molecular Basis of Wound Healing in Diabetes. J. Clin. Investig. 2007, 117, 1219–1222. [Google Scholar] [CrossRef] [PubMed]
- DiPietro, L.A. Angiogenesis and Wound Repair: When Enough Is Enough. J. Leukoc. Biol. 2016, 100, 979–984. [Google Scholar] [CrossRef] [PubMed]
- Polaka, S.; Katare, P.; Pawar, B.; Vasdev, N.; Gupta, T.; Rajpoot, K.; Sengupta, P.; Tekade, R.K. Emerging Ros-Modulating Technologies for Augmentation of the Wound Healing Process. ACS Omega 2022, 7, 30657–30672. [Google Scholar] [CrossRef]
- Witte, M.B.; Thornton, F.J.; Tantry, U.; Barbul, A. L-Arginine Supplementation Enhances Diabetic Wound Healing: Involvement of the Nitric Oxide Synthase and Arginase Pathways. Metabolism 2002, 51, 1269–1273. [Google Scholar] [CrossRef]
- Cheng, K.Y.; Lin, Z.H.; Cheng, Y.P.; Chiu, H.Y.; Yeh, N.L.; Wu, T.K.; Wu, J.S. Wound Healing in Streptozotocin-Induced Diabetic Rats Using Atmospheric-Pressure Argon Plasma Jet. Sci. Rep. 2018, 8, 12214. [Google Scholar] [CrossRef]
- Okizaki, S.; Ito, Y.; Hosono, K.; Oba, K.; Ohkubo, H.; Amano, H.; Shichiri, M.; Majima, M. Suppressed Recruitment of Alternatively Activated Macrophages Reduces Tgf-Beta1 and Impairs Wound Healing in Streptozotocin-Induced Diabetic Mice. Biomed. Pharmacother. 2015, 70, 317–325. [Google Scholar] [CrossRef] [PubMed]
- Rono, B.; Engelholm, L.H.; Lund, L.R.; Hald, A. Gender Affects Skin Wound Healing in Plasminogen Deficient Mice. PLoS ONE 2013, 8, e59942. [Google Scholar] [CrossRef] [PubMed]
- Dietz, K.J. Redox Regulation of Transcription Factors in Plant Stress Acclimation and Development. Antioxid. Redox Signal. 2014, 21, 1356–1372. [Google Scholar] [CrossRef] [PubMed]
- Mills, S.J.; Ashworth, J.J.; Gilliver, S.C.; Hardman, M.J.; Ashcroft, G.S. The Sex Steroid Precursor Dhea Accelerates Cutaneous Wound Healing Via the Estrogen Receptors. J. Investig. Dermatol. 2005, 125, 1053–1062. [Google Scholar] [CrossRef] [PubMed]
- Ashcroft, G.S.; Dodsworth, J.; Boxtel, E.V.; Tarnuzzer, R.W.; Horan, M.A.; Schultz, G.S.; Ferguson, M.W.J. Estrogen Accelerates Cutaneous Wound Healing Associated with an Increase in Tgf-Β1 Levels. Nat. Med. 1997, 3, 1209. [Google Scholar] [CrossRef] [PubMed]
- Ashcroft, G.S.; Mills, S.J. Androgen Receptor-Mediated Inhibition of Cutaneous Wound Healing. J. Clin. Investig. 2002, 110, 615–624. [Google Scholar] [CrossRef] [PubMed]
- Gilliver, S.C.; Wu, F.; Ashcroft, G.S. Regulatory Roles of Androgens in Cutaneous Wound Healing. Thromb. Haemost. 2003, 90, 978–985. [Google Scholar] [CrossRef]
- Engeland, C.G.; Sabzehei, B.; Marucha, P.T. Sex Hormones and Mucosal Wound Healing. Brain Behav. Immun. 2009, 23, 629–635. [Google Scholar] [CrossRef]
- Haertel, B.; von Woedtke, T.; Weltmann, K.D.; Lindequist, U. Non-Thermal Atmospheric-Pressure Plasma Possible Application in Wound Healing. Biomol. Ther. 2014, 22, 477–490. [Google Scholar] [CrossRef]
- Sorg, H.; Tilkorn, D.J.; Hager, S.; Hauser, J.; Mirastschijski, U. Skin Wound Healing: An Update on the Current Knowledge and Concepts. Eur. Surg. Res. 2017, 58, 81–94. [Google Scholar] [CrossRef]
- Shekhter, A.B.; Serezhenkov, V.A.; Rudenko, T.G.; Pekshev, A.V.; Vanin, A.F. Beneficial Effect of Gaseous Nitric Oxide on the Healing of Skin Wounds. Nitric Oxide 2005, 12, 210–219. [Google Scholar] [CrossRef] [PubMed]
- Kulcke, A.; Holmer, A.; Wahl, P.; Siemers, F.; Wild, T.; Daeschlein, G. A Compact Hyperspectral Camera for Measurement of Perfusion Parameters in Medicine. Biomed. Tech. 2018, 63, 519–527. [Google Scholar] [CrossRef] [PubMed]
- Rutkowski, R.; Daeschlein, G.; von Woedtke, T.; Smeets, R.; Gosau, M.; Metelmann, H.R. Long-Term Risk Assessment for Medical Application of Cold Atmospheric Pressure Plasma. Diagnostics 2020, 10, 210. [Google Scholar] [CrossRef] [PubMed]
- van Welzen, A.; Hoch, M.; Wahl, P.; Weber, F.; Rode, S.; Tietze, J.K.; Boeckmann, L.; Emmert, S.; Thiem, A. The Response and Tolerability of a Novel Cold Atmospheric Plasma Wound Dressing for the Healing of Split Skin Graft Donor Sites: A Controlled Pilot Study. Skin. Pharmacol. Physiol. 2021, 34, 328–336. [Google Scholar] [CrossRef] [PubMed]
- Holmer, A.; Tetschke, F.; Marotz, J.; Malberg, H.; Markgraf, W.; Thiele, C.; Kulcke, A. Oxygenation and Perfusion Monitoring with a Hyperspectral Camera System for Chemical Based Tissue Analysis of Skin and Organs. Physiol. Meas. 2016, 37, 2064–2078. [Google Scholar] [CrossRef] [PubMed]
- Marotz, J.; Siafliakis, A.; Holmer, A.; Kulcke, A.; Siemers, F. First Results of a New Hyperspectral Camera System for Chemical Based Wound Analysis. Wound Med. 2015, 10–11, 17. [Google Scholar] [CrossRef]
- Grambow, E.; Dau, M.; Holmer, A.; Lipp, V.; Frerich, B.; Klar, E.; Vollmar, B.; Kammerer, P.W. Hyperspectral Imaging for Monitoring of Perfusion Failure Upon Microvascular Anastomosis in the Rat Hind Limb. Microvasc. Res. 2018, 116, 64–70. [Google Scholar] [CrossRef]
- Zhang, Y.; Wang, X.; Shan, J.; Zhao, J.; Zhang, W.; Liu, L.; Wu, F. Hyperspectral Imaging Based Method for Rapid Detection of Microplastics in the Intestinal Tracts of Fish. Environ. Sci. Technol. 2019, 53, 5151–5158. [Google Scholar] [CrossRef]
- Becker, P.; Blatt, S.; Pabst, A.; Heimes, D.; Al-Nawas, B.; Kammerer, P.W.; Thiem, D.G.E. Comparison of Hyperspectral Imaging and Microvascular Doppler for Perfusion Monitoring of Free Flaps in an in Vivo Rodent Model. J. Clin. Med. 2022, 11, 4134. [Google Scholar] [CrossRef]
- Yudovsky, D.; Nouvong, A.; Pilon, L. Hyperspectral Imaging in Diabetic Foot Wound Care. J. Diabetes Sci. Technol. 2010, 4, 1099–1113. [Google Scholar] [CrossRef]
- Yang, Q.; Sun, S.; Jeffcoate, W.; Clark, D.; Musgove, A.; Game, F.; Morgan, S. Investigation of the Performance of Hyperspectral Imaging by Principal Component Analysis in the Prediction of Healing of Diabetic Foot Ulcers. J. Imaging 2018, 4, 144. [Google Scholar] [CrossRef]
- Lu, G.; Fei, B. Medical Hyperspectral Imaging: A Review. J. Biomed. Opt. 2014, 19, 010901. [Google Scholar] [CrossRef]
- Hornberger, C.; Herrmann, B.H.; Daeschlein, G.; Podewils, S.v.; Sicher, C.; Kuhn, J.; Masur, K.; Meister, M.; Wahl, P. Detecting Bacteria on Wounds with Hyperspectral Imaging in Fluorescence Mode. Curr. Dir. Biomed. Eng. 2020, 6, 264. [Google Scholar] [CrossRef]
- Beer, H.D.; Gassmann, M.G.; Munz, B.; Steiling, H.; Engelhardt, F.; Bleuel, K.; Werner, S. Expression and Function of Keratinocyte Growth Factor and Activin in Skin Morphogenesis and Cutaneous Wound Repair. J. Investig. Dermatol. Symp. Proc. 2000, 5, 34–39. [Google Scholar] [CrossRef] [PubMed]
- DeLisser, H.M.; Newman, P.J.; Albelda, S.M. Platelet Endothelial Cell Adhesion Molecule (Cd31). Curr. Top. Microbiol. Immunol. 1993, 184, 37–45. [Google Scholar] [CrossRef] [PubMed]
- Gaens, W.V.; Iseni, S.; Schmidt-Bleker, A.; Weltmann, K.D.; Reuter, S.; Bogaerts, A. Numerical Analysis of the Effect of Nitrogen and Oxygen Admixtures on the Chemistry of an Argon Plasma Jet Operating at Atmospheric Pressure. New J. Phys. 2015, 17, 033003. [Google Scholar] [CrossRef]
- Iseni, S.; Reuter, S.; Weltmann, K.D. No2 Dynamics of an Ar/Air Plasma Jet Investigated by in Situ Quantum Cascade Laser Spectroscopy at Atmospheric Pressure. J. Phys. D-Appl. Phys. 2014, 47, 075203. [Google Scholar] [CrossRef]
- Tsujii, M.; Kawano, S.; Tsuji, S.; Sawaoka, H.; Hori, M.; DuBois, R.N. Cyclooxygenase Regulates Angiogenesis Induced by Colon Cancer Cells. Cell 1998, 93, 705. [Google Scholar] [CrossRef] [PubMed]
- Kitano, T.; Yamada, H.; Kida, M.; Okada, Y.; Saika, S.; Yoshida, M. Impaired Healing of a Cutaneous Wound in an Inducible Nitric Oxide Synthase-Knockout Mouse. Dermatol. Res. Pract. 2017, 2017, 2184040. [Google Scholar] [CrossRef]
- Zhao, J.; Chen, L.; Shu, B.; Tang, J.; Zhang, L.; Xie, J.; Qi, S.; Xu, Y. Granulocyte/Macrophage Colony-Stimulating Factor Influences Angiogenesis by Regulating the Coordinated Expression of Vegf and the Ang/Tie System. PLoS ONE 2014, 9, e92691. [Google Scholar] [CrossRef]
- Liu, X.L.; Hu, X.; Cai, W.X.; Lu, W.W.; Zheng, L.W. Effect of Granulocyte-Colony Stimulating Factor on Endothelial Cells and Osteoblasts. Biomed. Res. Int. 2016, 2016, 8485721. [Google Scholar] [CrossRef] [PubMed]
- Eubank, T.D.; Galloway, M.; Montague, C.M.; Waldman, W.J.; Marsh, C.B. M-Csf Induces Vascular Endothelial Growth Factor Production and Angiogenic Activity from Human Monocytes. J. Immunol. 2003, 171, 2637–2643. [Google Scholar] [CrossRef] [PubMed]
- Lotfi, N.; Thome, R.; Rezaei, N.; Zhang, G.X.; Rezaei, A.; Rostami, A.; Esmaeil, N. Roles of Gm-Csf in the Pathogenesis of Autoimmune Diseases: An Update. Front. Immunol. 2019, 10, 1265. [Google Scholar] [CrossRef] [PubMed]
- Krubasik, D.; Eisenach, P.A.; Kunz-Schughart, L.A.; Murphy, G.; English, W.R. Granulocyte-Macrophage Colony Stimulating Factor Induces Endothelial Capillary Formation through Induction of Membrane-Type 1 Matrix Metalloproteinase Expression in Vitro. Int. J. Cancer 2008, 122, 1261–1272. [Google Scholar] [CrossRef] [PubMed]
- Lazarus, H.M.; Pitts, K.; Wang, T.; Lee, E.; Buchbinder, E.; Dougan, M.; Armstrong, D.G.; Paine, R., 3rd; Ragsdale, C.E.; Boyd, T.; et al. Recombinant Gm-Csf for Diseases of Gm-Csf Insufficiency: Correcting Dysfunctional Mononuclear Phagocyte Disorders. Front. Immunol. 2022, 13, 1069444. [Google Scholar] [CrossRef] [PubMed]
- Aase, K.; Ernkvist, M.; Ebarasi, L.; Jakobsson, L.; Majumdar, A.; Yi, C.; Birot, O.; Ming, Y.; Kvanta, A.; Edholm, D.; et al. Angiomotin Regulates Endothelial Cell Migration During Embryonic Angiogenesis. Genes. Dev. 2007, 21, 2055–2068. [Google Scholar] [CrossRef] [PubMed]
- Shibuya, M. Vascular Endothelial Growth Factor (Vegf) and Its Receptor (Vegfr) Signaling in Angiogenesis: A Crucial Target for Anti- and Pro-Angiogenic Therapies. Genes. Cancer 2011, 2, 1097–1105. [Google Scholar] [CrossRef]
- Zheng, Y.; Vertuani, S.; Nystrom, S.; Audebert, S.; Meijer, I.; Tegnebratt, T.; Borg, J.P.; Uhlen, P.; Majumdar, A.; Holmgren, L. Angiomotin-Like Protein 1 Controls Endothelial Polarity and Junction Stability During Sprouting Angiogenesis. Circ. Res. 2009, 105, 260–270. [Google Scholar] [CrossRef]
- Matsumoto, H.; Fukui, E.; Yoshizawa, M.; Sato, E.; Daikoku, T. Differential Expression of the Motin Family in the Peri-Implantation Mouse Uterus and Their Hormonal Regulation. J. Reprod. Dev. 2012, 58, 649–653. [Google Scholar] [CrossRef]
- Jahn, L.; Fouquet, B.; Rohe, K.; Franke, W.W. Cytokeratins in Certain Endothelial and Smooth Muscle Cells of Two Taxonomically Distant Vertebrate Species, Xenopus Laevis and Man. Differentiation 1987, 36, 234–254. [Google Scholar] [CrossRef]
- Kotini, M.P.; van der Stoel, M.M.; Yin, J.; Han, M.K.; Kirchmaier, B.; de Rooij, J.; Affolter, M.; Huveneers, S.; Belting, H.G. Vinculin Controls Endothelial Cell Junction Dynamics During Vascular Lumen Formation. Cell Rep. 2022, 39, 110658. [Google Scholar] [CrossRef]
- Carvalho, J.R.; Fortunato, I.C.; Fonseca, C.G.; Pezzarossa, A.; Barbacena, P.; Dominguez-Cejudo, M.A.; Vasconcelos, F.F.; Santos, N.C.; Carvalho, F.A.; Franco, C.A. Non-Canonical Wnt Signaling Regulates Junctional Mechanocoupling During Angiogenic Collective Cell Migration. Elife 2019, 8, e45853. [Google Scholar] [CrossRef]
- van der Stoel, M.M.; Kotini, M.P.; Schoon, R.M.; Affolter, M.; Belting, H.G.; Huveneers, S. Vinculin Strengthens the Endothelial Barrier During Vascular Development. Vasc. Biol. 2023, 5, e220012. [Google Scholar] [CrossRef]
- Lamorte, S.; Ferrero, S.; Aschero, S.; Monitillo, L.; Bussolati, B.; Omede, P.; Ladetto, M.; Camussi, G. Syndecan-1 Promotes the Angiogenic Phenotype of Multiple Myeloma Endothelial Cells. Leukemia 2012, 26, 1081–1090. [Google Scholar] [CrossRef]
- Elenius, V.; Gotte, M.; Reizes, O.; Elenius, K.; Bernfield, M. Inhibition by the Soluble Syndecan-1 Ectodomains Delays Wound Repair in Mice Overexpressing Syndecan-1. J. Biol. Chem. 2004, 279, 41928–41935. [Google Scholar] [CrossRef]
- Morgan, M.R.; Humphries, M.J.; Bass, M.D. Synergistic Control of Cell Adhesion by Integrins and Syndecans. Nat. Rev. Mol. Cell Biol. 2007, 8, 957–969. [Google Scholar] [CrossRef]
- Elfenbein, A.; Simons, M. Syndecan-4 Signaling at a Glance. J. Cell Sci. 2013, 126, 3799–3804. [Google Scholar] [CrossRef]
- Afratis, N.A.; Nikitovic, D.; Multhaupt, H.A.; Theocharis, A.D.; Couchman, J.R.; Karamanos, N.K. Syndecans-Key Regulators of Cell Signaling and Biological Functions. FEBS J. 2017, 284, 27–41. [Google Scholar] [CrossRef]
- Jang, B.; Kim, A.; Hwang, J.; Song, H.K.; Kim, Y.; Oh, E.S. Emerging Role of Syndecans in Extracellular Matrix Remodeling in Cancer. J. Histochem. Cytochem. 2020, 68, 863–870. [Google Scholar] [CrossRef]
- Bode, L.; Salvestrini, C.; Park, P.W.; Li, J.P.; Esko, J.D.; Yamaguchi, Y.; Murch, S.; Freeze, H.H. Heparan Sulfate and Syndecan-1 Are Essential in Maintaining Murine and Human Intestinal Epithelial Barrier Function. J. Clin. Investig. 2008, 118, 229–238. [Google Scholar] [CrossRef]
- Alexopoulou, A.N.; Multhaupt, H.A.; Couchman, J.R. Syndecans in Wound Healing, Inflammation and Vascular Biology. Int. J. Biochem. Cell Biol. 2007, 39, 505–528. [Google Scholar] [CrossRef] [PubMed]
- Cabral-Pacheco, G.A.; Garza-Veloz, I.; Castruita-De la Rosa, C.; Ramirez-Acuna, J.M.; Perez-Romero, B.A.; Guerrero-Rodriguez, J.F.; Martinez-Avila, N.; Martinez-Fierro, M.L. The Roles of Matrix Metalloproteinases and Their Inhibitors in Human Diseases. Int. J. Mol. Sci. 2020, 21, 9739. [Google Scholar] [CrossRef] [PubMed]
- Mott, J.D.; Werb, Z. Regulation of Matrix Biology by Matrix Metalloproteinases. Curr. Opin. Cell Biol. 2004, 16, 558–564. [Google Scholar] [CrossRef] [PubMed]
- Nagase, H.; Visse, R.; Murphy, G. Structure and Function of Matrix Metalloproteinases and Timps. Cardiovasc. Res. 2006, 69, 562–573. [Google Scholar] [CrossRef]
- Gialeli, C.; Theocharis, A.D.; Karamanos, N.K. Roles of Matrix Metalloproteinases in Cancer Progression and Their Pharmacological Targeting. FEBS J. 2011, 278, 16. [Google Scholar] [CrossRef]

Disclaimer/Publisher’s Note: The statements, opinions and data contained in all publications are solely those of the individual author(s) and contributor(s) and not of MDPI and/or the editor(s). MDPI and/or the editor(s) disclaim responsibility for any injury to people or property resulting from any ideas, methods, instructions or products referred to in the content. |
© 2024 by the authors. Licensee MDPI, Basel, Switzerland. This article is an open access article distributed under the terms and conditions of the Creative Commons Attribution (CC BY) license (https://creativecommons.org/licenses/by/4.0/).
Share and Cite
Schmidt, A.; Singer, D.; Aden, H.; von Woedtke, T.; Bekeschus, S. Gas Plasma Exposure Alters Microcirculation and Inflammation during Wound Healing in a Diabetic Mouse Model. Antioxidants 2024, 13, 68. https://doi.org/10.3390/antiox13010068
Schmidt A, Singer D, Aden H, von Woedtke T, Bekeschus S. Gas Plasma Exposure Alters Microcirculation and Inflammation during Wound Healing in a Diabetic Mouse Model. Antioxidants. 2024; 13(1):68. https://doi.org/10.3390/antiox13010068
Chicago/Turabian StyleSchmidt, Anke, Debora Singer, Henrike Aden, Thomas von Woedtke, and Sander Bekeschus. 2024. "Gas Plasma Exposure Alters Microcirculation and Inflammation during Wound Healing in a Diabetic Mouse Model" Antioxidants 13, no. 1: 68. https://doi.org/10.3390/antiox13010068
APA StyleSchmidt, A., Singer, D., Aden, H., von Woedtke, T., & Bekeschus, S. (2024). Gas Plasma Exposure Alters Microcirculation and Inflammation during Wound Healing in a Diabetic Mouse Model. Antioxidants, 13(1), 68. https://doi.org/10.3390/antiox13010068