Abstract
We aim to develop a theoretical methodology for the accurate aqueous pKa prediction of structurally complex phenolic antioxidants and cannabinoids. In this study, five functionals (M06-2X, B3LYP, BHandHLYP, PBE0, and TPSS) and two solvent models (SMD and PCM) were combined with the 6-311++G(d,p) basis set to predict pKa values for twenty structurally simple phenols. None of the direct calculations produced good results. However, the correlations between the calculated Gibbs energy difference of each acid and its conjugate base, , and the experimental aqueous pKa values had superior predictive accuracy, which was also tested relative to an independent set of ten molecules of which six were structurally complex phenols. New correlations were built with twenty-seven phenols (including the phenols with experimental pKa values from the test set), which were used to make predictions. The best correlation equations used the PCM method and produced mean absolute errors of 0.26–0.27 pKa units and R2 values of 0.957–0.960. The average range of predictions for the potential antioxidants (cannabinoids) was 0.15 (0.25) pKa units, which indicates good agreement between our methodologies. The new correlation equations could be used to make pKa predictions for other phenols in water and potentially in other solvents where they might be more soluble.
Keywords:
acid dissociation constant; pKa; phenols; predictions; antioxidants; cannabinoids; DFT; SMD; PCM 1. Introduction
Acid dissociation constants (Ka, pKa = −log Ka) are crucial physico-chemical quantities that impact chemical, environmental, and biochemical research [1,2,3,4,5,6]. Biochemical kinetic and thermodynamic studies involving acids require the calculation of molar fractions or Gibbs free energies of reaction at physiological pH for which aqueous pKa values are necessary [7,8,9,10,11]. Accurate predictions of aqueous pKa values can also be used to predict pKa values in non-aqueous environments [12]. The quest for determining reliable aqueous pKa values for complex phenolic compounds, including cannabinoids, has been motivated by our antioxidant studies on this family of compounds.
Choosing the best methods for obtaining reliable experimental pKa values can be challenging (due to low solubility, difficulty isolating, high reactivity, and variable ionic strength solutions) and time consuming [13,14,15]. Hence, theoretical calculations are a promising alternative. A traditional methodology uses thermodynamic cycles [14,15,16,17,18,19], which combine experimental or calculated ab initio gas phase Gibbs free energies with calculated solution Gibbs free energies. Another approach uses the dissociation equilibrium, HA(aq) ⇌ A−(aq) + H+(aq), and requires experimental data for H+, which is quite variable [14,15,20,21]. Other acid-base equilibria can be applied as well, relative to a reference acid whose experimental pKa is required [22,23]. Alternatively, various linear correlations between calculated properties (in the gas phase or in solution) and experimental pKa values have shown to have important predictive value [24,25,26,27,28]. The application of density functional theory methods combined with continuum solvation methods such as SMD (solvent model based on density) or PCM (polarizable continuum model) is a practical approach for estimating properties in solution. However, in some cases explicit solute molecules are required in addition to the continuum, especially around charged species, to achieve good results [29,30,31].
Phenolic molecules are ubiquitous in the human body, as well as in nature [32]. Examples of endogenous phenolic molecules that play a crucial role are the neurotransmitters serotonin and dopamine and the thyroid hormones and estradiol [33,34]. Other phenolic natural products have made it into the modern-day pharmacopeia: aspirin is sourced from the bark of the willow tree [35], and morphine is an alkaloid present in the opium poppy [36]. Other classes of phenolic molecules include cannabinoids, flavonoids, catechins, and polyphenols, which have shown promising pharmacological properties, including antioxidant activity [32,37].
Previous theoretical studies have focused on the aqueous pKa determination of phenols [23,31,38]. Thapa and Schlegel’s best results include three explicit water molecules surrounding the –OH and –O– groups in the acids and conjugate bases, respectively (HA∙3H2O(aq) ⇌ A−∙3H2O(aq) + H+(aq)), while working at the B3LYP(SMD)/6-311++G(d,p) level of theory [31]. They achieved mean absolute (MAE) and signed errors (MSE) of 0.45 and −0.02 pKa units, respectively. It is important to note that the set of twenty-five phenols they considered (with pKa values ranging from 7.66 to 10.30) does not include nitrophenols nor 2-substituted phenols, which are compounds we are interested in studying. An earlier study by Galano’s group in 2011 focused on four large phenolic derivatives (acetaminophen, profadol, tapentadol, and ketobemidone) and explored calculations using twenty-two reaction schemes and nine functionals combined with the PCM solvation method (applied through single-point energy calculations) with up to seven explicit solvent molecules [23]. They recommended the reaction scheme HA + OH− (3H2O) ⇌ A− (H2O) + 3H2O, and their best results were obtained with the PBE0 (MAE = 0.77), TPSS (MAE = 0.82), BHandHLYP (MAE = 0.82), and B3LYP (MAE = 0.86) functionals, using the Gaussian03’s PCM implementation in single-point calculations. In the absence of experimental values, calculations were tested relative to theoretical predictions made with the ACD/Laboratories Software [39]. In a newer publication, that came to our attention after our calculations had finished, Galano et al. reported an extensive study (also considering carboxylic acids and amines) that applied 74 levels of theory (all with the SMD solvation model) to a set of twenty simple phenols covering a pKa range from 6.33 to 10.31. Their recommended predictive approach requires the Gibbs energy difference between an acid and its conjugate base and can produce MAE less than 0.35 pKa units for 98.6% of the ten simple phenols they tested [38]. The correlation equations reported, which they have applied in several studies [40,41], are yet to be evaluated with phenols that are more complex for which experimental data exist. We will be referring to the results obtained by these studies and will test their predictive capabilities alongside our work.
We have selected twenty simple phenols ((1–20), displayed in Figure 1) containing a variety of functional groups with experimental aqueous pKa values in the range from 4.07 to 10.62 [42,43,44], with the objective to develop a methodology for the accurate pKa determination of more complex phenols including cannabinoids. Five functionals, two solvation methods, and three acid-base dissociation equilibria will help us test the accuracy of the direct aqueous pKa calculations. Various correlations to experimental data will also be considered.
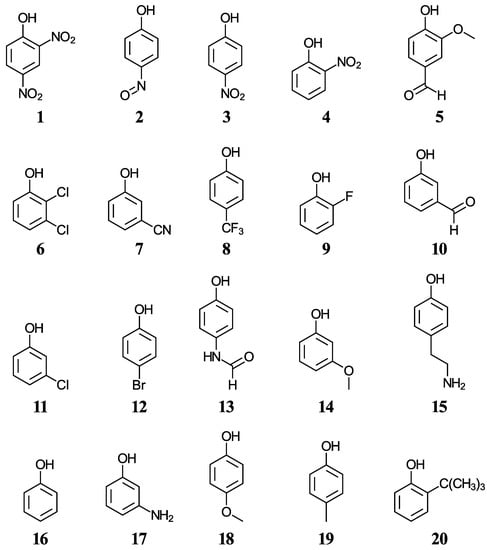
Figure 1.
Structures and numeric labels used to identify the phenols in the training set.
Another group of ten phenols ((21–30), displayed in Figure 2) is used as an independent test set to compare our predictions to previously reported experimental or theoretical aqueous pKa values. This test group includes six complex phenols. The best methodologies are later used to predict the aqueous pKa values of complex phenols with potential antioxidant properties that are currently under study by our group [45,46,47]. This group of compounds ((31–42), shown in Figure 3) includes food additives (31 and 32) [48], vitamin E analogues (33–37) which have a methyl group in place of the phytyl tail (C16H33) due to the tail’s small impact on local properties such as acidity [49], aminophenols (38–40) used in cosmetics, dyes, and photographic developers [50,51], and stilbenes related to resveratrol (41 and 42) [49].
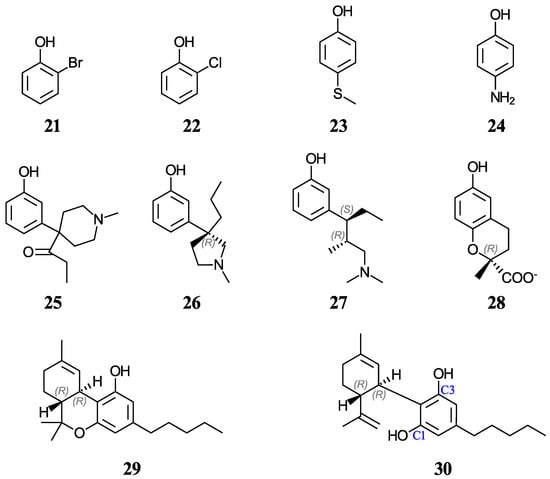
Figure 2.
Structures and numeric labels used to identify the phenols in the test set.
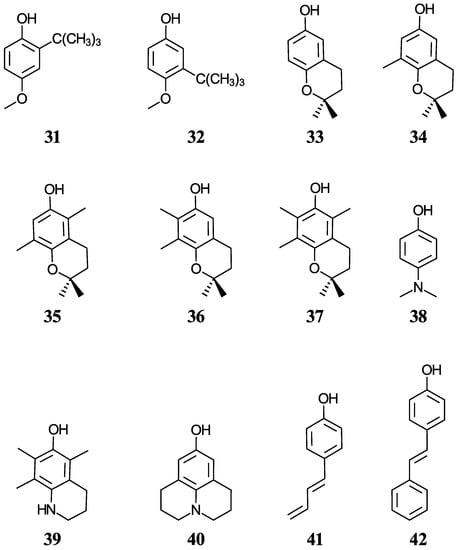
Figure 3.
Structures and numeric labels used to identify the phenolic antioxidants studied.
Furthermore, aqueous pKa predictions will also be made for of a set of nine cannabinoids displayed in Figure 4. Cannabinoids are phytochemicals found in the Cannabis plant [52]; nevertheless, this term is also used for any substance which interacts with the endocannabinoid system, including drugs that bear no resemblance to plant-derived cannabinoids [53]. Given the current pharmacological interest, inherent legalities, and little data available for cannabinoids, we thought that it would be appropriate to investigate these molecules that also have a phenol ring in their basic structure. Increasing evidence indicates that certain cannabinoids are effective antioxidants, in addition to their therapeutic uses [54,55,56,57,58,59]. For this study, we have chosen eight phytocannabinoids (29, 30, 43–45, and 48–50), which are important components in the Cannabis sativa plant, and two synthetic cannabinoids (46 and 47), all of which are being investigated for potential therapeutic uses. The test set includes ∆9-tetrahydrocannabinol (∆9-THC, 29) and cannabidiol (CBD, 30), which have an experimental and a predicted aqueous pKa value reported, respectively. For molecules with stereocenters, labels have been added to identify the stereoisomer used in each case (see Figure 2 and Figure 4), although the calculated pKa is not affected by this.
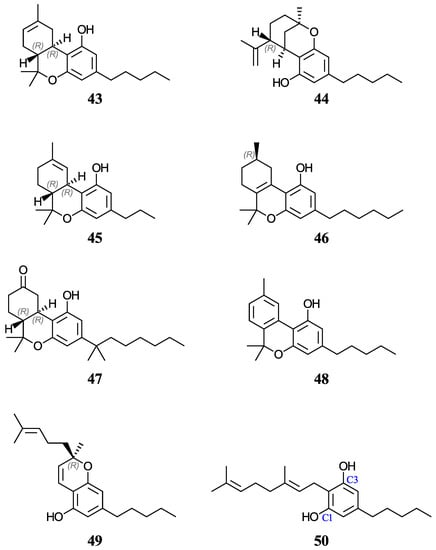
Figure 4.
Structures and numeric labels used to identify the cannabinoids studied.
2. Computational Methodology
Calculations were performed with the Gaussian16 software package [60]. Five DFT functionals were applied with the 6-311++G(d,p) basis set: M06-2X, B3LYP, BHandHLYP, PBE0, and TPSSTPSS (referred to as TPSS). These functionals were chosen based on their performance in previous pKa studies of phenols [23,31,38]. The aqueous environment was modelled by two widely used continuum methods, the Integral Equation Formalism Polarizable Continuum Model [61,62,63,64] (IEFPCM, with the solute cavities built by the united atom for Hartree–Fock model; radii = UAHF) [65] and the Solvation Model based on Density (SMD) [66]. The default implementation of IEFPCM (referred to as PCM) in Gaussian16, unlike SMD, neglects explicit non-electrostatic energy contribution terms (e.g., cavity formation, dispersion, and repulsion terms).
Geometry optimizations were followed by a frequency calculation, both including solvent effects, at the same level of theory to determine the nature of the stationary points, and all structures were confirmed to be local minima in which no imaginary frequencies were present. Given that the conformation used for an acid and its conjugate base can greatly affect the calculated pKa value [67], every effort was made to ensure the most stable conformer was optimized in each case. For example, in 2-substituted halogen groups (molecules 6, 9, 21, and 22), SMD typically favoured the OH facing the halogen while PCM favoured the opposite case. Additionally, the pKa of the (amino) protonated form of molecules 15, 17, and 24–27 was computed to assess the possibility of concurrent microequilibria, of which none were considered significant. The optimized structures of all the species considered in this study at the M06-2X(SMD)/6-311++G(d,p) level of theory are provided in the Supporting Information. The absolute aqueous Gibbs free energies of the different species considered in this study at the various levels of theory at 298.15 K are reported in Tables S1–S5 of the Supporting Information.
This study explores three aqueous acid-base dissociation equilibria (Reactions (R1)–(R3), shown below as (R1)–(R3)) for calculating the absolute pKa value of an acid, HA, whose conjugate base is A−. Reactions (R1) and (R3) are standard ones used in theoretical pKa determinations and, together with Reaction (R2), have produced reasonable results for phenolic molecules [23].
Reaction (R1) requires an experimental aqueous Gibbs free energy value for H+ to be combined with the calculated aqueous values of HA and A−. Even though several values have been reported and used in calculations, we have chosen to work with −270.29 kcal/mol [20,23,30,31,38], because it has been corrected for the 1 M reference state and it has sometimes led to a good reproducibility of experimental aqueous pKa values.
Reaction (R2) includes explicit water molecules solvating the anions, which attempts to simulate the solute–solvent interactions that are not fully modelled in the implicit solvation models used. Hydrogen bonding between a water molecule and the conjugate base in A− (H2O) can significantly stabilize the charged species. The species OH− (3H2O) is the OH− ion solvated by three water molecules, while the species indicated as 3H2O is a water cluster of three molecules. The concentration of water used is 55.55 mol/L [23].
Reaction (R3) involves a reference acid similar in structure to the acid studied for which a reliable pKa value is available. For all molecules except phenol, phenol was used as the reference acid (experimental pKa = 9.99). For the determination of phenol, 3-methoxyphenol was used as the reference acid (experimental pKa = 9.65).
The uneven distribution of charges across the equilibrium of Reaction (R1) makes this approach more prone to errors. Reactions (R2) and (R3) do not encounter this difficulty since both sides of their equilibria are balanced in terms of charges, thus contributing to better results due to the cancellation of errors. Reactions (R1)–(R3) contain the same number of computed reactant and product species; thus, reference state conversions are not needed.
Molecules 30 and 50 both contain two equivalent deprotonation sites through rotation of the sigma bond connecting the benzene ring to its substituent. As a result, the acid equilibrium constant should be doubled [68]. Accordingly, pKa values for molecules 30 and 50 must be corrected by subtracting log(2) from their respective calculated values using Reactions (R1)–(R3) or the correlation equations [38]. The deprotonation of both sites was tested, and the most stable conformer was used in each case.
3. Results and Discussion
3.1. Exploring Several Methodologies for the Direct Calculation of pKa Values
Eleven phenols of varying structural complexities are used to initially test the aqueous pKa calculations using five functionals, two solvation models, and three acid–base equilibria. The training set is then increased to twenty phenols (see Figure 1) for all functionals other than PBE0 because of significant technical issues. Mean absolute errors (MAEs), used to assess prediction quality, have been compiled in Table 1. The direct calculation results using the SMD solvation method are always much better than the corresponding results using PCM in each case considered, except when using the M06-2X and TPSS functionals with Reaction (R2). While there are differences between the results obtained with the different functionals using each reaction scheme, the reaction scheme used is much more impactful on the overall accuracy of the methodology applied, and that is how we have organized the discussion that follows.

Table 1.
Summary of mean absolute pKa errors (MAE) for the phenols in the training set (obtained from direct calculations and using the correlations between the experimental pKa values and calculated ΔG° values) at several levels of theory using Reactions (R1)–(R3) at 298.15 K.
3.1.1. Results Obtained from the Direct Application of Reactions (R1) and (R2)
The results obtained with Reactions (R1) and (R2) are not satisfactory. The calculated individual pKa values and their errors are displayed in Tables S6 and S7 (Tables S8 and S9) of the Supporting Information when using Reaction (R1) (Reaction (R2)). The MAE ranged between 3.09 and 5.24 (4.73 and 7.38) pKa units when using Reaction (R1) (Reaction (R2)) and the SMD solvation method for the set of twenty (eleven) phenols. Larger errors were usually obtained with the PCM solvation method, between 4.76 and 7.05 (4.75 and 6.83) pKa units when using Reaction (R1) (Reaction (R2)). With very few exceptions, the calculated aqueous pKa values were always overestimated (with positive errors).
It is worth mentioning that Reaction (R1) was shown to drastically improve the pKa calculations for phenolic molecules (as well as alcohols, hydroperoxides, and thiols) when three explicit water molecules are added to the HA and A− species, while using the value of −270.29 kcal/mol for the aqueous Gibbs energy of H+ after corrections [30,31]. This approach produced MAE of 0.45 pKa units for phenols at the best level of theory reported, B3LYP(SMD)/6-311++G(d,p) [31]. The M06-2X errors were still significantly large using this approach with mean signed errors of −1.40 pKa units.
Reaction (R2), using the Gaussian03 implementation of PCM through single-point energy calculations, was reported to produce much smaller MAE values which were generally in the 0.77–0.86 pKa unit range using similar functionals [23]. Our approach, including PCM as implemented in Gaussian16 in both geometry optimizations and frequency calculations, leads to much larger errors for direct pKa predictions. Given the results obtained for eleven phenols using Reaction (R2), which requires the additional calculation of the explicitly solvated conjugate base, we decided not to take it into account any further.
3.1.2. Results Obtained from the Direct Application of Reaction (R3)
The best direct calculation results are obtained using Reaction (R3), and M06-2X was the best-performing functional with both solvation models. The calculated individual pKa values and their errors are displayed in Table 2 and Table S10, respectively. Table 2 also displays the experimental values used. The best predictive methodologies are expected to have the lowest MAEs and mean signed errors (MSEs, taking their sign into account). When considering the training set of twenty phenols, MAEs between 1.34 and 1.61 (between 1.99 and 2.28) pKa units are obtained when using SMD (PCM).
Table 2.
Experimental aqueous pKa values [49,50,51] and calculated errors (MAE and MSE) at several levels of theory using Reaction (R3) (HRef = phenol) for direct calculations at 298.15 a,b.
In general, direct calculations with Reaction (R3) led to underestimated (overestimated) pKa values for compounds more (less) acidic than phenol. The more acidic the phenol, the larger and more negative the error in these calculations. The calculated pKa values for the three nitrophenols and nitrosophenol, compounds 1–4, have the largest MAEs (e.g., between −3.36 and −5.02 pKa units with M06-2X(SMD)). These results indicate that the direct methodology tested is insufficient to predict nitrophenols.
When the calculated pKa values of compounds 1–4 are excluded, the MAEs become significantly reduced with values between 0.50 and 0.94 with SMD (between 0.90 and 1.38 with PCM), and MSE between −0.09 and −0.41 (−0.61 and −0.88) when using SMD (PCM). The PBE0 functional seems to produce the best results, even though only eleven of the twenty phenols were calculated because of significant technical issues when applying this functional, with MAEs and MSEs of 0.50 and −0.09 (0.90 and −0.61), respectively, with SMD (PCM). Ignoring the incomplete PBE0 results, BHandHLYP(SMD) produces the best results with an MAE and MSE of 0.74 and −0.23, respectively, followed by M06-2X(SMD) with an MAE of 0.78 and MSE of −0.33. Searching for smaller MAE values in the calculated aqueous pKa values of phenols, various correlations between the calculated values and the experimental aqueous pKa values are investigated.
3.2. Exploring Various Correlations with Experimental pKa Values and the Training Set
Correlations between calculated properties (descriptors), including values related to the acid dissociation equilibrium, and experimental aqueous pKa values have been previously reported [12,24,25,26,27,28,38,69,70]. When a correlation has a significantly large R2 value and the MAE is very small, the fitted equation can be directly used to predict new aqueous pKa values of similar compounds.
Correlations between the experimental aqueous pKa values and the calculated for Reactions (R1)–(R3) produced very high R2 values (>0.90) in all but one case and much smaller and more consistent MAEs when the corresponding correlation equation is used at a given level of theory (see Table 1). Ignoring the results for Reaction (R2) and the PBE0 functional (which only considers eleven phenols in the training set and leads to slightly larger MAEs in most cases), MAEs between 0.22 and 0.27 (0.28 and 0.40) are obtained with SMD (PCM), which is an excellent result since a pKa error of 0.50 units corresponds to a 0.68 kcal/mol error in the calculated .
Given that when calculating for Reactions (R1) and (R3) the only variables are °(A−) and °(HA), we decided to directly focus the correlation between the experimental aqueous pKa values and their difference, . The calculated pKa values and their errors for each of the twenty phenols in the training set, relative to the corresponding correlation equation, are displayed in Table 3 and Table S11, respectively, for the various levels of theory considered (only eleven phenols were calculated with the PBE0 functional). The MAEs for these correlations are shown in Table 1, and the associated correlation equations and R2 values are listed in Table 4.
Table 3.
Errors in the calculated aqueous pKa values (displayed in Table S11) after using the corresponding pKa (exp) vs. correlation equation at 298.15 K a,b,c,d.
The correlations using the SMD solvation model have lower MAEs and better R2 values than the equivalent correlations using PCM, which is the same trend seen from the direct calculations previously discussed (see Table 4). The MAE values between 0.22 and 0.27 (0.28 and 0.40) and the R2 values between 0.947 and 0.975 (0.898 and 0.946) when using SMD (PCM) are excellent results. M06-2X(SMD) produced the most promising results with an MAE of 0.22 (and R2 = 0.975); likewise, this functional also produced the best results using PCM with an MAE of 0.28 (and R2 = 0.946).
It is important to note that when using these correlations (see Table 3), the calculated errors for the nitrophenols (1,3,4) and the nitrosophenol (2), which were very large when considering direct pKa calculations, are very small, in agreement with the calculated errors for the other compounds. This indicates that our correlations correctly adjust for the previously underestimated pKa predictions. Another observation is that the molecules with intramolecular hydrogen bonding affecting the most stable conformation of the acid form (1,4,5) tend to have a slightly higher error, as seen in Figure 5. We suspect that the additional stabilization in the acidic form may lead to an underestimated pKa prediction.
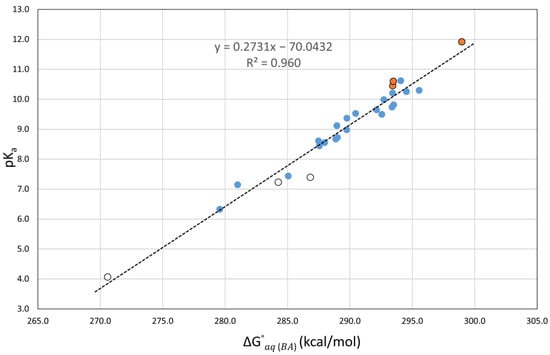
Figure 5.
Plot of the experimental aqueous pKa values versus the calculated at the M06-2X(PCM)/6-311++G(d,p) level of theory for 27 phenolic molecules.
Correlations between the experimental aqueous pKa values and were reported for simple phenols by Galano et al. at several levels of theory using only the SMD solvation method [38]. Their training set of twenty simple phenols covered the experimental pKa range from 6.33 to 10.31. Using their reported correlation equations, we calculated slightly larger MAE (from 0.21 to 0.46) for the compounds in our training set (see Table 1). Apart from the fact that our correlation was built from these data, this difference is possibly due to the larger number of molecules more acidic than phenol in our training set, compared to theirs.
3.3. Predicting Aqueous pKa Values of Complex Phenols
A significant number of phenolic molecules that we are interested in studying (see Figure 2, Figure 3 and Figure 4) are of greater structural complexity than the twenty molecules included in our training set. Hence, it is essential to test the performance of our correlation equations with more complex phenols. This is a largely underexplored area, partly because most complex phenols lack experimental aqueous pKa values and no previous theoretical studies have verified the quality of aqueous pKa predictions for complex phenols using reliable experimental data.
3.3.1. Checking the Predictions with a Test Set
To check the accuracy of our correlations from the training set of twenty simple phenols, we collected ten phenolic molecules of varying complexity (displayed in Figure 2). Seven of them have experimental aqueous pKa values reported (21–24 and 27–29) [42,71,72], and three other ones (25, 26, and 30) only have predicted values; 25 and 26 were predicted by the ACD/Laboratories Software [39], and 30 has a minimum experimental aqueous pKa value reported [73]. However, the same experimental methodology approximated the pKa of 29 within 0.1 pKa units [73]. While phenols 21–24 are simple, phenols 25–30 are of significant structural complexity, and 27–29 have experimental pKa values reported. Hence, for the first time to our knowledge, we will be assessing aqueous pKa predictions of complex phenols using correlations involving the experimental values of simpler ones.
Table 4.
Details of the correlation equations obtained for the initial training set of 20 phenols and for the final training set of 27 phenols a,b.
Table 4.
Details of the correlation equations obtained for the initial training set of 20 phenols and for the final training set of 27 phenols a,b.
| Fitted Equation | ||||
|---|---|---|---|---|
| Level of Theory | m | n | R2 | MAE |
| Set of 20 phenols | ||||
| M06-2X(SMD) | 0.3533 | −92.4756 | 0.975 | 0.22 |
| B3LYP(SMD) | 0.3266 | −84.9381 | 0.958 | 0.24 |
| BHandHLYP(SMD) | 0.3305 | −86.9380 | 0.963 | 0.25 |
| PBE0(SMD) d | 0.3761 | −99.8596 | 0.969 | 0.22 |
| TPSS(SMD) | 0.3315 | −86.3857 | 0.947 | 0.27 |
| M06-2X(PCM) | 0.2988 | −77.5916 | 0.946 | 0.28 |
| B3LYP(PCM) | 0.2751 | −70.7109 | 0.916 | 0.34 |
| BHandHLYP(PCM) | 0.2847 | −74.4297 | 0.938 | 0.30 |
| PBE0(PCM) d | 0.3328 | −88.0977 | 0.935 | 0.36 |
| TPSS(PCM) | 0.2789 | −71.8317 | 0.898 | 0.40 |
| Set of 27 phenols c | ||||
| M06-2X(SMD) | 0.3244 | −84.1492 | 0.953 | 0.27 |
| B3LYP(SMD) | 0.3071 | −79.2803 | 0.955 | 0.26 |
| BHandHLYP(SMD) | 0.3039 | −79.2127 | 0.950 | 0.27 |
| TPSS(SMD) | 0.3104 | −80.2526 | 0.959 | 0.27 |
| M06-2X(PCM) | 0.2731 | −70.0432 | 0.960 | 0.26 |
| B3LYP(PCM) | 0.2522 | −63.9968 | 0.956 | 0.27 |
| BHandHLYP(PCM) | 0.2581 | −66.5540 | 0.957 | 0.26 |
| TPSS(PCM) | 0.2489 | −62.9995 | 0.938 | 0.32 |
a , new pKa values should be calculated as pKa (calc) = ; b Using the 6-311++G(d,p) basis set; c The 7 phenols of the test set (which includes 3 large phenols) with experimental pKa values (see Table 5) have been added to the initial set of 20 phenols; d Calculated using 11 phenols.
Using the correlation equations (reported in Table 4) for the training set of twenty phenols employing the functionals M06-2X, B3LYP, BHandHLYP, and TPSS (with both the SMD and PCM solvation methods), the aqueous pKa values of the training set are calculated. Experimental pKa values and errors in their prediction, with MAE and MSE values, are shown in Table 5, while the calculated pKa values are reported in Table S12. MAE and MSE values are reported for the seven phenols with experimental data and for the entire set (including predicted values). Predictions using the correlation equations of Galano et al. [38] and employing the method suggested by Thapa and Schlegel [31] are also reported for comparison.
Unlike the trends seen in the MAE and MSE values previously reported (see, for example, Table 2 and Table 3), the correlations using SMD usually exhibit larger errors in the predicted pKa values of the test set than when using PCM. The lowest MAE of 0.24 using the whole test set is achieved with M06-2X(PCM); however, when only experimental pKa values are used, the lowest MAE of 0.23 is produced by B3LYP(PCM). The MSE values are very similar between both solvation models and indicate that our correlations slightly underestimate the test set’s pKa values.
Comparing our SMD results with Ref. [38], our values almost always produce smaller MAEs and MSEs. To compare with the predictive ability of the method reported in Ref. [31], a few molecules in our test set were selected (24, 28, and 29). In all cases (except for (R)-Trolox using B3LYP(SMD) and TPSS(SMD)), our correlations produce more accurate values. Moreover, the method reported in Ref. [31] is incompatible with 2-chlorophenol (and in general, with 2-substituted phenols) since the water molecules would not equilibrate around the -OH group in the acid species. Given that the pKa values of nitrophenols are difficult to predict directly, we included 2-nitrophenol in Table 5 (experimental pKa = 7.23) [42]. The pKa predictions of 6.13 and 3.92 by Refs. [31,38], respectively, had much larger errors than when using our M06-2X(PCM) correlation (7.34, see Table S12).
Table 5.
Predicted pKa errors and experimental pKa values for the phenols in the test set (21–30) using the corresponding pKa (exp) vs. correlation equation listed in Table 4 (obtained from a training set of 20 phenols) at several levels of theory at 298.15 K a.
Table 5.
Predicted pKa errors and experimental pKa values for the phenols in the test set (21–30) using the corresponding pKa (exp) vs. correlation equation listed in Table 4 (obtained from a training set of 20 phenols) at several levels of theory at 298.15 K a.
| Solvation Method | SMD | PCM | Exp f | Other Predictions | |||||||
|---|---|---|---|---|---|---|---|---|---|---|---|
| Name/Functional | M06-2X | B3LYP | BHandHLYP | TPSS | M06-2X | B3LYP | BHandHLYP | TPSS | Ref. [38] g | Ref. [31] h | |
| (21) 2-bromophenol | 0.49 | 0.56 | 0.58 | 0.48 | −0.12 | 0.06 | −0.04 | 0.08 | 8.45 i | 0.49 | |
| (22) 2-chlorophenol | −0.14 | −0.06 | −0.09 | −0.11 | −0.11 | 0.00 | −0.07 | −0.69 | 8.56 i | −0.10 | |
| (23) 4-(methylthio)phenol | −0.13 | −0.14 | −0.01 | 0.27 | −0.34 | −0.34 | −0.35 | −0.97 | 9.53 i | −0.19 | |
| (24) 4-aminophenol | 0.35 | 0.33 | 0.33 | 0.30 | 0.42 | 0.39 | 0.46 | 0.41 | 10.30 i | 0.17 | 0.43 l |
| (25) ketobemidone | −0.17 | 0.16 | −0.07 | 0.12 | −0.02 | 0.98 | 1.12 | 0.96 | [9.96] m | −0.26 | |
| (26) profadol | −0.24 | −0.19 | −0.26 | −0.22 | −0.05 | 0.00 | 0.04 | −0.01 | [10.27] m | −0.36 | |
| (27) tapentadol | −0.36 | −0.29 | −0.32 | −0.31 | −0.36 | −0.37 | −0.35 | −0.33 | 10.45 n, [10.09] m | −0.48 | |
| (28) (R)-Trolox | −0.40 | −0.81 | −0.37 | −0.59 | −0.18 | 0.08 | 0.09 | 0.08 | 11.92 j | −0.67 | −0.47 |
| (29) ∆9-tetrahydrocannabinol (Δ9-THC) | −0.83 | −0.46 | −0.66 | −0.57 | −0.50 | −0.40 | −0.43 | −0.41 | 10.60 n | −0.91 | −1.37 |
| (30) cannabidiol (CBD) d | −0.08 | 0.29 | 0.18 | 0.18 | 0.30 | 0.26 | 0.29 | 0.26 | 9.7 k | −0.18 | |
| (4) 2-nitrophenol | −0.38 | −0.12 | −0.56 | 0.15 | 0.11 | 0.32 | 0.31 | 0.63 | 7.23 h | −1.10 | −3.31 |
| MAE b (test set with exp values) | 0.39 | 0.38 | 0.34 | 0.38 | 0.29 | 0.23 | 0.25 | 0.42 | |||
| MSE b | −0.15 | −0.12 | −0.08 | −0.08 | −0.17 | −0.08 | −0.10 | −0.26 | |||
| MAE c (entire test set) | 0.32 | 0.33 | 0.29 | 0.32 | 0.24 | 0.29 | 0.32 | 0.42 | |||
| MSE c | −0.15 | −0.06 | −0.07 | −0.05 | −0.10 | 0.06 | 0.08 | −0.06 | |||
| MAE (Ref. [38]) e | 0.43 | 0.40 | 0.35 | 0.42 | |||||||
| MSE (Ref. [38]) e | −0.24 | −0.08 | −0.09 | −0.26 | |||||||
| MAE b,o (complex ph. with exp values) | 0.53 | 0.52 | 0.45 | 0.49 | 0.35 | 0.28 | 0.29 | 0.27 | |||
| MSE b,o | −0.53 | −0.52 | −0.45 | −0.49 | −0.35 | −0.23 | −0.23 | −0.22 | |||
| MAE c,o (all complex ph.) | 0.35 | 0.37 | 0.31 | 0.33 | 0.23 | 0.35 | 0.39 | 0.34 | |||
| MSE c,o | −0.35 | −0.22 | −0.25 | −0.23 | −0.14 | 0.09 | 0.13 | 0.09 | |||
| MAE (Ref. [38]) e,o | 0.59 | 0.55 | 0.51 | 0.77 | |||||||
| MSE (Ref. [38]) e,o | −0.59 | −0.55 | −0.51 | −0.77 | |||||||
a The calculated aqueous pKa values are reported in Table S12; b Mean absolute (MAE) and signed (MSE) errors only taking (7) experimental values into account; c MAE and MSE taking (7) experimental and (3) previously predicted values (shown in square brackets) into account; d Macroscopic pKa values have been calculated by accounting for the degenerate deprotonation sites; e Using the correlation equations reported (SMD only) for the compounds with experimental data; f Values in brackets are theoretical predictions; g Predicted pKa values using the correlation equation at the M06-2X(SMD) level of theory; h Predicted pKa values using the three-water clusters for the acid and the conjugate base as done in Ref. [31]; i Ref. [42]; j Ref. [72]; k Ref. [73] (minimum experimental value); l Value taken from Ref. [31]; m Ref. [39]; n Ref. [71]; o Taking only the complex phenols into account (25–30).
The more complex phenols (25–30) were isolated from the simpler phenols (21–24), and the complex phenols with experimental aqueous pKa values (27–30) were further separated from those with estimated values. When considering all complex phenols in the test set, the MAEs ranged between 0.31 and 0.37 (0.23 and 0.39) with SMD (PCM). PCM generally performs better than SMD, with the lowest MAE of 0.23 achieved with the M06-2X(PCM) functional.
When considering only the complex phenols with experimental aqueous pKa values, the MAEs increased with SMD, but they generally decreased with PCM. Moreover, the MSE values increased for all functionals in both solvation models when only considering the complex phenols with experimental values. The MAEs ranged between 0.45 and 0.53 (0.27 and 0.35) with SMD (PCM). B3LYP(PCM), BHandHLYP(PCM), and TPSS(PCM) produce small MAE values for the complex phenols with experimental pKa values of 0.28, 0.29, and 0.27 pKa units, while their MSE values are −0.23, −0.23, and −0.22 pKa units, respectively. Compared to Ref. [38], our correlations produced significantly lower MAE and MSE values, especially with PCM. The performance disparity between the SMD and PCM solvent models can in part be attributed to the PCM exclusion of explicit non-electrostatic energy contributions. The excellent results with the test set, especially when using PCM, indicate that our correlations can be confidently applied to our prediction sets.
To increase the statistical value of our work, we included the seven phenols with experimental aqueous pKa values from our test set into new correlated equations at all levels of theory. The best correlation graph obtained for the twenty-seven phenols is shown in Figure 5. The associated equations that will be used for predictions are listed in the second half of Table 4. While the MAEs of the new correlations with SMD slightly increased between 0.02 and 0.05 pKa units when the seven phenols were added, the MAEs with PCM decreased between 0.02 and 0.08 pKa units. The MAE range with twenty-seven phenols became 0.26–0.27 (0.26–0.32) using SMD (PCM), with the lowest MAE of 0.26 shared by M06-2X(PCM) and BHandHLYP(PCM). These are excellent results.
3.3.2. Predicting Aqueous pKa Values of Phenols with Potential Antioxidant Activity
Our group has studied the antioxidant properties of molecules 31–42, shown in Figure 3, and molecule 24, to repair damaged leucine residues under physiological conditions (pH 7.4). We require accurate pKa values to understand the biological mechanisms of action of these potential antioxidants. Additionally, we provide pKa predictions for molecules 25 and 26 which are opioid analgesics. Table 6 presents the aqueous pKa predictions using PCM, while additional predictions using SMD are displayed in Table S13. The predicted aqueous pKa values could be used as reference values for approximate pKa predictions in other computationally available implicit solvents, as previously reported [12]. This potential solvent transferability is highly useful as many of the species in the prediction sets have poor aqueous solubility.
Table 6.
Predicted aqueous pKa values for other phenols at 298.15 K with the M06-2X, B3LYP, BHandHLYP, and TPSS functionals combined with the PCM solvation method using the corresponding pKa (exp) vs. correlation equation for 27-phenols listed in Table 4.
Molecules 25–26 and 31–42 exhibit similar acidity, with the majority being lipophilic, with average pKa predictions using PCM (SMD) between 9.15 and 11.51 (9.21 and 11.29). This is unsurprising since most of them share structural features (e.g., heteroatom at the 4-substituted position). The spread of the predicted pKa values for each of these systems using PCM (SMD) was 0.40 (0.52) pKa units or less, with the exception of 25 with PCM predictions spreading up to 1.01 pKa units.
Molecule 25 is predicted to have a pKa of 9.96 [39], in good agreement with the prediction from Ref. [38] of 9.89. On the other hand, our average prediction using PCM is 10.66, but the M06-2X(PCM) prediction is 9.96, and the overall SMD predicted average is 9.89. Our predictions for this molecule are the most spread of all with PCM and the one with the largest average difference (0.77 pKa units) between PCM and SMD. Conversely, molecule 26 was predicted to have a pKa of 10.27 [39], which is in good agreement with the prediction from Ref. [38] of 10.00 and in excellent agreement with our average prediction of 10.25. The predicted values for 25–27 used the same software [39], and while the predicted value for 27 was 10.09, the experimental value reported is 10.45 [71].
To our knowledge, there are no previous pKa predictions that we can compare our results with for molecules 31–42. However, the small average (median) range of 0.15 (0.12) for values predicted with M06-2X, B3LYP, BHandHLYP, and TPSS functionals using PCM is a promising result. Evidently, there is good agreement between these levels of theory.
3.3.3. Predicting Aqueous pKa Values of Cannabinoids
Finally, we used the same methodologies to predict the pKa for nine phenolic cannabinoids, shown in Figure 4. Of these, 43–46 and 49 present stereoisomerism. In all cases, the naturally occurring isomer was used (see Figure 4). In addition, two synthetic cannabinoids (47 and 48) were considered. Compound 46 contains only one stereocenter at C9, which gives a pair of enantiomers. For consistency, the R enantiomer was used in each case. In the case of 47, which is usually commercialized as a racemic mixture of (S,S)-(+) and (R,R)-(−) isomers, the latter was used in our calculations.
We could only find a reliable experimental pKa value for molecule 29 and an estimated minimum experimental value for 30 [71,73]. These cannabinoids were part of the test set previously discussed. Our average PCM prediction for 29 is 10.16 (with a spread of 0.09 pKa units, see Table 6), which is in good agreement with the reported experimental value of 10.60 [71]. The pKa predictions for 29 using the methodologies described in Refs. [31,38] were 9.23 and 9.69, respectively. Similarly, our average PCM pKa prediction for molecule 30 is 9.96, which is also in good agreement with the minimum estimated experimental value of 9.7 [73]. Using the methodology of Ref. [38], the pKa prediction of 9.55 for 30 seems to be slightly underestimated. Further, these results give us confidence in the accuracy of the methodology followed to calculate the macroscopic pKa value for molecule 50.
Again, due to the structural similarities of the cannabinoids, the average PCM (SMD) predicted pKa range for these molecules was between 9.21 and 10.31 (8.98 and 10.22). An interesting structural trend between molecules 46, 48, and 49, when compared to the other cannabinoids, is their lower expected pKa values (with values of 9.87, 9.26, and 9.21, respectively, if using average PCM predictions; see Table 6) because of the increased conjugate base stabilization from substituent conjugation. All of the cannabinoids were predicted to be similar or slightly more acidic than molecule 29, if considering its experimental value of 10.60; this is supported by molecule 43, an isomer of 29, having an average predicted pKa of 10.15 using PCM (just 0.01 pKa units from 29’s average prediction).
The spread of the predicted pKa values for each of these systems using PCM (SMD) was 0.51 (0.69) pKa units or less, with the exception of 45 with PCM predictions spreading over 0.86 pKa units. Similar to what was reported in the previous section, the PCM average (median) range between the levels of theory for each molecule was 0.25 (0.17) which gives us confidence in our pKa predictions for these molecules. Furthermore, since the pKa values of cannabinoids were well reproduced in the test set, our prediction methodology could be extended to other molecules of this family.
4. Conclusions
Working with an initial training set of eleven structurally simple phenols, which was later expanded to twenty molecules, direct aqueous pKa calculations (using three acid dissociation equilibria) were perform with of five DFT functionals (M06-2X, B3LYP, BHandHLYP, PBE0, and TPSS), using the 6-311++G(d,p) basis set and the SMD and PCM solvent models. Much better and more consistent results were produced from the correlations between the calculated Gibbs energy difference between each acid and its conjugate base, , and the experimental aqueous pKa values, as previously reported [38]. The correlations using SMD (PCM) produced MAEs between 0.22 and 0.27 (0.28 and 0.40) and R2s between 0.947 and 0.975 (0.898 and 0.946). In general, the correlations using twenty phenols with SMD produced more accurate results than PCM.
A new set of ten phenols of varying complexities with experimental and/or predicted pKa values (separated accordingly) was used to test the performance of our correlations. In this case, PCM performed significantly better than SMD and the theoretical methodologies previously reported [31,38] for the entire test set and when the complex phenols were isolated. The best performance (for the set with experimental pKa values) was achieved by B3LYP(PCM) with an MAE (MSE) of 0.23 (−0.08) pKa units. The best performance for the complex phenols with experimental values were achieved by B3LYP(PCM), BHandHLYP(PCM), and TPSS(PCM) with MAE values of 0.28, 0.29, and 0.27 pKa units, respectively. These three functionals are expected to produce the most accurate pKa predictions when combined with the PCM solvent model; however, we have included the remaining levels of theory to form a range of predicted values. Furthermore, we developed new correlations, including the seven molecules from the training set (working with twenty-seven phenols in total) to increase the statistical value of our work. The best MAE for the new correlations was shared by M06-2X(PCM), B3LYP(SMD), and BHandHLYP(PCM) with an MAE of 0.26 and R2s between 0.955 and 0.960 (see Table 4).
Our correlations were used to predict the pKa values of twelve molecules with potential antioxidant activity and of nine phenolic cannabinoids. The average prediction range with the PCM (SMD) solvation model was 0.15 (0.21) and 0.25 (0.34) pKa units, respectively, which indicates a very good agreement between our methodologies. These aqueous pKa predictions could be used as reference values for predictions in other solvents [12]. In the future, when more experimental data are available, it would be ideal to extend these correlations to a larger set of complex phenolic molecules to create an even better pKa predictive tool.
Supplementary Materials
The following information is available online at https://www.mdpi.com/article/10.3390/antiox12071420/s1, The absolute Gibbs free energies of the different species considered in this study at the various levels of theory (Tables S1–S5); individual pKa values and their errors are displayed in Tables S6 and S7 (Tables S8 and S9) when using Reaction (R1) (Reaction (R2)); individual pKa errors when using Reaction (R3) (Table S10); correlated pKa values (Table S11); individual pKa values in test set predictions (Table S12); predicted pKa values for prediction sets not shown in Table 6 (Table S13); optimized structures at the M06-2X(SMD)/6-311++G(d,p) level of theory.
Author Contributions
Conceptualization, N.M.-D.; Methodology, M.W.-R., T.F. and N.M.-D.; Software, M.W.-R., T.F. and G.G.-D.; Validation: M.W.-R., T.F. and G.G.-D.; Formal Analysis: M.W.-R., T.F. and G.G.-D.; Investigation: M.W.-R., T.F. and G.G.-D. Reaction (and N.M.-D.; Resources: N.M.-D.; Data Curation: M.W.-R., T.F. and G.G.-D.; Writing—Original Draft Preparation: M.W.-R., T.F. and G.G.-D.; Writing—Review and Editing: M.W.-R. and N.M.-D.; Visualization: M.W.-R. and T.F.; Supervision: N.M.-D.; Project Administration: N.M.-D.; Funding Acquisition: N.M.-D. All authors have read and agreed to the published version of the manuscript.
Funding
This research was funded by the Natural Sciences and Engineering Research Council of Canada (NSERC) and Thompson Rivers University (TRU). M.W.R. and T.F. acknowledge NSERC USRA funding and additional funding received from the TRU Student Union (TRUSU), TRU UREAP (M.W.R.), and TRU Apprenticeship (T.F.).
Data Availability Statement
Data available upon request.
Acknowledgments
We gratefully acknowledge the financial support received from the NSERC and the computing resources provided by the Digital Research Alliance of Canada. Our thanks also to Information Technology Services at TRU.
Conflicts of Interest
The authors declare no conflict of interest.
References
- Samuelsen, L.; Holm, R.; Lathuile, A.; Schönbeck, C. Buffer solutions in drug formulation and processing: How pKa values depend on temperature, pressure and ionic strength. Int. J. Pharm. 2019, 560, 357–364. [Google Scholar] [CrossRef] [PubMed]
- Nielsen, J.E.; McCammon, J.A. Calculating pKa values in enzyme active sites. Protein Sci. 2003, 12, 1894–1901. [Google Scholar] [CrossRef]
- Yang, A.-S.; Honig, B. On the pH Dependence of Protein Stability. J. Mol. Biol. 1993, 231, 459–474. [Google Scholar] [CrossRef] [PubMed]
- Sonam, N.; Chahal, V.; Kakkar, R. Theoretical study of the structural features and antioxidant potential of 4-thiazolidinones. Struct. Chem. 2020, 31, 1599–1608. [Google Scholar] [CrossRef]
- Mtewa, A.; Ngwira, K.; Lampiao, F.; Weisheit, A.; Tolo, C.; Ogwang, P.; Sesaazi, D. Fundamental Methods in Drug Permeability, pKa, LogP and LogDx Determination. J. Drug Res. Dev. 2019, 5, 1–6. [Google Scholar] [CrossRef]
- Yunta, M.J.R. Some Critical Aspects of Molecular Interactions Between Drugs and Receptors. Am. J. Model. Optim. 2014, 2, 84–102. [Google Scholar] [CrossRef]
- Galano, A.; Álvarez-Idaboy, J.R. Computational Strategies for Predicting Free Radical Scavengers’ Protection Against Oxidative Stress: Where Are We and What Might Follow? Int. J. Quantum Chem. 2019, 119, 4–7. [Google Scholar] [CrossRef]
- Ramis, R.; Casasnovas, R.; Ortega-Castro, J.; Frau, J.; Álvarez-Idaboy, J.R.; Mora-Diez, N. Modelling the Repair of Carbon-centred Protein Radicals by the Antioxidants Glutathione and Trolox. New J. Chem. 2019, 43, 2085–2097. [Google Scholar] [CrossRef]
- Monreal-Corona, R.; Biddlecombe, J.; Ippolito, A.; Mora-Diez, N. Theoretical Study of the Iron Complexes with Lipoic and Dihydrolipoic Acids: Exploring Secondary Antioxidant Activity. Antioxidants 2020, 9, 674. [Google Scholar] [CrossRef]
- García-Díez, G.; Ramis, R.; Mora-Diez, N. Theoretical Study of the Copper Complexes with Aminoguanidine: Investigating Secondary Antioxidant Activity. ACS Omega 2020, 5, 14502–14512. [Google Scholar] [CrossRef]
- García-Díez, G.; Mora-Diez, N. Theoretical Study of the Iron Complexes with Aminoguanidine: Investigating Secondary Antioxidant Activity. Antioxidants 2020, 9, 756. [Google Scholar] [CrossRef] [PubMed]
- Busch, M.; Ahlberg, E.; Ahlberg, E.; Laasonen, K. How to Predict the pKa of Any Compound in Any Solvent. ACS Omega 2022, 7, 17369–17383. [Google Scholar] [CrossRef]
- Reijenga, J.; Van Hoof, A.; Van Loon, A.; Teunissen, B. Development of Methods for the Determination of pKa values. Anal. Chem. Insights 2013, 8, 53–68. [Google Scholar] [CrossRef]
- Li, H.; Fu, A.; Xue, X.; Guo, F.; Huai, W.; Chu, T.; Wang, Z. Density Functional Theory Prediction of pKa for Carboxylated Single-wall Carbon Nanotubes and Graphene. Chem. Phys. 2017, 490, 47–54. [Google Scholar] [CrossRef]
- Motahari, A.; Fattahi, A. Theoretical Aspects of the Enhancement of Metal Binding Affinity by Intramolecular Hydrogen Bonding and Modulating pKa values. New J. Chem. 2017, 41, 15110–15119. [Google Scholar] [CrossRef]
- Ho, J.; Coote, M.L. First-principles Prediction of Acidities in the Gas and Solution Phase. Wires Comput. Mol. Sci. 2011, 1, 649–660. [Google Scholar] [CrossRef]
- Kakkar, R.; Bhandari, M. Theoretical investigation of the alloxan–dialuric acid redox cycle. Int. J. Quantum Chem. 2013, 113, 2060–2069. [Google Scholar] [CrossRef]
- Prasad, S.; Huang, J.; Zeng, Q.; Brooks, B.R. An Explicit-solvent Hybrid QM and MM Approach for Predicting pKa of Small Molecules in SAMPL6 Challenge. J. Comput. Aided Mol. Des. 2018, 32, 1191–1201. [Google Scholar] [CrossRef]
- Viayna, A.; Pinheiro, S.; Curutchet, C.; Luque, F.J.; Zamora, W.J. Prediction of N-octanol/water Partition Coefficients and Acidity Constants (pKa) in the SAMPL7 Blind Challenge with the IEFPCM-MST Model. J. Comput. Aided Mol. Des. 2021, 35, 803–811. [Google Scholar] [CrossRef]
- Alexander, N.; Augenstein, M.; Sorensen, A.M.; Garcia, C.; Greene, A.; Harrison, A.W. Computational Design of Β-fluorinated Morphine Derivatives for pH-specific Binding. Chem. Phys. Lett. 2021, 777, 138723. [Google Scholar] [CrossRef]
- Ristić, M.M.; Petković, M.; Milovanović, B.; Belić, J.; Etinski, M. New Hybrid Cluster-continuum Model for pKa Values Calculations: Case Study of Neurotransmitters’ Amino Group Acidity. Chem. Phys. 2019, 516, 55–62. [Google Scholar] [CrossRef]
- Brown, T.N.; Mora-Diez, N. Computational Determination of Aqueous pKa Values of Protonated Benzimidazoles (Part 1). J. Phys. Chem. B. 2006, 110, 9270–9279. [Google Scholar] [CrossRef] [PubMed]
- Rebollar-Zepeda, A.M.; Campos-Hernández, T.; Ramírez-Silva, M.T.; Rojas-Hernández, A.; Galano, A. Searching for Computational Strategies to Accurately Predict pKas of Large Phenolic Derivatives. J. Chem. Theory Comput. 2011, 7, 2528–2538. [Google Scholar] [CrossRef] [PubMed]
- Soriano, E.; Cerdán, S.; Ballesteros, P. Computational determination of pKa values. A comparison of different theoretical approaches and a novel procedure. J. Mol. Struct. (Theo. Chem.) 2004, 684, 121–128. [Google Scholar] [CrossRef]
- Charif, I.E.; Mekelleche, S.M.; Villemin, D.; Mora-Diez, N. Correlation of aqueous pKa values of carbon acids with theoretical descriptors: A DFT study. J. Mol. Struct. Theor. Chem. 2007, 818, 1–6. [Google Scholar] [CrossRef]
- Brown, T.N.; Mora-Diez, N. Computational Determination of Aqueous pKa Values of Protonated Benzimidazoles (Part 2). J. Phys. Chem. B. 2006, 110, 20546–20554. [Google Scholar] [CrossRef]
- Yang, Q.; Li, Y.; Yang, J.; Liu, Y.; Zhang, L.; Luo, S.; Cheng, J. Holistic Prediction of the pKa in Diverse Solvents Based on a Machine-learning Approach. Angew. Chem. Int. Ed. 2020, 59, 19282–19291. [Google Scholar] [CrossRef]
- Lawler, R.; Liu, Y.-H.; Majaya, N.; Allam, O.; Ju, H.; Kim, J.Y.; Jang, S.S. DFT-machine Learning Approach for Accurate Prediction of pKa. J. Phys. Chem. A. 2021, 125, 8712–8721. [Google Scholar] [CrossRef]
- Pliego, J.R.; Riveros, J.M. Theoretical Calculation of pKa Using the Cluster-continuum Model. J. Phys. Chem. A. 2002, 106, 7434–7439. [Google Scholar] [CrossRef]
- Thapa, B.; Schlegel, H.B. Density Functional Theory Calculation of pKa’s of Thiols in Aqueous Solution Using Explicit Water Molecules and the Polarizable Continuum Model. J. Phys. Chem. A. 2016, 120, 5726–5735. [Google Scholar] [CrossRef]
- Thapa, B.; Schlegel, H.B. Improved pKa Prediction of Substituted Alcohols, Phenols, and Hydroperoxides in Aqueous Medium Using Density Functional Theory and a Cluster-continuum Solvation Model. J. Phys. Chem. A. 2017, 121, 4698–4706. [Google Scholar] [CrossRef] [PubMed]
- Ambriz-Pérez, D.L.; Leyva-López, N.; Gutierrez-Grijalva, E.P.; Heredia, J.B. Phenolic Compounds: Natural Alternative in Inflammation Treatment. A Review. Cogent Food Agric. 2016, 2, 1–14. [Google Scholar] [CrossRef]
- Siraki, A.G.; O’Brien, P.J. Prooxidant activity of free radicals derived from phenol-containing neurotransmitters. Toxicology 2002, 177, 81–90. [Google Scholar] [CrossRef] [PubMed]
- Arulmozhiraja, S.; Shiraishi, F.; Okumura, T.; Iida, M.; Takigami, H.; Edmonds, J.S.; Morita, M. Structural Requirements for the Interaction of 91 Hydroxylated Polychlorinated Biphenyls with Estrogen and Thyroid Hormone Receptors. Toxicol. Sci. 2005, 84, 49–62. [Google Scholar] [CrossRef] [PubMed]
- Fuster, V.; Sweeny, J.M. Aspirin: A historical and contemporary therapeutic overview. Circulation 2011, 123, 768–778. [Google Scholar] [CrossRef] [PubMed]
- Presley, C.C.; Lindsley, C.W. DARK Classics in Chemical Neuroscience: Opium, a Historical Perspective. ACS Chem. Neurosci. 2018, 9, 2503–2518. [Google Scholar] [CrossRef]
- Tungmunnithum, D.; Thongboonyou, A.; Pholboon, A.; Yangsabai, A. Flavonoids and Other Phenolic Compounds from Medicinal Plants for Pharmaceutical and Medical Aspects: An Overview. Medicines 2018, 5, 93. [Google Scholar] [CrossRef]
- Galano, A.; Pérez-González, A.; Castañeda-Arriaga, R.; Muñoz-Rugeles, L.; Mendoza-Sarmiento, G.; Romero-Silva, A.; Ibarra-Escutia, A.; Rebollar-Zepeda, A.M.; León-Carmona, J.R.; Hernández-Olivares, M.A.; et al. Empirically Fitted Parameters for Calculating pKa Values with Small Deviations from Experiments Using a Simple Computational Strategy. J. Chem. Inf. Model. 2016, 56, 1714–1724. [Google Scholar] [CrossRef]
- Advanced Chemistry Development (ACD/Laboratories). Software V11.02; ACD/Laboratories: Toronto, ON, Canada, 2011. [Google Scholar]
- Castañeda-Arriaga, R.; Marino, T.; Russo, N.; Alvarez-Idaboy, J.R.; Galano, A. Chalcogen Effects on the Primary Antioxidant Activity of Chrysin and Quercetin. New J. Chem. 2020, 44, 9073–9082. [Google Scholar] [CrossRef]
- Francisco-Marquez, M.; Galano, A. Detailed Investigation of the Outstanding Peroxyl Radical Scavenging Activity of Two Novel Amino-Pyridinol-Based Compounds. J. Chem. Inf. Model. 2019, 59, 3494–3505. [Google Scholar] [CrossRef]
- Rumble, J.R. Dissociation Constants of Organic Acids and Bases. In CRC Handbook, 102nd ed.; CRC Press: Boca Raton, FL, USA, 2021. [Google Scholar]
- Smith, R.M.; Martell, A.E.; Motekaitis, R.J. NIST Standard Reference Database 46; National Institute of Standards and Technology (NIST): Gaithersburg, ML, USA; Texas A&M University: College Station, TX, USA, 2004. [Google Scholar]
- Hasemann, P.; Ter Balk, M.; Preu, L.; Wätzig, H. Separation of Cold Medicine Ingredients Using a Precise MEKC Method at Elevated pH. Electrophoresis 2007, 28, 1779–1787. [Google Scholar] [CrossRef] [PubMed]
- Walton-Raaby, M.; Floen, T.; Mora-Diez, N. Modeling the Repair of Carbon-Centered Protein Radicals by Vitamin E Analogues and Commercial Antioxidants. New J. Chem. 2019, 43, 2085–2097, in preparation. [Google Scholar]
- Floen, T.; Walton-Raaby, M.; Mora-Diez, N. Computational Modelling of Protein Radical Repair by Various Aminophenol and Stilbene Antioxidants. In preparation.
- Walton-Raaby, M.; Floen, T.; Mora-Diez, N. Antioxidant Activity of Catechins in Tea and Resveratrol-Related Compounds: A DFT Study. In preparation.
- Halliwell, B.; Aeschbach, R.; Löliger, J.; Aruoma, O.I. The Characterization of Antioxidants. Food Chem. Toxicol. 1995, 33, 601–617. [Google Scholar] [CrossRef] [PubMed]
- Wright, J.S.; Johnson, E.R.; Dilabio, G.A. Predicting the Activity of Phenolic Antioxidants: Theoretical Method, Analysis of Substituent Effects, and Application to Major Families of Antioxidants. J. Am. Chem. Soc. 2001, 123, 1173–1183. [Google Scholar] [CrossRef]
- Penner, N.A.; Nesterenko, P.N. Simultaneous Determination of Dihydroxybenzenes, Aminophenols and Phenylenediamines in Hair Dyes by High-performance Liquid Chromatography on Hypercross-linked Polystyrene. Analyst. 2000, 125, 1249–1254. [Google Scholar] [CrossRef]
- Mitchell, S.C.; Carmichael, P.; Waring, R. Aminophenols. In Kirk-Othmer Encyclopedia of Chemical Technology; John Wiley & Sons: Hoboken, NJ, USA, 2000. [Google Scholar]
- Abyadeh, M.; Gupta, V.; Paulo, J.A.; Gupta, V.; Chitranshi, N.; Godinez, A.; Saks, D.; Hasan, M.; Amirkhani, A.; McKay, M.; et al. A Proteomic View of Cellular and Molecular Effects of Cannabis. Biomolecules 2021, 11, 1411. [Google Scholar] [CrossRef]
- Worob, A.; Wenthur, C. DARK Classics in Chemical Neuroscience: Synthetic Cannabinoids (Spice/K2). ACS Chem. Neurosci. 2020, 11, 3881–3892. [Google Scholar] [CrossRef]
- Banister, S.D.; Arnold, J.C.; Connor, M.; Glass, M.; McGregor, I.S. Dark Classics in Chemical Neuroscience: Δ9-tetrahydrocannabinol. ACS Chem. Neurosci. 2019, 10, 2160–2175. [Google Scholar] [CrossRef]
- White, C.M. A Review of Human Studies Assessing Cannabidiol’s (CBD) Therapeutic Actions and Potential. J. Clin. Pharmacol. 2019, 59, 923–934. [Google Scholar] [CrossRef] [PubMed]
- Hampson, A.J.; Axelrod, J.; Grimaldi, M. Cannabinoids as Antioxidants and Neuroprotectants. U.S. Patent #:6630507, 7 October 2003. [Google Scholar]
- Silver, R.J. The Endocannabinoid System of Animals. Animals 2019, 9, 686. [Google Scholar] [CrossRef] [PubMed]
- Nabilone. Available online: https://pubchem.ncbi.nlm.nih.gov/compound/Nabilone (accessed on 23 November 2021).
- Adams, R.; Harfenist, M.; Loewe, S. New Analogs of Tetrahydrocannabinol. XIX. J. Am. Chem. Soc. 1949, 71, 1624–1628. [Google Scholar] [CrossRef]
- Frisch, M.J.; Trucks, G.W.; Schlegel, H.B.; Scuseria, G.E.; Robb, M.A.; Cheeseman, J.R.; Scalmani, G.; Barone, V.; Petersson, G.A.; Nakatsuji, H.; et al. Gaussian 16, Revision C.01; Gaussian, Inc.: Wallingford, CT, USA, 2016. [Google Scholar]
- Tomasi, J.; Mennucci, B.; Cances, E. The IEF Version of the PCM Solvation Method: An Overview of a New Method Addressed to Study Molecular Solutes at the QM Ab Initio Level. J. Mol. Struct. Theor. Chem. 1999, 464, 211. [Google Scholar] [CrossRef]
- Cancès, E.; Mennucci, B. New Applications of Integral Equations Methods for Solvation Continuum Models: Ionic Solutions and Liquid Crystals. J. Math. Chem. 1998, 23, 309. [Google Scholar] [CrossRef]
- Cancès, E.; Mennucci, B.; Tomasi, J. A New Integral Equation Formalism for the Polarizable Continuum Model: Theoretical Background and Applications to Isotropic and Anisotropic Dielectrics. J. Chem. Phys. 1997, 107, 3032. [Google Scholar] [CrossRef]
- Mennucci, B.; Cancès, E.; Tomasi, J. Evaluation of Solvent Effects in Isotropic and Anisotropic Dielectrics and in Ionic Solutions with a Unified Integral Equation Method: Theoretical Bases, Computational Implementation, and Numerical Applications. J. Phys. Chem. B 1997, 101, 10506. [Google Scholar] [CrossRef]
- Barone, V.; Cossi, M.; Tomasi, J. A New Definition of Cavities for the Computation of Solvation Free Energies by the Polarizable Continuum Model. J. Chem. Phys. 1997, 107, 3210–3221. [Google Scholar] [CrossRef]
- Marenich, A.V.; Cramer, C.J.; Truhlar, D.G. Universal Solvation Model Based on Solute Electron Density and on a Continuum Model of the Solvent Defined by the Bulk Dielectric Constant and Atomic Surface Tensions. J. Phys. Chem. B. 2009, 113, 6378–6396. [Google Scholar] [CrossRef]
- Juhasz, J.R.; Pisterzi, L.F.; Gasparro, D.M.; Almeida, D.R.P.; Csizmadia, I.G. The Effects of Conformation on the Acidity of Ascorbic Acid: A Density Functional Study. J. Mol. Struct. Theor. Chem. 2003, 666–667, 401–407. [Google Scholar] [CrossRef]
- Szakács, Z.; Noszál, B. Protonation Microequilibrium Treatment of Polybasic Compounds with Any Possible Symmetry. J. Math. Chem. 1999, 26, 139–155. [Google Scholar] [CrossRef]
- Zhang, S. A Reliable and Efficient First Principles-based Method for Predicting pKa values. 4. Organic Bases. J. Comput. Chem. 2012, 33, 2469–2482. [Google Scholar] [CrossRef]
- Klamt, A.; Eckert, F.; Diedenhofen, M. First Principles Calculations of Aqueous Pka Values for Organic and Inorganic Acids Using COSMO−RS Reveal an Inconsistency in the Slope of the pKa Scale. J. Phys. Chem. A. 2003, 107, 9380–9386. [Google Scholar] [CrossRef] [PubMed]
- O’Neil, M.J.; Heckelman, P.E.; Dobbelaar, P.H.; Roman, K.J.; Kenny, C.M.; Karaffa, L.S. The Merck Index: An Encyclopedia of Chemicals, Drugs, and Biologicals; Royal Society of Chemistry: Cambridge, UK, 2013. [Google Scholar]
- Steenken, S. One-electron Redox Potentials of Phenols. Hydroxy- and Aminophenols and Related Compounds of Biological Interest. J. Phys. Chem. 1982, 86, 3661–3667. [Google Scholar] [CrossRef]
- Mazina, J.; Spiljova, A.; Vaher, M.; Kaljurand, M.; Kulp, M. A Rapid Capillary Electrophoresis Method with Led-induced Native Fluorescence Detection for the Analysis of Cannabinoids in Oral Fluid. Anal. Methods 2015, 7, 7741–7747. [Google Scholar] [CrossRef]


Disclaimer/Publisher’s Note: The statements, opinions and data contained in all publications are solely those of the individual author(s) and contributor(s) and not of MDPI and/or the editor(s). MDPI and/or the editor(s) disclaim responsibility for any injury to people or property resulting from any ideas, methods, instructions or products referred to in the content. |
© 2023 by the authors. Licensee MDPI, Basel, Switzerland. This article is an open access article distributed under the terms and conditions of the Creative Commons Attribution (CC BY) license (https://creativecommons.org/licenses/by/4.0/).