Article

Associations between Serum Folate Concentrations and Functional Disability in Older Adults

1
Department of Epidemiology and Health Statistics, The School of Public Health of Qingdao University, 308 Ningxia Road, Qingdao 266071, China
2
Department of Big Data in Health Science and Center for Clinical Big Data and Analytics, Second Affiliated Hospital and School of Public Health, Zhejiang University School of Medicine, Hangzhou 310058, China
*
Author to whom correspondence should be addressed.
Antioxidants 2023, 12(3), 619; https://doi.org/10.3390/antiox12030619
Submission received: 31 January 2023 / Revised: 22 February 2023 / Accepted: 28 February 2023 / Published: 2 March 2023

Abstract

:
Folate may have beneficial effects on physical function through its antioxidant effect. Thus, we investigated the associations between serum folate and functional disability in older adults. Data from the National Health and Nutrition Examination Survey 2011–2018 were used. Serum folate included 5-methyltetrahydrofolate and total folate. Five domains of functional disability, including lower extremity mobility (LEM), instrumental activities of daily living (IADL), activities of daily living (ADL), leisure and social activities (LSA), and general physical activities (GPA), were self-reported. Multivariable-adjusted logistic regression models and restricted cubic splines were employed. 5-Methyltetrahydrofolate was inversely associated with IADL and GPA disability, and the multivariate-adjusted ORs (95% CIs) in the highest versus lowest quartiles were 0.65 (0.46–0.91) and 0.70 (0.50–0.96), respectively. The total folate was also inversely associated with IADL (OR quartile 4vs1 = 0.65, 95% CI: 0.46–0.90) and GPA (OR quartile 3vs1 = 0.66, 95% CI: 0.44–0.99) disability. The dose–response relationships showed a gradual decrease in the risk of IADL and GPA disability as serum folate increased. In the sex, age, BMI, and alcohol consumption subgroup analyses, we saw that the associations were primarily found in females, under 80 years old, normal weight, and non-drinkers. Sensitivity analyses further confirmed the robustness of our results. Our results indicated that serum folate concentrations were negatively associated with IADL and GPA disability, especially in females. In other subgroup analyses, we discovered that these negative associations were primarily prevalent in participants under 80 years old, normal weight, and non-drinkers.

1. Introduction

Functional disability, defined as difficulty in performing basic activities of daily life [1], can induce a range of adverse health consequences, such as decreased quality of life [2], increased hospitalization rates [3], and increased mortality [4]. The number and proportion of older adults are increasing across many populations worldwide [5], and they tend to have a higher prevalence of functional disability [6], which imposes a heavy burden on society and families [7]. Consequently, exploring potentially modifiable factors that may prevent or delay the progression of functional disability is critical to reducing the burden on healthcare systems and achieving healthy aging.
Studies have shown that diet may be an effective way to prevent functional disability [8]. Recently, there has been considerable interest in the relationships between functional disability and dietary or nutritional factors, such as dietary protein [9], coffee [10], vitamin K [11], selenium [12], etc. Folate is a water-soluble vitamin that plays a role in the antioxidant process [13]. Folate can attenuate oxidative stress by improving biomarkers in the antioxidant defense system [13], and oxidative stress may increase the risk of disability [14]. Folate also acts as a coenzyme of one-carbon metabolism involved in homocysteine methylation, converting homocysteine to methionine [15,16]. Studies have shown that decreased homocysteine levels may be associated with improved physical function [17,18].
Some studies have investigated the relationship between dietary folate [19,20] or folate supplements [21] and physical function in older adults. Serum folate has also attracted the attention of a few researchers, because it can better reflect the recent folate intake level [22]. Still, there are few studies on the relationship between serum folate and physical function in older adults, and the results are inconsistent. To our knowledge, a study conducted in Singapore among 796 older participants discovered that a higher serum folate concentration was related to better physical performance on balance [23]. Another study of older adults in Spanish showed that people with a satisfactory folate status scored higher on the instrumental activities of daily living (IADL) test [24]. Nevertheless, a study of 698 older Italians found no significant relationship between serum folate and subsequent physical function (defined by the Short Physical Performance Battery (SPPB) test) [25].
5-Methyltetrahydrofolate (5-MTHF) is the main biologically active form of folate. Until recently, no studies have looked into the relationship between 5-MTHF and the risk of functional disability. Furthermore, disability is multidimensional, but previous studies have often been limited to one or two domains of functional disability. In addition, there was no clear dose–response relationship between serum folate and functional disability.
As a result, we extracted data from the National Health and Nutrition Examination Survey (NHANES) 2011–2018 cycles and performed this study to assess the associations between serum folate (including 5-MTHF and total folate) and five domains of functional disability in older Americans.

2. Materials and Methods

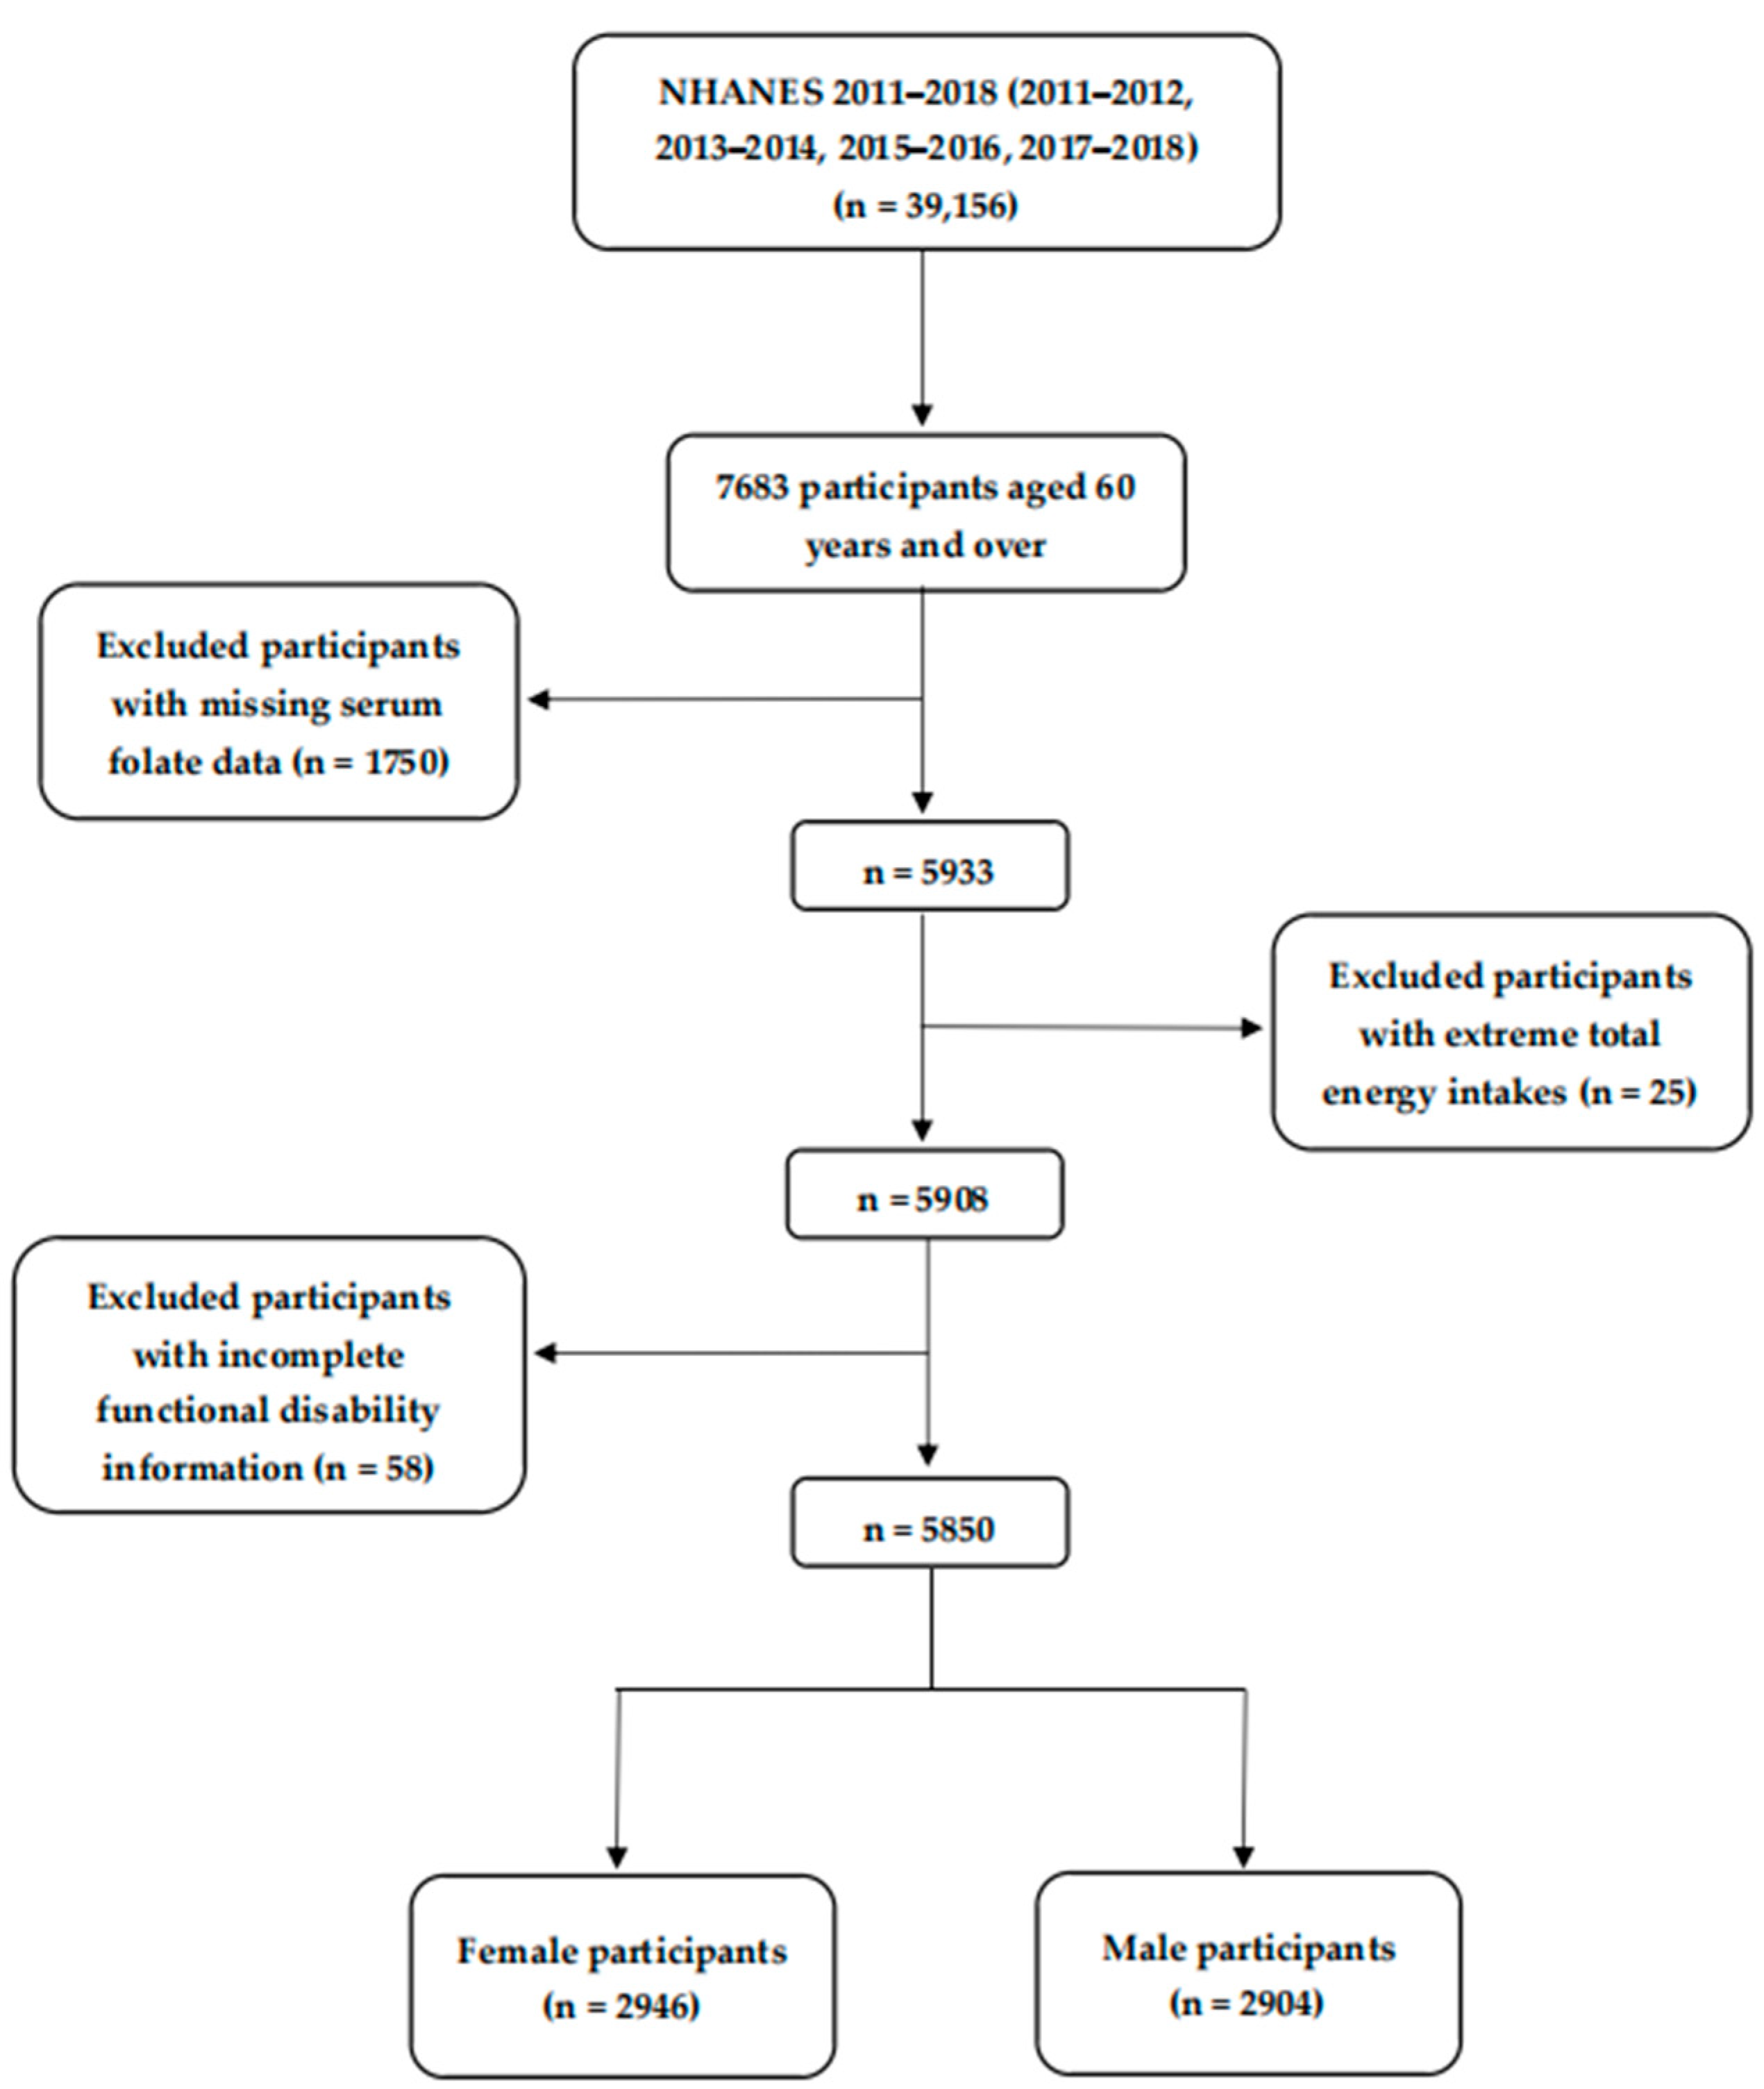
2.1. Study Population

The NHANES is a continuous survey utilizing a stratified multistage probability sample approach to assess the health and nutrition states of the United States (US)’ civilian people. The survey results are released publicly once every two years. The NHANES protocols were approved by the National Center for Health Statistics Ethics Review Committee, and each survey participant gave informed consent [26].
In this study, we combined four survey cycles of NHANES (2011–2012, 2013–1014, 2015–2016, and 2017–2018), totaling 39,156 individuals. Participants under the age of 60 were eliminated (n = 31,473). In addition, 1750 participants were ruled out because serum folate data were missing. Furthermore, participants with extreme total energy intakes (<500 or >5000 kcal/day for females, <500 or >8000 kcal/day for males) (n = 25) were removed [27]. After excluding 58 participants with incomplete functional disability information, leaving 5850 participants (2946 females and 2904 males) in the current study. Figure 1 depicts the specific screening procedure.

2.2. Serum Folate Assessment

Isotope dilution high-performance liquid chromatography coupled to tandem mass spectrometry (LC-MS/MS) was used to measure the concentrations of five bioactive forms of serum folate, including 5-MTHF, folic acid, 5-formyl-tetrahydrofolate, tetrahydrofolate, and 5,10-methenyl-tetrahydrofolate [28]. Five bioactive forms of serum folate were added together to estimate the total folate [29]. The main bioactive form among these five is 5-MTHF, which contributes about 90% of the total folate [30,31]. As a result, we included 5-MTHF and total folate in our investigations [32].

2.3. Self-Reported Functional Disability Assessment

The NHANES provided self-reported data on physical function [33]. Based on previous investigations [34,35,36,37], 19 well-validated questions of physical function were categorized into five domains of functional disability: lower extremity mobility (LEM), IADL, activities of daily living (ADL), general physical activities (GPA), and leisure and social activities (LSA). Detailed information is shown in Supplementary Table S1. Each question examined an individual’s ability to perform a task without using any special equipment. The options available for participants to answer were “no difficulty”, “some difficulty”, “much difficulty”, “unable to do”, or “do not do this activity”. Functional disability was defined as having any difficulty in performing one or more tasks within a given domain.

2.4. Other Covariates

Based on the prior literature [10,17], we took into account the influences of the following factors. The demographic factors included sex, age, race/ethnicity, educational level, marital status, and poverty–income ratio (PIR). We also adjusted the personal lifestyle factors such as total energy intake, physical activity, alcohol consumption, and smoking status. Furthermore, the health conditions factors included body mass index (BMI) and some chronic diseases, including hypertension, diabetes, arthritis, stroke, gout, cancer, congestive heart failure (CHF), coronary heart disease (CHD), angina, asthma, chronic bronchitis, and emphysema. Supplementary Table S2 presents the classifications of the covariates.

2.5. Statistical Analyses

We calculated the new sample weights in light of the NHANES weighting guidelines when merging the four 2-year cycles data to ensure the national representation of the sample. The Kolmogorov–Smirnov test was employed to identify the normality of the quantitative variables. We used the chi-square test to compare the differences between participants with and without functional disability for qualitative variables, the ANOVA test for normally distributed quantitative variables, and the Mann–Whitney U test for non-normally distributed quantitative variables.
In our analyses, considering the obvious differences in the serum folate levels between males and females and based on previous literature [32,38,39], we divided the serum folate data into four groups based on sex-specific quartiles, with the lowest quartile group serving as the reference group. Age-adjusted and multivariate-adjusted binary logistic regression analyses were conducted to evaluate the relationships between serum folate and all domains of functional disability. The multivariate-adjusted model adjusted for age, race/ethnicity, educational level, marital status, PIR, physical activity, alcohol consumption, smoking status, BMI, hypertension, diabetes, arthritis, stroke, gout, cancer, CHF, CHD, angina, asthma, chronic bronchitis, emphysema, and total energy intake. Sex, age, BMI, and alcohol consumption stratification analyses were also conducted in our study. To investigate the dose–response relationships between serum folate and functional disability, we employed restricted cubic splines with 3 knots (the 5th, 50th, and 95th percentiles of the serum folate distribution) in the multivariate-adjusted model.
To test the robustness of our results, we conducted the following sensitivity analyses. Firstly, considering that ignoring the presence of Mefox (an oxidation product of 5-MTHF) may lead to underestimation of the total folate [30], we further examined the relationships between the combined total folate (total folate plus Mefox) and all domains of functional disability. Secondly, we conducted secondary analyses by excluding participants using antibiotics, estrogens, and anticonvulsants. Thirdly, we minimized the confounding by excluding participants suffering from malnutrition. In addition, we additionally examined the relationships between the dietary folate intake and folate supplementation use (yes/no) and functional disability.
All statistical analyses were performed using Stata 15.0 and R software, version 4.2.1. Statistical significance was considered as two-sided p-values ≤ 0.05.

3. Results

3.1. Characteristics of the Participants

The characteristics of the participants are shown in Table 1 and Supplementary Table S3. For all domains of functional disability, people with a functional disability tended to be older; single; smokers; were more likely to have less total energy intake; lower PIR; higher BMI; a lower educational level; lower physical activity; and higher prevalence of stroke, hypertension, arthritis, diabetes, CHF, CHD, angina, asthma, chronic bronchitis, and emphysema. In addition to that, participants with functional disability were more likely to be females, except for ADL disability. Participants with disability in IADL, LEM, LSA, and ADL tended to be drinkers and minority races and were more likely to have lower serum folate concentrations. Supplementary Table S4 shows the comparison results of the serum folate concentrations between males and females. We found that females had higher serum folate concentrations than males.

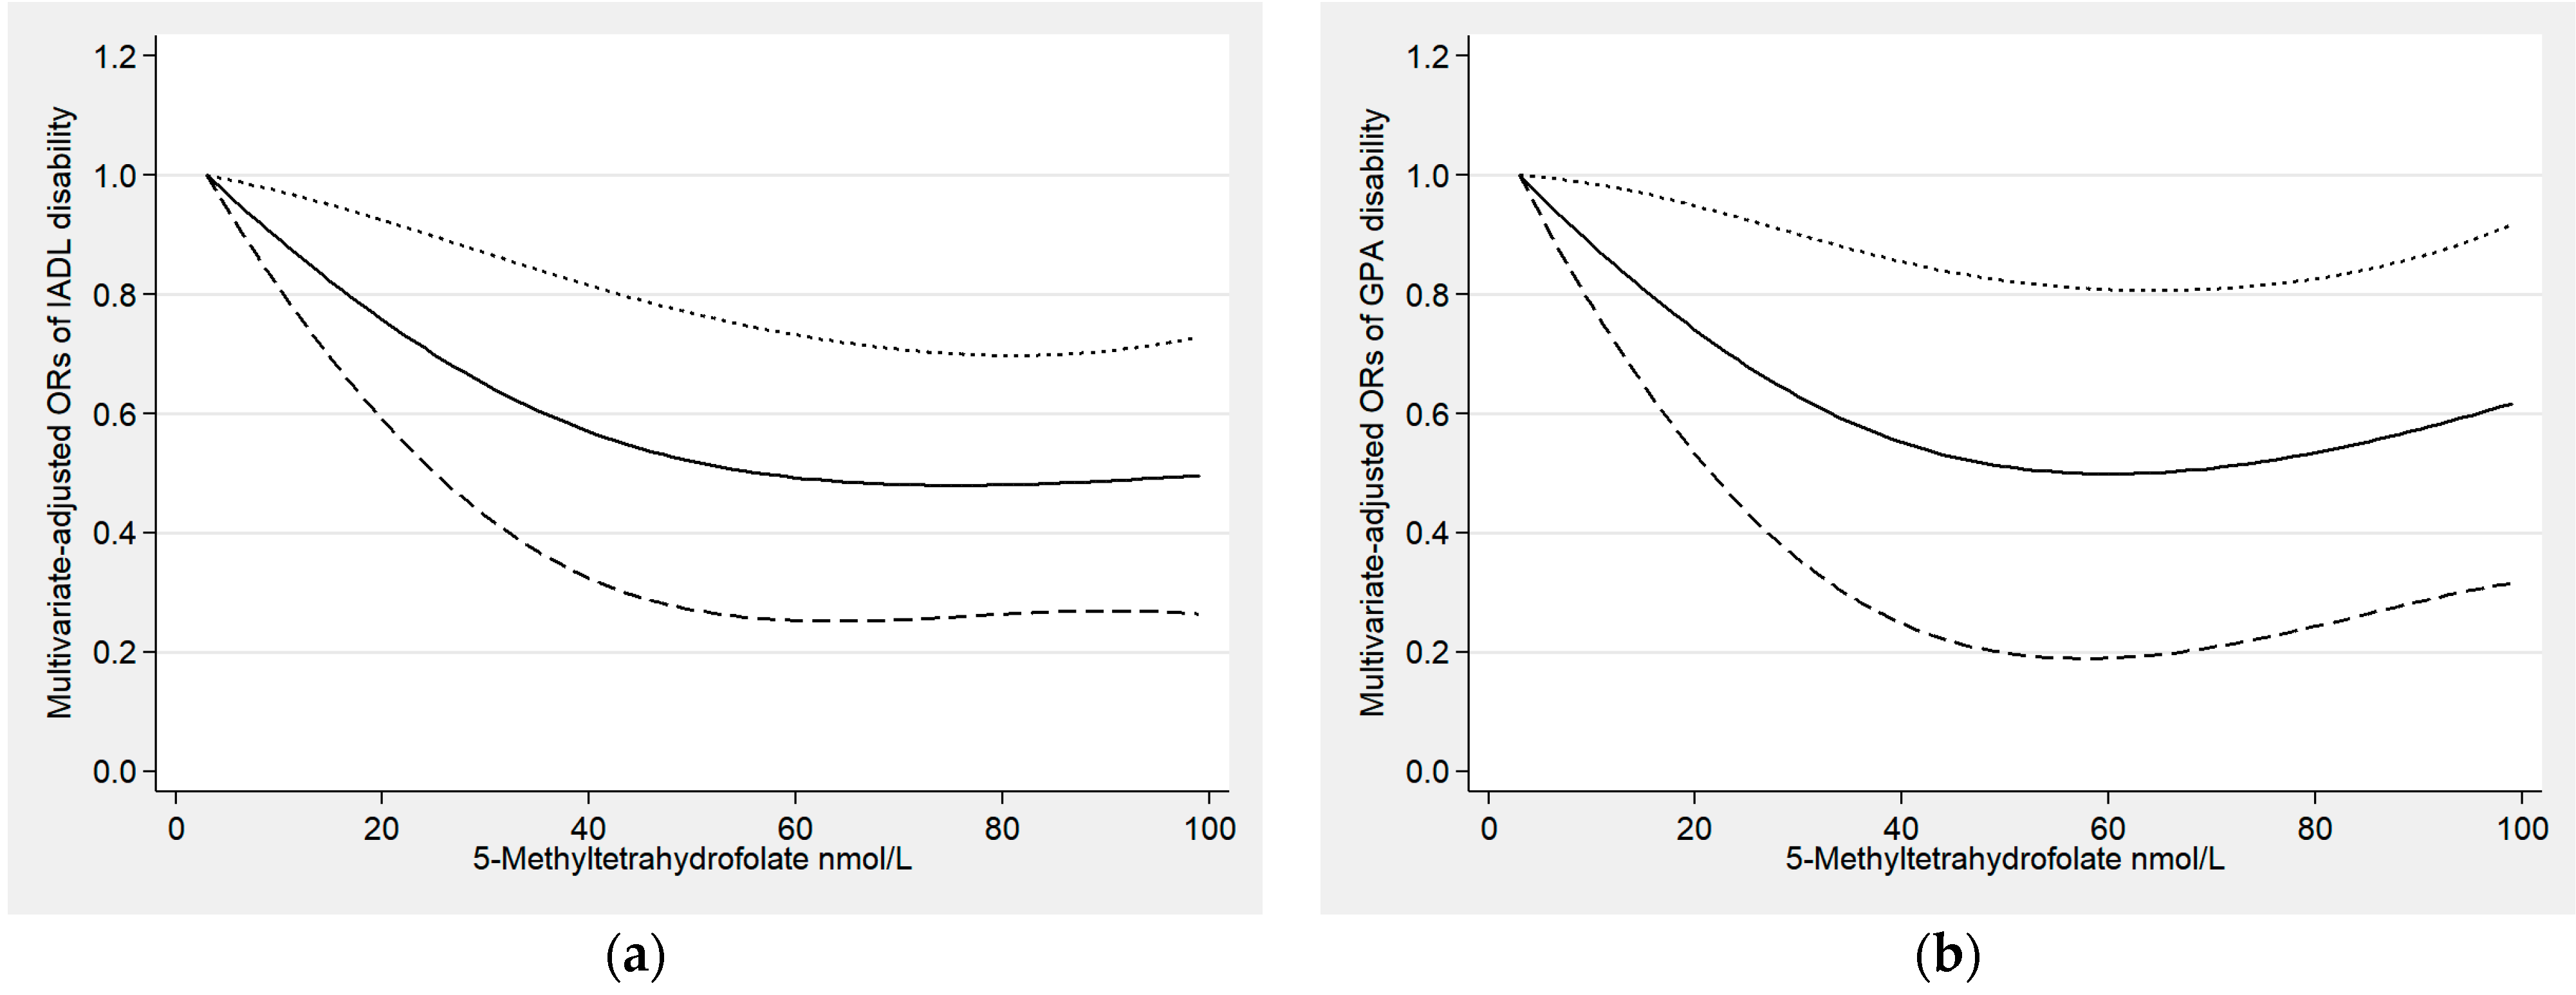
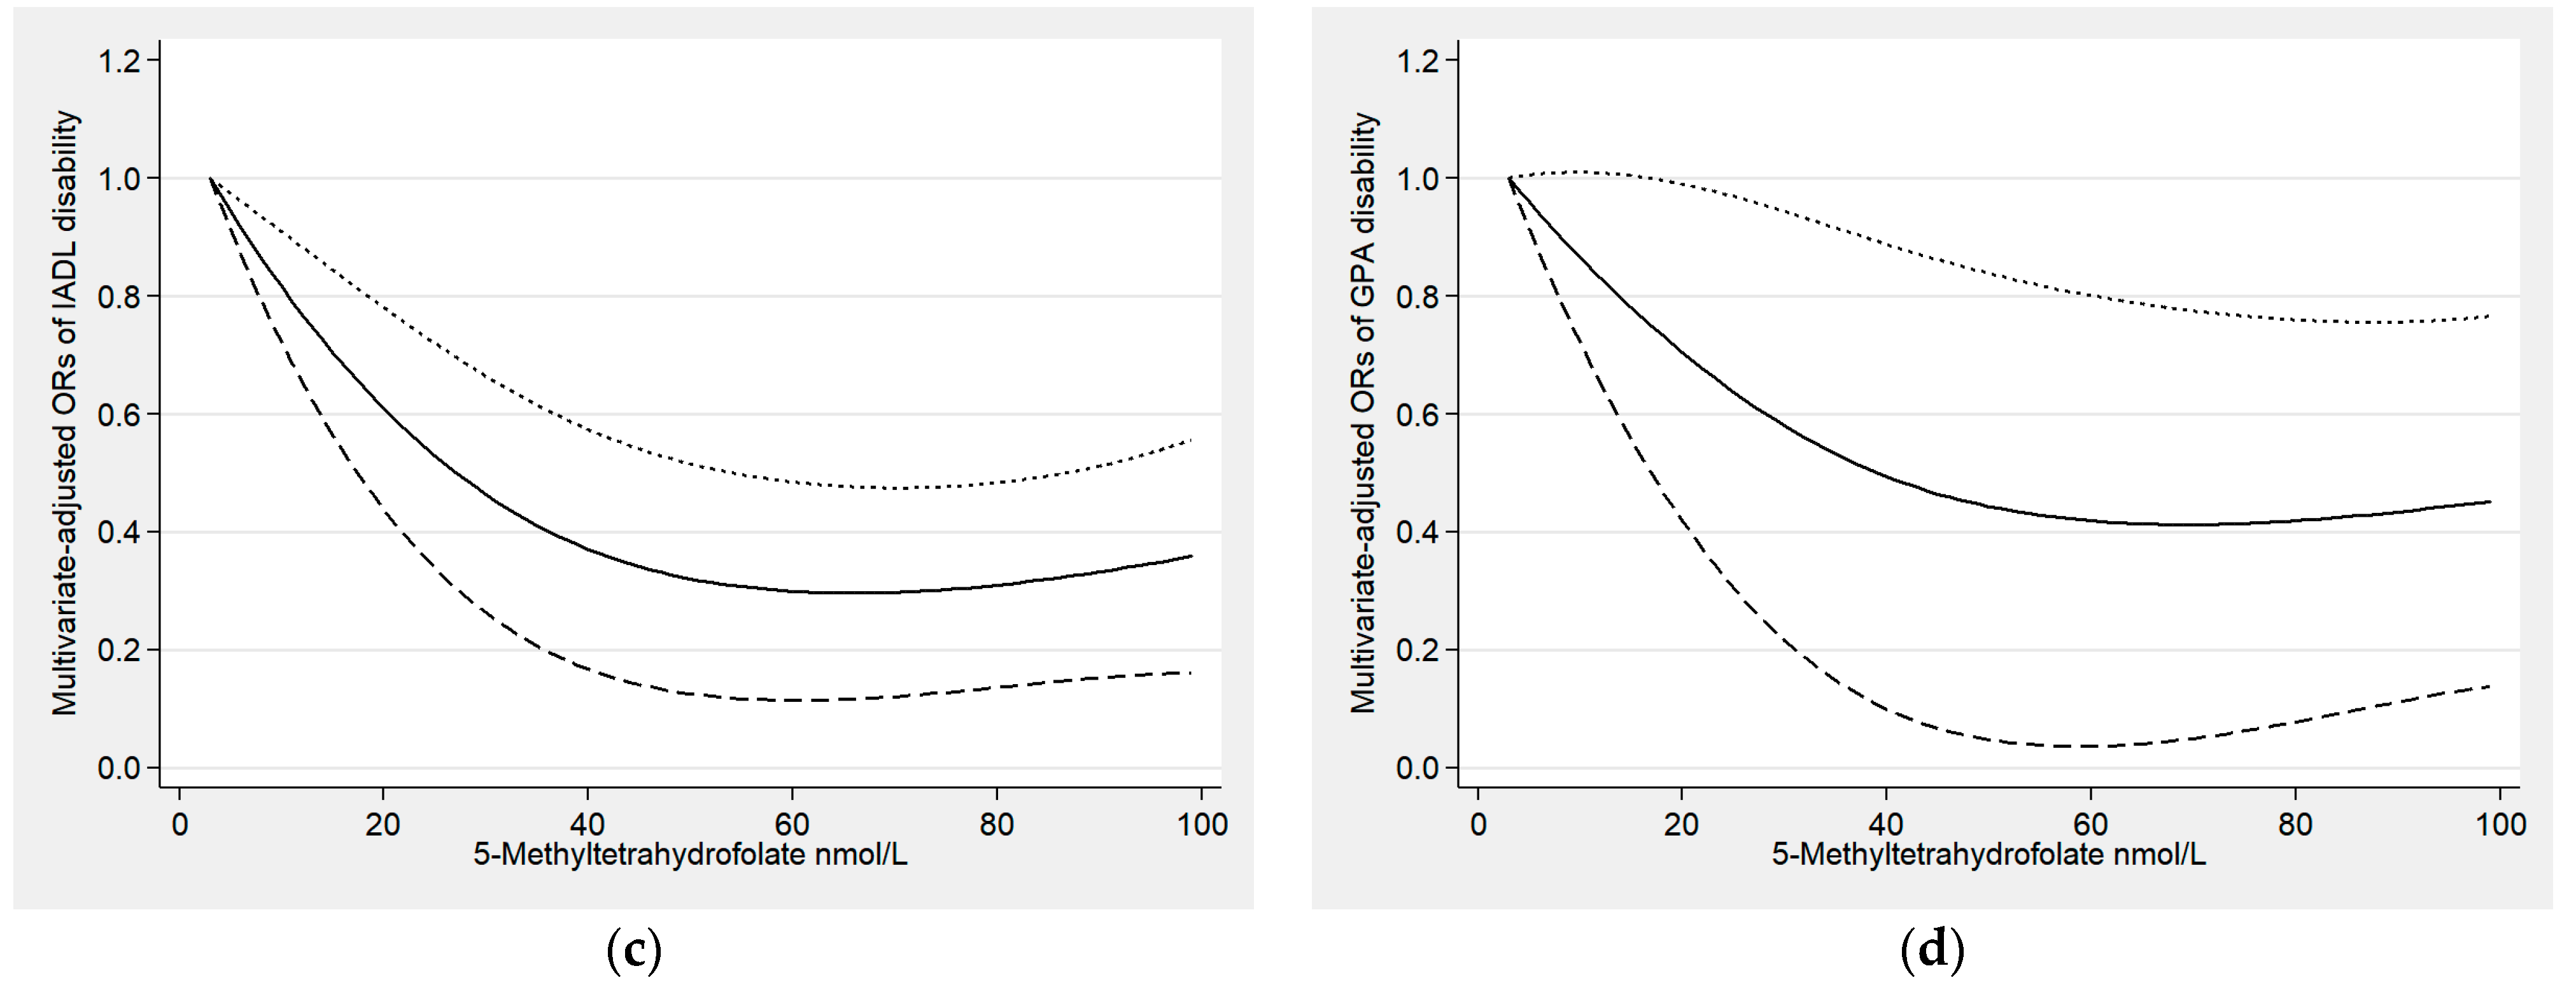
3.2. Relationships between Serum Folate and Functional Disability

Table 2 and Supplementary Table S5 display the weighted odds ratios (ORs) with 95% confidence intervals (CIs) for all domains of functional disability according to the quartiles of 5-MTHF and total folate. In the age-adjusted models, the concentrations of 5-MTHF and total folate were inversely related to all domains of functional disability. In the multivariate-adjusted models, we found negative relationships between 5-MTHF and IADL and GPA disability, the ORs (95% CIs) in the highest versus lowest quartiles were 0.65 (0.46–0.91) and 0.70 (0.50–0.96), respectively. We also found that elevated level of total folate was associated with decreased odds of disability in IADL (OR quartile 4vs1 = 0.65, 95% CI: 0.46–0.90) and GPA (OR quartile 3vs1 = 0.66, 95% CI: 0.44–0.99).
We further performed stratified analyses by sex. For females, after adjusted age, we observed that 5-MTHF and total folate were negatively associated with the odds of all domains of functional disability. Compared with quartile 1 (Q1), the fully adjusted ORs (95% CIs) for IADL disability for the highest quartile of 5-MTHF and total folate were 0.52 (0.35–0.79) and 0.53 (0.35–0.78), respectively. In the multivariate-adjusted models, the risk of GPA disability decreased in Q2–Q4 for 5-MTHF and total folate (adjusted ORs ranged from 0.46 to 0.56). The results are shown in Table 3 and Supplementary Table S6. However, no statistical significance was found in males in the multivariate-adjusted models (Supplementary Tables S7 and S8).
Figure 2 presents the associations between 5-MTHF and the risk of IADL and GPA disability in stratified analyses by age, BMI, and alcohol consumption. Among people aged 70–79 years old, normal weight, and non-drinkers, 5-MTHF was negatively associated with IADL disability. In addition, we found that 5-MTHF was negatively associated with GPA disability in the population of 60–69 years old, normal weight, and non-drinkers. The stratified analyses of total folate and the risk of IADL and GPA disability yielded similar findings (Supplementary Figure S1).
In Figure 3, the outcomes of the restricted cubic spline analyses between 5-MTHF and the risk of IADL and GPA disability are displayed. Among overall participants and females, we found that as 5-MTHF levels increased, the risk of IADL and GPA disability decreased gradually. We found similar dose–response relationships between total folate and the risk of IADL and GPA disability (Supplementary Figure S2).

3.3. Sensitivity Analyses

The results of the sensitivity analyses of the associations between combined total folate and all domains of functional disability were consistent with our primary results (Supplementary Table S9). After excluding 798 participants using antibiotics, estrogens, and anticonvulsants, 5-MTHF and total folate were negatively associated with three domains of functional disability (IADL, LSA, and GPA) (Supplementary Table S10). After eliminating 192 participants suffering from malnutrition, the results did not change substantially (Supplementary Table S11). Supplementary Table S12 presents the relationships between dietary folate intake and the risk of functional disability. Compared with Q1, the multivariate-adjusted ORs (95% CIs) for IADL disability of dietary folate intake in the Q3 and Q4 were 0.68 (0.50–0.93) and 0.62 (0.45–0.86), respectively. The associations between folate supplementation use and functional disability risk are shown in Supplementary Table S13. Compared with non-supplement users (n = 2168), folate supplement users had a lower prevalence of ADL disability, with an OR (95% CI) of 0.78 (0.64–0.96).

4. Discussion

In this cross-sectional study of 5850 participants, after adjusting all covariates, higher concentrations of serum folate were related to lower odds of disability in IADL and GPA. In sex-stratified analyses, we found that serum folate concentrations were adversely associated with IADL and GPA disability in females, but no such associations were found in males. In age, BMI, and alcohol consumption subgroup analyses, negative associations between serum folate with the risk of IADL disability were observed in the population of 70–79 years old, normal weight, and non-drinkers, and with the risk of GPA disability were mainly observed in the population of 60–69 years old, normal weight, and non-drinkers. The dose–response relationships showed a gradual decrease in the risk of IADL and GPA disability as serum folate increased. Sensitivity analyses further confirmed the robustness of our results.
An observational study involving 796 Singapore older adults aged 55 and above indicated that relatively higher serum folate concentration was related to better performance in the balance test [23]. Another survey of Spanish older adults aged 65 to 89 found that participants who performed better on the IADL test had higher serum folate concentrations than those who performed worse [24]. In addition, a review summarized the existing evidence that some vitamin deficiencies had a negative impact on the functional recovery of older adults, including folate [40]. These studies provide indirect support for our findings. It is worth mentioning that several studies have found that dietary folate and folate supplement intakes may be partially associated with improved physical function in older adults [20,21], which further supported our findings. Nevertheless, a 3-year cohort study of 698 older adults showed that serum folate was not associated with subsequent SPPB test scores [25]. The inconsistent findings may be due to the differences in the specific items covered by the test for assessing physical function.
The mechanisms underlying the link between serum folate and functional disability remained unclear, and there may be the following aspects. Firstly, folate may have beneficial effects on physical function through its antioxidant effect [41,42]. Several studies have shown that folate or folic acid supplementation may attenuate oxidative stress by improving biomarkers in the antioxidative defense system, such as increased serum total antioxidant capacity and glutathione (GSH) concentration [13,43,44,45,46]. Studies have found that oxidative stress is an independent predictor of functional disability [14]. Secondly, the anti-inflammatory effect of folate [47] may also be a mechanism for decreasing the risk of functional disability [48,49]. In addition, folate as a coenzyme of one-carbon metabolism involved homocysteine methylation and promotes homocysteine to methionine conversion [50,51,52]. Several studies have suggested that elevated homocysteine levels may be a risk factor for functional disability [17] or physical function decline [18,53,54]. Specifically, homocysteine may impair physical function through mechanisms such as increasing the concentration of reactive oxygen species and reducing the bioavailability of nitric oxide [55].
In the results of sex stratification, we only found negative associations between serum folate and the risk of functional disability in females. The first possible reason may be that the improvement of serum folate on biomarkers in the antioxidant defense system varies by gender. A meta-analysis found that short-term folate supplementation significantly increased serum GSH concentration in females, but this effect was not observed in males [13]. Second, Larry A. Tucker analyzed data from NHANES and suggested that women with low folate levels were more prone to have telomere shortening and cell aging, but no such association was found in men [56]. An animal experiment showed that transplanting aging cells into young mice could cause continuous physical dysfunction [57]. Another possible reason for the significant gender differences may be as stated above. Third, many studies have shown that homocysteine levels tend to be higher in males than in females [58,59,60]. In addition to folate, homocysteine levels are influenced by other factors, such as sex hormones [61,62]. Finally, sex differences in folate metabolism may also be a possible cause [63]. Additionally, other subgroup analyses found that the associations of higher serum folate with decreased risk of disability in IADL and GPA were mainly in the population under 80 years old, normal weight, and non-drinkers. To our knowledge, several studies have suggested that age and obesity were possible risk factors for functional disability [64,65,66]. Therefore, we speculate that the detrimental effects of age and obesity might counteract the beneficial effects of folate on functional disability. In addition, studies have shown that alcohol consumption may interfere with the absorption and action of folate [67,68], which may partly attenuate the beneficial effects of folate. Further studies are necessary to understand the possible biological mechanisms underlying subgroup differences in this association.
It is worth noting that studies have shown that poor diet and poor appetite are the main causes of folate deficiency [69,70], Poor absorption owing to gastrointestinal dysfunction/disease can also result in folate deficiency [71,72]. The physiological process of aging makes older adults more susceptible to these nutritional problems, such as poor taste, loss of appetite, and gastrointestinal malabsorption [73]. Older adults tend to have a higher prevalence of folate deficiency [74]. In addition, poor diet and malabsorption may cause or contribute to the deterioration of physical, intellectual, or mental function and then generate a series of functional impairments and even disabilities [75]. Therefore, we recommend appropriately increasing the intake of folate-rich foods, especially in the older population with poor diet and gastrointestinal dysfunction/disease.
The present study has several advantages. First, we conducted the study using NHANES data, which employs a complex sampling design and stringent quality control to obtain representative samples of American residents, lending credibility to our findings. Second, the relationship between 5-MTHF (the primary biological activity form of serum folate) and functional disability was examined in our study for the first time. Third, we evaluated multiple domains of functional disability. In addition, we further explored the dose–response relationships between serum folate concentrations and functional disability. However, we must acknowledge that our research has the following flaws. First, this study was a cross-sectional study, and causality cannot be inferred. Second, although we referred to previous studies [10,35,37] and used 19 well-validated questions of physical function to define functional disability, but functional disability was defined by self-reported questionnaires rather than objective measurements of physical function, which may lead to recall bias and influence the accuracy of participants’ physical function status. While some studies have shown a high correlation between self-reported physical function and objective physical function measures [76,77]. Third, although we evaluated as many different domains of functional disability as possible, there are still some types of disability that are not considered, such as vision loss and hearing loss. Fourth, although we carefully adjusted the potential confounding factors, residual confounding may still exist. In addition, considering that the use of a single indicator, such as serum creatinine, is insufficient to diagnose kidney disease [78], our study did not exclude participants with kidney dysfunction/disease. Since kidney function strongly affected homocysteine levels [79], participants with kidney dysfunction/disease may have influenced the results. Finally, our study focused on older adults aged 60 and over in the US. Given the disparities in serum folate levels and functional disability prevalence rates across countries and ages, the current findings should be applied with caution to other age and region groups.

5. Conclusions

Our results indicated that serum folate concentrations were negatively associated with IADL and GPA disability, especially in females. In other subgroup analyses, we found that these negative associations primarily occurred in participants under 80 years old, normal weight, and non-drinkers. Further longitudinal studies and biological mechanism research should be conducted to confirm our findings.

Supplementary Materials

The following supporting information can be downloaded at: https://www.mdpi.com/article/10.3390/antiox12030619/s1, Figure S1. Subgroup analyses of the relationships (multivariate-adjusted odds ratios and 95% confidence intervals) between total folate and the risk of IADL disability (a) and GPA disability (b); Figure S2. (a) Examination of the dose–response relationship between total folate and IADL disability (p for non-linearity = 0.296); (b) examination of the dose–response relationship between total folate and GPA disability (p for non-linearity = 0.154); (c) examination of the dose–response relationship between total folate and IADL disability in females (p for non-linearity = 0.047); (d) examination of the dose–response relationship between total folate and GPA disability in females (p for non-linearity = 0.345). The solid line and dashed lines represent the estimated odds ratios and the 95% confidence intervals; Table S1. Questions about self-reported functional disability; Table S2. The classifications of covariates; Table S3. Characteristics of participants by LEM, ADL, and LSA disability, NHANES 2011–2018 (n = 5850); Table S4. Comparison of several serum folate concentrations by sex; Table S5. Weighted odds ratios (95% confidence intervals) for all domains of functional disability across quartiles of total folate; Table S6. Weighted odds ratios (95% confidence intervals) for all domains of functional disability across quartiles of total folate in females; Table S7. Weighted odds ratios (95% confidence intervals) for all domains of functional disability across quartiles of 5-Methyltetrahydrofolate in males; Table S8. Weighted odds ratios (95% confidence intervals) for all domains of functional disability across quartiles of total folate in males; Table S9. Sensitivity analyses of weighted odds ratios (95% confidence intervals) for functional disability across quartiles of combined total folate; Table S10. Sensitivity analyses of weighted odds ratios (95% confidence intervals) for functional disability across quartiles of serum folate after excluding participants using antibiotics, estrogens, and anticonvulsants; Table S11. Sensitivity analyses of weighted odds ratios (95% confidence intervals) for functional disability across quartiles of serum folate after excluding participants suffering from malnutrition [80]; Table S12. Sensitivity analyses of weighted odds ratios (95% confidence intervals) for functional disability across quartiles of dietary folate intake; Table S13. Sensitivity analyses of the association between folate supplement users and non-supplement users with functional disability.

Author Contributions

Conceptualization, L.J. and D.Z.; methodology, L.J., T.Z., and L.Z.; data curation, L.J. and T.Z.; writing—original draft preparation, L.J.; writing—review and editing, L.J., T.Z., and D.Z.; and supervision, D.Z. All authors have read and agreed to the published version of the manuscript.

Funding

This research received no external funding.

Institutional Review Board Statement

The study was conducted according to the guidelines of the Declaration of Helsinki and approved by the Research Ethics Review Board of the National Center for Health Statistics (Protocol #2011-17, Protocol #2018-01).

Informed Consent Statement

Informed consent was obtained from all subjects involved in the study.

Data Availability Statement

The raw data that support the findings of this study are available from the National Health and Nutrition Examination Survey: https://www.cdc.gov/nchs/nhanes/index.htm (accessed on 10 November 2022).

Acknowledgments

The American Centers for Disease Control and Prevention conducted the survey and made it freely available online; the authors are grateful to all of the participants for giving these data.

Conflicts of Interest

The authors declare no conflict of interest.

References

  1. Verbrugge, L.M.; Jette, A.M. The disablement process. Soc. Sci. Med. 1994, 38, 1–14. [Google Scholar] [CrossRef] [PubMed] [Green Version]
  2. Santos, V.S.; Oliveira, L.S.; Castro, F.D.; Gois-Santos, V.T.; Lemos, L.M.; Ribeiro Mdo, C.; Cuevas, L.E.; Gurgel, R.Q. Functional Activity Limitation and Quality of Life of Leprosy Cases in an Endemic Area in Northeastern Brazil. PLoS Negl. Trop. Dis. 2015, 9, e0003900. [Google Scholar] [CrossRef] [PubMed] [Green Version]
  3. Kelley, A.S.; Ettner, S.L.; Morrison, R.S.; Du, Q.; Sarkisian, C.A. Disability and decline in physical function associated with hospital use at end of life. J. Gen. Intern. Med. 2012, 27, 794–800. [Google Scholar] [CrossRef] [PubMed] [Green Version]
  4. Wu, L.W.; Chen, W.L.; Peng, T.C.; Chiang, S.T.; Yang, H.F.; Sun, Y.S.; Chan, J.Y.; Kao, T.W. All-cause mortality risk in elderly individuals with disabilities: A retrospective observational study. BMJ Open 2016, 6, e011164. [Google Scholar] [CrossRef] [PubMed] [Green Version]
  5. Rowe, J.W.; Fulmer, T.; Fried, L. Preparing for Better Health and Health Care for an Aging Population. JAMA 2016, 316, 1643–1644. [Google Scholar] [CrossRef] [PubMed]
  6. Courtney-Long, E.A.; Carroll, D.D.; Zhang, Q.C.; Stevens, A.C.; Griffin-Blake, S.; Armour, B.S.; Campbell, V.A. Prevalence of Disability and Disability Type Among Adults--United States, 2013. MMWR Morb. Mortal. Wkly. Rep. 2015, 64, 777–783. [Google Scholar] [CrossRef] [PubMed]
  7. Seeman, T.E.; Merkin, S.S.; Crimmins, E.M.; Karlamangla, A.S. Disability trends among older Americans: National Health And Nutrition Examination Surveys, 1988–1994 and 1999–2004. Am. J. Public Health 2010, 100, 100–107. [Google Scholar] [CrossRef]
  8. Agarwal, P.; Wang, Y.; Buchman, A.S.; Bennett, D.A.; Morris, M.C. Dietary Patterns and Self-reported Incident Disability in Older Adults. J. Gerontol. Ser. A Biol. Sci. Med. Sci. 2019, 74, 1331–1337. [Google Scholar] [CrossRef]
  9. Krok-Schoen, J.L.; Archdeacon Price, A.; Luo, M.; Kelly, O.J.; Taylor, C.A. Low Dietary Protein Intakes and Associated Dietary Patterns and Functional Limitations in an Aging Population: A NHANES analysis. J. Nutr. Health Aging 2019, 23, 338–347. [Google Scholar] [CrossRef] [Green Version]
  10. Wang, T.; Wu, Y.; Wang, W.; Zhang, D. Association between coffee consumption and functional disability in older US adults. Br. J. Nutr. 2021, 125, 695–702. [Google Scholar] [CrossRef]
  11. Shea, M.K.; Kritchevsky, S.B.; Loeser, R.F.; Booth, S.L. Vitamin K Status and Mobility Limitation and Disability in Older Adults: The Health, Aging, and Body Composition Study. J. Gerontol. Ser. A Biol. Sci. Med. Sci. 2020, 75, 792–797. [Google Scholar] [CrossRef] [PubMed]
  12. García-Esquinas, E.; Carrasco-Rios, M.; Ortolá, R.; Sotos Prieto, M.; Pérez-Gómez, B.; Gutiérrez-González, E.; Banegas, J.R.; Queipo, R.; Olmedo, P.; Gil, F.; et al. Selenium and impaired physical function in US and Spanish older adults. Redox Biol. 2021, 38, 101819. [Google Scholar] [CrossRef] [PubMed]
  13. Asbaghi, O.; Ghanavati, M.; Ashtary-Larky, D.; Bagheri, R.; Rezaei Kelishadi, M.; Nazarian, B.; Nordvall, M.; Wong, A.; Dutheil, F.; Suzuki, K.; et al. Effects of Folic Acid Supplementation on Oxidative Stress Markers: A Systematic Review and Meta-Analysis of Randomized Controlled Trials. Antioxidants 2021, 10, 871. [Google Scholar] [CrossRef] [PubMed]
  14. Semba, R.D.; Ferrucci, L.; Sun, K.; Walston, J.; Varadhan, R.; Guralnik, J.M.; Fried, L.P. Oxidative stress and severe walking disability among older women. Am. J. Med. 2007, 120, 1084–1089. [Google Scholar] [CrossRef] [Green Version]
  15. Lyon, P.; Strippoli, V.; Fang, B.; Cimmino, L. B Vitamins and One-Carbon Metabolism: Implications in Human Health and Disease. Nutrients 2020, 12, 2867. [Google Scholar] [CrossRef]
  16. Selhub, J. Homocysteine metabolism. Annu. Rev. Nutr. 1999, 19, 217–246. [Google Scholar] [CrossRef] [Green Version]
  17. Kuo, H.K.; Liao, K.C.; Leveille, S.G.; Bean, J.F.; Yen, C.J.; Chen, J.H.; Yu, Y.H.; Tai, T.Y. Relationship of homocysteine levels to quadriceps strength, gait speed, and late-life disability in older adults. J. Gerontol. Ser. A Biol. Sci. Med. Sci. 2007, 62, 434–439. [Google Scholar] [CrossRef] [Green Version]
  18. Swart, K.M.; van Schoor, N.M.; Heymans, M.W.; Schaap, L.A.; den Heijer, M.; Lips, P. Elevated homocysteine levels are associated with low muscle strength and functional limitations in older persons. J. Nutr. Health Aging 2013, 17, 578–584. [Google Scholar] [CrossRef]
  19. Struijk, E.A.; Lana, A.; Guallar-Castillón, P.; Rodríguez-Artalejo, F.; Lopez-Garcia, E. Intake of B vitamins and impairment in physical function in older adults. Clin. Nutr. 2018, 37, 1271–1278. [Google Scholar] [CrossRef]
  20. Behrouzi, P.; Grootswagers, P.; Keizer, P.L.C.; Smeets, E.; Feskens, E.J.M.; de Groot, L.; van Eeuwijk, F.A. Dietary Intakes of Vegetable Protein, Folate, and Vitamins B-6 and B-12 Are Partially Correlated with Physical Functioning of Dutch Older Adults Using Copula Graphical Models. J. Nutr. 2020, 150, 634–643. [Google Scholar] [CrossRef] [Green Version]
  21. Swart, K.M.; Ham, A.C.; van Wijngaarden, J.P.; Enneman, A.W.; van Dijk, S.C.; Sohl, E.; Brouwer-Brolsma, E.M.; van der Zwaluw, N.L.; Zillikens, M.C.; Dhonukshe-Rutten, R.A.; et al. A Randomized Controlled Trial to Examine the Effect of 2-Year Vitamin B12 and Folic Acid Supplementation on Physical Performance, Strength, and Falling: Additional Findings from the B-PROOF Study. Calcif. Tissue Int. 2016, 98, 18–27. [Google Scholar] [CrossRef] [PubMed] [Green Version]
  22. Chan, Y.M.; Bailey, R.; O’Connor, D.L. Folate. Adv. Nutr. (Bethesda Md.) 2013, 4, 123–125. [Google Scholar] [CrossRef] [PubMed] [Green Version]
  23. Ng, T.P.; Aung, K.C.; Feng, L.; Scherer, S.C.; Yap, K.B. Homocysteine, folate, vitamin B-12, and physical function in older adults: Cross-sectional findings from the Singapore Longitudinal Ageing Study. Am. J. Clin. Nutr. 2012, 96, 1362–1368. [Google Scholar] [CrossRef] [PubMed] [Green Version]
  24. Ortega, R.M.; Mañas, L.R.; Andrés, P.; Gaspar, M.J.; Agudo, F.R.; Jiménez, A.; Pascual, T. Functional and psychic deterioration in elderly people may be aggravated by folate deficiency. J. Nutr. 1996, 126, 1992–1999. [Google Scholar] [CrossRef] [PubMed]
  25. Bartali, B.; Frongillo, E.A.; Guralnik, J.M.; Stipanuk, M.H.; Allore, H.G.; Cherubini, A.; Bandinelli, S.; Ferrucci, L.; Gill, T.M. Serum micronutrient concentrations and decline in physical function among older persons. JAMA 2008, 299, 308–315. [Google Scholar] [CrossRef] [Green Version]
  26. Centers for Disease Control and Prevention. National Health and Nutrition Examination Survey. Available online: https://www.cdc.gov/nchs/nhanes/ (accessed on 2 December 2022).
  27. Luo, J.; Ge, H.; Sun, J.; Hao, K.; Yao, W.; Zhang, D. Associations of Dietary ω-3, ω-6 Fatty Acids Consumption with Sleep Disorders and Sleep Duration among Adults. Nutrients 2021, 13, 1475. [Google Scholar] [CrossRef]
  28. National Health and Nutrition Examination Survey. 2011-2012 Data Documentation, Codebook, and Frequencies. Folate Forms—Total & Individual—Serum (FOLFMS_G). Available online: https://wwwn.cdc.gov/Nchs/Nhanes/2011-2012/FOLFMS_G.htm (accessed on 2 December 2022).
  29. Fazili, Z.; Sternberg, M.R.; Potischman, N.; Wang, C.Y.; Storandt, R.J.; Yeung, L.; Yamini, S.; Gahche, J.J.; Juan, W.; Qi, Y.P.; et al. Demographic, Physiologic, and Lifestyle Characteristics Observed with Serum Total Folate Differ Among Folate Forms: Cross-Sectional Data from Fasting Samples in the NHANES 2011–2016. J. Nutr. 2020, 150, 851–860. [Google Scholar] [CrossRef] [Green Version]
  30. Pfeiffer, C.M.; Sternberg, M.R.; Fazili, Z.; Lacher, D.A.; Zhang, M.; Johnson, C.L.; Hamner, H.C.; Bailey, R.L.; Rader, J.I.; Yamini, S.; et al. Folate status and concentrations of serum folate forms in the US population: National Health and Nutrition Examination Survey 2011–2012. Br. J. Nutr. 2015, 113, 1965–1977. [Google Scholar] [CrossRef] [Green Version]
  31. Hannisdal, R.; Ueland, P.M.; Svardal, A. Liquid chromatography-tandem mass spectrometry analysis of folate and folate catabolites in human serum. Clin. Chem. 2009, 55, 1147–1154. [Google Scholar] [CrossRef] [Green Version]
  32. Zhang, L.; Sun, J.; Li, Z.; Zhang, D. The relationship between serum folate and grip strength in American adults. Arch. Osteoporos. 2021, 16, 97. [Google Scholar] [CrossRef]
  33. National Health and Nutrition Examination Survey. 2011-2012 Data Documentation, Codebook, and Frequencies. Physical Functioning (PFQ_G). Available online: https://wwwn.cdc.gov/Nchs/Nhanes/2011-2012/PFQ_G.htm (accessed on 2 December 2022).
  34. Chen, Y.Y.; Wang, C.C.; Kao, T.W.; Wu, C.J.; Chen, Y.J.; Lai, C.H.; Zhou, Y.C.; Chen, W.L. The relationship between lead and cadmium levels and functional dependence among elderly participants. Environ. Sci. Pollut. Res. Int. 2020, 27, 5932–5940. [Google Scholar] [CrossRef] [PubMed]
  35. Kalyani, R.R.; Saudek, C.D.; Brancati, F.L.; Selvin, E. Association of diabetes, comorbidities, and A1C with functional disability in older adults: Results from the National Health and Nutrition Examination Survey (NHANES), 1999–2006. Diabetes Care 2010, 33, 1055–1060. [Google Scholar] [CrossRef] [PubMed] [Green Version]
  36. Schneider, A.L.C.; Wang, D.; Gottesman, R.F.; Selvin, E. Prevalence of Disability Associated With Head Injury With Loss of Consciousness in Adults in the United States: A Population-Based Study. Neurology 2021, 97, e124–e135. [Google Scholar] [CrossRef] [PubMed]
  37. Chen, H.; Guo, X. Obesity and functional disability in elderly Americans. J. Am. Geriatr. Soc. 2008, 56, 689–694. [Google Scholar] [CrossRef] [Green Version]
  38. Liu, M.; Zhang, Z.; Zhou, C.; Li, Q.; He, P.; Zhang, Y.; Li, H.; Liu, C.; Liang, M.; Wang, X.; et al. Relationship of several serum folate forms with the risk of mortality: A prospective cohort study. Clin. Nutr. 2021, 40, 4255–4262. [Google Scholar] [CrossRef]
  39. Liu, M.; Zhou, C.; Zhang, Z.; Li, Q.; He, P.; Zhang, Y.; Li, H.; Liu, C.; Fan Hou, F.; Qin, X. Relationship of several serum folate forms with kidney function and albuminuria: Cross-sectional data from the National Health and Nutrition Examination Surveys (NHANES) 2011–2018. Br. J. Nutr. 2022, 127, 1050–1059. [Google Scholar] [CrossRef]
  40. Gana, W.; De Luca, A.; Debacq, C.; Poitau, F.; Poupin, P.; Aidoud, A.; Fougère, B. Analysis of the Impact of Selected Vitamins Deficiencies on the Risk of Disability in Older People. Nutrients 2021, 13, 3163. [Google Scholar] [CrossRef]
  41. Novochadlo, M.; Goldim, M.P.; Bonfante, S.; Joaquim, L.; Mathias, K.; Metzker, K.; Machado, R.S.; Lanzzarin, E.; Bernades, G.; Bagio, E.; et al. Folic acid alleviates the blood brain barrier permeability and oxidative stress and prevents cognitive decline in sepsis-surviving rats. Microvasc. Res. 2021, 137, 104193. [Google Scholar] [CrossRef]
  42. Bartali, B.; Curto, T.; Maserejian, N.N.; Araujo, A.B. Intake of antioxidants and subsequent decline in physical function in a racially/ethnically diverse population. J. Nutr. Health Aging 2015, 19, 542–547. [Google Scholar] [CrossRef]
  43. Bahmani, F.; Karamali, M.; Shakeri, H.; Asemi, Z. The effects of folate supplementation on inflammatory factors and biomarkers of oxidative stress in overweight and obese women with polycystic ovary syndrome: A randomized, double-blind, placebo-controlled clinical trial. Clin. Endocrinol. 2014, 81, 582–587. [Google Scholar] [CrossRef]
  44. Shidfar, F.; Homayounfar, R.; Fereshtehnejad, S.M.; Kalani, A. Effect of folate supplementation on serum homocysteine and plasma total antioxidant capacity in hypercholesterolemic adults under lovastatin treatment: A double-blind randomized controlled clinical trial. Arch. Med. Res. 2009, 40, 380–386. [Google Scholar] [CrossRef] [PubMed]
  45. Padmanabhan, S.; Waly, M.I.; Taranikanti, V.; Guizani, N.; Ali, A.; Rahman, M.S.; Al-Attabi, Z.; Al-Malky, R.N.; Al-Maskari, S.N.M.; Al-Ruqaishi, B.R.S.; et al. Folate/Vitamin B12 Supplementation Combats Oxidative Stress-Associated Carcinogenesis in a Rat Model of Colon Cancer. Nutr. Cancer 2019, 71, 100–110. [Google Scholar] [CrossRef] [PubMed]
  46. Wijerathne, C.U.B.; Au-Yeung, K.K.W.; Siow, Y.L.; O, K. 5-Methyltetrahydrofolate Attenuates Oxidative Stress and Improves Kidney Function in Acute Kidney Injury through Activation of Nrf2 and Antioxidant Defense. Antioxidants 2022, 11, 1046. [Google Scholar] [CrossRef]
  47. Asbaghi, O.; Ashtary-Larky, D.; Bagheri, R.; Moosavian, S.P.; Nazarian, B.; Afrisham, R.; Kelishadi, M.R.; Wong, A.; Dutheil, F.; Suzuki, K.; et al. Effects of Folic Acid Supplementation on Inflammatory Markers: A Grade-Assessed Systematic Review and Dose-Response Meta-Analysis of Randomized Controlled Trials. Nutrients 2021, 13, 2327. [Google Scholar] [CrossRef] [PubMed]
  48. Wang, T.; Jiang, H.; Wu, Y.; Wang, W.; Zhang, D. The association between Dietary Inflammatory Index and disability in older adults. Clin. Nutr. 2021, 40, 2285–2292. [Google Scholar] [CrossRef] [PubMed]
  49. Penninx, B.W.; Kritchevsky, S.B.; Newman, A.B.; Nicklas, B.J.; Simonsick, E.M.; Rubin, S.; Nevitt, M.; Visser, M.; Harris, T.; Pahor, M. Inflammatory markers and incident mobility limitation in the elderly. J. Am. Geriatr. Soc. 2004, 52, 1105–1113. [Google Scholar] [CrossRef]
  50. Zhang, Z.H.; Cao, X.C.; Peng, J.Y.; Huang, S.L.; Chen, C.; Jia, S.Z.; Ni, J.Z.; Song, G.L. Reversal of Lipid Metabolism Dysregulation by Selenium and Folic Acid Co-Supplementation to Mitigate Pathology in Alzheimer’s Disease. Antioxidants 2022, 11, 829. [Google Scholar] [CrossRef]
  51. Froese, D.S.; Fowler, B.; Baumgartner, M.R. Vitamin B(12), folate, and the methionine remethylation cycle-biochemistry, pathways, and regulation. J. Inherit. Metab. Dis. 2019, 42, 673–685. [Google Scholar] [CrossRef] [PubMed] [Green Version]
  52. Reynolds, E. Vitamin B12, folic acid, and the nervous system. Lancet. Neurol. 2006, 5, 949–960. [Google Scholar] [CrossRef]
  53. Kado, D.M.; Bucur, A.; Selhub, J.; Rowe, J.W.; Seeman, T. Homocysteine levels and decline in physical function: MacArthur Studies of Successful Aging. Am. J. Med. 2002, 113, 537–542. [Google Scholar] [CrossRef]
  54. Rolita, L.; Holtzer, R.; Wang, C.; Lipton, R.B.; Derby, C.A.; Verghese, J. Homocysteine and mobility in older adults. J. Am. Geriatr. Soc. 2010, 58, 545–550. [Google Scholar] [CrossRef] [Green Version]
  55. Veeranki, S.; Tyagi, S.C. Defective homocysteine metabolism: Potential implications for skeletal muscle malfunction. Int. J. Mol. Sci. 2013, 14, 15074–15091. [Google Scholar] [CrossRef] [Green Version]
  56. Tucker, L.A. Serum and Dietary Folate and Vitamin B(12) Levels Account for Differences in Cellular Aging: Evidence Based on Telomere Findings in 5581 U.S. Adults. Oxidative Med. Cell. Longev. 2019, 2019, 4358717. [Google Scholar] [CrossRef] [Green Version]
  57. Xu, M.; Pirtskhalava, T.; Farr, J.N.; Weigand, B.M.; Palmer, A.K.; Weivoda, M.M.; Inman, C.L.; Ogrodnik, M.B.; Hachfeld, C.M.; Fraser, D.G.; et al. Senolytics improve physical function and increase lifespan in old age. Nat. Med. 2018, 24, 1246–1256. [Google Scholar] [CrossRef]
  58. Xu, R.; Huang, F.; Wang, Y.; Liu, Q.; Lv, Y.; Zhang, Q. Gender- and age-related differences in homocysteine concentration: A cross-sectional study of the general population of China. Sci. Rep. 2020, 10, 17401. [Google Scholar] [CrossRef]
  59. Cohen, E.; Margalit, I.; Shochat, T.; Goldberg, E.; Krause, I. Gender differences in homocysteine concentrations, a population-based cross-sectional study. Nutr. Metab. Cardiovasc. Dis. NMCD 2019, 29, 9–14. [Google Scholar] [CrossRef]
  60. Dierkes, J.; Jeckel, A.; Ambrosch, A.; Westphal, S.; Luley, C.; Boeing, H. Factors explaining the difference of total homocysteine between men and women in the European Investigation Into Cancer and Nutrition Potsdam study. Metab. Clin. Exp. 2001, 50, 640–645. [Google Scholar] [CrossRef]
  61. Prudova, A.; Albin, M.; Bauman, Z.; Lin, A.; Vitvitsky, V.; Banerjee, R. Testosterone regulation of homocysteine metabolism modulates redox status in human prostate cancer cells. Antioxid. Redox Signal. 2007, 9, 1875–1881. [Google Scholar] [CrossRef]
  62. Gaikwad, N.W. Mass spectrometry evidence for formation of estrogen-homocysteine conjugates: Estrogens can regulate homocysteine levels. Free Radic. Biol. Med. 2013, 65, 1447–1454. [Google Scholar] [CrossRef]
  63. Wu, Y.; Tomon, M.; Sumino, K. Methylenetetrahydrofolate reductase gene polymorphism and ischemic stroke: Sex difference in Japanese. Kobe J. Med. Sci. 2001, 47, 255–262. [Google Scholar]
  64. Cheng, F.W.; Gao, X.; Bao, L.; Mitchell, D.C.; Wood, C.; Sliwinski, M.J.; Smiciklas-Wright, H.; Still, C.D.; Rolston, D.D.K.; Jensen, G.L. Obesity as a risk factor for developing functional limitation among older adults: A conditional inference tree analysis. Obes. (Silver Spring Md.) 2017, 25, 1263–1269. [Google Scholar] [CrossRef] [PubMed] [Green Version]
  65. Lynch, D.H.; Petersen, C.L.; Fanous, M.M.; Spangler, H.B.; Kahkoska, A.R.; Jimenez, D.; Batsis, J.A. The relationship between multimorbidity, obesity and functional impairment in older adults. J. Am. Geriatr. Soc. 2022, 70, 1442–1449. [Google Scholar] [CrossRef] [PubMed]
  66. An, R.; Shi, Y. Body weight status and onset of functional limitations in U.S. middle-aged and older adults. Disabil. Health J. 2015, 8, 336–344. [Google Scholar] [CrossRef] [PubMed]
  67. Biswas, A.; Senthilkumar, S.R.; Said, H.M. Effect of chronic alcohol exposure on folate uptake by liver mitochondria. Am. J. Physiol. Cell Physiol. 2012, 302, C203–C209. [Google Scholar] [CrossRef] [Green Version]
  68. Eichner, E.R.; Hillman, R.S. Effect of alcohol on serum folate level. J. Clin. Investig. 1973, 52, 584–591. [Google Scholar] [CrossRef] [Green Version]
  69. Hanger, H.C.; Sainsbury, R.; Gilchrist, N.L.; Beard, M.E.; Duncan, J.M. A community study of vitamin B12 and folate levels in the elderly. J. Am. Geriatr. Soc. 1991, 39, 1155–1159. [Google Scholar] [CrossRef]
  70. Vinker, S.; Krantman, E.; Shani, M.; Nakar, S. Low clinical utility of folate determinations in primary care setting. Am. J. Manag. Care 2013, 19, e100–e105. [Google Scholar]
  71. Rosenberg, I.H.; Bowman, B.B.; Cooper, B.A.; Halsted, C.H.; Lindenbaum, J. Folate nutrition in the elderly. Am. J. Clin. Nutr. 1982, 36, 1060–1066. [Google Scholar] [CrossRef]
  72. Allen, L.H. Causes of vitamin B12 and folate deficiency. Food Nutr. Bull. 2008, 29, S20–S34; discussion S35–S37. [Google Scholar] [CrossRef] [Green Version]
  73. Norman, K.; Haß, U.; Pirlich, M. Malnutrition in Older Adults-Recent Advances and Remaining Challenges. Nutrients 2021, 13, 2764. [Google Scholar] [CrossRef]
  74. Ortega, R.M.; Redondo, R.; Andres, P.; Eguileor, I. Nutritional assessment of folate and cyanocobalamin status in a Spanish elderly group. Int. J. Vitam. Nutr. Res. Int. Z. Fur Vitam.—Und Ernahrungsforschung. J. Int. De Vitaminol. Et De Nutr. 1993, 63, 17–21. [Google Scholar]
  75. Groce, N.; Challenger, E.; Berman-Bieler, R.; Farkas, A.; Yilmaz, N.; Schultink, W.; Clark, D.; Kaplan, C.; Kerac, M. Malnutrition and disability: Unexplored opportunities for collaboration. Paediatr. Int. Child Health 2014, 34, 308–314. [Google Scholar] [CrossRef] [PubMed] [Green Version]
  76. Kuo, H.K.; Leveille, S.G.; Yen, C.J.; Chai, H.M.; Chang, C.H.; Yeh, Y.C.; Yu, Y.H.; Bean, J.F. Exploring how peak leg power and usual gait speed are linked to late-life disability: Data from the National Health and Nutrition Examination Survey (NHANES), 1999-2002. Am. J. Phys. Med. Rehabil. 2006, 85, 650–658. [Google Scholar] [CrossRef] [PubMed] [Green Version]
  77. Kuo, H.K.; Leveille, S.G.; Yu, Y.H.; Milberg, W.P. Cognitive function, habitual gait speed, and late-life disability in the National Health and Nutrition Examination Survey (NHANES) 1999–2002. Gerontology 2007, 53, 102–110. [Google Scholar] [CrossRef] [PubMed] [Green Version]
  78. Sanders, A.P.; Mazzella, M.J.; Malin, A.J.; Hair, G.M.; Busgang, S.A.; Saland, J.M.; Curtin, P. Combined exposure to lead, cadmium, mercury, and arsenic and kidney health in adolescents age 12–19 in NHANES 2009-2014. Environ. Int. 2019, 131, 104993. [Google Scholar] [CrossRef] [PubMed]
  79. Gale, C.R.; Ashurst, H.; Phillips, N.J.; Moat, S.J.; Bonham, J.R.; Martyn, C.N. Renal function, plasma homocysteine and carotid atherosclerosis in elderly people. Atherosclerosis 2001, 154, 141–146. [Google Scholar] [CrossRef]
  80. Garg, A.X.; Blake, P.G.; Clark, W.F.; Clase, C.M.; Haynes, R.B.; Moist, L.M. Association between renal insufficiency and malnutrition in older adults: Results from the NHANES III. Kidney Int. 2001, 60, 1867–1874. [Google Scholar] [CrossRef] [Green Version]
Figure 1. Flowchart of the screening process for the selection of eligible participants.
Antioxidants 12 00619 g001
Figure 2. Subgroup analyses of the relationships (multivariate-adjusted odds ratios and 95% confidence intervals) between 5-Methyltetrahydrofolate and the risk of IADL disability (a) and GPA disability (b).
Antioxidants 12 00619 g002
Figure 3. (a) Examination of the dose–response relationship between 5-Methyltetrahydrofolate and IADL disability (p for non-linearity = 0.131); (b) examination of the dose–response relationship between 5-Methyltetrahydrofolate and GPA disability (p for non-linearity = 0.083); (c) examination of the dose–response relationship between 5-Methyltetrahydrofolate and IADL disability in females (p for non-linearity = 0.015); (d) examination of the dose–response relationship between 5-Methyltetrahydrofolate and GPA disability in females (p for non-linearity = 0.21). The solid line and dashed lines represent the estimated odds ratios and the 95% confidence intervals.
Antioxidants 12 00619 g003aAntioxidants 12 00619 g003b
Table 1. Characteristics of participants by IADL and GPA disability, NHANES 2011–2018 (n = 5850).
CharacteristicsWith IADL DisabilityWithout IADL Disabilityp ValueWith GPA DisabilityWithout GPA Disabilityp Value
Number of participants, n (%)1703 (29.11)4147 (70.89) 3699 (63.23)2151 (36.77)
Age (year), n (%) a <0.001 <0.001
60–69764 (42.37)2269 (57.89) 1717 (47.32)1316 (64.98)
70–79502 (31.94)1220 (28.81) 1125 (31.79)597 (25.91)
≥80437 (25.69)658 (13.29) 857 (20.89)238 (9.11)
Sex, n (%) a <0.001 <0.001
Female1002 (65.70)1944 (50.29) 2054 (59.94)892 (44.74)
Male701 (34.30)2203 (49.71) 1645 (40.06)1259 (55.26)
Race/ethnicity, n (%) a <0.001 0.898
Mexican American218 (5.25)464 (3.77) 422 (4.17)260 (4.16)
Other Hispanic192 (4.80)447 (3.61) 400 (4.10)239 (3.63)
Non-Hispanic White741 (71.10)1833 (78.18) 1732 (76.21)842 (76.45)
Non-Hispanic Black382 (10.64)899 (7.84) 768 (8.57)513 (8.61)
Other races170 (8.21)504 (6.59) 377 (6.95)297 (7.16)
Educational level, n (%) a <0.001 <0.001
Below high school593 (22.44)1039 (13.75) 1124 (18.52)508 (11.78)
High school412 (27.71)934 (23.35) 896 (25.94)450 (22.02)
Above high school693 (49.85)2170 (62.91) 1671 (55.54)1192 (66.20)
Marital status, n (%) a <0.001 <0.001
Not living alone785 (52.76)2538 (66.79) 1913 (58.33)1410 (71.29)
Living alone916 (47.24)1605 (33.21) 1781 (41.67)740 (28.71)
Poverty–income ratio, n (%) a <0.001 <0.001
<1402 (14.91)596 (7.43) 731 (11.45)267 (5.89)
≥11301 (85.09)3551 (92.57) 2968 (88.55)1884 (94.11)
Physical activity, n (%) a <0.001 <0.001
Low1149 (63.24)1927 (41.81) 2244 (54.80)832 (34.78)
High540 (36.76)2205 (58.19) 1433 (45.20)1312 (65.22)
Body mass index, n (%) a <0.001 <0.001
<25 kg/m2371 (21.73)1086 (24.08) 785 (19.79)672 (29.77)
25 to <30 kg/m2491 (30.30)1579 (38.68) 1208 (33.55)862 (41.57)
≥30 kg/m2769 (47.98)1445 (37.24) 1608 (46.66)606 (28.67)
Smoking status, n (%) a899 (53.44)2008 (48.43)0.0431931 (51.79)976 (46.24)0.007
Alcohol consumption, n (%) a281 (20.23)554 (15.01)0.011584 (17.52)251 (14.31)0.077
Hypertension, n (%) a1448 (83.98)3241 (74.40)<0.0013058 (79.81)1631 (71.97)<0.001
Diabetes, n (%) a602 (27.50)1002 (19.88)<0.0011162 (24.95)442 (16.61)<0.001
Arthritis, n (%) a1151 (72.22)1753 (45.62)<0.0012286 (64.25)618 (32.57)<0.001
Stroke, n (%) a263 (13.09)218 (4.83)<0.001392 (9.07)89 (3.46)<0.001
Gout, n (%) a209 (12.12)340 (8.99)0.005407 (10.72)142 (8.26)0.068
Cancer, n (%) a373 (27.26)811 (24.29)0.154827 (27.28)357 (21.25)0.001
Congestive heart failure, n (%) a230 (10.59)202 (4.64)<0.001372 (7.93)60 (3.25)<0.001
Coronary heart disease, n (%) a245 (14.33)339 (9.10)<0.001443 (11.91)141 (8.02)0.007
Angina, n (%) a145 (8.76)171 (4.32)0.002260 (7.02)56 (2.86)0.002
Asthma, n (%) a326 (20.44)489 (12.24)<0.001615 (16.82)200 (10.23)<0.001
Chronic bronchitis, n (%) a214 (14.60)215 (6.57)<0.001369 (11.54)60 (3.76)<0.001
Emphysema, n (%) a125 (8.67)109 (2.80)<0.001200 (5.93)34 (1.63)<0.001
Total energy intake (kcal/day), median (IQR) b1670.8 (835.5)1765 (858.5)<0.0011702.5 (832)1800.5 (877)<0.001
Total folate (nmol/L), median (IQR) b41.8 (40.7)45.4 (39.6)0.00244.1 (41.1)45.1 (37.8)0.412
5-Methyltetrahydrofolate (nmol/L), median (IQR) b39.2 (38)43.1 (37.7)<0.00141.2 (38.9)42.6 (35.9)0.227
Data are the number of participants (weighted percentage) or medians (interquartile ranges). IADL, instrumental activities of daily living; GPA, general physical activities. a Chi-square test was used to compare the percentage between participants with and without functional disability. b Mann–Whitney U test was used to compare the difference between participants with and without functional disability.
Table 2. Weighted odds ratios (95% confidence intervals) for all domains of functional disability across quartiles of 5-Methyltetrahydrofolate.
Quartile of 5-Methyltetrahydrofolate
Q1Q2Q3Q4
LEM
Cases/Participants709/1469596/1465552/1456584/1460
Age-adjustedRef.0.72 (0.59–0.89) **0.58 (0.46–0.73) **0.62 (0.51–0.74) **
Multivariate-adjustedRef.1.05 (0.78–1.43)0.80 (0.57–1.14)0.87 (0.65–1.16)
IADL
Cases/Participants494/1469437/1465373/1456399/1460
Age-adjustedRef.0.77 (0.59–0.99) *0.60 (0.45–0.79) **0.56 (0.42–0.74) **
Multivariate-adjustedRef.0.92 (0.63–1.33)0.74 (0.52–1.04)0.65 (0.46–0.91) *
ADL
Cases/Participants448/1469400/1465350/1456354/1460
Age-adjustedRef.0.79 (0.58–1.06)0.71 (0.53–0.95) *0.70 (0.55–0.90) **
Multivariate-adjustedRef.1.00 (0.69–1.45)0.90 (0.61–1.32)0.87 (0.62–1.21)
LSA
Cases/Participants421/1469361/1465329/1456319/1460
Age-adjustedRef.0.75 (0.57–1.00)0.69 (0.53–0.90) **0.59 (0.43–0.82) **
Multivariate-adjustedRef.0.93 (0.64–1.35)0.87 (0.60–1.25)0.74 (0.48–1.14)
GPA
Cases/Participants979/1469918/1465881/1456921/1460
Age-adjustedRef.0.72 (0.58–0.89) **0.64 (0.50–0.81) **0.64 (0.50–0.82) **
Multivariate-adjustedRef.0.77 (0.56–1.05)0.66 (0.44–0.99) *0.70 (0.50–0.96) *
Calculated using binary logistic regression models. Q, quartile; LEM, lower extremity mobility; IADL, instrumental activities of daily living; ADL, activities of daily living; LSA, leisure and social activities; GPA, general physical activities; PIR, poverty–income ratio; BMI, body mass index. The multivariate-adjusted model adjusted for age, race/ethnicity, educational level, marital status, PIR, physical activity, alcohol consumption, smoking status, BMI, hypertension, diabetes, arthritis, stroke, gout, cancer, congestive heart failure, coronary heart disease, angina, asthma, chronic bronchitis, emphysema, and total energy intake. Q1: <28.2 nmol/L for females and <25.7 nmol/L for males; Q2: 28.2–45.0 nmol/L for females and 25.7–38.7 nmol/L for males; Q3: 45.0–70.9 nmol/L for females and 38.7–58.9 nmol/L for males; Q4: ≥70.9 nmol/L for females and ≥58.9 nmol/L for males. * p < 0.05; ** p < 0.01.
Table 3. Weighted odds ratios (95% confidence intervals) for all domains of functional disability across quartiles of 5-Methyltetrahydrofolate in females.
Quartile of 5-Methyltetrahydrofolate
Q1Q2Q3Q4
LEM
Cases/Participants425/737341/742310/732326/735
Age-adjustedRef.0.75 (0.54–1.03)0.58 (0.42–0.80) **0.49 (0.37–0.65) **
Multivariate-adjustedRef.0.97 (0.58–1.62)0.78 (0.45–1.36)0.63 (0.40–1.00)
IADL
Cases/Participants313/737249/742205/732235/735
Age-adjustedRef.0.62 (0.47–0.81) **0.44 (0.31–0.61) **0.45 (0.33–0.63) **
Multivariate-adjustedRef.0.73 (0.47–1.14)0.49 (0.32–0.74) **0.52 (0.35–0.79) **
ADL
Cases/Participants253/737208/742175/732184/735
Age-adjustedRef.0.70 (0.47–1.03)0.61 (0.42–0.88) **0.68 (0.46–0.99) *
Multivariate-adjustedRef.0.87 (0.52–1.45)0.64 (0.37–1.10)0.79 (0.44–1.42)
LSA
Cases/Participants245/737202/742173/732178/735
Age-adjustedRef.0.67 (0.47–0.95) *0.60 (0.42–0.87) **0.56 (0.39–0.81) **
Multivariate-adjustedRef.0.76 (0.47–1.25)0.68 (0.39–1.19)0.68 (0.41–1.14)
GPA
Cases/Participants575/737507/742479/732493/735
Age-adjustedRef.0.50 (0.35–0.73) **0.49 (0.35–0.69) **0.43 (0.29–0.62) **
Multivariate-adjustedRef.0.53 (0.32–0.88) *0.56 (0.33–0.96) *0.51 (0.32–0.79) **
Calculated using binary logistic regression models. The multivariate-adjusted model adjusted for age, race/ethnicity, educational level, marital status, PIR, physical activity, alcohol consumption, smoking status, BMI, hypertension, diabetes, arthritis, stroke, gout, cancer, congestive heart failure, coronary heart disease, angina, asthma, chronic bronchitis, emphysema, and total energy intake. Q1: <28.2 nmol/L; Q2: 28.2–45.0 nmol/L; Q3: 45.0–70.9 nmol/L; Q4: ≥70.9 nmol/L. * p < 0.05; ** p < 0.01.
Disclaimer/Publisher’s Note: The statements, opinions and data contained in all publications are solely those of the individual author(s) and contributor(s) and not of MDPI and/or the editor(s). MDPI and/or the editor(s) disclaim responsibility for any injury to people or property resulting from any ideas, methods, instructions or products referred to in the content.

