Article

Withania somnifera L.: Phenolic Compounds Composition and Biological Activity of Commercial Samples and Its Aqueous and Hydromethanolic Extracts

by
Milena Polumackanycz
1,
Spyridon A. Petropoulos
2,*,
Tomasz Śledziński
3,
Elżbieta Goyke
3,
Agnieszka Konopacka
4,
Alina Plenis
1 and
Agnieszka Viapiana
1,*
1
Department of Analytical Chemistry, Medical University of Gdansk, 80-416 Gdansk, Poland
2
Department of Agriculture, Crop Production and Rural Environment, University of Thessaly, Fytokou Street, 38446 Volos, Greece
3
Department of Pharmaceutical Biochemistry, Medical University of Gdansk, 80-211 Gdansk, Poland
4
Department of Pharmaceutical Microbiology, Medical University of Gdansk, 80-416 Gdansk, Poland
*
Authors to whom correspondence should be addressed.
Antioxidants 2023, 12(3), 550; https://doi.org/10.3390/antiox12030550
Submission received: 30 January 2023 / Revised: 17 February 2023 / Accepted: 19 February 2023 / Published: 22 February 2023

Abstract

:
In the present study, the chemical composition and bioactive properties of commercially available Withania somnifera samples were evaluated. The hydromethanolic and aqueous extracts of the tested samples were analyzed in terms of phenolic compound composition, ascorbic acid content, antioxidant and antibacterial activity, and acetylcholinesterase (AChE) and butyrylcholinesterase (BChE) inhibitory activities. Polyphenols and ascorbic acid content, as well as the antioxidant activity, were higher in the aqueous extracts than in the hydromethanolic extracts. Generally, aqueous extracts presented higher antioxidant activity than the hydromethanolic ones, especially in the case of 2,2-diphenyl-1-picryl-hydrazyl (DPPH) assay. Moreover, higher amounts of phenolic acids and flavonoids were found in the hydromethanolic extracts compared to the aqueous ones. Regarding the antibacterial properties, samples 4, 6, and 10 showed the best overall performance with growth-inhibitory activities against all the examined bacteria strains. Finally, the aqueous and hydromethanolic extracts were the most efficient extracts in terms of AChE and BChE inhibitory activities, respectively. In conclusion, our results indicate that W. somnifera possesses important bioactive properties which could be attributed to the high amounts of phenolic compounds. However, a great variability was recorded in commercially available products, suggesting significant differences in the origin of product and the processing method.

1. Introduction

Withania somnifera (L.) Dunal (Ashwagandha) belongs to the Solanaceae family and is also known as poison gooseberry, Indian ginseng, and winter cherry [1]. In Sanskrit, Ashwagandha means odor of the horse, originating from the aroma of the roots which resembles that of horse sweat, while the name “somnifera” in Latin means “sleep-inducer” which refers to its extensive use as an anti-stress remedy [2]. It originates in northwestern and central India and the Mediterranean region of North Africa and has been an important herb in Ayurveda and traditional medicine for over 3000 years [3,4]. It also occurs in Australia, Pakistan, Afghanistan, Jordan, Morocco, and Spain. In India, it is cultivated on a commercial scale in the states of Madhya Pradesh, Uttar Pradesh, Punjab, Gujarat, and Rajasthan [5]. The plant appears in WHO monographs on Selected Medicinal Plants and an American Herbal Pharmacopoeia monograph is also available [6,7].
W. somnifera is an important ingredient in many Ayurvedic formulations, which are currently commercialized in India and other countries in the world [5]. Most of the products of W. somnifera are used and sold as dietary supplements in the form of powder, syrup, infusions, ointments, tablets, and capsules [8]. In Ayurveda systems of medicine, the leaves, flowers, fruits, seeds, and roots of W. somnifera are also used for numerous therapeutic purposes [9]. Its leaves are bitter and have some medicinal uses against fever, as an anthelmintic agent, and for painful swelling. The flowers are depurative, astringent, diuretic, and aphrodisiac, while the fruits have been used in the treatment of tumors and tubercular glands, carbuncles, and skin ulcers [10,11]. Moreover, the fruits are also used as a coagulant agent in curdling plant milk to prepare vegetarian cheese [12]. The seeds of W. somnifera are anti-helminthic, remove white spots from the cornea, and increase sperm count and testicular growth [13]. Among the various plant parts of W. somnifera which have been claimed to have a large variety of health-promoting effects, the roots are the most popular. Their powder and preparations are consumed extensively as a functional food for promoting vitality and virility. They are used to prepare a tonic which revitalizes the body, promotes longevity, augments defense against infectious diseases, and arrests the aging process [14,15]. According to ethnobotany studies, roots and leaves of the species are also used as a hypnotic in alcoholism and emphysematous dyspnea [16,17]. Moreover, W. somnifera has other medicinal uses including immunomodulatory [18], antidiabetic and neuroprotective [5], anticancer [10], and anti-inflammatory [19]. Additionally, it is also useful as antibiotic, antioxidant, deobstruent, aphrodisiac, diuretic, and sedative [5,20].
Phytochemical investigations on W. somnifera have revealed the presence of various chemical constituents such as steroidal compounds, alkaloids, phenolic compounds, saponins containing an additional acyl group, withanolides with a glucose at carbon 27, etc. [21,22,23,24]. To date, more than 12 alkaloids, around 40 withanolides, and several sitoindosides are reported from the aerial parts, roots, and berries of W. somnifera [24]. The leaves are reported to contain five unidentified alkaloids (yield, 0.09%), 12 withanolides, many free amino acids, chlorogenic acid, glycosides, glucose, condensed tannins, and flavonoids [25]. Moreover, the roots contain alkaloids, amino acids, steroids, volatile oil, starch, reducing sugars, glycosides, hentriacontane, dulcitol, and withaniol [26]. Out of these metabolites, withanolides and phenolic compounds are mainly credited with the broadly acclaimed curative properties of W. somnifera [27]. Withanolides stimulate activation of immune system cells, while phenolic compounds are closely associated with the antioxidant activity of the plant [28]. Moreover, these compounds have also shown antiviral activity [29], with distinct effects on the viral receptor, which might be potent against COVID-19 [30,31].
There are many reports on the withanolides and alkaloids, but only a few studies are available regarding the phenolic composition and antioxidant activity of W. somnifera [32,33,34]. For this reason, the study of phenolic compounds is important both for their characterization and to facilitate more efficient use of this important plant resource. Therefore, the aim of the present study was to assess the phenolic composition of infusions and hydromethanolic extracts of commercial samples of W. somnifera and further evaluate their antioxidant, antibacterial, acetylcholinesterase (AChE), and butyrylcholinesterase (BChE) inhibitory activities. The results of this study could provide new important insights into the contribution of phenolic compounds to the bioactive properties of W. somnifera, focusing on over-the-counter commercially available products, while they also assess potential differences between the different types of products in terms of antioxidant activities. Individual phenolic acids and flavonoids were quantified in hydromethanolic and aqueous extracts obtained from the samples under study; total phenolic compounds, total flavonoids, total phenolic acids, and L(+)-ascorbic acid content were also determined. The antioxidant activities of the tested extracts were evaluated using DPPH and ABTS free radical scavenging assays, as well as ferric-reducing/antioxidant power (FRAP) assay, while antibacterial activity was determined only for aqueous extracts of W. somnifera specifically because of their widespread use as tea infusions. Finally, AChE and BChE inhibitory activity was determined for both the hydromethanolic and aqueous extracts.

2. Materials and Methods

2.1. Plant Material

Eighteen commercial samples (no 1–18) of Withania somnifera L. (Dunal) were purchased in a local supermarket (Auchan), herbal store (Fragaria, Eko-Ziola, Nagietek), and pharmacy store (Gemini) in Gdansk, Poland. The majority of samples came from India and contained roots of W. somnifera. Only samples no 6 and 9 contained rhizome tissues and whole plant, respectively. Eight samples (no 1, 3, 4, 5, 6, 8, 14, and 17) were in capsule form, two samples (no 2 and 9) were in tablet form, and eight samples (no 7, 10, 11, 12, 13, 15, 16 and 18) were in powder form (Table 1). All samples were pulverized in a water-cooled Knifetec 1095 grinder (Foss Tecator, Höganäs, Sweden) and the homogenized samples were stored in a light-proof desiccator until further analysis.

2.2. Reagents and Standard Solutions

For the chemical analyses, the following high-purity standards (>98%), e.g., 2,2-diphenyl-1-picrylhydrazyl (DPPH reagent), 2,20-azinobis(3-ethylbenzothiazoline-6-sulfonic acid) diammonium salt (ABTS reagent), 4-chloro-7-nitrobenzofurazan (NBD-Cl), and ten chemical standards: gallic acid (GA), catechin (CAT), vanillic acid (VA), caffeic acid (CA), p-coumaric acid (pCA), ferulic acid (FA), sinapic acid (SYN), rutin (RUT), quercetin (Q), and naringenin (NAR), were purchased from Sigma-Aldrich (St. Louis, MO, USA) [35]. Aluminum chloride (AlCl3) was obtained from Across Organics (Morris Plains, NJ, USA) and HPLC-grade acetonitrile (ACN) from Avantor (Central Valley, PA, USA) [35], while the rest of the reagents were obtained from POCh (Gliwice, Poland) [35]. The redistilled water was prepared by triple distillation of water in a Destmat® Bi-18 system (Heraeus Quarzglas, Hanau, Germany), as already described by Polumackanycz et al. [35].
The determination of total phenolic compounds (TPC), total flavonoids (TF), total phenolic acids (TPA), L(+)-ascorbic acid (ASA) contents, and antioxidant activity was performed with a Metertech UV/Vis spectrophotometer (Nankang, Taiwan) by measuring the absorbance with 10 mm quartz cuvette at the wavelength described below in the corresponding sections [35].

2.3. Sample Preparation

The hydromethanolic extracts were prepared by sonicating 1.0 g of each sample with 7 mL of methanol–water mixture (80:20; v/v) for 20 min at 20 °C using an ultrasonic bath (Emag, Salach, Germany) [35]. Then, the extract was centrifuged in an EBA-20S centrifuge (Hettich, Tuttlingen, Germany) for 10 min at 80,000 rpm and the supernatant was transferred into a 20 mL volumetric flask [35]. The extraction process was performed twice and the obtained supernatant were put together in the same flask and diluted up to 20 mL using a mixture of methanol and water (80:20; v/v) [35].
The infusions (aqueous extracts) were prepared by adding 1.0 g of sample into 100 mL of boiling distilled water, then left to stand for 10 min at room temperature, and finally filtered with a Whatman filter paper no. 113 (Sigma-Aldrich, St. Louis, MO, USA) [35].
The obtained extracts (both hydromethanolic and aqueous ones) were passed through a 0.25 μm nylon filter film (Mecherey, Nagel, Germany) and then 20 μL of the filtrate were injected into the HPLC system [35].

2.4. Phytochemical Composition

2.4.1. Chromatographic Conditions

Chromatographic separation of phenolic compounds was performed according to the protocol previously described by Viapiana et al. [36]. The equipment used was a Merck-Hitachi LaChrome device (Darmstadt, Germany) equipped with an L-7420 UV-Vis detector, L-7200 autosampler, L-7360 thermostat and D-7000 HPLC System Manager, ver. 3.1 (Merck-Hitachi, Darmstadt, Germany) [36]. The detection and quantification were performed using the method described previously [36]. The detection wavelengths were set at 280 nm (GA, VA, CAT, NAR), 320 nm (CA, FA, pCA, SYN), and 370 nm (RUT, Q) [36].
Phenolic compound identification was carried out by comparing the retention times of the detected compounds with those of commercial standards, as well as by spiking a sample with commercial standards. The limit of detection (LOD) and limit of quantification (LOQ) are presented in Table 2.

2.4.2. Total Phenolic Compounds (TPC), Flavonoid (TF), and Phenolic Acid (TPA) Contents

For total phenolic compound determination, the Folin–Ciocalteu [37] method was implemented and the results were presented as mg of gallic acid equivalents per gram of dry weight of sample (mg GAE/g DW). The total flavonoid content was determined according to the European Pharmacopoeia [38] and the results were presented as mg of quercetin equivalents per gram of dry weight of sample (mg QE/g DW).
Finally, total phenolic acid content was evaluated using Arnov’s reagent according to the procedure described in the Polish Pharmacopoeia VI [39]. The results were presented as mg of caffeic acid equivalent per gram of dry weight of sample (mg CAE/g DW).

2.4.3. L(+) Ascorbic Acid Content

Ascorbic acid was determined based on the protocol previously described by Abdelmageed [40] after slight modifications which are reported by Viapiana et al. [35]. The results were presented as mg of ascorbic acid per gram of dry weight of sample (mg ASA/g DW).

2.5. Bioactive Properties

2.5.1. Antioxidant Activity

The antioxidant activity was determined using four different assays, namely, the 2,2-diphenyl-1-picryl-hydrazyl (DPPH) assay [41]; the 2,2′-azinobis-(3-ethylbenzothiazoline-6-sulfonate) (ABTS) assay [42], with slight modifications which are reported by Viapiana et al. [35]; and the ferric-reducing antioxidant power (FRAP) assay [43].

2.5.2. Antibacterial Activity

The antimicrobial activity analysis of infusions (aqueous extracts) was performed according to the protocols of EUCAST (European Committee on Antimicrobial Susceptibility Testing) and CLSI (Institute of Clinical and Laboratory Standards), as previously described by Polumackanycz et al. [44].

Bacterial Strains and Growth Conditions

Antibacterial activity was tested according to the method previously described by Polumackanycz et al. [44], using the following bacteria: Gram-positive strains, e.g., Staphylococcus aureus ATCC 6538, MRSA (18582, 6347, N315, 12673). Staphylococcus epidermidis ATCC 14990, Bacillus subtilis ATCC 6633, Corynebacterium diphtheriae, group A β-hemolytic Streptococcus, and Streptococcus pneumoniae (from the own collection of the Department of Pharmaceutical Microbiology), and Gram-negative strains: Escherichia coli ATCC 8739, Pseudomonas aeruginosa ATCC 9027.

Agar Well Diffusion Assay

The agar well diffusion test was used as a preliminary study of the antimicrobial activity, using the following strains Staphylococcus aureus ATCC 6538, Escherichia coli ATCC 8739, and Pseudomonas aeruginosa ATCC 9027, according to the methodology previously described by Polumackanycz et al. [44].

MIC and MBC Assays

The Minimal Inhibitory Concentration (MIC) and Minimal Bactericidal Concentration (MBC) were tested using the broth microdilution technique. Due to the fact that the ashwagandha extracts were colorful, determination of the MIC values was troublesome. All antimicrobial activity assays were performed in triplicate for at least two independent experiments.

2.5.3. AChE and BChE Inhibitory Activity

The inhibitory activities of AChE and BChE were assayed by Ellman’s method on a 96-well microplate similar to that previously described in the literature [45].

2.6. Statistical Analysis

For each sample, three extracts were prepared, while each extract was analyzed in triplicate. The obtained results were presented as mean values and standard deviation (SD). The statistical analysis was performed using the two-way analysis of variance (ANOVA) followed by means comparison with Tukey’s HSD test (p < 0.05) and Student’s t test (p < 0.05) for the means of the same extraction method and the same sample, respectively. Pearson’s correlation analysis was used to reveal the relationship between W. somnifera extracts and the detected chemical profile and biological activities. For the analysis of data, the Statistica 10 software (StatSoft Inc., Tulsa, OK, USA) was used. Finally, a principal component analysis (PCA) was carried out to evaluate the contribution of each variable to the total diversity aiming to classify the studied samples based on their chemical profile, the bioactive properties, and the extraction protocol. For this analysis, the statistical software Statgraphics 5.1.plus (Statpoint Technologies, Inc., Warrenton, VA, USA) was implemented.

3. Results and Discussion

3.1. Validation Method for the Identification of Phenolic Compounds

The validation of the applied method was performed by evaluating the following parameters: linearity, limits of detection (LOD) and quantification (LOQ), intra- and inter-day precision, recovery, and stability. In Table 2, good linearity was found over the determined ranges for all the detected compounds, with correlation coefficient (r) values significantly higher than 0.985. The LOD and LOQ were calculated in accordance with the following equations: LOD = 3.3Sxy/b and LOQ = 10Sxy/b, where Sxy is the standard deviation of the response and b is the slope of the calibration curve. The values of LODs and LOQs were less than 3.5 and 13.2 μg/mL, respectively. These results show that the analytical method had excellent resolution and sensitivity. Intra-day precision was validated with a standard solution of assayed phenolic compounds three times within one day, while inter-day precision was validated with the same standard solution over three consecutive days. Consequently, the precision was acceptable, and the coefficient of variation values ranged from 0.6% to 1.4% and from 1.2% to 2.5% for intra- and inter-day variations, respectively.
The mean recovery was also found to be in a satisfactory range, e.g., 93.1–97.8%, with a relative standard deviation (RSD) less than 3.5%. The peak areas and retention times of the detected phenolic compounds were analyzed every eight hours within 48 h for the stability test and they were found to be quite stable, while retention CV was lower than 1.9% for peak area and 0.4% for retention time.

3.2. Analysis of TPC, TF, TPA and ASA

The results of total phenolic compounds (TPC), total flavonoids (TF), total phenolic acids (TPA), and L(+)-ascorbic acid (ASA) content in hydromethanolic and aqueous are shown in Table 3. The obtained results revealed that TPC, TF, TPA, and ASA content in the aqueous extracts were significantly higher (p < 0.05) than those in the hydromethanolic extracts of W. somnifera. In contrast to our study, Alam et al. [34] analyzed hydromethanolic extracts of W. somnifera roots and also found higher values of TPC and TF at levels of 17.80 mg GAE/g DW and 15.149 mg CEQ/g DW, respectively. Similar results for TPC were obtained by Dhanani et al. [46] for aqueous extracts of W. somnifera roots (14.90–18.72 mg GA/g DW). Moreover, higher contents for TPC and TF were obtained by Ganguly et al. [47] for hydromethanolic (97.38 µg GA/mg of extract and 63.49 µg Q/mg extracts, respectively) and aqueous extracts (53.9 µg GA/mg of extract and 38.66 µg Q/mg of extracts, respectively) in W. somnifera roots, while similar levels of TPC were reported by Yadav and Rai [48] for methanolic extracts of W. somnifera roots (52.811 mg GAE/100 g DW). The reported values are higher than those obtained in this study. An explanation for the variability detected among the phenolic contents in ashwagandha samples could be due to the different extraction procedures and analytical methods used in each work [49,50]. In addition, it has been suggested that phenolic compounds in plants vary according to growing conditions such as drought, temperature changes, pollution, UV light, and pathogen attacks, among others, or the genotype tested [51,52,53]. Moreover, the expression of the results could also explain these contradictory findings, as in the case of Chaudhary et al. [54] who expressed the results of TPC and TF of aqueous extracts of W. somnifera roots as % (24.70 and 1.83, respectively), while Paul et al. [55], who tested the methanolic extracts of W. somnifera roots, expressed TPC and TF contents as mg GAE/mL (0.39–0.52) and mg QE/mL (0.50), respectively. In particular, Chaudhary et al. [54] suggested that natural matrices contain complex mixtures of polyphenols which may reveal different bioactive properties depending on the amounts of the active components; thus, the higher amounts of total polyphenols are not always accompanied by higher antioxidant activities. On the other hand, Paul et al. [55] who tested two different W. somnifera samples (one indigenous and one imported root sample), suggested significant differences in terms of total phenolic compounds and total flavonoids. Therefore, direct comparison of the results from different reports is not always possible. Finally, these contradictions with the literature reports could be due to the fact that in other studies, raw material was used for the analyses, whereas in our study, all the tested samples were already processed in capsule, tablet, or powder form without any details of processing method available [56]. To the best of the authors’ knowledge, this is the first report of the TPA and ASA in W. somnifera aqueous and hydroalcoholic extracts.

3.3. Evaluation of Antioxidant Activity

The antioxidant potential of the tested W. somnifera commercial samples was evaluated by the use of DPPH, ABTS, and FRAP tests, and the results are shown in Table 3. Generally, for the three methods, aqueous extracts of W. somnifera presented higher antioxidant activity than the hydromethanolic ones. The superior antioxidant activity obtained for aqueous extracts could be explained by their higher content of phenolic compounds, since phenolic compound content has been associated with high antioxidant activity in various species [57,58,59]. Antioxidant activity results for hydromethanolic extracts ranged from 19.48 to 91.17 mg TE/100 g DW by DPPH assay, 16.54–124.84 mg TE/g DW by ABTS assay, and 3.87–45.57 µmol Fe2+/g DW by FRAP method. On the other hand, for aqueous extracts, DPPH, ABTS, and FRAP values ranged from 93.66 to 281.92 mg TE/100 g DW, 21.31 to 90.04 mg TE/g DW and 13.17 to 40.01 µmol Fe2+/g DW, respectively. Sample no 6 was characterized by the highest values of ABTS (above 124 mg TE/g DW in hydromethanolic extracts and above 90 mg TE/g DW in aqueous ones), while sample no 9 showed the highest FRAP values (above 84 µmol Fe2+/g DW in hydromethanolic extracts and above 40 µmol Fe2+/g DW in aqueous extracts). Moreover, infusion of sample no 13 was characterized by the lowest ABTS and FRAP values (below 7 mg TE/g DW and 14 µmol Fe2+/g DW, respectively). Finally, the hydromethanolic extract of sample no 1 showed the lowest DPPH values (below 20 mg TE/100 g DW), while its aqueous extract was characterized by the highest DPPH values (above 280 mg TE/100 g DW).
The DPPH and ABTS values of W. somnifera extracts obtained in this study cannot be compared with those in literature reports due to the difference in calculation units. In the literature, the antioxidant activity for W. somnifera extracts was expressed as the percentage of inhibition and the half-maximal inhibitory concentration (IC50). For example, Dhanami et al. [46] determined the antioxidant activity in aqueous extracts of W. somnifera roots and obtained DPPH value in the range of 0.40 to 1.20 mg/mL (IC50) and ABTS values in the range of 2.14 to 2.68 mg/mL (IC50). On the other hand, Chaudhary et al. [54] reported higher DPPH and ABTS values (4612.17 and 541.76 µg/mL, IC50), while Ganguly et al. [47] obtained lower values of DPPH (111.31µg/mL, IC50). Furthermore, in aqueous extracts of W. somnifera roots, Chaudhary et al. [54] recorded a FRAP value at the level of 13.61 mmol ascorbic acid/mL, and Yadav and Rai [48] determined ABTS value at the level of 19.54% of inhibition. Similarly, for hydromethanolic extracts of W. somnifera roots Ganguly et al. [47] obtained DPPH value higher than 30 µg/mL (IC50), while Alam et al. [34] reported DPPH value at the level of 59.16% of inhibition. All these results from the literature indicate a significant variation in the antioxidant activity of W. somnifera depending on the means of extraction, while the extraction protocol may also affect the antioxidant potential of natural matrices [60]. Moreover, according to Nile et al. [61], the extraction condition (e.g., solvent, extraction time, and extraction temperature) may affect the antioxidant potential of dried leaves and roots of W. somnifera due to differences in withanoside and withanolide content. In the study of Simur [61], where methanol, acetone, and hexane extracts of W. somnifera leaves were tested, a great variation in antioxidant potential was also reported. Another aspect to be considered is the growth stage of plants at harvesting, since according to Fernando et al. [62], harvesting after flowering may increase the total antioxidant activity of the extracts from different plant parts of the species.

3.4. Analysis of Individual Phenolic Compounds

Table 4 presents a profile of individual phenolic compounds in the tested extracts of commercial W. somnifera samples. In general, higher amounts of phenolic acids and flavonoids were found in the hydromethanolic than in the aqueous extracts. In the hydromethanolic extracts, only five phenolic compounds (GA, CAT, Q, CA and RUT) were found in all analyzed samples. SYN was determined only in four samples, pCA in six samples, VA in eight samples, NAR in twelve samples, and FA in eleven samples. Moreover, CAT and Q were more abundant in the hydromethanolic extracts, 1.96 and 1.35 mg/g DW, respectively, while SYN and VA were determined in the lowest concentration (135 and 108.99 µg/g DW, respectively). In the case of aqueous extracts, only CAT was determined in all samples, and together with GA and Q, was found in the highest amounts (7.65, 1.05, and 0.81 mg/g DW, respectively). SYN was determined only in three samples and was found in the lowest concentration. In addition, the hydromethanolic extracts of samples no 4, 5, and 8 were the richest in phenolic compounds, especially in CAT and RUT, while samples 10 and 18 had the lowest content. For aqueous extracts, samples no 2 and 6 were the richest in phenolic compounds, while samples no 12 and 13 were the poorest. Moreover, in samples no 12 and 13, only RUT and VA were found.
The literature data on phenolic compound composition in W. somnifera roots are scarce. Alam et al. [34] found six times higher CAT content (12.82 mg/g DW) in hydromethanolic extracts of W. somnifera roots than in this study, while GA, SYN, VA, pCA, and NAR were not detected. The content of CA and FA in methanolic extracts of W. somnifera roots reported by Tomar et al. [33] was lower than in this study. However, these authors presented their results on a fresh weight basis, while the samples were obtained from cultivated plants. These variations in the literature could be due to either intrinsic and/or extrinsic factors, such as cultivation practices, storage conditions, type of soil, climatic factors, and technological treatments [45,46,63]. Moreover, plant part is crucial for the phenolic composition of the obtained extracts, as already reported by Tomar et al. [33], who detected significant differences among plant parts (stems, roots, and leaves). Similarly to our study, significant differences in phenolic compounds composition were reported by Alam et al. [34] and Tomar et al. [33], who tested hydromethanolic and methanolic and chloroform extracts, respectively. In particular, Alam et al. [34] detected CAT (19.48 mg/g DW) and NAR (0.50 mg/g DW), while GA, VA, and pCA were not detected in the hydromethanolic extracts of W. somnifera fruits. On the other hand, Tomar et al. [33] found 1.5 µg/g FW of CA in methanolic extracts of W. somnifera leaves, while Alam et al. [34] detected GA, SYN, VA and pCA (28.38; 0.18; 0.30; 0.15 and 0.80 mg/g DW, respectively) and found no detectable amounts of NAR in the hydromethanolic extracts of W. somnifera leaves.

3.5. Evaluation of Antibacterial Activity

The antibacterial tests were carried out using the agar diffusion method. Antimicrobial activity analyses (assessed in terms of inhibition zone) of W. somnifera aqueous extracts, tested against S. aureus ATCC 6538, E. coli ATCC 8739, and P. aeruginosa ATCC 9027 were performed and only ten of the tested extracts showed significant activity against the three selected bacteria strains. Then, MIC and MBC values of W. somnifera extracts that showed antibacterial activity in diffusion assay were further evaluated (Table 5). The range of MIC and MBC values of extracts was 0.25–32 and 1–32 mg/mL, respectively. The lowest MIC value (0.25 mg/mL) was recorded against S. pyogenes (samples no. 1, 3, 4, and 6) and C. diphtheria (sample no. 3). Moreover, S. pyogenes was the most sensitive of the examined bacterial strains with MIC values ranging between 0.25 and 4 mg/mL, whereas E. hirae, E. faecalis, and MRSA 12,673 were the most resistant to tested W. somnifera extracts. Furthermore, extracts prepared from samples 4, 6, 10, and 15 showed the best overall performance with growth-inhibitory activities against all the examined bacteria strains, while sample no 3 was characterized by the lowest antibacterial activity compared to other samples, except for the case of MIC values of aqueous extracts against S. pyogenes and C. diphtheria. Moreover, MBC values were much higher compared to the MIC values, thereby confirming that W. somnifera extracts may have bactericidal effects at high concentrations and bacteriostatic effects at lower ones.
Our results are in agreement with literature reports where the antibacterial activity of W. somnifera extracts is indicated. For example, the methanol, ethanol, aqueous, and butanol root extracts of the species were effective in the inhibition of multidrug-resistant Staphylococcus aureus strains tested by the agar well diffusion method, although a significant variation between the different extracts was recorded (butanol extracts were the most effective, whereas the aqueous ones the least effective) [64]. The differences between the various extracts could be associated with the presence of specific active components, as in the case of total phenolic compounds, total flavonoids and total phenolic acids, which were the highest in sample no 6 that were effective against most of the studied bacteria. On the other hand, this was not the case with samples 4, 10, and 15 which showed a variable content of phenolic compounds, indicating that other compounds may also contribute to the bioactive properties of W. somnifera extracts and their antimicrobial effects in particular. Similarly, the methanol and hexane extracts of W. somnifera leaves and roots were effective against Salmonella typhimurium and Escherichia coli [65], while according to Rizwana et al. [66] the acetonic extracts of roots were more effective against Klebsiella pneumoniae and methicillin-resistant Staphylococcus aureus (MRSA) than the methanolic and ethanolic ones. Moreover, the methanolic leaf extracts were very effective against several bacteria present in pus samples of patients, including methicillin-resistant Staphylococcus aureus and Enterococcus spp., while Mehrota et al. [67] reported that aqueous extracts of roots were effective against the same pathogen. Murugan et al. [68] and Gebeyehu et al. [69] suggested withaferin A as the main active component in leaf extracts against Pseudomonas aeruginosa, S. aureus, Streptococcus pneumoniae, Salmonella typhi, and E. coli; while Ha et al. [70] reported withanolide glycosides as the main bioactive compounds of roots. On the other hand, according to Balkrishna et al. [71], fatty acids were responsible for the antibacterial effects of fixed seed oils on Salmonella enterica. Similarly to our study, Mehta et al. [72] suggested significant differences in the efficacy of methanolic and ethyl acetate extracts of leaves against Salmonela typhimurium strains, which highlights the impact of the extraction protocol on the bioactive properties of the extracts. Moreover, each plant part seems to possess specific antibacterial properties which could be explained by the difference in its chemical profile and the abundance of specific bioactive components.

3.6. AChE and BChE Inhibition Results

The acetylcholinesterase (AChE) and butyrylocholinesterase (BChE) inhibitory activity of the hydromethanolic and aqueous extracts of W. somnifera L. is presented in Table 6.
The inhibitory activities of the studied samples showed great variation for both enzymes. In particular, for the aqueous extracts, the highest IA for AChE was 36% of the activity of the control sample (sample 14), whereas samples 7, 9, and 17 showed no inhibition of this enzyme. In the case of BChE, the highest IA among the aqueous extracts was recorded for sample 13 (34% of the activity of the control sample), and samples 1, 6, and 14 did not have any significant activity, whereas for sample 7 a slight increase in the BChE activity was detected. Among the hydromethanolic extracts, the highest IA for AChE was found for sample 8 (21% of the activity of the control sample), whereas samples 5, 7, and 17 did not inhibit the activity of the enzyme. Similarly, for BChE, the highest IA was recorded for sample 10 (16% of the activity of the control sample), while all the tested hydromethanolic extracts showed inhibition activity against BChE. When comparing the mean IA of AchE for all the aqueous extracts with the respective mean of hydromethanolic extracts, the former recorded a lower IA (64% comparing to 76% for hydromethanolic extracts), whereas for BchE, the hydromethanolic extracts had lower IA (40% comparing to 78% for aqueous extracts). The inhibition of AChE and BChE by a known inhibitor of both enzymes (9-Amino-1,2,3,4-tetrahydroacridine hydrochloride hydrate) that served as a positive control is presented in Supplementary Material (Table S1).
The inhibition activity of W. somnifera against AChE has been previously reported in the literature, indicating the positive health effects for the treatment of neurodegenerative diseases and memory-related disorders such as Alzheimer’s disease [73,74,75,76,77]. For example, Pai et al. [78] suggested the positive effects of hydroalcoholic extracts and withanolide-A in in vitro and in silico inhibition of AChE, while Khan et al. [74] and Choudhary et al. [79] also highlighted the importance of withanolides to these particular properties. An earlier in vivo study with adult male Wistar rats also identified withanolide-A as the main bioactive compound responsible for the memory-improving effects of W. somnifera [80], while more recent reports suggested the positive effects of withanone obtained from leaf and root extracts against cognitive dysfunction [81,82]. Similarly, Singh et al. [83], who isolated nine distinct withanolides from ethanolic fractions of W. somnifera roots, identified five potent compounds with high AChE inhibitory activity, with 12-deoxywithastramonolide being the most efficient withanolide. The ethanolic extracts of roots were also effective against both AChE and BChE [84]. On the other hand, Raza et al. [85] who tested the AChE and BChE inhibitory activity from W. somnifera extracts (hexane, ethyl-acetate, butanol), recorded higher efficiency for the ethyl-acetate extracts for both enzymes and further suggested that these properties could be attributed to the higher recovery of phenolic compounds for these particular extracts. Moreover, the recent study of Tousif et al. [86] identified more than 100 metabolites in methanolic extracts of W. somnifera leaves fractionated with chloroform which was the most effective against Ache and BChE, including phenolic compounds, flavonoids, lignins, limonoids, steroids, terpenoids, and withanolides. This finding is in agreement with the report of Maya and Sarada [87] who suggested important AChE inhibitory activity of methanolic extracts of roots, despite its low content of polyphenols. Apart from single-extract treatments, Khan et al. [88] recently suggested the synergistic effects of the aqueous extracts of W. somnifera and Myristica fragrans which significantly increased the IC50 values in in vitro anticholinesterase assays, compared to treatments with single extracts.

3.7. Correlation Analysis

Pearson’s correlation analysis was implemented to determine the relationship between the detected phenolic compounds and the antioxidant activity of the W. somnifera samples (Supplementary material Tables S2 and S3). The correlation analysis showed 48 statistically significant correlations (p < 0.05) for the hydromethanolic extracts. The highest correlations were obtained between TPC-FRAP (0.875), TPC-TPA (0.866), and TPA-SYN (0.850). Moreover, the correlations between DPPH and TF, ASA, GA, NAR, pCA, and RUT were negative (−0.487; −0.705; −0.490; −0.573; −0.630 and −0.547, respectively), indicating that the specific compounds not only do not contribute to the antioxidant potential of the tested extracts but also that they may have a negative effect regarding the activity determined via the DPPH assay. On the other hand, 38 statistically significant correlations were found in the aqueous extracts, while the highest correlation (0.824) was obtained between RUT and TPA. In addition, the correlations of antioxidant activities and TPA, GA, SYN, and pCA in the aqueous extracts were found to be moderately positive, while the relationship between FRAP and Q was moderately negative (−0.615). Finally, AChE was significantly correlated with VA (−0.476) in the aqueous extracts. The obtained results suggest the crucial role of specific phenolic compounds as antioxidant constituents in W. somnifera, thus contributing to the overall bioactive properties of the tested commercial samples. Moreover, those cases where values of Pearson’s correlation coefficients were below 0.45 suggest that the specific constituents that occurred separately in the tested extracts could not be responsible for the antioxidant properties determined with the respective assays.

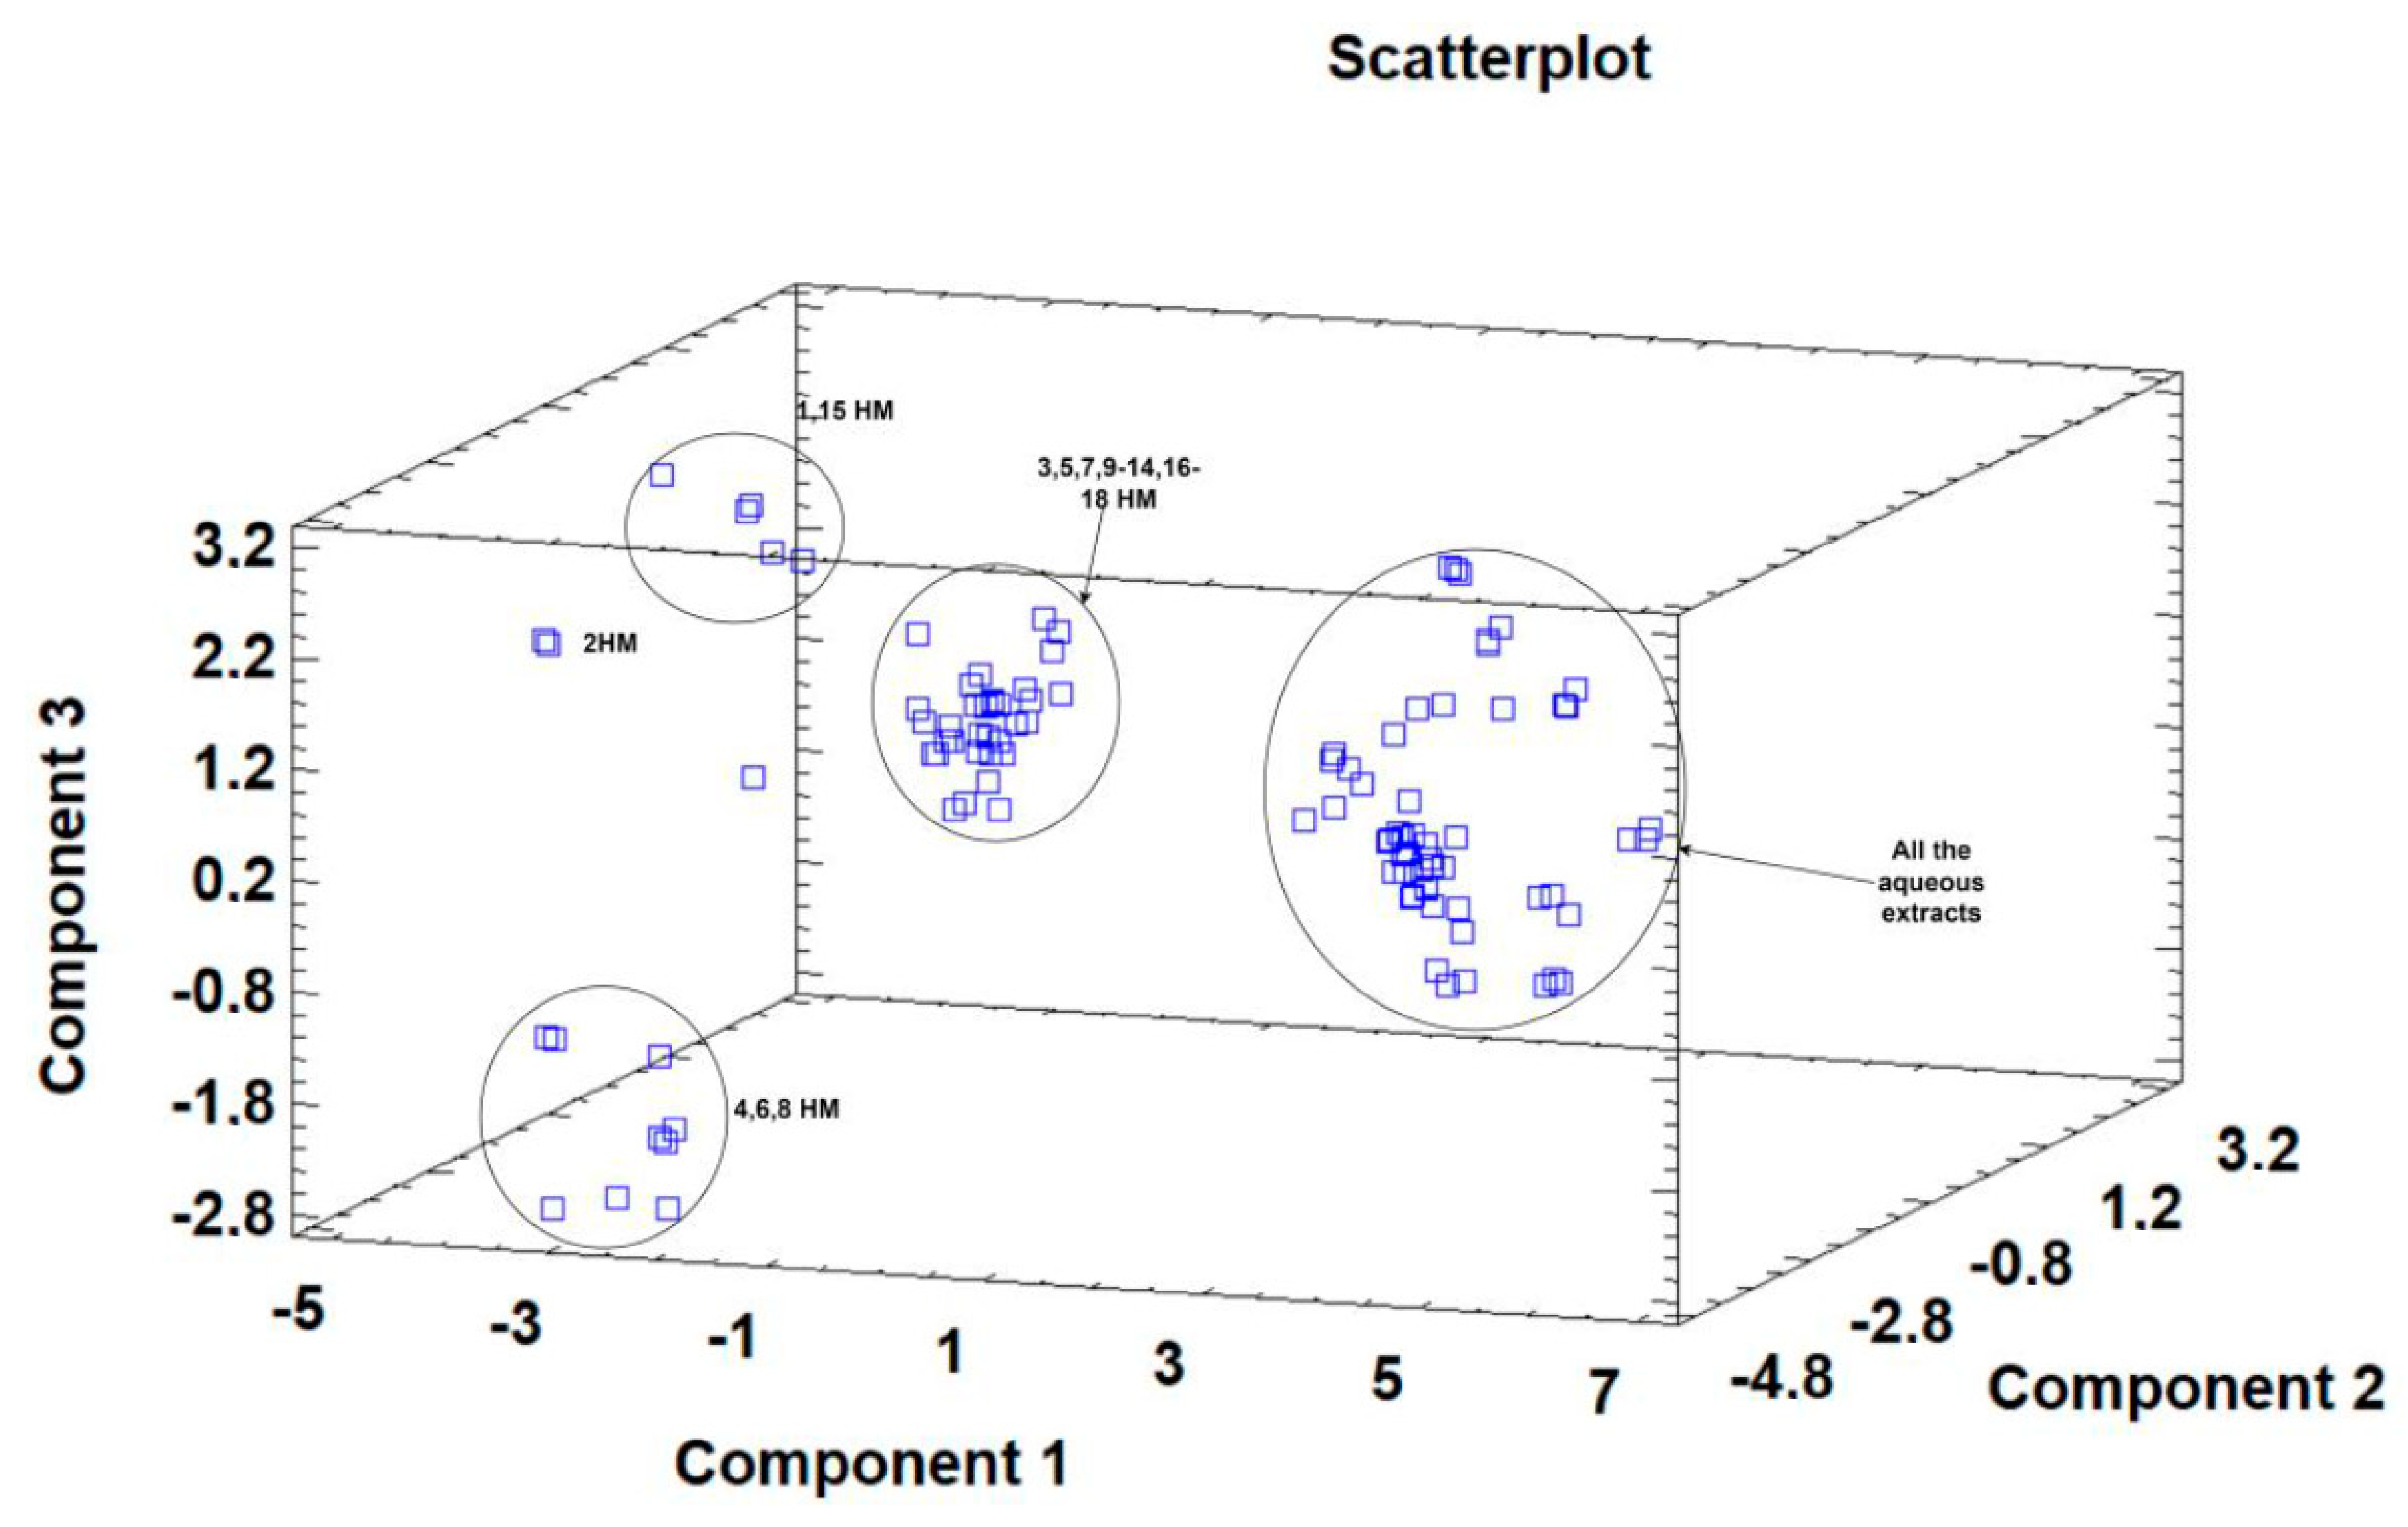
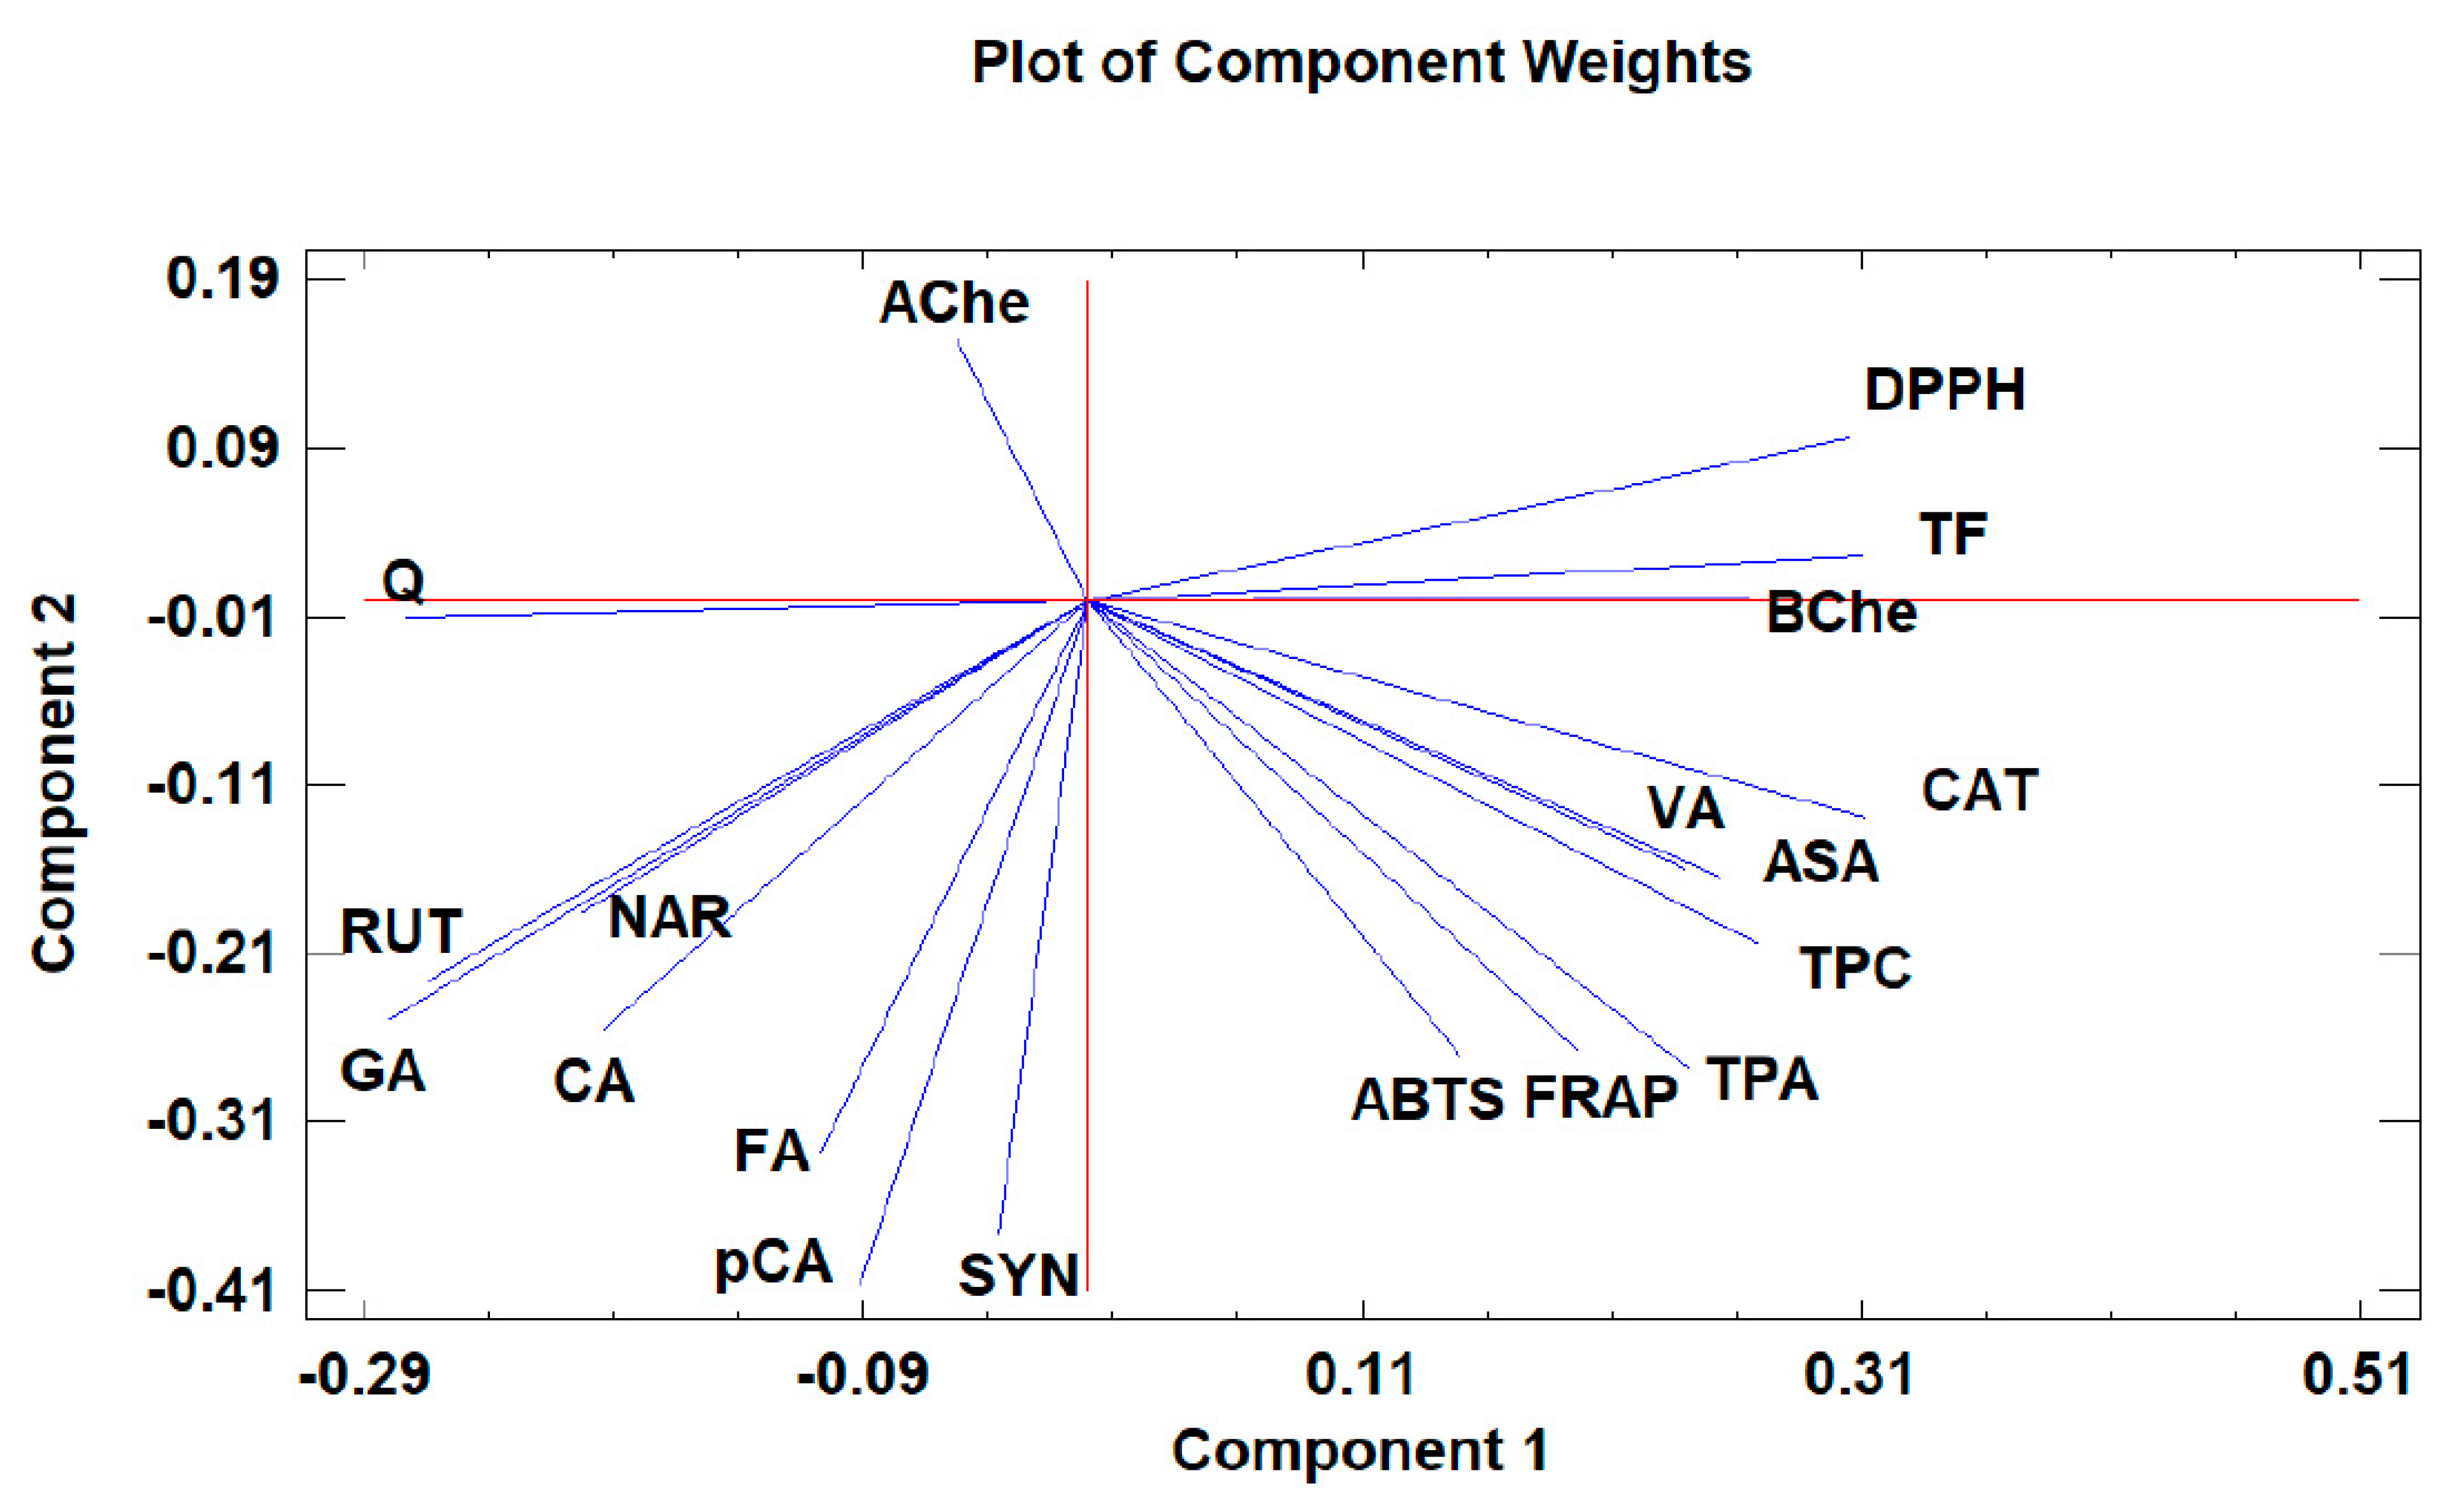
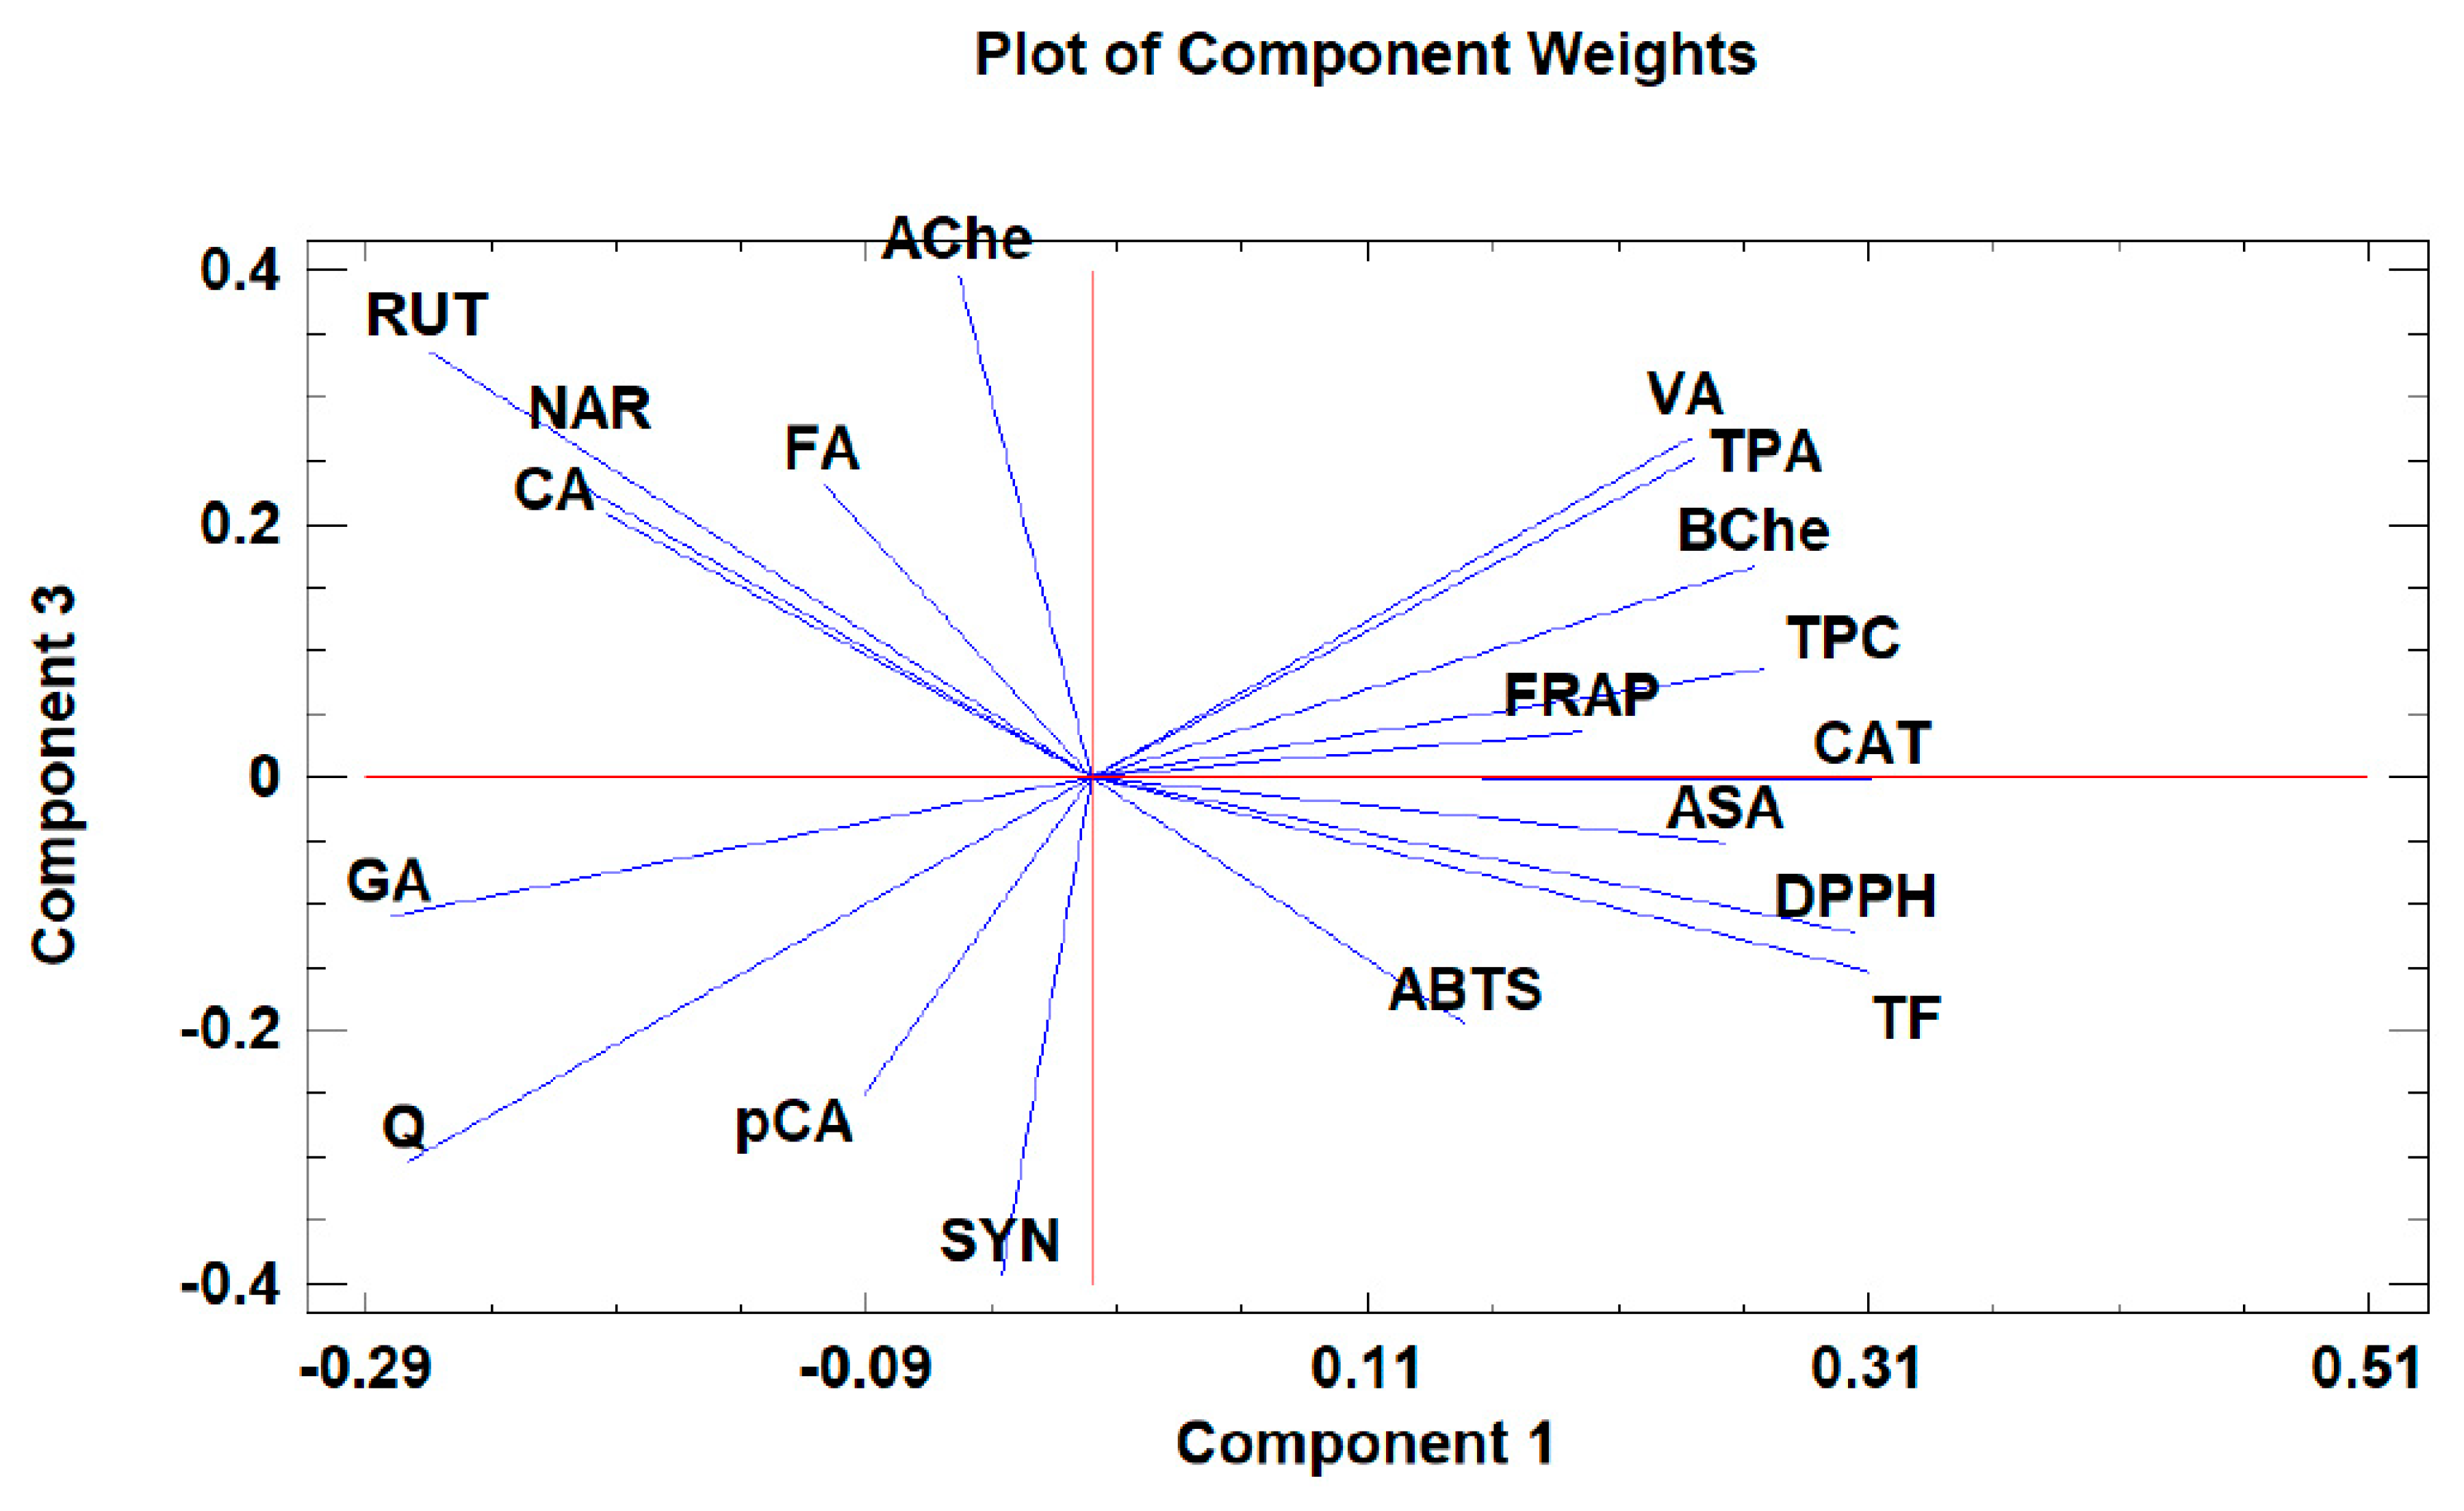
3.8. Principal Components Analysis

Principal component analysis (PCA) is widely used when aiming to reduce the complexity of multivariate data, as well as to identify patterns and express data in ways that highlight similarities and differences among the tested treatments. In our study, the aim was to identify groups of samples with similarities in terms of phenolic compound composition and antioxidant activity, as well as depending on the extraction protocol. The first five principal components (PCs) were associated with Eigen values higher than 1 and explained 79.93% of the cumulative variance, with PC1 accounting for 39.7%, PC2 for 18.2%, PC3 for 8.5%, PC4 for 8.0%, and PC5 for 5.4%. PC1 was positively correlated with TF, ASA, CAT, and DPPH, and negatively correlated with GA, NAR, RUT, and AChe. PC2 was positively correlated to Q and negatively correlated to TPA, FA, CAT, pCA, ABTS, and FRAP. Finally, PC3 was positively correlated to TPA, VA, RUT, FA, NAR, and CA, and negatively correlated to Q and SYN. These results indicate the correct implementation of the PCA, allowing differentiation between the tested samples depending on the extraction protocol, as shown in the corresponding scatterplots and loading plots (Figure 1, Figure 2 and Figure 3). The scatterplot (Figure 1) shows a clear discrimination of the tested samples according to the extraction protocol where all the aqueous extracts form a distinct group. PC1 discriminates sample 4 due to high content of CAT and TF and sample 6 due to high content of ASA. PC2 discriminates sample 1 due to low content of TPA and low values of ABTS, sample 6 due to low content of FA, sample 8 due to high content of Q and low content of SYN. Finally, PC3 discriminates sample 1 due to high contents of RUT and NAR, sample 2 due to high contents of FA and NAR, sample 4 due to high content of FA, sample 6 due to high content of TPA, and sample 8 due to high content of CA and TPA.
Moreover, the loading plot of the first two components also revealed groups of positively correlated variables (Figure 2). In particular, the upper left quadrant includes Q and AChe; the lower left quadrant comprises RUT, NAR, CA, GA, FA, SYN, and pCA; the upper right quadrant includes DPPH, TF, and BChe; and the lower right quadrant includes CAT, VA, ASA, TPC, TPA, FRAP, and ABTS. Similarly, the loading plot of PC1 and PC3 (Figure 3) revealed groups of positively correlated variables, namely, the upper left quadrant includes Ache, FA, NAR, CA, and RUT; the lower left quadrant comprises GA, Q, SYN, and pCA; the upper right quadrant includes BChe, VA, TPA, TPC, CAT, and FRAP; and the lower right quadrant includes ASA, ABTS, TF, and DPPH.

4. Conclusions

Natural products are promising sources of bioactive compounds and have been widely used in folk and traditional medicine, while they may provide important compounds for the design of novel drugs and medicines. The current market trends for functional foods and nutraceutical products has created a market niche for over-the-counter products which claim health effects and well-being improvement. However, considering the variability of the composition of raw materials, there is an urgent need to evaluate the chemical composition and the bioactive properties of commercially available formulations of natural products. In this context, our results indicate a significant variability in the chemical profile, and the antioxidant and antibacterial properties among the tested commercial samples of Withania somnifera associated with differences in chemical composition of the formulations due to the varied origin of the raw materials and the plant part used, as well the extraction protocol (hydromethanolic and aqueous extracts) implemented in our study. In particular, the aqueous extracts were more abundant in polyphenols with catechin and quercetin being found in the higher amount in both extracts, whereas synapic and vanillic acids were found in the lowest content. Moreover, aqueous extracts were richer in ascorbic acid and recorded higher antioxidant activity (especially in the case of DPPH assay) than the hydromethanolic extracts. Similarly, the aqueous extracts recorded higher antibacterial efficiency than the hydromethanolic ones, while roots in capsule form from India (e.g., samples 4 and 6), or ground roots from unknown origin or from India (e.g., samples 10 and 15, respectively) showed the best overall performance. On the other hand, the hydromethanolic extracts showed higher inhibitory activity against AChe than the aqueous extracts, whereas the opposite trend was recorded for the BChe activity. Finally, phenolic compounds were significantly positively correlated with the recorded biological activity of the tested extracts, indicating their important antioxidant potential in W. somnifera extracts. In conclusion, although W. somnifera is associated with several beneficial health effects, the products available over the counter do not ensure that they always possess these effects and further control is needed. Moreover, the processing of the studied products highlighted the importance of the extraction method to the obtained bioactive compounds and by extension to the potential health effects.

Supplementary Materials

The following supporting information can be downloaded at: https://www.mdpi.com/article/10.3390/antiox12030550/s1, Table S1: Acetylcholinesterase (AChE) and butyrylcholinesterase (BChE) activity (% comparing to control samples) after treatment by 9-Amino-1,2,3,4-tetrahydroacridine hydrochloride hydrate; Table S2: Pearson’s correlation analysis for the hydromethanolic extracts of the tested W. somnifera commercial samples; Table S3: Pearson’s correlation analysis for the aqueous extracts of the tested W. somnifera commercial samples.

Author Contributions

Conceptualization, A.V.; methodology, M.P., E.G. and A.K.; software, M.P. and A.P.; validation, M.P., S.A.P., T.Ś. and A.P.; formal analysis, M.P., T.Ś., A.K., S.A.P. and A.V.; investigation, M.P., E.G., A.K. and A.P.; resources, T.Ś., A.K. and A.V.; data curation, M.P., S.A.P., T.Ś., A.K. and A.P.; writing—original draft preparation, S.A.P., T.Ś. and A.V.; writing—review and editing, S.A.P. and A.V.; visualization, A.V.; supervision, S.A.P. and A.V.; project administration, S.A.P. and A.V.; funding acquisition, A.V. All authors have read and agreed to the published version of the manuscript.

Funding

The study was supported by the project POWR.03.02.00-00-I014/17-00 co-financed by the European Union through the European Social Fund under the Operational Programme Knowledge Education Development 2014–2020, and the Ministry of Science and Higher Education, Poland, grant number 02-0015/07/505.

Institutional Review Board Statement

Not applicable.

Informed Consent Statement

Not applicable.

Data Availability Statement

Data is available upon request.

Acknowledgments

Not applicable.

Conflicts of Interest

The authors declare no conflict of interest.

References

  1. Winters, M. Ancient medicine, modern use: Withania somnifera and its potential role in integrative oncology. Altern. Med. Rev. 2006, 11, 269–277. [Google Scholar] [PubMed]
  2. Ven Murthy, M.R.; Ranjekar, P.K.; Ramassamy, C.; Deshpande, M. Scientific Basis for the Use of Indian Ayurvedic Medicinal Plants in the Treatment of Neurodegenerative Disorders: 1. Ashwagandha. Cent. Nerv. Syst. Agents Med. Chem. 2010, 10, 238–246. [Google Scholar] [CrossRef] [PubMed]
  3. Mabberley, D.J. Mabberley’s Plant-Book: A Portable Dictionary of Plants, Their Classification and Uses; Cambridge University Press: Cambridge, UK, 2008; ISBN 978-0521820714. [Google Scholar]
  4. Mirjalili, M.H.; Moyano, E.; Bonfill, M.; Cusido, R.M.; Palazón, J. Steroidal lactones from Withania somnifera, an ancient plant for novel medicine. Molecules 2009, 14, 2373–2393. [Google Scholar] [CrossRef] [PubMed] [Green Version]
  5. Kulkarni, S.K.; Dhir, A. Withania somnifera: An Indian ginseng. Prog. Neuro-Psychopharmacology Biol. Psychiatry 2008, 32, 1093–1105. [Google Scholar] [CrossRef] [PubMed]
  6. Marderosion, A.D. The Review of Natural Products, Facts and Comparisons; Lippincott Williams & Wilkins: St. Louis, MI, USA, 2001. [Google Scholar]
  7. Upton, R.; Graff, A.; Evans, F. Ashwagandha Root: Withania Somnifera: Analytical, Quality Control, and Therapeutic Monograph; American Herbal Pharmacopoeia: Santa Cruz, CA, USA, 2000. [Google Scholar]
  8. Chandra, P.; Kannujia, R.; Saxena, A.; Srivastava, M.; Bahadur, L.; Pal, M.; Singh, B.P.; Kumar Ojha, S.; Kumar, B. Quantitative determination of multi markers in five varieties of Withania somnifera using ultra-high performance liquid chromatography with hybrid triple quadrupole linear ion trap mass spectrometer combined with multivariate analysis: Application. J. Pharm. Biomed. Anal. 2016, 129, 419–426. [Google Scholar] [CrossRef] [PubMed]
  9. Gurav, S.; Wanjari, M.; Bhole, R.; Raut, N.; Prasad, S.; Saoji, S.; Chikhale, R.; Khanal, P.; Pant, A.; Ayyanar, M.; et al. Ethnological validation of Ashwagandha (Withania somnifera L. Dunal) ghrita as ‘Vajikarana Rasayana’: In-silico, in-vitro and in-vivo approach. J. Ethnopharmacol. 2023, 304, 116064. [Google Scholar] [CrossRef]
  10. Singh, N.; Bhalla, M.; de Jager, P.; Gilca, M. An overview on Ashwagandha: A Rasayana (Rejuvenator) of Ayurveda. African J. Tradit. Complement. Altern. Med. 2011, 8, 208–213. [Google Scholar] [CrossRef]
  11. Kaur, K.; Rani, G.; Widodo, N.; Nagpal, A.; Taira, K.; Kaul, S.C.; Wadhwa, R. Evaluation of the anti-proliferative and anti-oxidative activities of leaf extract from in vivo and in vitro raised Ashwagandha. Food Chem. Toxicol. 2004, 42, 2015–2020. [Google Scholar] [CrossRef]
  12. Hussain, S.A.; Panjagari, N.R.; Singh, R.R.B.; Patil, G.R. Potential Herbs and Herbal Nutraceuticals: Food Applications and Their Interactions with Food Components. Crit. Rev. Food Sci. Nutr. 2015, 55, 94–122. [Google Scholar] [CrossRef]
  13. Azgomi, R.N.D.; Zomorrodi, A.; Nazemyieh, H.; Fazljou, S.M.B.; Bazargani, H.S.; Nejatbakhsh, F.; Jazani, A.M.; Asrbadr, Y.A. Effects of Withania somnifera on Reproductive System: A Systematic Review of the Available Evidence. Biomed Res. Int. 2018, 2018, 4076430. [Google Scholar] [CrossRef] [Green Version]
  14. Bhat, J.A.; Akther, T.; Najar, R.A.; Rasool, F.; Hamid, A. Withania somnifera (L.) Dunal (Ashwagandha); current understanding and future prospect as a potential drug candidate. Front. Pharmacol. 2022, 13, 1029123. [Google Scholar] [CrossRef] [PubMed]
  15. Singh, R.H.; Narsimhamurthy, K.; Singh, G. Neuronutrient impact of Ayurvedic Rasayana therapy in brain aging. Biogerontology 2008, 9, 369–374. [Google Scholar] [CrossRef] [PubMed]
  16. Maccioni, R.; Cottiglia, F.; Maccioni, E.; Talani, G.; Sanna, E.; Bassareo, V.; Kasture, S.B.; Acquas, E. The biologically active compound of Withania somnifera (L.) Dunal, docosanyl ferulate, is endowed with potent anxiolytic properties but devoid of typical benzodiazepine-like side effects. J. Psychopharmacol. 2021, 35, 1277–1284. [Google Scholar] [CrossRef] [PubMed]
  17. Murthy, S.V.; Fathima, S.N.; Mote, R. Hydroalcoholic Extract of Ashwagandha Improves Sleep by Modulating GABA/Histamine Receptors and EEG Slow-Wave Pattern in In Vitro-In Vivo Experimental Models. Prev. Nutr. Food Sci. 2022, 27, 108–120. [Google Scholar] [CrossRef] [PubMed]
  18. Ziauddin, M.; Phansalkar, N.; Patki, P.; Diwanay, S.; Patwardhan, B. Studies on the immunomodulatory effects of Ashwagandha. J. Ethnopharmacol. 1996, 50, 69–76. [Google Scholar] [CrossRef] [PubMed]
  19. Pawar, P.; Gilda, S.; Sharma, S.; Jagtap, S.; Paradkar, A.; Mahadik, K.; Ranjekar, P.; Harsulkar, A. Rectal gel application of Withania somnifera root extract expounds anti-inflammatory and muco-restorative activity in TNBS-induced Inflammatory Bowel Disease. BMC Complement. Altern. Med. 2011, 11, 34. [Google Scholar] [CrossRef] [PubMed] [Green Version]
  20. Miraj, S. Scientific basis for the therapeutic use of Withania somnifera (Ashwagandha): A review. Altern. Med. Rev. 2000, 5, 334–346. [Google Scholar]
  21. Patil, D.; Gautam, M.; Mishra, S.; Karupothula, S.; Gairola, S.; Jadhav, S.; Pawar, S.; Patwardhan, B. Determination of withaferin A and withanolide A in mice plasma using high-performance liquid chromatography-tandem mass spectrometry: Application to pharmacokinetics after oral administration of Withania somnifera aqueous extract. J. Pharm. Biomed. Anal. 2013, 80, 203–212. [Google Scholar] [CrossRef] [PubMed]
  22. Singh, K.B.; Hahm, E.-R.; Kim, S.-H.; Singh, S. V Withaferin A Inhibits Fatty Acid Synthesis in Rat Mammary Tumors. Cancer Prev. Res. 2023, 16, 5–16. [Google Scholar] [CrossRef]
  23. Nile, S.H.; Liang, Y.; Wang, Z.; Zheng, J.; Sun, C.; Nile, A.; Patel, G.; Kai, G. Chemical composition, cytotoxic and pro-inflammatory enzyme inhibitory properties of Withania somnifera (L.) Dunal root extracts. S. Afr. J. Bot. 2021, 151, 46–53. [Google Scholar] [CrossRef]
  24. Saleem, S.; Muhammad, G.; Hussain, M.A.; Altaf, M.; Abbas Bukhari, S.N. Withania somnifera L.: Insights into the phytochemical profile, therapeutic potential, clinical trials, and future prospective. Iran. J. Basic Med. Sci. 2020, 23, 1501–1526. [Google Scholar] [CrossRef] [PubMed]
  25. Ghoshal, S.; Ghule, C.; Mirgal, A.; Girme, A.; Hingorani, L. Recent findings by high-performance thin-layer chromatographic separation for a comprehensive analysis of Withania somnifera by densitometry and mass spectrometry: An assessment to quality and adulteration. JPC-J. Planar Chromatogr.-Mod. TLC 2022, 35, 439–451. [Google Scholar] [CrossRef]
  26. Saini, D.; Madan, K.; Chauhan, S. Screening of Phytoconstituents from Traditional Plants against SARSCoV-2 using Molecular Docking Approach. Lett. Drug Des. Discov. 2022, 19, 1022–1038. [Google Scholar]
  27. Kumar, V.; Dey, A.; Hadimani, M.B.; Marcovic, T.; Emerald, M. Chemistry and pharmacology of withania somnifera: An update. Tang Humanit. Med. 2015, 5, 1.1–1.13. [Google Scholar] [CrossRef] [Green Version]
  28. Teixeira, T.S.; Vale, R.C.; Almeida, R.R.; Ferreira, T.P.S.; Guimarães, L.G.L. Antioxidant potential and its correlation with the contents of phenolic compounds and flavonoids of methanolic extracts from different medicinal plants. Rev. Virtual Quim. 2017, 9, 1546–1559. [Google Scholar] [CrossRef]
  29. Latheef, S.K.; Dhama, K.; Samad, H.A.; Wani, M.Y.; Kumar, M.A.; Palanivelu, M.; Malik, Y.S.; Singh, S.D.; Singh, R. Immunomodulatory and prophylactic efficacy of herbal extracts against experimentally induced chicken infectious anaemia in chicks: Assessing the viral load and cell mediated immunity. Virus Dis. 2017, 28, 115–120. [Google Scholar] [CrossRef] [Green Version]
  30. Kumar, V.; Dhanjal, J.K.; Kaul, S.C.; Wadhwa, R.; Sundar, D. Withanone and caffeic acid phenethyl ester are predicted to interact with main protease (Mpro) of SARS-CoV-2 and inhibit its activity. J. Biomol. Struct. Dyn. 2020, 39, 3842–3854. [Google Scholar] [CrossRef]
  31. Singh, R.; Goel, S.; Bourgeade, P.; Aleya, L.; Tewari, D. Ayurveda Rasayana as antivirals and immunomodulators: Potential applications in COVID-19. Environ. Sci. Pollut. Res. 2021, 28, 55925–55951. [Google Scholar] [CrossRef]
  32. Mekbib, S.B.; Regnier, T.J.C.; Sivakumar, D.; Korsten, L. Evaluation of ethiopian plant extracts, Acacia seyal and Withania somnifera, to control green mould and ensure quality maintenance of citrus (Citrus sinensis L.). Fruits 2009, 64, 285–294. [Google Scholar] [CrossRef] [Green Version]
  33. Tomar, V.; Beuerle, T.; Sircar, D. A validated HPTLC method for the simultaneous quantifications of three phenolic acids and three withanolides from Withania somnifera plants and its herbal products. J. Chromatogr. B Anal. Technol. Biomed. Life Sci. 2019, 1124, 154–160. [Google Scholar] [CrossRef]
  34. Alam, N.; Hossain, M.; Khalil, M.I.; Moniruzzaman, M.; Sulaiman, S.A.; Gan, S.H. High catechin concentrations detected in Withania somnifera (ashwagandha) by high performance liquid chromatography analysis. BMC Complement. Altern. Med. 2011, 11, 65. [Google Scholar] [CrossRef] [PubMed] [Green Version]
  35. Polumackanycz, M.; Konieczynski, P.; Orhan, I.E.; Abaci, N.; Viapiana, A. Chemical Composition, Antioxidant and Anti-Enzymatic Activity of Golden Root (Rhodiola rosea L.) Commercial Samples. Antioxidants 2022, 11, 919. [Google Scholar] [CrossRef] [PubMed]
  36. Viapiana, A.; Struck-Lewicka, W.; Konieczynski, P.; Wesolowski, M.; Kaliszan, R. An approach based on HPLC-fingerprint and chemometrics to quality consistency evaluation of Matricaria chamomilla L. commercial samples. Front. Plant Sci. 2016, 7, 1561. [Google Scholar] [CrossRef] [PubMed] [Green Version]
  37. Singleton, S.; Rossi, J. Colorimetry of total phenolics with phosphomolybdic-phosphotungstic acid reagents. Am. J. Enol. Vitic. 1965, 16, 144–158. [Google Scholar]
  38. European Medicines Agency European Pharmacopoeia 2002, 1308.31. Available online: https://www.ema.europa.eu/en/glossary/european-pharmacopoeia (accessed on 1 January 2023).
  39. Health, P.M. Polish Pharmacopoeia VI 2002, 150. Available online: https://www.urpl.gov.pl/en/polish-pharmacopoeia (accessed on 1 January 2023).
  40. Abdelmageed, O.H.; Khashaba, P.Y.; Askal, H.F.; Saleh, G.A.; Refaat, I.H. Selective spectrophotometric determination of ascorbic acid in drugs and foods. Talanta 1995, 42, 573–579. [Google Scholar] [CrossRef]
  41. Tuberoso, C.I.G.; Rosa, A.; Bifulco, E.; Melis, M.P.; Atzeri, A.; Pirisi, F.M.; Dessì, M.A. Chemical composition and antioxidant activities of Myrtus communis L. berries extracts. Food Chem. 2010, 123, 1242–1251. [Google Scholar] [CrossRef]
  42. Arnao, M.B.; Cano, A.; Acosta, M. The hydrophilic and lipophilic contribution to total antioxidant activity. Food Chem. 2001, 73, 239–244. [Google Scholar] [CrossRef]
  43. Benzie, I.F.; Straint, J.J. The ferric reducing ability of plasma (FRAP) as a measure of ‘“Antioxidant Power”’: The FRAP assay. Anal. Biochem. 1996, 239, 70–76. [Google Scholar] [CrossRef] [PubMed] [Green Version]
  44. Polumackanycz, M.; Kaszuba, M.; Konopacka, A.; Marzec-Wróblewska, U.; Wesolowski, M.; Waleron, K.; Bucinski, A.; Agnieszka, V. Phenolic Composition and Biological Properties of Wild and Commercial Dog Rose Fruits and Leaves Milena. Molecules 2020, 25, 5272. [Google Scholar] [CrossRef]
  45. Polumackanycz, M.; Sledzinski, T.; Goyke, E.; Wesolowski, M.; Viapiana, A. A comparative study on the phenolic composition and biological activities of Morus alba L. commercial samples. Molecules 2019, 24, 3082. [Google Scholar] [CrossRef] [Green Version]
  46. Dhanani, T.; Shah, S.; Gajbhiye, N.A.; Kumar, S. Effect of extraction methods on yield, phytochemical constituents and antioxidant activity of Withania somnifera. Arab. J. Chem. 2017, 10, S1193–S1199. [Google Scholar] [CrossRef] [Green Version]
  47. Ganguly, B.; Kumar, N.; Ahmad, A.H.; Rastogi, S.K. Influence of phytochemical composition on in vitro antioxidant and reducing activities of Indian ginseng [Withania somnifera (L.) Dunal] root extracts. J. Ginseng Res. 2018, 42, 463–469. [Google Scholar] [CrossRef] [PubMed]
  48. Kumar, A.Y.; Chandra, D.R. In vitro screening of Ashwagandha root extracts for the maximum functional components. Pharma Innov. 2018, 7, 12–16. [Google Scholar]
  49. Mojzer, E.B.; Hrnčič, M.K.; Škerget, M.; Knez, Ž.; Bren, U. Polyphenols: Extraction Methods, Antioxidative Action, Bioavailability and Anticarcinogenic Effects. Molecules 2016, 21, 901. [Google Scholar] [CrossRef] [PubMed]
  50. Turrini, F.; Donno, D.; Beccaro, G.L.; Pittaluga, A.; Grilli, M.; Zunin, P.; Boggia, R. Bud-derivatives, a novel source of polyphenols and how different extraction processes affect their composition. Foods 2020, 9, 1343. [Google Scholar] [CrossRef]
  51. Islam, M.S.; Yoshimoto, M.; Ishiguro, K.; Okuno, S.; Yamakawa, O. Effect of artificial shading and temperature on radical scavenging activity and polyphenolic composition in sweetpotato (Ipomoea batatas L.) leaves. J. Am. Soc. Hortic. Sci. 2003, 128, 182–187. [Google Scholar] [CrossRef]
  52. Petropoulos, S.; Fernandes, A.; Barros, L.; Ferreira, I. A comparison of the phenolic profile and antioxidant activity of different Cichorium spinosum L. ecotypes. J. Sci. Food Agric. 2017, 98, 183–189. [Google Scholar] [CrossRef] [Green Version]
  53. Chrysargyris, A.; Mikallou, M.; Petropoulos, S.; Tzortzakis, N. Profiling of essential oils components and polyphenols for their antioxidant activity of medicinal and aromatic plants grown in different environmental conditions. Agronomy 2020, 10, 727. [Google Scholar] [CrossRef]
  54. Chaudhary, N.; Sabikhi, L.; Hussain, S.A.; Kumar, M.H.S. A comparative study of the antioxidant and ACE inhibitory activities of selected herbal extracts. J. Herb. Med. 2020, 22, 100343. [Google Scholar] [CrossRef]
  55. Paul, R.K. In Vitro Antioxidant Activity of Withania somnifera Root. Int. J. Adv. Res. Chem. Sci. 2016, 3, 45–56. [Google Scholar] [CrossRef]
  56. Pereira, C.; Barros, L.; Ferreira, I.C.F.R. Analytical tools used to distinguish chemical profiles of plants widely consumed as infusions and dietary supplements: Artichoke, milk thistle, and borututu. Food Anal. Methods 2014, 7, 1604–1611. [Google Scholar] [CrossRef] [Green Version]
  57. Wojdyło, A.; Oszmiański, J.; Czemerys, R. Antioxidant activity and phenolic compounds in 32 selected herbs. Food Chem. 2007, 105, 940–949. [Google Scholar] [CrossRef]
  58. Teleszko, M.; Wojdyło, A. Comparison of phenolic compounds and antioxidant potential between selected edible fruits and their leaves. J. Funct. Foods 2015, 14, 736–746. [Google Scholar] [CrossRef]
  59. Rice-Evans, C.A.; Miller, N.J.; Paganga, G. Antioxidant properties of phenolic compounds. Trends Plant Sci. 1997, 2, 152–159. [Google Scholar] [CrossRef]
  60. Proestos, C.; Komaitis, M. Ultrasonically assisted extraction of phenolic compounds from aromatic plants: Comparison with conventional extraction technics. J. Food Qual. 2006, 29, 567–582. [Google Scholar] [CrossRef]
  61. Nile, S.H.; Nile, A.; Gansukh, E.; Baskar, V.; Kai, G. Subcritical water extraction of withanosides and withanolides from ashwagandha (Withania somnifera L) and their biological activities. Food Chem. Toxicol. 2019, 132, 110659. [Google Scholar] [CrossRef]
  62. Fernando, I.D.N.S.; Abeysinghe, D.C.; Dharmadasa, R.M. Determination of phenolic contents and antioxidant capacity of different parts of Withania somnifera (L.) Dunal. from three different growth stages. Ind. Crops Prod. 2013, 50, 537–539. [Google Scholar] [CrossRef]
  63. Elmastaş, M.; Demir, A.; Genç, N.; Dölek, Ü.; Güneş, M. Changes in flavonoid and phenolic acid contents in some Rosa species during ripening. Food Chem. 2017, 235, 154–159. [Google Scholar] [CrossRef]
  64. Datta, S.; Kumar Pal, N.; Nandy, A.K. Inhibition of the emergence of multi drug resistant Staphylococcus aureus by Withania somnifera root extracts. Asian Pac. J. Trop. Med. 2011, 4, 917–920. [Google Scholar] [CrossRef] [Green Version]
  65. Arora, S.; Dhillon, S.; Rani, G.; Nagpal, A. The in vitro antibacterial/synergistic activities of Withania somnifera extracts. Fitoterapia 2004, 75, 385–388. [Google Scholar] [CrossRef]
  66. Rizwana, H.; Al Hazzani, A.A.; Shehata, A.I.; Moubayed, N.M.S. Antibacterial potential of Withania somnifera L. against human pathogenic bacteria. African J. Microbiol. Res. 2012, 6, 4810–4815. [Google Scholar] [CrossRef]
  67. Mehrotra, V.; Mehrotra, S.; Kirar, V.; Shyam, R.; Misra, K.; Srivastava, A.K.; Nandi, S.P. Antioxidant and antimicrobial activities of aqueous extract of Withania somnifera against methicillin-resistant Staphylococcus aureus. J. Microbiol. Biotechnol. Res. Sch. Res. Libr. J. Microbiol. Biotech. Res 2011, 1, 40–45. [Google Scholar]
  68. Murugan, R.; Rajesh, R.; Seenivasan, B.; Haridevamuthu, B.; Sudhakaran, G.; Guru, A.; Rajagopal, R.; Kuppusamy, P.; Juliet, A.; Gopinath, P.; et al. Withaferin A targets the membrane of Pseudomonas aeruginosa and mitigates the inflammation in zebrafish larvae; an in vitro and in vivo approach. Microb. Pathog. 2022, 172, 105778. [Google Scholar] [CrossRef] [PubMed]
  69. Gebeyehu, A.G.; Walle, K.Z.; Birhanu, M.Z.; Gebeyehu, R. Structural Elucidation and Antibacterial Activity Studies of Leaf Extracts of Withania somnifera. Indones. J. Chem. 2022, 22, 1586–1595. [Google Scholar] [CrossRef]
  70. Ha, J.W.; Yu, J.S.; Lee, B.S.; Kang, D.M.; Ahn, M.J.; Kim, J.K.; Kim, K.H. Structural Characterization of Withanolide Glycosides from the Roots of Withania somnifera and Their Potential Biological Activities. Plants 2022, 11, 767. [Google Scholar] [CrossRef] [PubMed]
  71. Balkrishna, A.; Gupta, A.K.; Singh, K.; Haldar, S.; Varshney, A. Effects of fatty acids in super critical fluid extracted fixed oil from Withania somnifera seeds on Gram-negative Salmonella enterica biofilms. Phytomedicine Plus 2021, 1, 100047. [Google Scholar] [CrossRef]
  72. Mehta, J.; Rolta, R.; Dev, K. Role of medicinal plants from North Western Himalayas as an efflux pump inhibitor against MDR AcrAB-TolC Salmonella enterica serovar typhimurium: In vitro and In silico studies. J. Ethnopharmacol. 2022, 282, 114589. [Google Scholar] [CrossRef]
  73. Khandia, R.; Viswanathan, N.; Singhal, S.; Alqahtani, T.; Almikhlafi, A.M.; Simonov, N.A.; Ashraf, M.G. Ameliorative Effects of Phytomedicines on Alzheimer’s Patients. Curr. Alzheimer Res. 2022, 19, 420–439. [Google Scholar] [CrossRef]
  74. Khan, S.A.; Khan, S.B.; Shah, Z.; Asiri, A.M. Withanolides: Biologically Active Constituents in the Treatment of Alzheimer’s Disease. Med. Chem. 2016, 12, 238–256. [Google Scholar] [CrossRef]
  75. Vinutha, B.; Prashanth, D.; Salma, K.; Sreeja, S.L.; Pratiti, D.; Padmaja, R.; Radhika, S.; Amit, A.; Venkateshwarlu, K.; Deepak, M. Screening of selected Indian medicinal plants for acetylcholinesterase inhibitory activity. J. Ethnopharmacol. 2007, 109, 359–363. [Google Scholar] [CrossRef]
  76. Durg, S.; Dhadde, S.B.; Vandal, R.; Shivakumar, B.S.; Charan, C.S. Withania somnifera (Ashwagandha) in neurobehavioural disorders induced by brain oxidative stress in rodents: A systematic review and meta-analysis. J. Pharm. Pharmacol. 2015, 67, 879–899. [Google Scholar] [CrossRef] [PubMed]
  77. Pal, A.; Kumar, K.H.; Bhushan, B.; Saharan, V. Ashwagandha root extract inhibits acetylcholine esterase, protein modification and ameliorates H2O2-Induced oxidative stress in rat lymphocytes. Pharmacogn. J. 2017, 9, 302–309. [Google Scholar] [CrossRef] [Green Version]
  78. Pai, V.; Chandrashekar, K.S.; Pai, A.; Muralidharan, A.; Setty, M.M. In-vitro and in-silico correlation studies of natural ache inhibitors: An approach towards Alzheimer’s disease. Rasayan J. Chem. 2021, 2021, 83–91. [Google Scholar] [CrossRef]
  79. Choudhary, M.I.; Nawaz, S.A.; Zaheer, U.-H.; Lodhi, M.A.; Ghayur, M.N.; Jalil, S.; Riaz, N.; Yousuf, S.; Malik, A.; Gilani, A.H.; et al. Withanolides, a new class of natural cholinesterase inhibitors with calcium antagonistic properties. Biochem. Biophys. Res. Commun. 2005, 334, 276–287. [Google Scholar] [CrossRef] [PubMed]
  80. Schliebs, R.; Liebmann, A.; Bhattacharya, S.K.; Kumar, A.; Ghosal, S.; Bigl, V. Systemic administration of defined extracts from Withania somnifera (Indian Ginseng) and Shilajit differentially affects cholinergic but not glutamatergic and gabaergic markers in rat brain. Neurochem. Int. 1997, 30, 181–190. [Google Scholar] [CrossRef]
  81. Pandey, A.; Bani, S.; Dutt, P.; Kumar Satti, N.; Avtar Suri, K.; Nabi Qazi, G. Multifunctional neuroprotective effect of Withanone, a compound from Withania somnifera roots in alleviating cognitive dysfunction. Cytokine 2018, 102, 211–221. [Google Scholar] [CrossRef]
  82. Bhatnagar, M.; Suhalka, P.; Sukhwal, P.; Jain, A.; Sharma, D. Inhibition of acetylcholinesterase and NO synthase activity in the mice brain: Effect of a Withania somnifera leaf juice. Neurophysiology 2012, 44, 301–308. [Google Scholar] [CrossRef]
  83. Singh, V.K.; Mundkinajeddu, D.; Koshy, R.; Bhat, D.; Nithin, J.; Balaji, K.R.; Gayathri, A.G. A Bioassay Approach To Complement Chemical Standardization of Ashwagandha Root Extracts. Rasayan J. Chem. 2022, 15, 2258–2266. [Google Scholar] [CrossRef]
  84. Khattak, S.; Saeed-Ur-Rehman; Shah, H.U.; Khan, T.; Ahmad, M. In vitro enzyme inhibition activities of crude ethanolic extracts derived from medicinal plants of Pakistan. Nat. Prod. Res. 2005, 19, 567–571. [Google Scholar] [CrossRef]
  85. Raza, M.A.; Danish, M.; Mushtaq, M.; Sumrra, S.H.; Saqib, Z.; Ur Rehman, S. Phenolic profiling and therapeutic potential of local flora of Azad Kashmir; In vitro enzyme inhibition and antioxidant. Open Chem. 2017, 15, 371–379. [Google Scholar] [CrossRef] [Green Version]
  86. Tousif, M.I.; Nazir, M.; Saleem, M.; Tauseef, S.; Uddin, R.; Altaf, M.; Zengin, G.; Ak, G.; Ozturk, R.B.; Mahomoodally, M.F. Exploring the industrial importance of a miracle herb Withania somnifera (L.) Dunal: Authentication through chemical profiling, in vitro studies and computational analyses. Process Biochem. 2022, 121, 514–528. [Google Scholar] [CrossRef]
  87. Mathew, M.; Subramanian, S. In vitro screening for anti-cholinesterase and antioxidant activity of methanolic extracts of ayurvedic medicinal plants used for cognitive disorders. PLoS ONE 2014, 9, e0086804. [Google Scholar] [CrossRef] [PubMed]
  88. Khan, M.A.; Srivastava, V.; Kabir, M.; Samal, M.; Insaf, A.; Ibrahim, M.; Zahiruddin, S.; Ahmad, S. Development of Synergy-Based Combination for Learning and Memory Using in vitro, in vivo and TLC-MS-Bioautographic Studies. Front. Pharmacol. 2021, 12, 1–14. [Google Scholar] [CrossRef] [PubMed]
Figure 1. Three-dimensional scatterplot of principal components 1, 2, and 3 for the tested Withania somnifera samples extracted with two different protocols (hydromethanolic and aqueous extracts).
Antioxidants 12 00550 g001
Figure 2. The loading plot of principal components 1 and 2 for the tested Withania somnifera samples extracted with two different protocols (hydromethanolic and aqueous extracts).
Antioxidants 12 00550 g002
Figure 3. The loading plot of principal components 1 and 3 for the tested Withania somnifera samples extracted with two different protocols (hydromethanolic and aqueous extracts).
Antioxidants 12 00550 g003
Table 1. List of analyzed commercial samples of W. somnifera L.
No.Sample Name on the PackagePart of the
Plant
ConfectionPlace of Origin of Plant MaterialPlace of ManufactureRetailer Name
1.Gold AshwagandhaRootCapsule UnknownPolandGemini
2.AshwagandhaRootTablet IndiaSwedenGemini
3.AshwagandhaRootCapsule UnknownUSAGemini
4.AshwagandhaRootCapsule IndiaGermanyFragaria
5.Bicaps AshwagandhaRootCapsule UnknownPolandFragaria
6.AshvagandhaRhizomeCapsule IndiaIndiaEko-Ziola
7.Ashwagandha RootRootSolid powder UnknownPolandEko-Ziola
8.AshwagandhaRootCapsule UnknownUSAGemini
9.Ashwagandha 100% NaturalWhole plantTablet UnknownPolandEko-Ziola
10.Ashwagandha (root) in powder RootGround rootUnknownPolandGemini
11.Ashwagandha RootCrushed rootUnknownPolandNagietek
12.AshwagandhaRootSliced rootIndiaPolandAuchan
13.AshwagandhaRootGround rootIndiaPolandAuchan
14.AshwagandhaRootCapsule UnknownUSAGemini
15.Bio AshwagandhaRootGround rootIndiaPolandFragaria
16.AshwagandhaRootGround rootIndiaPolandNagietek
17.AshwagandhaRootCapsule IndiaPolandFragaria
18.AshwagandhaRootCrushed rootIndiaPolandNagietek
Table 2. Validation parameters of the calibration curves for the compounds quantified (GA—gallic acid, CAT—catechin, VA—vanillic acid, CA—caffeic acid, pCA—p-coumaric acid, FA—ferulic acid, SYN—sinapinic acid, RUT—rutin, Q—quercetin, NAR—naringenin) in this study (n = 3).
Compounds Regression Equation aLinearity
(µg/mL)
R2LODs
(µg/mL)
LOQs
(µg/mL)
GAy = 1160x – 367,73755.6–2780.98722.58.4
CATy = 58,916x – 28,17952.1–260.90.99713.513.2
VAy = 25,058x + 109,03854.8–274.20.98712.79.5
CAy = 28,663x + 307,36844.4–222.50.99853.412.5
pCAy = 11,754x + 69,77950.6–251.30.99563.112.0
FAy = 21,142x – 309,33555.1–265.40.99782.69.8
SYNy = 19,097x − 296,645 57.2–286.50.99812.910.6
RUTy = 20,735x + 44,71047.6–238.00.99782.07.1
Qy = 48,916x + 63,77950.1–250.30.99833.19.7
NARy = 41,794x – 22,31754.0–270.40.99342.69.1
a y is the peak area; x refers to the concentration of compounds (µg/mL); LOD: limit of detection; LOQ: limit of quantification.
Table 3. Total phenolic compounds (TPC), flavonoids (TF), phenolic acids (TPA), L(+) ascorbic acid (ASA) contents, and DPPH, ABTS, and FRAP assays in the tested hydromethanolic and aqueous extracts of W. somnifera samples (mean ± SD).
TPCTFTPAASADPPHABTSFRAP
Hydromethanolic Extractsmg GAE/g dwmg QE/g dwmg CAE/g dwmg ASA/g dwmg TE/100 g DWmg g DWµmol Fe2+/g dw
10.90 ± 0.12 e–g*0.18 ± 0.07 fg*0.11 ± 0.09 h*7.82 ± 1.72 e–g*19.48 ± 2.06 e*16.65 ± 1.65 e*8.03 ± 0.09 e–g*
22.03 ± 0.07 c*0.31 ± 0.02 c–f*2.04 ± 0.13 bc*13.32 ± 2.39 de*20.46 ± 2.1 de6*26.75 ± 1.59 e*9.27 ± 0.69 ef*
30.90 ± 0.01 e–g*0.21 ± 0.01 e–g*1.25 ± 0.10 de*6.77 ± 1.91 e–g*81.11 ± 2.47 a*47.10 ± 4.83 d*5.30 ± 0.32 gh*
41.75 ± 0.28 cd*0.64 ± 0.04 a*1.68 ± 0.13 cd*22.23 ± 3.53 bc*42.53 ± 3.53 cd*27.29 ± 0.48 e*34.53 ± 2.48 b
56.96 ± 0.04 a*0.26 ± 0.03 d–g*2.45 ± 0.10 ab*35.90 ± 1.10 a47.21 ± 5.66 c*122.54 ± 3.91 a*18.56 ± 1.54 c*
60.65 ± 0.09 g*0.32 ± 0.01 c–e*2.67 ± 0.09 a*35.46 ± 0.96 a*32.71 ± 4.58 c–e*124.84 ± 6.67 a*19.30 ± 2.06 c*
71.19 ± 0.03 d–g*0.40 ± 0.03 bc*0.54 ± 0.11 f–h*24.76 ± 2.84 b*22.16 ± 1.89 de*25.15 ± 6.41 e*10.70 ± 0.76 de*
83.80 ± 0.61 b*0.48 ± 0.07 b*2.71 ± 0.81 a*17.06 ± 2.81 cd*52.96 ± 4.98 bc*99.92 ± 6.77 b*45.57 ± 0.13 a*
90.82 ± 0.09 e–g*0.35 ± 0.04 cd*1.84 ± 0.39 c*20.98 ± 2.69 bc*38.36 ± 2.55 c–e*75.99 ± 9.86 c12.60 ± 0.30 d*
100.80 ± 0.07 e–g*0.21 ± 0.02 e–g*0.32 ± 0.02 gh*6.99 ± 2.54 e–g*76.45 ± 1.39 a*23.47 ± 2.67 e*8.51 ± 0.91 ef*
110.90 ± 0.22 e–g*0.22 ± 0.01 e–g*0.36 ± 0.04 gh*6.96 ± 0.80 e–g*80.82 ± 0.72 a*24.88 ± 0.49 e*8.29 ± 0.30 e–g*
120.67 ± 0.03 fg*0.16 ± 0.01 g*0.30 ± 0.06 gh*11.19 ± 0.57 d–f*79.93 ± 2.05 a*17.04 ± 2.33 e*7.79 ± 0.89 e–g*
130.65 ± 0.04 g*0.18 ± 0.04 fg*1.00 ± 0.05 ef*7.23 ± 0.82 e–g*80.34 ± 1.2 a*22.62 ± 6.26 e*13.02 ± 0.80 d
141.33 ± 0.17 de*0.19 ± 0.03 fg*0.47 ± 0.05 gh*2.46 ± 0.23 g*85.75 ± 1.87 a*26.28 ± 2.76 e*8.20 ± 1.38 e–g*
151.34 ± 0.07 de*0.16 ± 0.01 g*0.26 ± 0.01 gh*2.78 ± 0.43 g*87.82 ± 2.65 a*19.31 ± 3.46 e*10.01 ± 0.94 de*
161.29 ± 0.12 d–f*0.18 ± 0.02 fg*0.30 ± 0.05 gh*3.73 ± 0.83 g*91.17 ± 0.12 a*27.28 ± 2.56 a*6.90 ± 0.38 f–h*
171.35 ± 0.09 de*0.36 ± 0.09 cd*0.66 ± 0.02 fg*4.57 ± 1.09 fg*89.37 ± 2.43 a*21.68 ± 9.32 e*3.87 ± 0.35 h*
181.57 ± 0.38 cd*0.19 ± 0.01 fg*0.42 ± 0.09 gh*3.86 ± 0.26 g*71.96 ± 4.55 ab*16.54 ± 0.88 e*4.55 ± 0.31 h*
TPCTFTPAASADPPHABTSFRAP
Aqueous extractsmg GAE/g dwmg QE/g dwmg CAE/g dwmg ASA/g dwmg TE/100 g DWmg g DWµmol Fe2+/g dw
13.46 ± 0.03 c–f*3.41 ± 0.33 ab*0.82 ± 0.13 h*36.92 ± 1.84 cd*281.92 ± 2.66 a*48.07 ± 3.36 e–g*16.86 ± 4.03 ef*
25.19 ± 0.28 bc*2.29 ± 0.29 a–c*4.66 ± 0.83 de*60.42 ± 3.64 a*226.13 ± 4.36 bc*37.08 ± 3.43 f–h*35.54 ± 4.06 a–c*
32.99 ± 0.76 d–f*2.47 ± 0.53 a–c*3.95 ± 0.99 ef*35.40 ± 3.31 c–e*174.76 ± 9.85 e–g*72.97 ± 3.66 bc*15.12 ± 2.27 ef*
42.48 ± 0.08 ef*2.06 ± 0.28 bc*6.43 ± 0.35 bc*51.96 ± 5.02 ab*120.33 ± 5.06 hi*42.81 ± 0.91 e–g*34.08 ± 2.30 a–c
55.06 ± 1.01 bc*2.14 ± 0.06 bc*7.10 ± 1.75 ab*34.11 ± 3.96 c–f212.66 ± 9.93 b–d*82.23 ± 5.23 a–c*9.31 ± 9.72 g*
65.95 ± 1.97 a*3.60 ± 0.75 a*8.16 ± 0.84 a*19.54 ± 2.03 gh*177.04 ± 9.82 d–g*90.04 ± 3.26 a*13.87 ± 2.22 f*
72.87 ± 0.34 d–f*1.62 ± 0.02 c*2.49 ± 0.41 fg*54.73 ± 5.02 ab*127.35 ± 3.46 h*54.76 ± 5.86 de*14.80 ± 2.63 ef*
85.87 ± 0.59 a*2.60 ± 0.26 a–c*5.68 ± 1.83 cd*28.37 ± 2.33 d–g*93.66 ± 7.86 i*85.88 ± 3.70 ab*31.28 ± 6.15 a–d*
94.69 ± 0.42 b–d*1.62 ± 0.12 c*7.67 ± 0.35 ab*45.85 ± 4.36 bc*189.75 ± 6.72 d–f*72.71 ± 4.32 bc40.01 ± 3.14 a*
103.67 ± 0.08 c–e*2.36 ± 0.26 a–c*1.20 ± 0.26 gh*23.26 ± 2.53 d–h*212.18 ± 8.04 b–e*85.03 ± 3.13 ab*24.33 ± 1.14 c–f*
113.29 ± 0.01 d–f*2.37 ± 0.20 a–c*1.37 ± 0.22 gh*23.00 ± 2.57 e–h*204.31 ± 9.37 c–e*40.47 ± 7.59 e–g*18.71 ± 0.78 ef*
123.08 ± 0.18 d–f*2.20 ± 1.10 a–c*0.82 ± 0.28 h*21.32 ± 3.03 f–h*154.50 ± 4.36 f–h*21.31 ± 5.93 h*21.31 ± 0.66 d–f*
132.57 ± 0.14 ef*2.71 ± 0.05 a–c*1.43 ± 0.28 gh*29.54 ± 2.07 d–g*154.67 ± 6.62 f–h*26.21 ± 1.57 h*13.17 ± 0.73 f
144.52 ± 0.38 b–d*2.51 ± 0.40 a–c*2.62 ± 0.02 fg*34.57 ± 1.59 c–f*244.23 ± 3.93 b*42.40 ± 4.19 e–g*21.77 ± 4.60 d–f*
153.48 ± 0.31 c–f*1.93 ± 0.37 c*1.57 ± 0.27 gh*27.79 ± 5.65 d–g*200.32 ± 8.06 c–e*31.58 ± 2.53 gh*26.42 ± 5.81 b–e*
162.24 ± 0.18 ef*2.21 ± 0.47 a–c*0.99 ± 0.26 h*13.97 ± 3.10 h*192.49 ± 9.02 c–e*66.03 ± 5.09 cd*18.97 ± 2.91 ef*
173.12 ± 0.07 d–f*1.44 ± 0.22 c*5.21 ± 0.37 c–e*21.46 ± 2.30 f–h*143.26 ±5.48 g–h*75.04 ± 5.56 a–c*37.61 ± 1.36 ab*
181.73 ± 0.23 f*2.43 ± 0.90 a–c1.44 ± 0.25 gh*28.96 ± 3.39 d–g*118.91 ± 7.38 hi*52.44 ± 5.32 d–f*18.14 ± 3.56 ef*
Means followed by the same letter within the same column and for the same extraction method indicate no significant difference among samples according to Tukey’s HSD test (p < 0.05). The asterisk (*) symbol indicates significant differences between the different extraction protocols for the same sample according to Student’s t test (p < 0.05). Arabic numbers in the first column denote commercial samples of W. somnifera listed in Table 1.
Table 4. Phenolic compounds in W. somnifera L. samples (mean ± standard deviation).
GACATVACAFASYNpCARUTQNAR
Hydromethanolic Extracts
Sample No(µg/g)(mg/g)(µg/g)(µg/g)(µg/g)(µg/g)(µg/g)(µg/g)(mg/g)(µg/g)
1136.50 ± 2.81 c†1.04 ± 0.23 d*106.93 ± 1.32 b*305.28 ± 2.43 b262.55 ± 3.54 a–cNDND1085.06 ± 5.35 a1.25 ± 0.03 bc*573.38 ± 2.43 a
2252.71 ± 3.87 b*2.37 ± 0.76 b*ND367.33 ± 3.64 b*479.74 ± 2.57 a*ND271.91 ± 2.45 c764.42 ± 3.52 a–c*1.26 ± 0.04 b*499.58 ± 3.82 a*
3125.78 ± 1.36 c*1.42 ± 0.67 bc*99.08 ± 2.03 b*295.96 ± 2.62 b*270.47 ± 2.53 a–cNDND414.31 ± 4.75 c–e1.22 ± 0.06 bc*47.76 ± 3.89 c–e
4288.22 ± 2.71 b*6.54 ± 0.32 a*ND360.82 ± 1.75 b*458.57 ± 3.75 ab*132.56 ± 2.32 b277.71 ± 2.63 b*747.88 ± 3.86 a–d*1.49 ± 0.03 b*316.44 ± 2.81 b*
5120.67 ± 1.18 c*1.13 ± 0.12 d*150.46 ± 4.21 a*331.60 ± 3.67 b*ND185.43 ± 3.72 a*241.38 ± 1.34 d915.71 ± 4.63 ab*0.85 ± 0.03 c496.81 ± 3.87 a
6428.01 ± 2.82 a*2.16 ± 0.76 d*ND334.70 ± 3.32 b*174.93 ± 1.53 c*134.11 ± 2.98 b466.77 ± 3.78 a431.65 ± 3.57 c–e*1.28 ± 0.07 b*69.30 ± 3.82 c–e*
7119.91 ± 2.57 c2.28 ± 0.57 b*105.64 ± 1.32 b312.01 ± 4.04 bNDND151.29 ± 1.83 e423.91 ± 4.24 c–e1.37 ± 0.06 b49.22 ± 2.34 c–e
8118.23 ± 1.52 c*5.33 ± 1.67 d*ND505.28 ± 2.52 a*238.63 ± 2.56 bc*87.89 ± 1.65 c278.58 ± 2.43 b594.41 ± 5.75 b–e2.16 ± 0.12 a*174.01 ± 3.89 c*
9115.02 ± 2.56 c0.75 ± 0.12 d*104.64 ± 2.43 b*313.55 ± 2.45 b*NDNDND373.55 ± 2.54 de1.28 ± 0.07 b*137.85 ± 2.79 cd*
10115.85 ± 1.29 c*0.95 ± 0.25 d*ND310.57 ± 3.89 bNDNDND421.90 ± 2.87 c–e*1.37 ± 0.05 b*39.17 ± 1.93 de*
11123.65 ± 2.82 c*1.14 ± 0.57 d*ND327.03 ± 3.49 b262.11 ± 2.54 a–c*NDND377.81 ± 2.48 de*1.46 ± 0.07 b*ND
12114.17 ± 3.16 c1.05 ± 0.52 d*100.90 ± 2.73 b305.86 ± 2.10 bNDNDND403.12 ± 3.75 c–e1.45 ± 0.03 b*26.66 ± 2.79 de
13117.79 ± 1.27 c0.95 ± 0.63 d*ND309.70 ± 3.15 b255.37 ± 3.83 bcNDND381.22 ± 3.45 de1.32 ± 0.08 b*ND
14120.69 ± 2.18 c1.06 ± 0.29 d*101.83 ± 1.83 b*309.44 ± 2.07 b256.65 ± 3.82 bcNDND389.54 ± 4.01 c–e1.25 ± 0.06 b*ND
15111.67 ± 2.62 c*0.81 ± 0.26 d*ND300.01 ± 2.19 b244.50 ± 2.96 bcNDND743.20 ± 4.24 a–d1.32 ± 0.04 b*443.46 ± 3.27 ab*
16122.77 ± 2.17 c1.06 ± 0.17 d*ND297.99 ± 2.92 b266.68 ± 3.82 a–cNDND391.45 ± 3.29 c–e1.40 ± 0.06 b*ND
17114.70 ± 1.72 c0.75 ± 0.52 d*101.63 ± 2.10 b*328.55 ± 3.56 bNDNDND361.81 ± 2.08 e*1.23 ± 0.07 bcND
18108.92 ± 1.96 c0.84 ± 0.13 d*ND297.64 ± 2.91 bNDNDND360.34 ± 1.92 e1.26 ± 0.04 b*ND
GACATVACAFASYNpCARUTQNAR
Aqueous extracts
Sample no(mg/g)(mg/g)(µg/g)(µg/g)(µg/g)(µg/g)(µg/g)(µg/g)(mg/g)(mg/g)
1ND6.66 ± 1.02 ef*705.71 ± 1.78 d*NDND95.07 ± 1.04 aNDND1.06 ± 0.03 ab*ND
20.92 ± 0.05 cd*9.44 ± 1.87 bc*986.42 ± 2.87 a633.50 ± 1.32 a*264.77 ± 2.19 a*34.45 ± 0.43 c58.18 ± 1.43 d337.27 ± 2.03 b*0.65 ± 0.05 ab*1.60 ± 0.21 c*
30.95 ± 0.04 b–d*7.04 ± 0.84 d–f*674.14 ± 2.56 e*377.88 ± 1.92 b*NDND109.28 ± 1.53 aND0.68 ± 0.04 ab*ND
41.95 ± 0.08 a*8.71 ± 0.68 b–d*103.96 ± 1.48 h340.13 ± 1.78 b*297.31 ± 1.88 a*ND89.27 ± 1.93 b*105.23 ± 1.73 e*0.37 ± 0.03 bc*0.91 ± 0.06 d*
51.04 ± 0.05 b*11.93 ± 1.79 a*736.68 ± 2.77 c*102.93 ± 1.83 d*186.44 ± 1.76 b41.04 ± 0.54 b*25.09 ± 0.43 f115.52 ± 2.94 e*NDND
60.92 ± 0.04 cd*7.69 ± 2.75 c–f*884.32 ± 1.82 b273.31 ± 1.89 c*277.94 ± 2.01 a*ND15.22 ± 0.69 g357.07 ± 4.92 ab*0.68 ± 0.03 ab*1.67 ± 0.04 c*
7ND7.70 ± 1.88 c–f*NDNDNDND62.23 ± 0.88 dNDNDND
81.01 ± 0.03 bc*10.50 ± 2.96 ab*142.42 ± 1.78 g129.09 ± 2.04 e*291.33 ± 1.89 a*ND50.12 ± 0.72 e199.28 ± 2.12 d*0.72 ± 0.05 ab*1.77 ± 0.08 c*
9ND8.12 ± 2.03 c–e*874.62 ± 3.52 b*245.02 ± 2.12 c*204.39 ± 2.97 bND23.43 ± 0.65 f376.21 ± 1.93 a*0.33 ± 0.01 c*0.81 ± 0.03 d
100.95 ± 0.06 b–d*6.48 ± 0.78 ef*NDNDNDNDNDND0.99 ± 0.02 ab*2.41 ± 0.44 b*
110.88 ± 0.04 d*6.78 ± 0.52 ef*NDND271.60 ± 1.67 a*NDNDND1.03 ± 0.05 ab*ND
12ND6.48 ± 0.96 ef*NDNDNDNDNDND0.74 ± 0.04 ab*ND
13ND6.42 ± 0.99 ef*NDNDNDNDNDND1.02 ± 0.03 ab*ND
14ND6.66 ± 0.76 ef*710.96 ± 2.26 d*NDNDND76.11 ± 1.02 cND1.07 ± 0.04 a*ND
150.87 ± 0.05 d*6.34 ± 0.77 ef*NDNDNDNDNDND0.82 ± 0.05 ab*2.49 ± 0.12 b*
16ND6.53 ± 0.85 ef*NDNDNDNDNDND1.06 ± 0.03 ab*ND
17ND7.64 ± 1.74 c–f*631.10 ± 2.78 f*NDNDND73.07 ± 1.65 c254.44 ± 1.79 c*NDND
18ND5.98 ± 0.23 f*NDNDNDNDNDND0.99 ± 0.02 ab*9.92 ± 0.21 a
Means followed by the same letter within the same column and for the same extraction method indicate no significant difference among samples according to Tukey’s HSD test (p < 0.05). The asterisk (*) symbol indicates significant differences between the different extraction protocols for the same sample according to Student’s t test (p < 0.05). ND—not detected; GA—gallic 331 acid, CAT—catechin, VA—vanillic acid, CA—caffeic acid, pCA—p-coumaric acid, FA—ferulic acid, SYN—sinapinic acid, RUT—rutin, Q—quercetin, NAR—naringenin.
Table 5. Antibacterial activity of the aqueous extracts from W. somnifera (mg/mL) expressed as MIC and MBC.
S. aureus ATCC 6538MRSA 6374MRSA N315MRSA 18582MRSA 12673S. epidermidis ATCC 14990
Sample No MICMBCMICMBCMICMBCMICMBCMICMBCMICMBC
1.32>32832>32>321616>32>3216>32
2.280.5143281632>32432
3.1632832>32>32>32>32>32>32>32>32
4.1164>3224284>32432
6.288>32484168>32416
8.41616>32484832>32416
9.28142324168>32416
10.16>321>324>324>322>3248
11.16>328>328>324>3216>32432
15.4324>322>328>324>3228
S. pneumoniaeS. pyogenesE. hiraeE. faecalisB.subtillis ATCC 6633C. diphtheriae
Sample NoMICMBCMICMBCMICMBCMICMBCMICMBCMICMBC
1.16320.25232>3232>32240.51
2.8160.5132>328>324410.5
3.>32>320.25>32>32>32>32>32>32>320.25>32
4.480.250.258>32480.510.10.25
6.480.250.516>324>321211
8.8164>32>32>328>324488
9.484>3216>321>3288>32>32
10.484>3216>324>32110.54
11.484>3232>324>3211>32>32
15.284>328>321>320.50.5>32>32
MIC: minimum inhibitory concentration; MBC: minimum bactericidal concentration.
Table 6. Acetylcholinesterase (AChE) and butyrylcholinesterase (BChE) activity (%) compared to control samples (without extract) of hydromethanolic and aqueous extracts of W. somnifera commercial samples.
Cholinesterase Inhibition
AChEBChE
Sample No.Hydromethanolic ExtractsAqueous ExtractsHydromethanolic ExtractsAqueous
Extracts
183.24 ± 2.63 d*†71.25 ± 0.59 e*54.30 ± 1.76 bc*101.35 ± 0.85 c*
264.36 ± 5.27 i*46.46 ± 2.33 k*53.60 ± 1.37 c*90.17 ± 3.94 f*
363.83 ± 0.75 i*53.33 ± 5.3 i*40.07 ± 2.74 e*94.29 ± 4.53 e*
440.69 ± 9.4 k*59.17 ± 2.37 g*21.24 ± 0.83 h*60.30 ± 2.07 l*
5123 ± 11.77 a*46.46 ± 5.6 k*36.79 ± 1.89 f*76.44 ± 3.54 g*
684.04 ± 8.27 d*57.29 ± 3.86 h*55.96 ± 3.42 b*105.71 ± 4.39 b*
7107.45 ± 5.34 b106.88 ± 5.04 b78.28 ± 2.15 a*138.27 ± 1.12 a*
821.28 ± 1.04 l*67.29 ± 3.26 f*18.55 ± 4.15 i*69.94 ± 4.85 i*
977.93 ± 0.38 e*109.58 ± 3.54 a*21.41 ± 1.42 h*75.68 ± 1.31 gh*
1047.07 ± 0.58 j*41.88 ± 2.06 n*16.30 ± 1.17 j*49.95 ± 3.74 n*
1165.96 ± 1.50 i*43.96 ± 2.06 l*35.64 ± 0.21 f*74.91 ± 5.05 h*
1275.00 ± 4.51 f*51.46 ± 2.67 j*41.07 ± 0.75 e*69.43 ± 1.04 i*
1368.88 ± 1.88 h*58.96 ± 1.31 g*17.82 ± 2.83 ij*33.53 ± 0.85 o*
1471.81 ± 0.75 g*36.46 ± 3.26 o*46.42 ± 1.17 d*99.35 ± 1.31 d*
1583.24 ± 0.38 d*42.92 ± 2.43 m*46.15 ± 0.78 d*58.07 ± 3.91 m*
1689.89 ± 3.01 c88.13 ± 4.45 c27.11 ± 2.39 g*61.64 ± 9.51 k*
17120.74 ± 1.53 a*106.46 ± 2.45 b*47.81 ± 1.86 d*89.19 ± 1.51 f*
1887.50 ± 0.38 c*77.5 ± 4.73 d*53.64 ± 3.96 c*64.42 ± 1.38 j*
Means followed by the same letter within the same column and for the same extraction method indicate no significant difference among samples according to Tukey’s HSD test (p < 0.05). The asterisk (*) symbol indicates significant differences between the different extraction protocols for the same sample according to Student’s t test (p < 0.05).
Disclaimer/Publisher’s Note: The statements, opinions and data contained in all publications are solely those of the individual author(s) and contributor(s) and not of MDPI and/or the editor(s). MDPI and/or the editor(s) disclaim responsibility for any injury to people or property resulting from any ideas, methods, instructions or products referred to in the content.

