

Synthesis of New Shogaol Analogues as NRF2 Activators and Evaluation of Their Anti-Inflammatory Activity, Modes of Action and Metabolic Stability

 , , and
Abstract
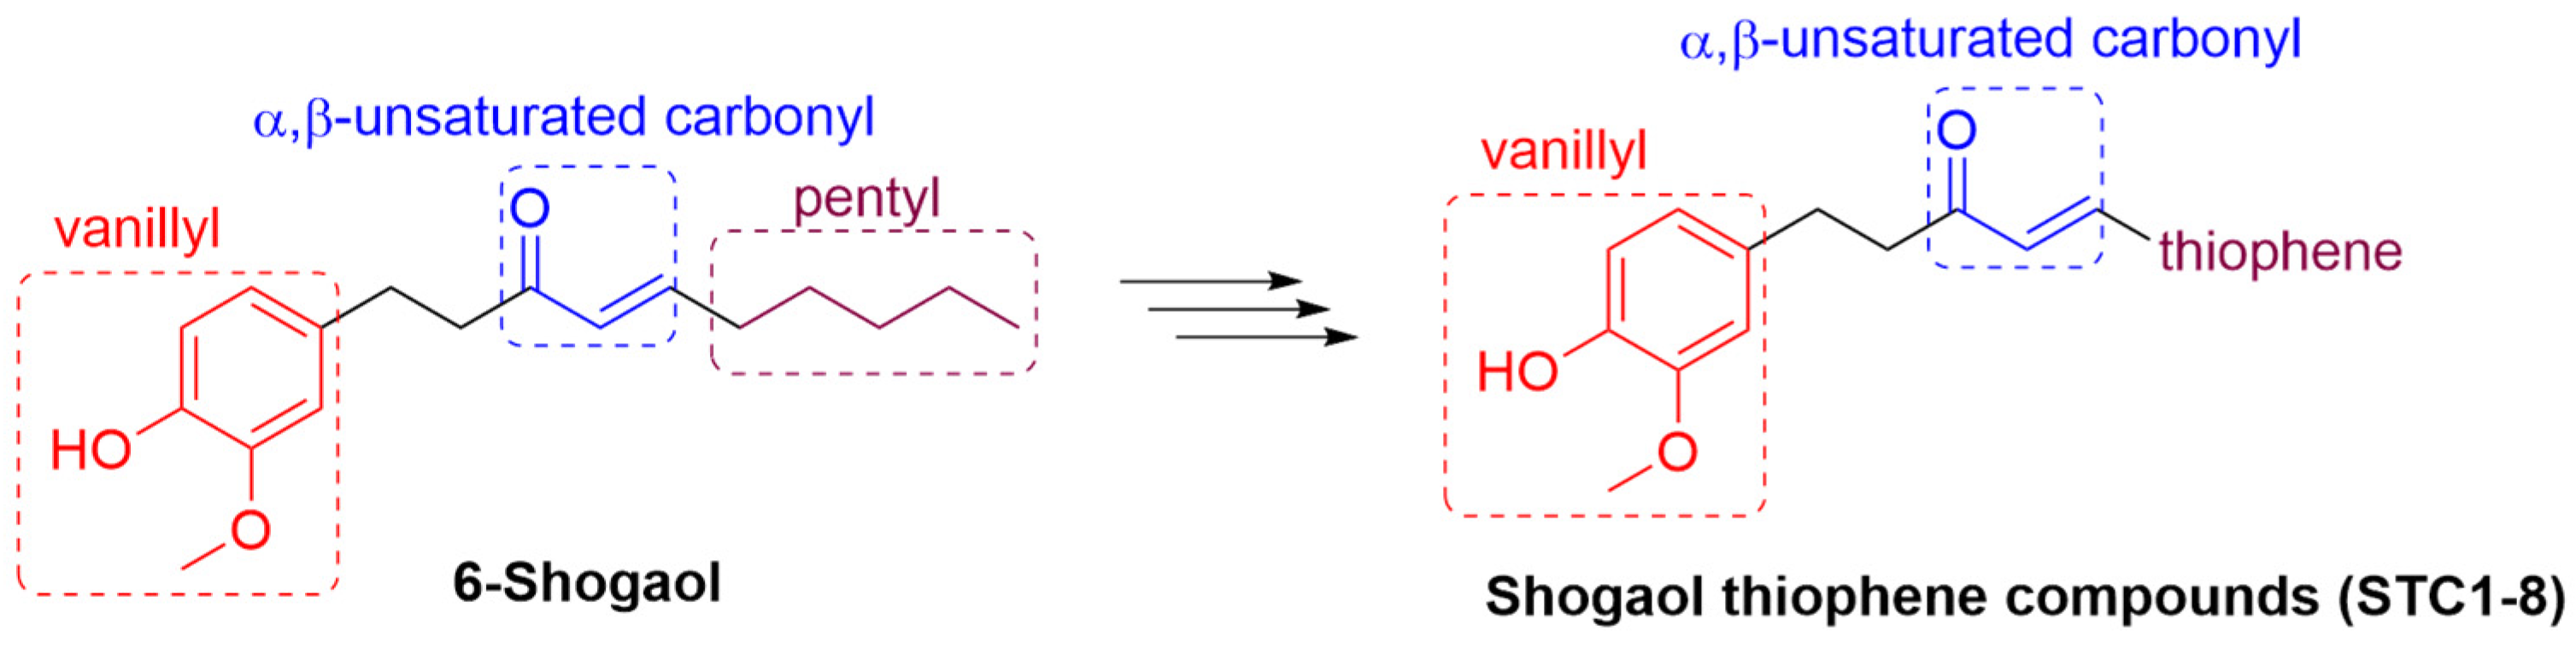
1. Introduction
2. Materials and Methods
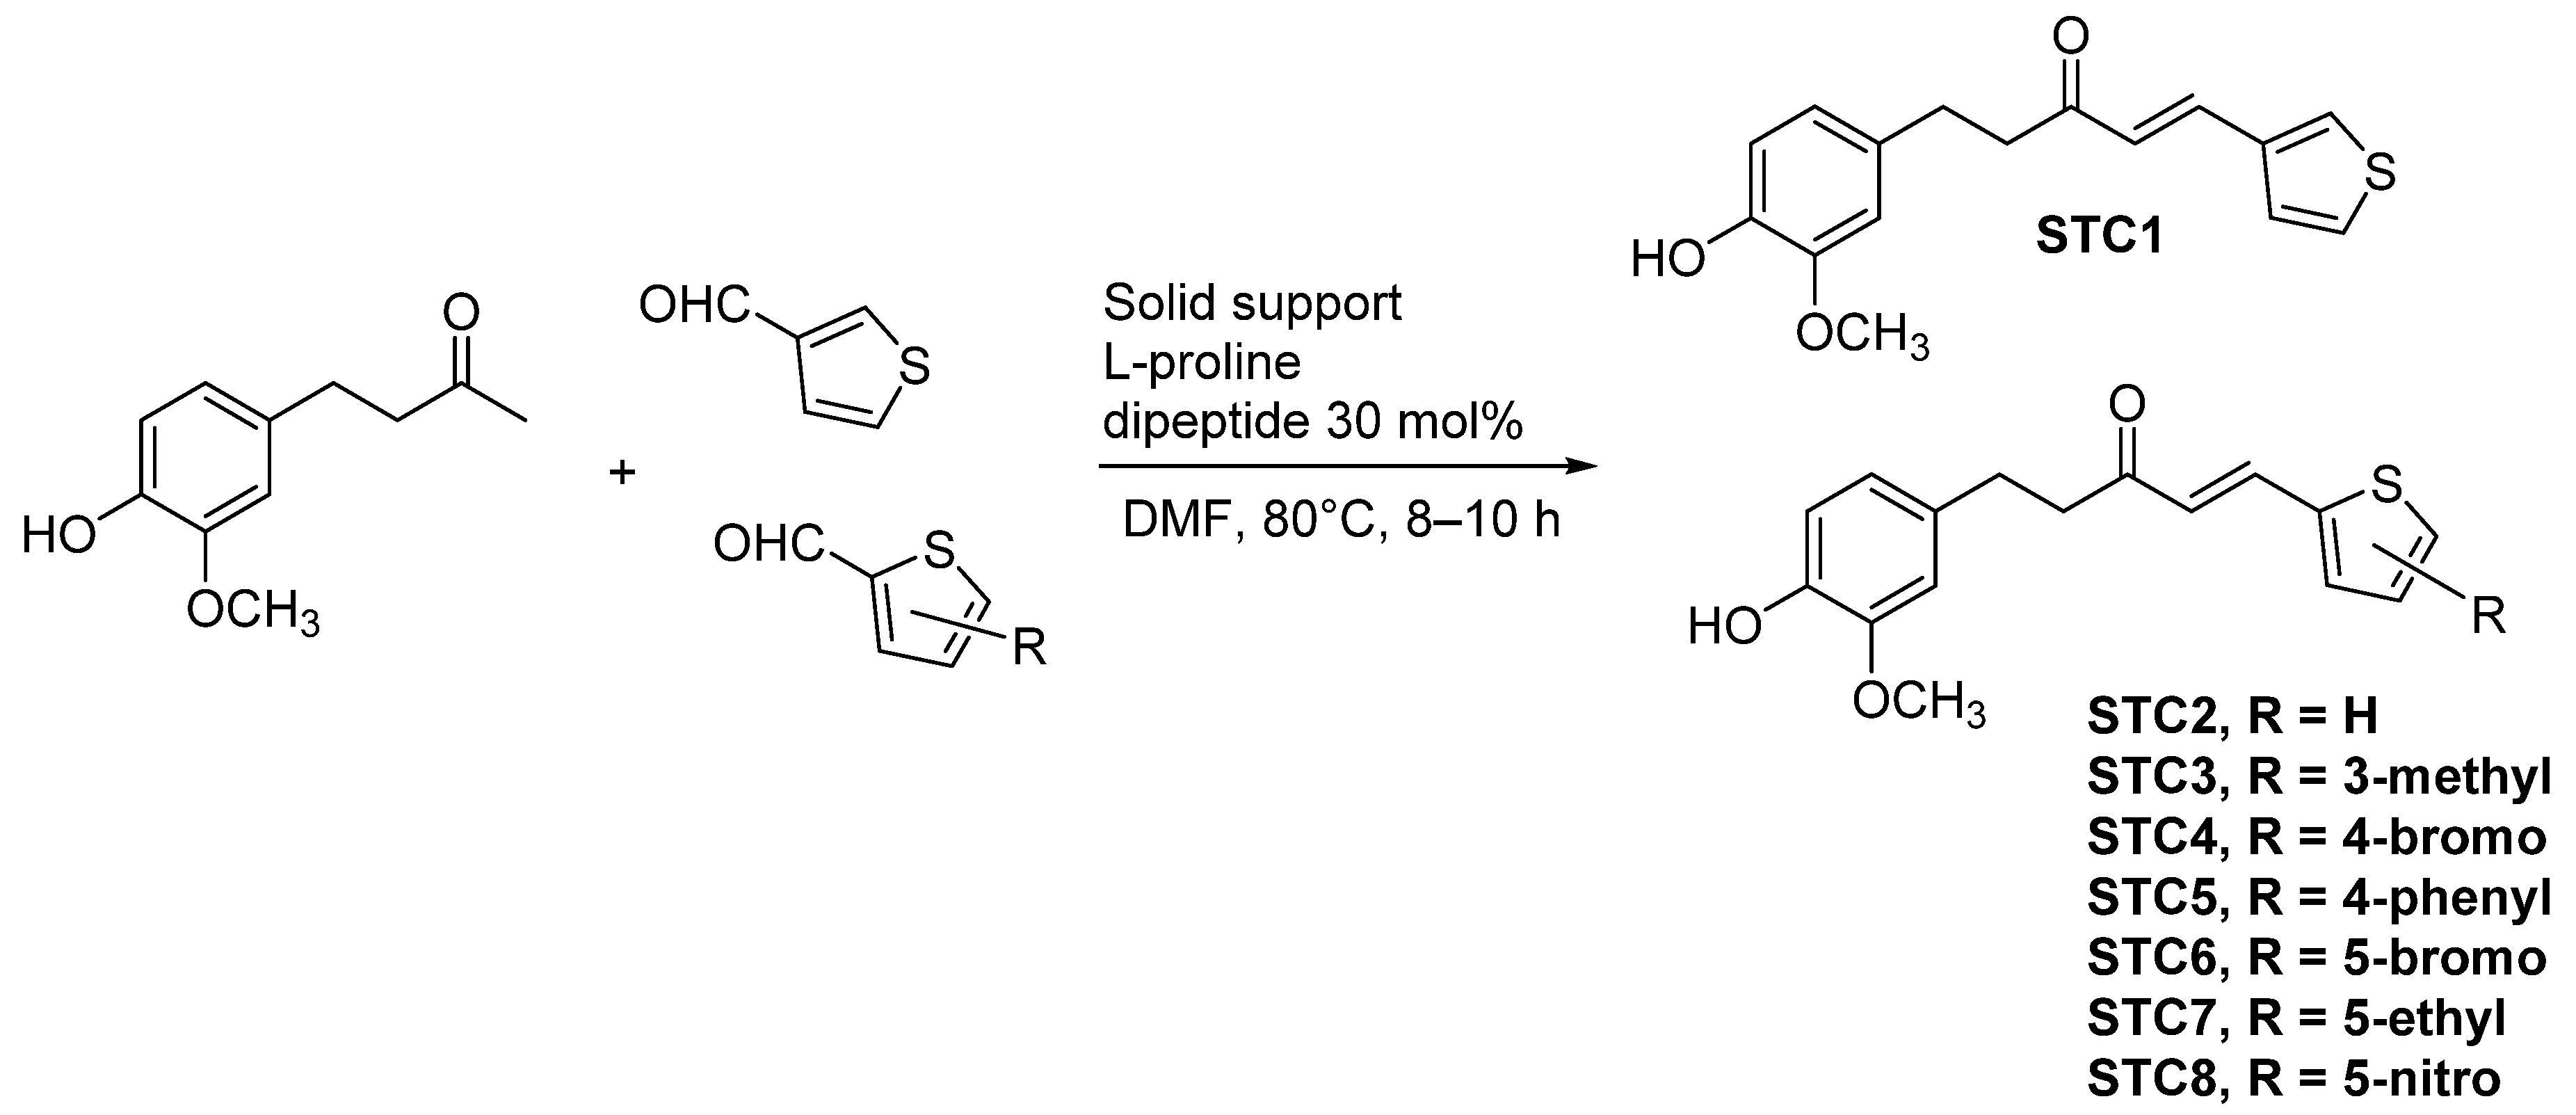
2.1. Synthesis of Shogaol Thiophene Compounds (STCs)
2.2. Preparation of Test Solutions for Shogaol Thiophene Compounds (STCs)
2.3. Cell Culture
2.4. Cytotoxicity of Shogaol Thiophene Compounds (STCs)
2.5. “Prochaska” Microtiter Plate Bioassay
2.6. Effect of Shogaol Thiophene Compounds on NRF2-Mediated Antioxidant Genes Expression
2.7. Effect of Shogaol Thiophene Compounds (STCs) on Inflammation and Thiol Content in BV-2 Cells
2.8. Effect of Shogaol Thiophene Compounds (STCs) on Glycogen Synthase Kinase 3β (GSK-3β) Enzyme Activity
2.9. Liver Microsomal Stability Studies
2.10. Fluorescence Polarisation Assay
2.11. In Silico Studies
2.12. Statistical Analysis
3. Results
3.1. Characterisation of STCs
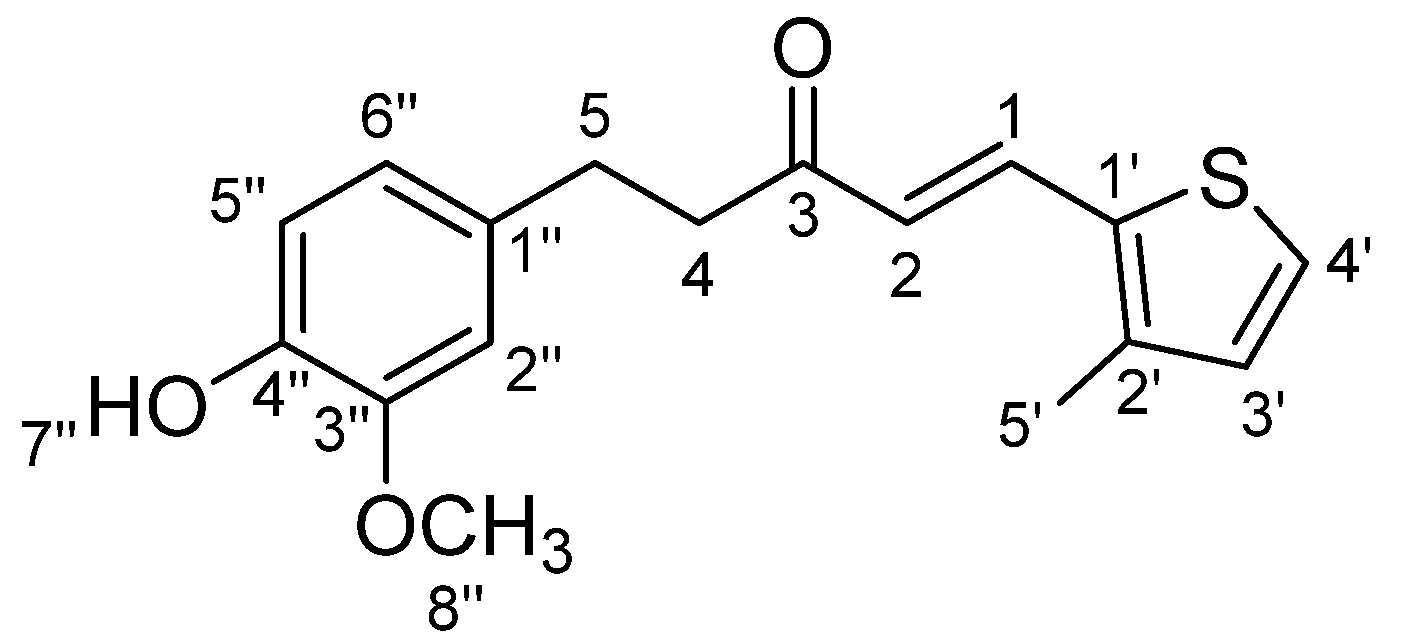
3.1.1. STC1: (E)-5-(4-Hydroxy-3-methoxyphenyl)-1(thiophen-3-yl)pent-1-en-3-one (Scheme 1)
3.1.2. STC2: (E)-5-(4-Hydroxy-3-methoxyphenyl)-1-(thiophen-2-yl)pent-1-en-3-one (Scheme 2)
3.1.3. STC3: (E)-5-(4-Hydroxy-3-methoxyphenyl)-1-(3-methylthiophen-2-yl)pent-1-en-3-one (Scheme 3)
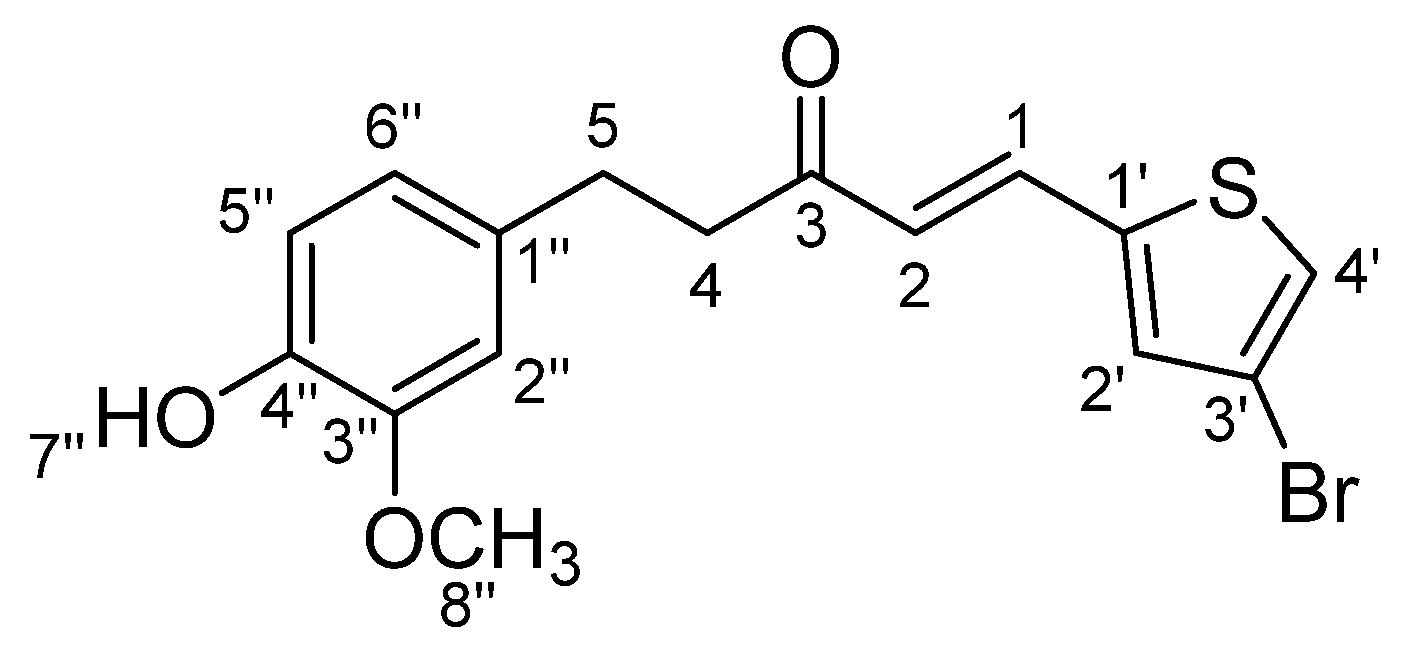
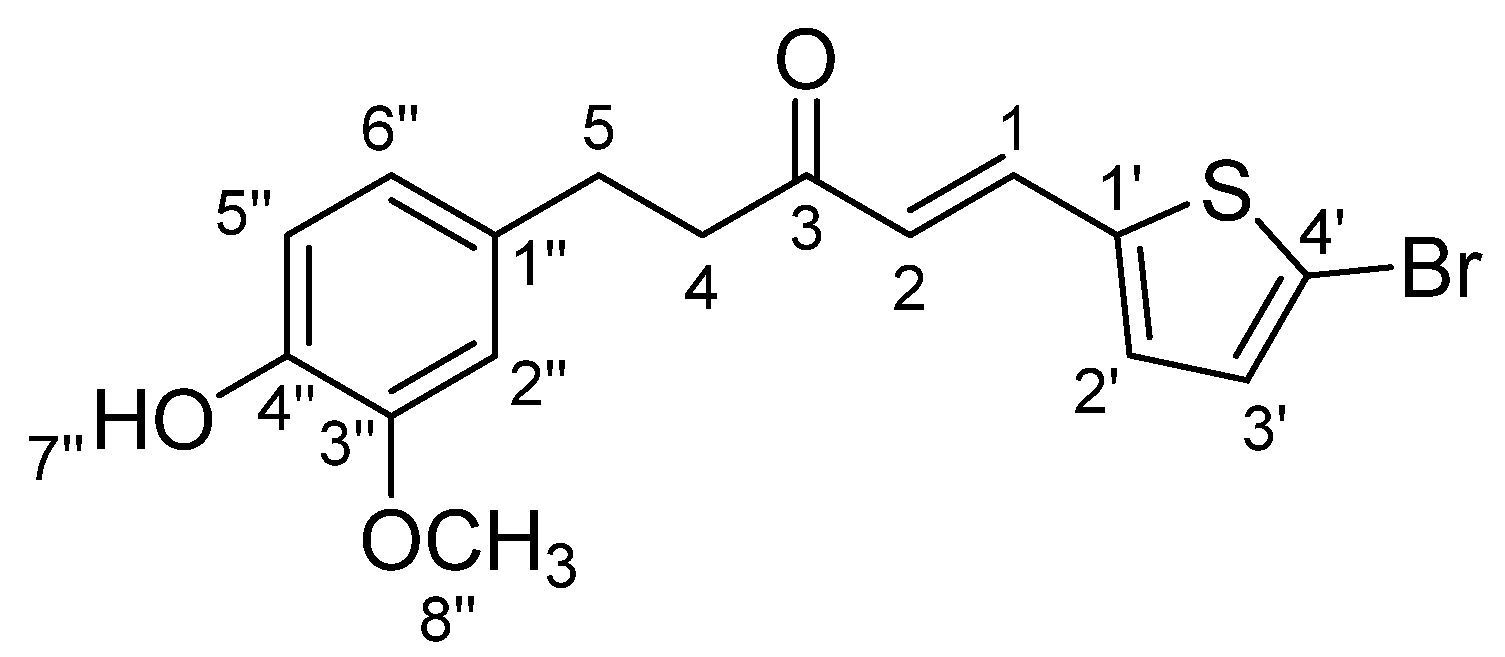
3.1.4. STC4: (E)-5-(4-Hydroxy-3-methoxyphenyl)-1-(4-bromothiophen-2-yl)pent-1-en-3-one (Scheme 4)
3.1.5. STC5: (E)-5-(4-Hydroxy-3-methoxyphenyl)-1-(4-phenylthiophen-2-yl)pent-1-en-3-one (Scheme 5)
3.1.6. STC6: (E)-5-(4-Hydroxy-3-methoxyphenyl)-1-(5-bromothiophen-2-yl)pent-1-en-3-one (Scheme 6)
3.1.7. STC7: (E)-5-(4-Hydroxy-3-methoxyphenyl)-1-(5-ethylthiophen-2-yl)pent-1-en-3-one (Scheme 7)
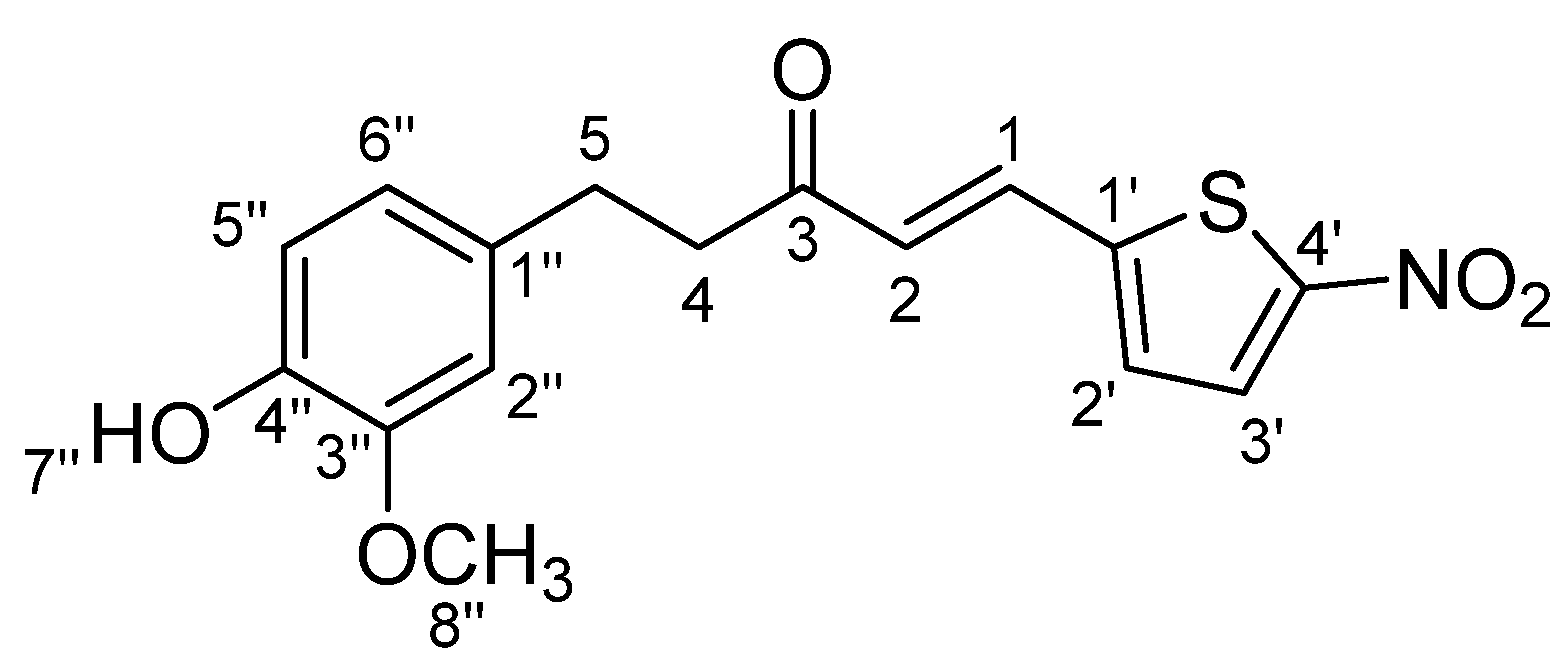
3.1.8. STC8:(E)-5-(4-Hydroxy-3-methoxyphenyl)-1-(5-nitrothiophen-2-yl)pent-1-en-3-one (Scheme 8)
3.2. Cytotoxicity of STCs
3.3. Effect of STCs on NQO1 Induction and Expression of NRF2-Associated Genes in Hepa-1c1c7 Cells
3.4. Effect of STCs on Anti-Inflammatory Markers and Mediators in BV-2 Cells
3.5. Mode of Action of STCs on NRF2 Activation
3.6. Microsomal Stability of STCs
3.7. Prediction of Binding Poses and Stability of STCs in the Binding Pockets of Kelch and BTB (Covalent Bonding with Cysteines) Domains of KEAP1 and GSK-3β
4. Discussion
5. Conclusions
Supplementary Materials
Author Contributions
Funding
Institutional Review Board Statement
Informed Consent Statement
Data Availability Statement
Conflicts of Interest
References
- Dugasani, S.; Pichika, M.R.; Nadarajah, V.D.; Balijepalli, M.K.; Tandra, S.; Korlakunta, J.N. Comparative antioxidant and anti-inflammatory effects of [6]-gingerol, [8]-gingerol, [10]-gingerol and [6]-shogaol. J. Ethnopharmacol. 2010, 127, 515–520. [Google Scholar] [CrossRef] [PubMed]
- Mai, C.-W.; Kang, Y.B.; Hamzah, A.S.; Pichika, M.R. Comparative efficacy of vanilloids in inhibiting toll-like receptor-4 (tlr-4)/myeloid differentiation factor (md-2) homodimerisation. Food Funct. 2018, 9, 3344–3350. [Google Scholar] [CrossRef] [PubMed]
- Mai, C.W.; Kang, Y.B.; Nadarajah, V.D.; Hamzah, A.S.; Pichika, M.R. Drug-like dietary vanilloids induce anticancer activity through proliferation inhibition and regulation of bcl-related apoptotic proteins. Phytother. Res. 2018, 32, 1108–1118. [Google Scholar] [CrossRef] [PubMed]
- Ooi, S.L.; Campbell, R.; Pak, S.C.; Golombick, T.; Manoharan, A.; Ramakrishna, R.; Badmaev, V.; Schloss, J. Is 6-Shogaol an Effective Phytochemical for Patients With Lower-Risk Myelodysplastic Syndrome? A Narrative Review. Integr. Cancer Ther. 2021, 20, 1–12. [Google Scholar] [CrossRef]
- Kou, X.; Wang, X.; Ji, R.; Liu, L.; Qiao, Y.; Lou, Z.; Ma, C.; Li, S.; Wang, H.; Ho, C.-T. Occurrence, biological activity and metabolism of 6-shogaol. Food Funct. 2018, 9, 1310–1327. [Google Scholar] [CrossRef]
- Zhang, S.; Kou, X.; Zhao, H.; Mak, K.K.; Balijepalli, M.K.; Pichika, M.R. Zingiber Officinale Var. Rubrum: Red Ginger’s Medicinal Uses. Molecules 2022, 27, 775. [Google Scholar] [CrossRef]
- Han, Q.; Yuan, Q.; Meng, X.; Huo, J.; Bao, Y.; Xie, G. 6-shogaol attenuates lps-induced inflammation in bv2 microglia cells by activating ppar-γ. Oncotarget 2017, 8, 42001–42006. [Google Scholar] [CrossRef]
- Kode, J.; Maharana, J.; Dar, A.A.; Mukherjee, S.; Gadewal, N.; Sigalapalli, D.K.; Kumar, S.; Panda, D.; Ghosh, S.; Keshry, S.S.; et al. 6-shogaol exhibits anti-viral and anti-inflammatory activity in covid-19-associated inflammation by regulating nlrp3 inflammasomes. ACS Omega 2022, 8, 2618–2628. [Google Scholar] [CrossRef]
- Ajeigbe, O.F.; Maruf, O.R.; Anyebe, D.A.; Opafunso, I.T.; Ajayi, B.O.; Farombi, E.O. 6- shogaol suppresses aom/dss-mediated colorectal adenoma through its antioxidant and anti-inflammatory effects in mice. J. Food Biochem. 2022, 46, e14422. [Google Scholar] [CrossRef]
- Patil, M.J.; Huang, Y.; Yu, M.; Dong, X.; Undem, B.J.; Yu, S. Ginger constituent 6-shogaol attenuates vincristine-induced activation of mouse gastroesophageal vagal afferent c-fibers. Molecules 2022, 27, 7465. [Google Scholar] [CrossRef]
- Gratal, P.; Mediero, A.; Lamuedra, A.; Matamoros-Recio, A.; Herencia, C.; Herrero-Beaumont, G.; Martín-Santamaría, S.; Largo, R. 6-shogaol (enexasogoal) treatment improves experimental knee osteoarthritis exerting a pleiotropic effect over immune innate signalling responses in chondrocytes. Br. J. Pharmacol. 2022, 179, 5089–5108. [Google Scholar] [CrossRef] [PubMed]
- Li, N.; Li, X.; Deng, L.; Yang, H.; Gong, Z.; Wang, Q.; Pan, D.; Zeng, S.; Chen, J. 6-shogaol inhibits the proliferation, apoptosis, and migration of rheumatoid arthritis fibroblast-like synoviocytes via the pi3k/akt/nf-κb pathway. Phytomedicine 2023, 109, 154562. [Google Scholar] [CrossRef]
- Jiao, W.; Sang, Y.; Wang, X.; Wang, S. Metabonomics and the gut microbiome analysis of the effect of 6-shogaol on improving obesity. Food Chem. 2023, 404, 134734. [Google Scholar] [CrossRef] [PubMed]
- Park, G.; Oh, D.S.; Lee, M.G.; Lee, C.E.; Kim, Y. ung 6-shogaol, an active compound of ginger, alleviates allergic dermatitis-like skin lesions via cytokine inhibition by activating the nrf2 pathway. Toxicol. Appl. Pharmacol. 2016, 310, 51–59. [Google Scholar] [CrossRef] [PubMed]
- Chen, F.; Tang, Y.; Sun, Y.; Veeraraghavan, V.P.; Mohan, S.K.; Cui, C. 6-shogaol, a active constiuents of ginger prevents uvb radiation mediated inflammation and oxidative stress through modulating nrf2 signaling in human epidermal keratinocytes (hacat cells). J. Photochem. Photobiol. B. 2019, 197, 111518. [Google Scholar] [CrossRef]
- Cuadrado, A.; Rojo, A.I.; Wells, G.; Hayes, J.D.; Cousin, S.P.; Rumsey, W.L.; Attucks, O.C.; Franklin, S.; Levonen, A.-L.; Kensler, T.W.; et al. Therapeutic targeting of the nrf2 and keap1 partnership in chronic diseases. Nat. Rev. Drug Discov. 2019, 18, 295–317. [Google Scholar] [CrossRef]
- Wang, L.; Zhang, X.; Xiong, X.; Zhu, H.; Chen, R.; Zhang, S.; Chen, G.; Jian, Z. Nrf2 regulates oxidative stress and its role in cerebral ischemic stroke. Antioxidants 2022, 11, 2377. [Google Scholar] [CrossRef]
- Tucci, P.; Lattanzi, R.; Severini, C.; Saso, L. Nrf2 pathway in huntington’s disease (hd): What is its role? Int. J. Mol. Sci. 2022, 23, 15272. [Google Scholar] [CrossRef]
- Dayalan Naidu, S.; Dinkova-Kostova, A.T. KEAP1, a Cysteine-Based Sensor and a Drug Target for the Prevention and Treatment of Chronic Disease. Open Biol. 2020, 10, 200105. [Google Scholar] [CrossRef]
- Dinkova-Kostova, A.T.; Abramov, A.Y. The emerging role of nrf2 in mitochondrial function. Free Radic. Biol. Med. 2015, 88, 179–188. [Google Scholar] [CrossRef]
- Dinkova-Kostova, A.T.; Fahey, J.W.; Kostov, R.V.; Kensler, T.W. KEAP1 and done? Targeting the nrf2 pathway with sulforaphane. Trends Food Sci. Technol. 2017, 69, 257–269. [Google Scholar] [CrossRef] [PubMed]
- Robledinos-Antón, N.; Fernández-Ginés, R.; Manda, G.; Cuadrado, A. Activators and Inhibitors of NRF2: A Review of Their Potential for Clinical Development. Oxid. Med. Cell. Longev. 2019, 2019, 9372182. [Google Scholar] [CrossRef] [PubMed]
- Zhou, Q.; Zhang, N.; Hu, T.; Xu, H.; Duan, X.; Liu, B.; Chen, F.; Wang, M. Dietary Phenolic-Type Nrf2-Activators: Implications in the Control of Toxin-Induced Hepatic Disorders. Food Funct. 2022, 13, 5480–5497. [Google Scholar] [CrossRef] [PubMed]
- Iranshahy, M.; Iranshahi, M.; Abtahi, S.R.; Karimi, G. The Role of Nuclear Factor Erythroid 2-Related Factor 2 in Hepatoprotective Activity of Natural Products: A Review. Food Chem. Toxicol. 2018, 120, 261–276. [Google Scholar] [CrossRef] [PubMed]
- Jadeja, R.N.; Upadhyay, K.K.; Devkar, R.V.; Khurana, S. Naturally Occurring Nrf2 Activators: Potential in Treatment of Liver Injury. Oxid. Med. Cell. Longev. 2016, 2016, 3453926. [Google Scholar] [CrossRef]
- Lu, M.C.; Ji, J.A.; Jiang, Z.Y.; You, Q.D. The keap1–nrf2–are pathway as a potential preventive and therapeutic target: An update. Med. Res. Rev. 2016, 36, 924–963. [Google Scholar] [CrossRef]
- Sun, H.; Zhu, J.; Lin, H.; Gu, K.; Feng, F. Recent progress in the development of small molecule nrf2 modulators: A patent review (2012–2016). Expert Opin. Ther. Pat. 2017, 27, 763–785. [Google Scholar] [CrossRef]
- Crisman, E.; Duarte, P.; Dauden, E.; Cuadrado, A.; Rodríguez-Franco, M.I.; López, M.G.; León, R. KEAP1-nrf2 protein–protein interaction inhibitors: Design, pharmacological properties and therapeutic potential. Med. Res. Rev. 2022, 43, 237–287. [Google Scholar] [CrossRef]
- Zhou, H.; Wang, Y.; You, Q.; Jiang, Z. Recent progress in the development of small molecule nrf2 activators: A patent review (2017-present). Expert Opin. Ther. Pat. 2020, 30, 209–225. [Google Scholar] [CrossRef]
- Clifford, T.; Acton, J.P.; Cocksedge, S.P.; Davies, K.A.B.; Bailey, S.J. The Effect of Dietary Phytochemicals on Nuclear Factor Erythroid 2-Related Factor 2 (Nrf2) Activation: A Systematic Review of Human Intervention Trials. Mol. Biol. Rep. 2021, 48, 1745–1761. [Google Scholar] [CrossRef]
- Zhu, Y.; Wang, P.; Zhao, Y.; Yang, C.; Clark, A.; Leung, T.C.; Chen, X.; Sang, S. Synthesis, evaluation, and metabolism of novel [6]-shogaol derivatives as potent nrf2 activators. Free Radic. Biol. Med. 2016, 95, 243–254. [Google Scholar] [CrossRef] [PubMed]
- Bezerra, D.P.; Soares, A.K.N.; De Sousa, D.P. Overview of the Role of Vanillin on Redox Status and Cancer Development. Oxid. Med. Cell. Longev. 2016, 2016, 9734816. [Google Scholar] [CrossRef]
- Egbujor, M.C.; Buttari, B.; Profumo, E.; Telkoparan-Akillilar, P.; Saso, L. An overview of nrf2-activating compounds bearing α,β-unsaturated moiety and their antioxidant effects. Int. J. Mol. Sci. 2022, 23, 8466. [Google Scholar]
- Jackson, P.A.; Widen, J.C.; Harki, D.A.; Brummond, K.M. Covalent modifiers: A chemical perspective on the reactivity of α,β-unsaturated carbonyls with thiols via hetero-michael addition reactions. J. Med. Chem. 2017, 60, 839–885. [Google Scholar] [CrossRef] [PubMed]
- Ahmed, S.H.H.; Gonda, T.; Hunyadi, A. Medicinal chemistry inspired by ginger: Exploring the chemical space around 6-gingerol. RSC Adv. 2021, 11, 26687. [Google Scholar] [CrossRef]
- Khanna, V.; Ranganathan, S. Physiochemical property space distribution among human metabolites, drugs and toxins. BMC Bioinformatics 2009, 10, S10. [Google Scholar] [CrossRef] [PubMed]
- Egbujor, M.C.; Petrosino, M.; Zuhra, K.; Saso, L. The role of organosulfur compounds as nrf2 activators and their antioxidant effects. Antioxidants 2022, 11, 1255. [Google Scholar] [CrossRef]
- Choi, J.W.; Shin, S.J.; Kim, H.J.; Park, J.H.; Kim, H.J.; Lee, E.H.; Pae, A.N.; Bahn, Y.S.; Park, K.D. Antioxidant, anti-inflammatory, and neuroprotective effects of novel vinyl sulfonate compounds as nrf2 activator. ACS Med. Chem. Lett. 2019, 10, 1061–1067. [Google Scholar] [CrossRef]
- Zhao, C.; Rakesh, K.P.; Ravidar, L.; Fang, W.Y.; Qin, H.L. Pharmaceutical and medicinal significance of sulfur (svi)-containing motifs for drug discovery: A critical review. Eur. J. Med. Chem. 2019, 162, 679–734. [Google Scholar] [CrossRef]
- Fahey, J.W.; Dinkova-Kostova, A.T.; Stephenson, K.K.; Talalay, P. The “prochaska” microtiter plate bioassay for inducers of nqo1. Methods Enzymol. 2004, 382, 243–258. [Google Scholar]
- Van Muiswinkel, F.L.; Kuiperij, H.B. The nrf2-are signalling pathway: Promising drug target to combat oxidative stress in neurodegenerative disorders. Curr. Drug Targets CNS Neurol. Disord. 2005, 4, 267–281. [Google Scholar] [CrossRef] [PubMed]
- Lim, H.-S.; Kim, Y.J.; Kim, B.-Y.; Park, G.; Jeong, S.-J. The anti-neuroinflammatory activity of tectorigenin pretreatment via downregulated nf-kappab and erk/jnk pathways in bv-2 microglial and microglia inactivation in mice with lipopolysaccharide. Front. Pharmacol. 2018, 9, 462. [Google Scholar] [CrossRef] [PubMed]
- Livak, K.J.; Schmittgen, T.D. Analysis of relative gene expression data using real-time quantitative pcr and the 2(-delta delta c(t)) method. Methods 2001, 25, 402–408. [Google Scholar] [CrossRef]
- Ponthan, F.; Yusoff, N.M.; Soria, N.M.; Heidenreich, O.; Coffey, K. Gene silencing by rnai in mammalian cells. Curr. Protoc. Mol. Biol. 2015, 111, 26.2.1–26.2.17. [Google Scholar] [CrossRef] [PubMed]
- Michalska, P.; Mayo, P.; Fernández-Mendívil, C.; Tenti, G.; Duarte, P.; Buendia, I.; Ramos, M.T.; López, M.G.; Menéndez, J.C.; León, R. Antioxidant, anti-inflammatory and neuroprotective profiles of novel 1,4-dihydropyridine derivatives for the treatment of alzheimer’s disease. Antioxidants 2020, 9, 650. [Google Scholar] [CrossRef] [PubMed]
- Mak, K.K.; Shiming, Z.; Epemolu, O.; Dinkova-Kostova, A.T.; Wells, G.; Gazaryan, I.G.; Sakirolla, R.; Mohd, Z.; Pichika, M.R. Synthesis and anti-inflammatory activity of 2-amino-4,5,6,7-tetrahydrobenzo[b]thiophene-derived nrf2 activators. ChemistryOpen 2022, 11, e202200181. [Google Scholar] [CrossRef]
- McGann, M. FRED and hybrid docking performance on standardized datasets. J. Comput. Aided. Mol. Des. 2012, 26, 897–906. [Google Scholar] [CrossRef]
- McGann, M. FRED pose prediction and virtual screening accuracy. J. Chem. Inf. Model. 2011, 51, 578–596. [Google Scholar] [CrossRef]
- Marcotte, D.; Zeng, W.; Hus, J.C.; McKenzie, A.; Hession, C.; Jin, P.; Bergeron, C.; Lugovskoy, A.; Enyedy, I.; Cuervo, H.; et al. Small molecules inhibit the interaction of nrf2 and the keap1 kelch domain through a non-covalent mechanism. Bioorganic Med. Chem. 2013, 21, 4011–4019. [Google Scholar] [CrossRef]
- Bertrand, J.A.; Thieffine, S.; Vulpetti, A.; Cristiani, C.; Valsasina, B.; Knapp, S.; Kalisz, H.M.; Flocco, M. Structural characterization of the gsk-3β active site using selective and non-selective atp-mimetic inhibitors. J. Mol. Biol. 2003, 333, 393–407. [Google Scholar] [CrossRef]
- Kelley, B.P.; Brown, S.P.; Warren, G.L.; Muchmore, S.W. POSIT: Flexible shape-guided docking for pose prediction. J. Chem. Inf. Model. 2015, 55, 1771–1780. [Google Scholar] [CrossRef]
- Hawkins, P.C.D.; Skillman, A.G.; Warren, G.L.; Ellingson, B.A.; Stahl, M.T. Conformer generation with omega: Algorithm and validation using high quality structures from the protein databank and cambridge structural database. J. Chem. Inf. Model. 2010, 50, 572–584. [Google Scholar] [CrossRef] [PubMed]
- Huerta, C.; Jiang, X.; Trevino, I.; Bender, C.F.; Ferguson, D.A.; Probst, B.; Swinger, K.K.; Stoll, V.S.; Thomas, P.J.; Dulubova, I.; et al. Characterization of novel small-molecule nrf2 activators: Structural and biochemical validation of stereospecific keap1 binding. Biochim. Biophys. Acta 2016, 1860, 2537–2552. [Google Scholar] [CrossRef]
- Zhu, K.; Borrelli, K.W.; Greenwood, J.R.; Day, T.; Abel, R.; Farid, R.S.; Harder, E. Docking covalent inhibitors: A parameter free approach to pose prediction and scoring. J. Chem. Inf. Model. 2014, 54, 1932–1940. [Google Scholar] [CrossRef]
- Friesner, R.A.; Murphy, R.B.; Repasky, M.P.; Frye, L.L.; Greenwood, J.R.; Halgren, T.A.; Sanschagrin, P.C.; Mainz, D.T. Extra precision glide: Docking and scoring incorporating a model of hydrophobic enclosure for protein−ligand complexes. J. Med. Chem. 2006, 49, 6177–6196. [Google Scholar] [CrossRef] [PubMed]
- Yao, H.; Liu, J.; Xu, S.; Zhu, Z.; Xu, J. The structural modification of natural products for novel drug discovery. Expert Opin. Drug Discov. 2016, 12, 121–140. [Google Scholar] [CrossRef] [PubMed]
- Chen, H.; Fu, J.; Chen, H.; Hu, Y.; Soroka, D.N.; Prigge, J.R.; Schmidt, E.E.; Yan, F.; Major, M.B.; Chen, X.; et al. Ginger compound [6]-shogaol and its cysteine-conjugated metabolite (m2) activate nrf2 in colon epithelial cells in vitro and in vivo. Chem. Res. Toxicol. 2014, 27, 1575–1585. [Google Scholar] [CrossRef] [PubMed]
- Kelder, J.; Grootenhuis, P.D.J.; Bayada, D.M.; Delbressine, L.P.C.; Ploemen, J.P. Polar molecular surface as a dominating determinant for oral absorption and brain penetration of drugs. Pharm. Res. 1999, 16, 1514–1519. [Google Scholar] [CrossRef]
- Salim, S. Oxidative stress and the central nervous system. J. Pharmacol. Exp. Ther. 2017, 360, 201. [Google Scholar] [CrossRef]
- Arnott, J.A.; Planey, S.L. The influence of lipophilicity in drug discovery and design. Expert Opin. Drug Discov. 2012, 7, 863–875. [Google Scholar] [CrossRef]
- Tonelli, C.; Chio, I.I.C.; Tuveson, D.A. Transcriptional regulation by nrf2. Antioxidants Redox Signal. 2018, 29, 1727–1745. [Google Scholar] [CrossRef] [PubMed]
- Li, Y.; Paonessa, J.D.; Zhang, Y. Mechanism of chemical activation of nrf2. PLoS ONE 2012, 7, e35122. [Google Scholar] [CrossRef]
- Dinkova-Kostova, A.T.; Kostov, R.V.; Kazantsev, A.G. The role of nrf2 signaling in counteracting neurodegenerative diseases. FEBS J. 2018, 285, 3576–3590. [Google Scholar] [CrossRef] [PubMed]
- Brandes, M.S.; Gray, N.E. NRF2 as a Therapeutic Target in Neurodegenerative Diseases. ASN Neuro 2020, 12, 1–23. [Google Scholar] [CrossRef]
- Tu, W.; Wang, H.; Li, S.; Liu, Q.; Sha, H. The Anti-Inflammatory and Anti-Oxidant Mechanisms of the Keap1/Nrf2/ARE Signaling Pathway in Chronic Diseases. Aging Dis. 2019, 10, 637–651. [Google Scholar] [CrossRef]
- Bryan, H.K.; Olayanju, A.; Goldring, C.E.; Park, B.K. The nrf2 cell defence pathway: Keap1-dependent and -independent mechanisms of regulation. Biochem. Pharmacol. 2013, 85, 705–717. [Google Scholar] [CrossRef] [PubMed]
- Baird, L.; Yamamoto, M. The molecular mechanisms regulating the keap1-nrf2 pathway. Mol. Cell. Biol. 2020, 40, e00099-20. [Google Scholar] [CrossRef]
- Yerer, M.B.; Tiryaki, M.K.; Demirpolat, E. GSK-3beta inhibitory effects of 6-gingerol and 6-shogaol help to the recovery of shsy-5y cells after amyloid beta1–42 oligomer or aggregate toxicity. J. Cell. Biotechnol. 2017, 2, 145–157. [Google Scholar] [CrossRef]
- Qin, S.; Hou, D.X. Multiple regulations of keap1/nrf2 system by dietary phytochemicals. Mol. Nutr. Food Res. 2016, 60, 1731–1755. [Google Scholar] [CrossRef]
- Masimirembwa, C.M.; Bredberg, U.; Andersson, T.B. Metabolic Stability for Drug Discovery and Development: Pharmacokinetic and Biochemical Challenges. Clin. Pharmacokinet. 2003, 42, 515–528. [Google Scholar] [CrossRef]
- Chen, H.; Soroka, D.; Zhu, Y.; Sang, S. Metabolism of ginger component [6]-shogaol in liver microsomes from mouse, rat, dog, monkey, and human. Mol. Nutr. Food Res. 2013, 57, 865–876. [Google Scholar] [CrossRef] [PubMed]
- Mukkavilli, R.; Yang, C.; Tanwar, R.S.; Ghareeb, A.; Luthra, L.; Aneja, R. Absorption, metabolic stability, & pharmacokinetics of ginger phytochemicals. Molecules 2017, 22, 553. [Google Scholar] [PubMed]


| Gene Symbol | Accession Number | Name | Forward Primer | Reverse Primer |
|---|---|---|---|---|
| β-Actin | NM_007393.5 | Reference gene | CGGTTCCGATGCCCTGAGGCTCTT | CGTCACACTTCATGATGGAATTGA |
| NRF2 | NM_010902.5 | Nuclear factor erythroid 2–related factor 2 | CAAGACTTGGGCCACTTAAAAGAC | AGTAAGGCTTTCCATCCTCATCAC |
| NQO1 | NM_008706.5 | NAD(P)H quinone dehydrogenase 1 | AGCTGGAAGCTGCAGACCTG | CCTTTCAGAATGGCTGGCA |
| HMOX1 | NM_010442.2 | Heme oxygenase 1 | GTGATGGAGCGTCCACAGC | TTGGTGGCCTCCTTCAAGG |
| GCLC | NM_010295.2 | Glutamate-cysteine ligase catalytic subunit | ATCTGCAAAGGCGGCAAC | ACTCCTCTGCAGCTGGCTC |
| GCLM | NM_008129.4 | Glutamate-cysteine ligase modifier subunit | TGGAGCAGCTGTATCAGTGG | AAATCTGGTGGCATCACACA |
| TXNRD1 | NM_015762.2 | Thioredoxin reductase 1 | AGAAAGTGCTGGTCTTGGATTTTG | ACACGTTCCTCCGAGACCC |
| PRDX1 | NM_011034.5 | Peroxiredoxin 1 | ACTCAACTGCCAAGTGATTG | TGGGTGTGTTAATCCATGCC |
| GPX2 | NM_030677.2 | Glutathione peroxidase 2 | TGTCAGAACGAGGAGATCCTG | GACTAAAGGTGGGCTGGTACC |
| GSTP1 | NM_013541.1 | Glutathione S-transferase pi 1 | GCAAATATGTCACCCTCATCTACACC | GCAGGGTCTCAAAAGGCTTCA |
| GSTM2 | NM_008183.4 | Glutathione S-transferase mu 2 | GTAGGATTACAAAGCCCAGACCTG | AAGAAATGGAGAGCCCAAGGAC |
| GSTA4 | NM_010357.3 | Glutathione S-transferase alpha 4 | GGGAACAGTATGAGAAGAAGATGCAAAA | CCCATCGATTTCAACCAAGG |
| G6PDX | NM_008062.3 | Glucose-6-phosphate dehydrogenase X-linked | GTCCAGAATCTCATGGTGCTGA | GCAATGTTGTCTCGATTCCAGA |
| Cmp | Human | Rat | Mouse | |||
|---|---|---|---|---|---|---|
| Clint (mL/min/g liver) | T1/2 (min) | Clint (mL/min/g liver) | T1/2 (min) | Clint (mL/min/g liver) | T1/2 (min) | |
| Ver | 11.82 ± 0.07 | 6.34 | 14.72 ±0.03 | 5.29 | 13.31 ± 0.08 | 5.74 |
| 6-S | 7.56 ± 1.24 | 9.63 | 11.51 ± 1.37 | 6.32 | 14.32 ± 1.51 | 5.08 |
| STC1 | 7.15 ± 1.24 * | 10.18 | 10.63 ± 1.25 * | 6.85 | 11.24 ± 1.43 * | 6.47 |
| STC2 | 6.85 ± 1.62 * | 10.62 | 9.46 ± 1.85 * | 7.69 | 10.64 ± 1.66 * | 6.84 |
| STC3 | 6.18 ± 1.34 * | 11.77 | 9.65 ± 1.54 * | 7.54 | 9.27 ± 2.14 * | 7.85 |
| STC4 | 6.35 ± 1.79 * | 11.46 | 8.79 ± 1.94 * | 8.28 | 9.67 ± 1.23 * | 7.52 |
| STC5 | 5.09 ± 0.98 * | 14.30 | 7.22 ± 1.23 * | 10.08 | 6.42 ± 1.52 * | 11.33 |
| STC6 | 5.32 ±1.08 * | 13.68 | 8.17 ± 1.74 * | 8.91 | 7.23 ± 1.34 * | 10.06 |
| STC7 | 6.27 ± 1.44 * | 11.61 | 8.52 ± 1.16 * | 8.54 | 7.85 ± 2.51 * | 9.27 |
| STC8 | 6.95 ± 1.52 * | 10.47 | 10.57 ± 1.48 * | 6.88 | 11.26 ± 2.69 * | 6.46 |
| PDB ID | Compound | FRED Score | XP Docking (kcal/mole) | Binding Free Energy (ΔG0) |
|---|---|---|---|---|
| 4IQK | 6−shogaol | −11.92 | −5.168 | −60.06 |
| STC1 | −11.92 | −6.334 | −62.71 | |
| STC2 | −11.77 | −6.237 | −61.69 | |
| STC3 | −12.06 | −5.661 | −54.44 | |
| STC4 | −12.61 | −5.677 | −48.83 | |
| STC5 | −14.47 | −6.819 | −62.19 | |
| STC6 | −11.96 | −5.536 | −56.25 | |
| STC7 | −12.50 | −6.332 | −66.91 | |
| STC8 | −12.18 | −6.111 | −46.73 | |
| 1Q41 | 6-shogaol | −10.43 | −7.725 | −42.94 |
| STC1 | −10.82 | −8.598 | −52.37 | |
| STC2 | −10.45 | −7.561 | −45.27 | |
| STC3 | −10.62 | −8.561 | −50.60 | |
| STC4 | −11.18 | −8.659 | −40.40 | |
| STC5 | −11.87 | −7.783 | −66.23 | |
| STC6 | −10.87 | −6.557 | −49.41 | |
| STC7 | −11.15 | −7.435 | −54.51 | |
| STC8 | −11.33 | −8.413 | −54.17 | |
| 5DAF | 6-shogaol | NA | −3.723 | NA |
| STC1 | NA | −5.498 | NA | |
| STC2 | NA | −5.335 | NA | |
| STC3 | NA | −5.221 | NA | |
| STC4 | NA | −5.804 | NA | |
| STC5 | NA | −5.245 | NA | |
| STC6 | NA | −5.541 | NA | |
| STC7 | NA | −4.736 | NA | |
| STC8 | NA | −5.644 | NA |
Disclaimer/Publisher’s Note: The statements, opinions and data contained in all publications are solely those of the individual author(s) and contributor(s) and not of MDPI and/or the editor(s). MDPI and/or the editor(s) disclaim responsibility for any injury to people or property resulting from any ideas, methods, instructions or products referred to in the content. |
© 2023 by the authors. Licensee MDPI, Basel, Switzerland. This article is an open access article distributed under the terms and conditions of the Creative Commons Attribution (CC BY) license (https://creativecommons.org/licenses/by/4.0/).
Share and Cite
Mak, K.-K.; Shiming, Z.; Sakirolla, R.; Balijepalli, M.K.; Dinkova-Kostova, A.T.; Epemolu, O.; Mohd, Z.; Pichika, M.R. Synthesis of New Shogaol Analogues as NRF2 Activators and Evaluation of Their Anti-Inflammatory Activity, Modes of Action and Metabolic Stability. Antioxidants 2023, 12, 475. https://doi.org/10.3390/antiox12020475
Mak K-K, Shiming Z, Sakirolla R, Balijepalli MK, Dinkova-Kostova AT, Epemolu O, Mohd Z, Pichika MR. Synthesis of New Shogaol Analogues as NRF2 Activators and Evaluation of Their Anti-Inflammatory Activity, Modes of Action and Metabolic Stability. Antioxidants. 2023; 12(2):475. https://doi.org/10.3390/antiox12020475
Chicago/Turabian StyleMak, Kit-Kay, Zhang Shiming, Raghavendra Sakirolla, Madhu Katyayani Balijepalli, Albena T. Dinkova-Kostova, Ola Epemolu, Zulkefeli Mohd, and Mallikarjuna Rao Pichika. 2023. "Synthesis of New Shogaol Analogues as NRF2 Activators and Evaluation of Their Anti-Inflammatory Activity, Modes of Action and Metabolic Stability" Antioxidants 12, no. 2: 475. https://doi.org/10.3390/antiox12020475
APA StyleMak, K.-K., Shiming, Z., Sakirolla, R., Balijepalli, M. K., Dinkova-Kostova, A. T., Epemolu, O., Mohd, Z., & Pichika, M. R. (2023). Synthesis of New Shogaol Analogues as NRF2 Activators and Evaluation of Their Anti-Inflammatory Activity, Modes of Action and Metabolic Stability. Antioxidants, 12(2), 475. https://doi.org/10.3390/antiox12020475