Abstract
Sorbus aucuparia L. (rowan tree) is a widely distributed European plant, valued for its nutritional and medicinal qualities. The medicinal application of rowanberries, relying particularly on their antioxidant and antidiabetic effects, is closely connected with the presence of numerous phenolic compounds. However, the broad geographical occurrence of rowan trees may contribute to fluctuations in fruit composition, influencing their biological properties. This study aimed to identify the constituents most involved in this variability to facilitate effective quality control. The investigation encompassed 20 samples collected from diverse locations across Poland, evaluated in terms of the variation in composition and bioactivity. The UHPLC-PDA-ESI-MSn study identified 45 different constituents, including flavonoids, phenolic acid and flavon-3-ols. The detected compounds were quantitatively assessed by HPLC-PDA, alongside spectrophotometric evaluation of total phenolic content and the content of high-molecular-weight proanthocyanidins (TPA). Additionally, •OH scavenging capacity and α-glucosidase inhibition were included as bioactivity parameters. Chemometric analyses, including hierarchical cluster analysis and principal component analysis, revealed geographically dependent variability, with low to moderate variation observed for most factors (variation coefficients 20.44–44.97%), except for flavonoids (variation coefficients 45–76%). They also enabled the selection of seven constituents and TPA as the key markers of variability and biological activity of rowanberries. These markers could be employed for quality control of the fruits, offering a more efficient and cost-effective approach compared to full phytochemical analysis.
1. Introduction
Sorbus aucuparia L. (mountain-ash, rowan tree) is a deciduous plant that is widely distributed throughout most of Europe, ranging from Iceland, Scandinavia, and Russia to Spain, Italy, and the Balkans. It may also be found in northern and southwestern Asia. Additionally, it has been introduced to Canada and the United States as an ornamental tree [1]. It thrives in such diverse geographical regions due to its high tolerance to a short vegetative season and various environmental stressors such as high summer temperatures, drought, cold and frost. The species, appreciated for its decorative, nutritional and medicinal properties, has become popular in both cultivation and in its natural settings [2,3].
S. aucuparia L. provides edible fruits used for preparation of juices, jams, jellies, alcoholic beverages, confectionary, etc. [4]. They are also utilized as a traditional herbal remedy for the prevention and treatment of several conditions, such as diabetes, atherosclerosis, or hypertension [2]. Based on existing research, their biological mechanisms primarily include antioxidant, antiradical, and enzyme-inhibitory activity [5,6,7,8,9,10,11], which are attributed to the presence of a rich fraction of various polyphenolic compounds, i.e., proanthocyanidins, flavonols, and pseudodepsides of caffeic and ferulic acids [5,6,7]. However, the data gathered thus far on the qualitative and quantitative composition of the rowan fruits reported by different authors have been contradictory [5,10,12,13,14,15,16,17]. Therefore, the matter of compositional variability has been brought to light.
As previously reported, the variability in the profile of the rowanberry constituents might result from genetic factors, i.e., the typical of Sorbus spp. tendency for apomixes [18]. On the other hand, considering the well-established role of secondary metabolites in plant adaptive mechanisms and defense against biotic and abiotic stressors, the composition of many plant species is highly influenced by their geographical location [19,20,21]. This is especially true for species inhabiting regions with significantly different environmental conditions, and it may also apply to rowanberries and plant materials obtained thereof.
Such susceptibility to changes under the influence of environmental conditions pose significant challenges in the quality control analyses, which are crucial step to ensure the safety and effectiveness of plant materials [20,22]. One of the initial steps in establishing criteria for quality control of new plant materials is the identification of suitable analytical markers. While the markers of quality and biological activity often comprise the main active constituents, we must also consider the importance of minor metabolites. These minor metabolites, due to their unique properties and potential synergistic relationships, may prove to be key chemical markers [22]. On the other hands, it is essential to keep the number of controlled parameters as limited as possible to ensure the simplicity of routine quality control analyses.
Given the above mentioned premises, this study aimed to address several important questions: (I) To what extent can the qualitative and quantitative variability be anticipated in rowanberries? (II) How do these variations influence the biological properties of the fruits? (III) What quality control measures should be implemented for fruit products to ensure their value and potential functional applications? To achieve this goal, we conducted the first-ever assessment of the qualitative and quantitative variability in the phenolic profile of rowanberries collected from various regions of Poland, spanning from seaside to piedmont areas. This evaluation was performed using a range of profiling techniques, including UHPLC-PDA-ESI-MSn, HPLC-PDA, and UV–vis spectrophotometry. Additionally, guided by prior research [5,6], we examined the pharmacological diversity among the samples by assessing two model activities that reflect the antiradical and antidiabetic potential of rowanberries. These activities encompassed hydroxyl radical scavenging and α-glucosidase inhibition. Subsequently, we conducted an intra-species analysis of the fruits using various chemometric tools, including hierarchical cluster analysis (HCA) and principal component analysis (PCA). This approach made it possible to determine the impact of individual phenolics variability on biological potential of rowanberries, and enabled to identify the parameters that are optimal for the effective quality control of S. aucuparia fruits.
2. Materials and Methods
2.1. Plant Materials
Mature fruits of Sorbus aucuparia L. were harvested in September 2019, specifically within a two-week period from 6 September 2019 to 19 September 2019. The fruits were collected from 20 different locations in Poland (Table 1), from a few to over a dozen trees depending on the size of the population in a given location, and were sourced from plants growing in their natural habitat or within botanical gardens. Authentication was carried out by prof. M.A. Olszewska from the Department of Pharmacognosy, Medical University of Lodz, Poland. To adhere to the traditional preparation method, the plant material was subjected to freezing for 24 h and lyophilized prior to the analyses [23].

Table 1.
The locations of the fruit samples collection and geographical conditions during growing season (IV–XI 2019).
2.2. Extracts Preparation
The lyophilized fruit samples (5 g) were defatted by pre-extraction with chloroform (100 mL, 45 min). Subsequently, extracts were prepared via reflux extraction (80 °C) of the plant material (defatted pellet) using a methanol–water mixture (1:1, v/v, 1 × 100 mL × 30 min and 2 × 50 mL × 20 min). The extracts were dried through vacuum evaporation (Büchi rotary evaporator with chiller set at −10 °C), lyophilized, weighed, and stored in the refrigerator. Prior to analyses, the extract samples were dissolved to achieve the appropriate concentration. All quantitative results were calculated based on the dry weight (dw) of the fruits.
2.3. Qualitative Profiling
The qualitative UHPLC-PDA-ESI-MSn analysis was conducted following the previously described method [5], employing the same equipment, procedure, and reagents. The samples were prepared to achieve the final concentration of the extract solution at 50 μg/mL.
2.4. Quantitative Profiling
The extracts were subjected to quantitative analysis, that included the assessment of their total phenolic contents (TPH) and the contents of phenolic fractions and individual compounds using a validated HPLC-PDA method and the same equipment as previously described [25]. The samples were prepared to achieve the final concentration of the extract solution at 50 μg/mL. The analytes were quantified depending on their PDA spectra as equivalents of HPLC-pure external standards (Sigma-Aldrich, St. Louis, MO, USA; Phytolab, Vestenbergsgreuth, Germany): isoquercitrin (IQ) and hyperoside (HY) for flavonoid monoglycosides; quercetin 3-O-β-sophoroside (SQ) and rutin (RT) for flavonoid diglycosides; chlorogenic acid (CHA) for monocaffeoylquinic acid isomers; cynarin for dicaffeoylquinic acid isomers; caffeic acid (CFA) for hydroxycinnamic acid derivatives other than mono- and dicaffeoylquinic acid isomers; and procyanidin B2 (PB2) for proanthocyanidins.
Additionally, the total phenolic contents (TPC) and the total proanthocyanidins contents (TPA) were quantified using the Folin–Ciocalteu and n-butanol-HCl methods, respectively, following previously established protocols [25]. TPC measurement involved the removal of reducing sugars by C18 SPE, as described by Rutkowska et al. [5]. Results of the TPC and TPA assays were expressed in gallic acid equivalents (mg GAE/g of fruits dw) and cyanidin chloride equivalents (mg CyE/g of fruits dw), respectively.
2.5. Radical Scavenging Activity
The scavenging activity of S. aucuparia fruits against hydroxyl radical (•OH) was evaluated using the spectrophotometric method developed by Fu et al. [26] with some modifications [27]. The levels of •OH (generated through the Fenton reaction with 1.5 mM FeSO4 and 6 mM H2O2) before and after the interaction with the tested analytes were monitored in the presence of salicylic acid (20 mM). After 30 min incubation at 37 °C, the absorbance was measured at 520 nm. The results were presented as SC50 values, derived from concentration–scavenging curves (5 calibration points). For direct comparison, the results were expressed in terms of ascorbic acid (AA) equivalents per extract dw (µmol AA/mg dw) or AA equivalents per polyphenols weight (µmol AA/mg GAE).
2.6. α-Glucosidase Inhibitory Activity
The impact of S. aucuparia fruits on yeast α-glucosidase activity was evaluated using the spectrophotometric method described by Kim et al. [28] with some modifications. The tested samples underwent preincubation with α-glucosidase (0.43 U/mL) at 37 °C for 15 min. Subsequently, p-nitrophenyl glucopyranoside (0.2 mg/mL) was introduced as the reaction substrate, and the mixture was incubated for 30 min. The reaction was halted by the addition of Na2CO3 (0.2 M). The activity was quantified by measuring the released of yellow-colored p-nitrophenol at 405 nm. The results were presented as IC50 values, derived from concentration-inhibition curves (5 calibration points). For direct comparison, the results were expressed in acarbose (AR) equivalents per extract dw (µmol AR/mg dw) or in AR equivalents per polyphenols weight (µmol AR/mg GAE).
2.7. Statistical Analyses
The results were presented as the means ± standard deviation (SD) based on the specified number of experiments. Statistical significance regarding differences between mean values was determined using a one-way ANOVA, followed by the post hoc Tukey’s or Fisher’s LSD tests for multiple comparisons. To assess the relationship between variables, Pearson correlation coefficients were calculated. All quantification results were used for the hierarchical cluster analysis (HCA), and selected parameters for principal component analysis (PCA). The calculations were performed using Satistica PL version 13.3 software for Windows (StatSoft Inc., Krakow, Poland) or JMP Trial version 17 software for Windows (SAS Institute, Cary, NC, USA) with p-values less than 0.05 regarded as significant.
3. Results and Discussion
3.1. Qualitative Variability of the Phenolic Composition
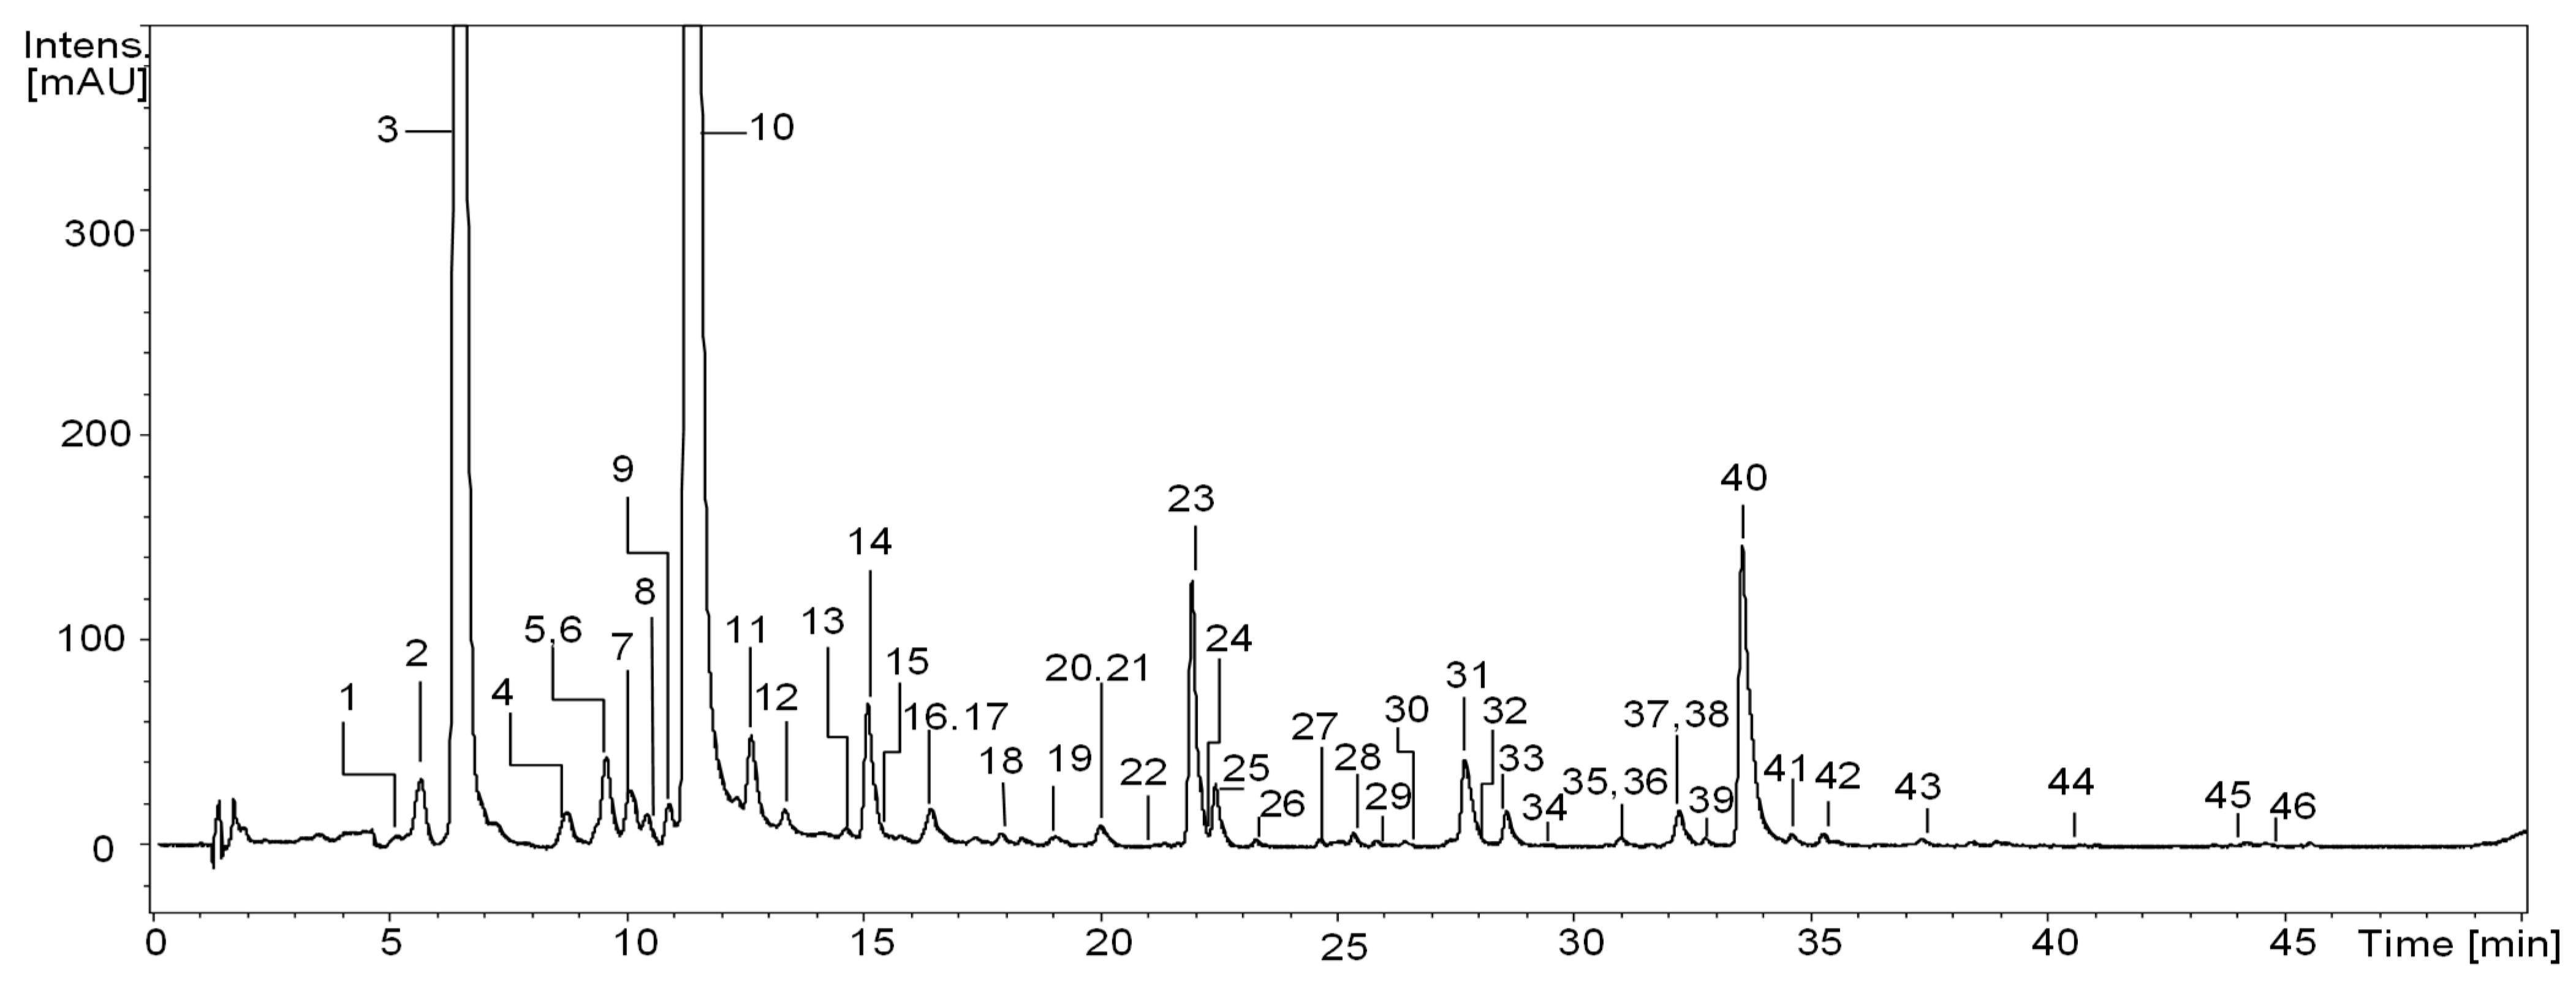
The qualitative RP-LC-MS analysis of S. aucuparia fruits, sourced from various geographical regions of Poland (a total of twenty samples, as described in the Material and Methods section), resulted in the detection of forty-six constituents (UHPLC peaks 1–46; Figure 1, Table 2). Thirty-three of these constituents were found consistently across all samples. Identification of the analytes was achieved by comparing their UV–vis spectra, chromatographic behavior, and ESI-MSn fragmentation patterns with reference compounds or information available in literature [10,12,13,14,15,16,29,30,31,32]. The identified compounds were categorized into several polyphenolic groups, including the most diverse hydroxycinnamic acid derivatives (with sixteen constituents), flavonols (with fourteen constituents), and proanthocyanidins (with ten constituents), as well as less numerous hydroxybenzoic acid derivatives (with two constituents) or flavonolignans (with three constituents).
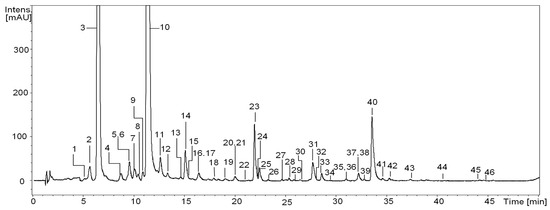
Figure 1.
Representative UHPLC chromatogram (sample No. 17) at 325 nm of S. aucuparia fruits. Peak numbers refer to those implemented in Table 2.
Table 2.
UHPLC-PDA-ESI-MSn identification data of polyphenols detected in the S. aucuparia fruits.
The most significant variability was observed within the group of flavonoids, particularly in derivatives of quercetin and kaempferol. Out of the fourteen detected flavonols, only five, namely quercetin 3-O-β-sophoroside (SQ, compound 23), quercetin O-dihexoside (compound 25), hyperoside (HY, compound 31), rutin (RT, compound 32), and isoquercitrin (IQ, compound 33), were consistently present in all samples. Additionally, qualitative differences were noted in the groups of proanthocyanidins (compound 12 was found in only six samples, while compound 19 was present in sixteen samples) and flavonolignans (with compounds 30 and 39 being detected in eighteen and eleven samples, respectively). In contrast, phenolic acids appeared to exhibit qualitative stability, as representatives of this group were identified in all samples (Table 2).
The observed data confirm the existence of qualitative variability within the species, which may account for the conflicting data regarding S. aucuparia fruit composition reported by different authors [10,12,13,14,15,16,17]. For instance, Kylli et al. [10] identified RT, HY, IQ, quercetin dihexoside, hexoside-pentoside, and malonylglucoside in the 70% acetone-water extract from the fruits. In contrast, Gil-Izquierdo and Mellenthin [15] reported the presence of two additional kaempferol dihexosides and second quercetin dihexoside in the fruit juice, while quercetin malonylglucoside was not detected.
3.2. Quantitative Variability of the Phenolic Composition
The next step in the analyses was to evaluate the range of quantitative variability in the investigated samples.
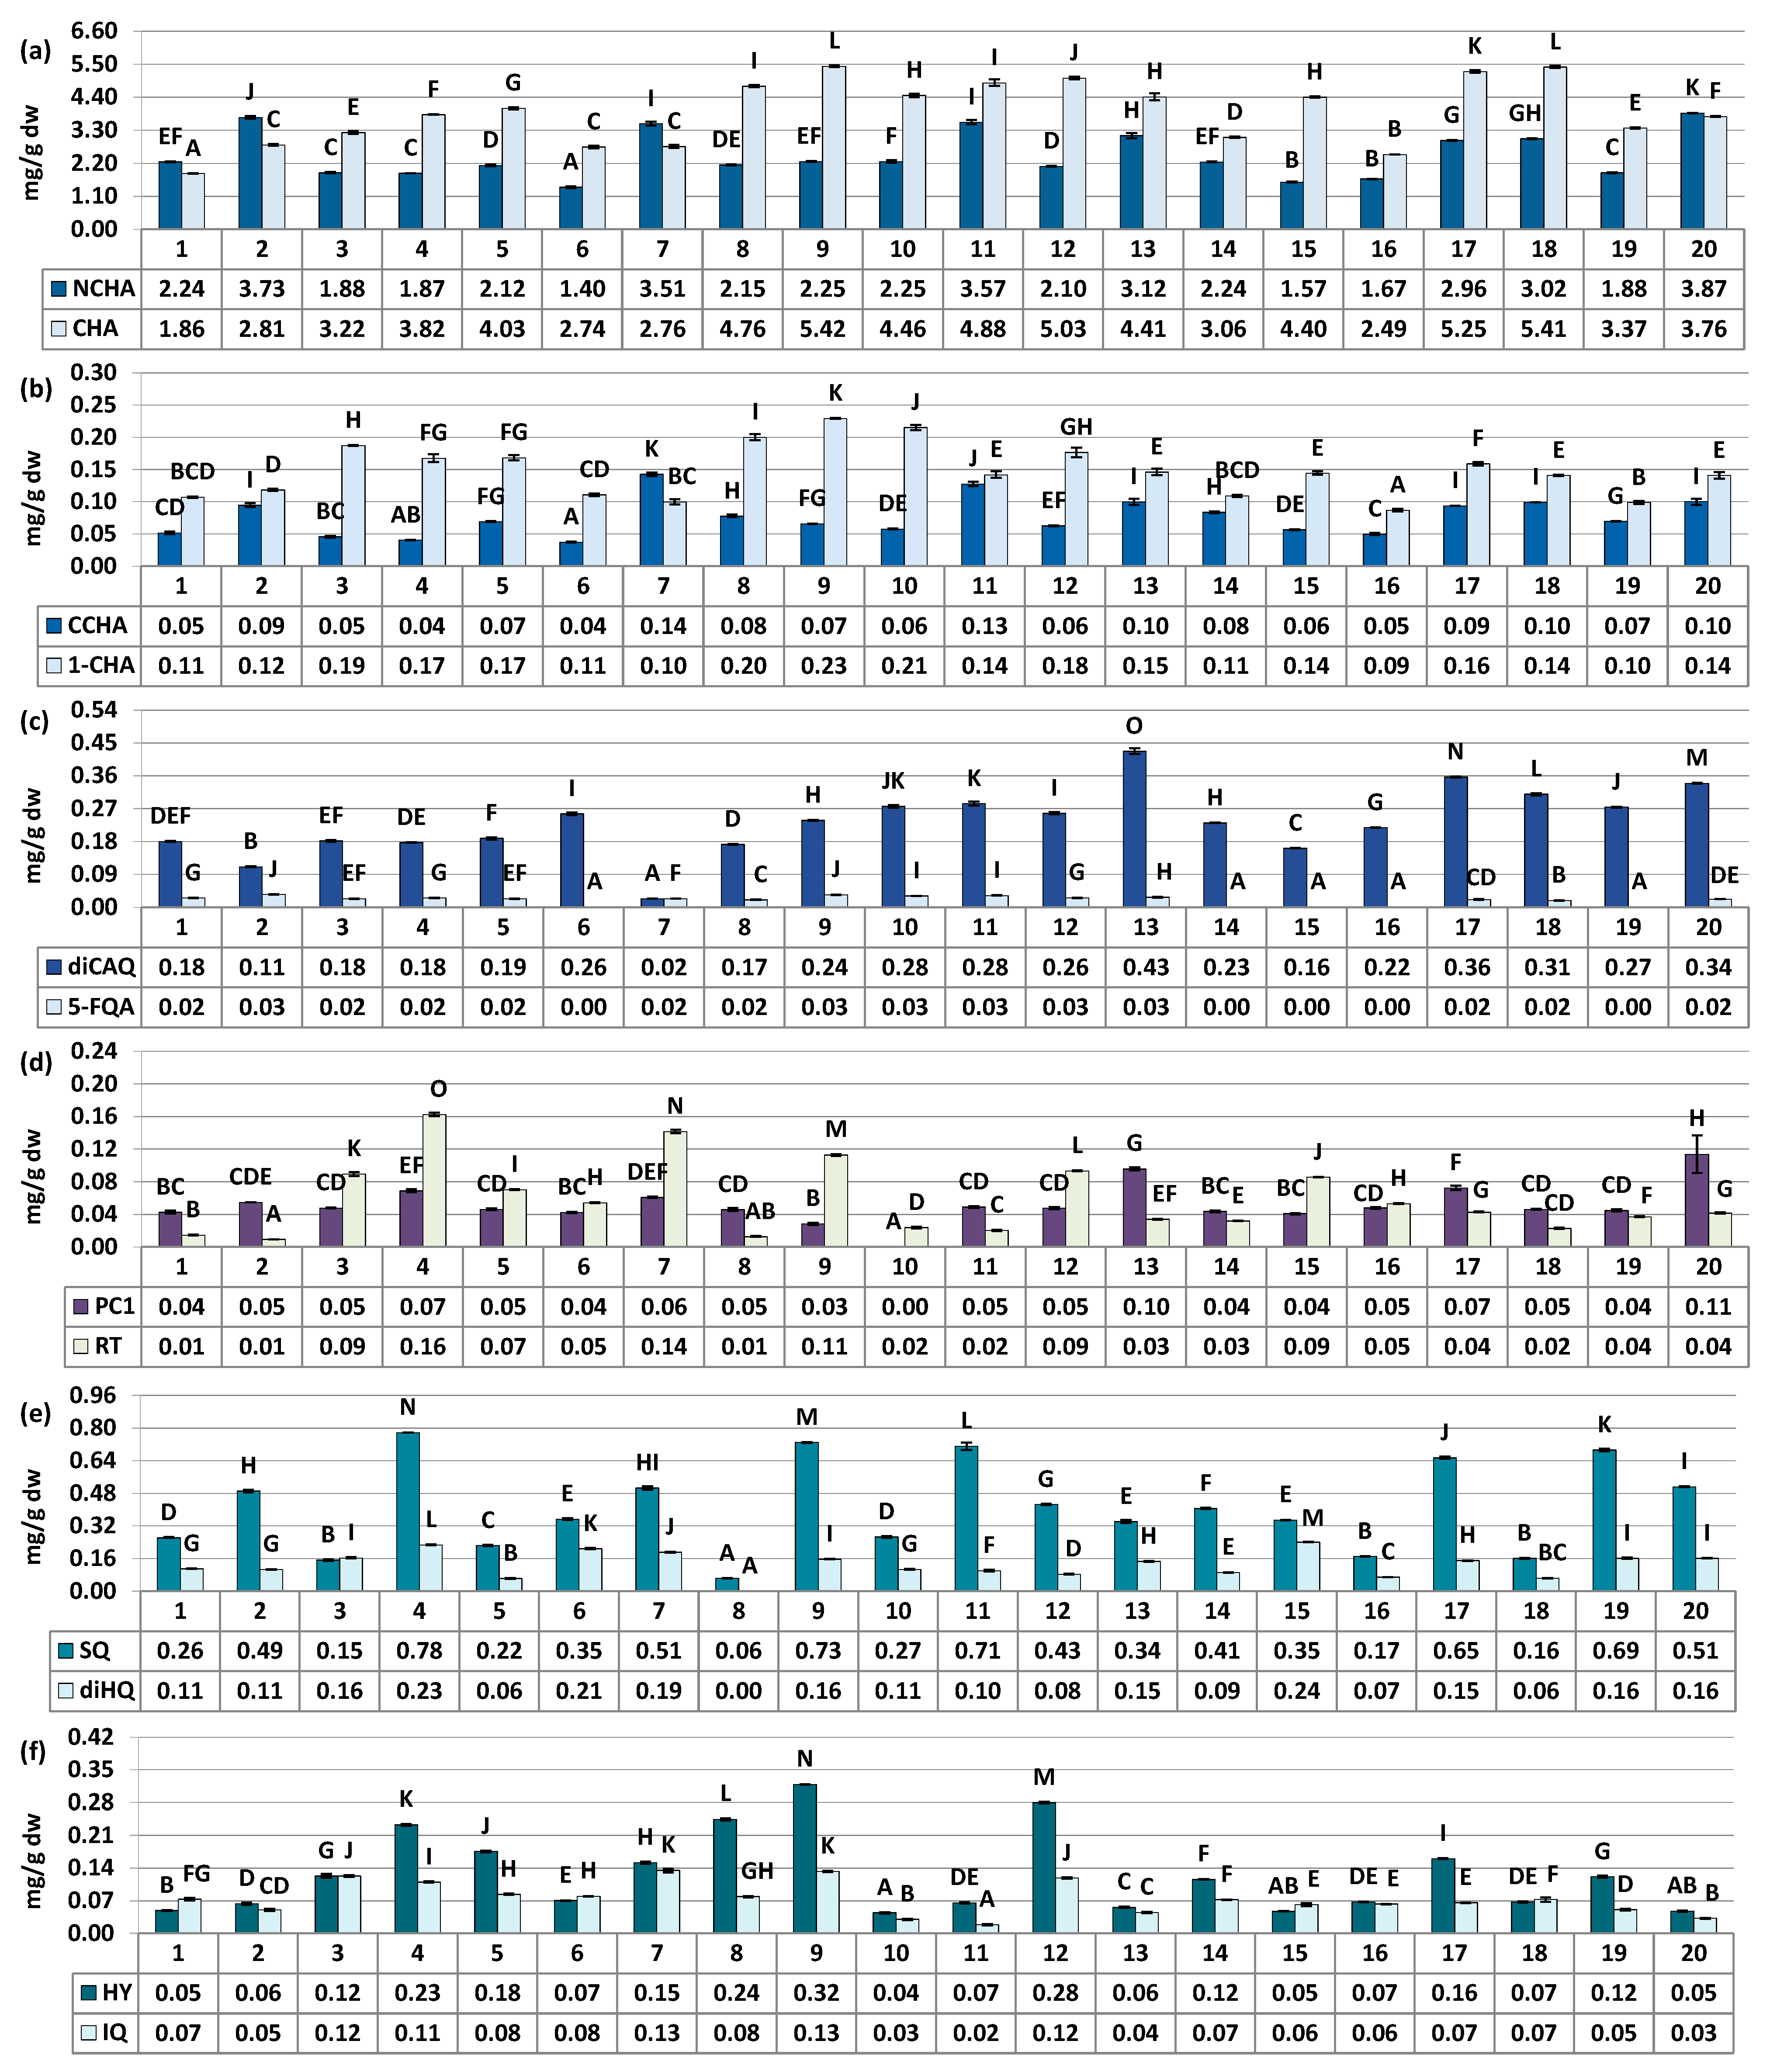
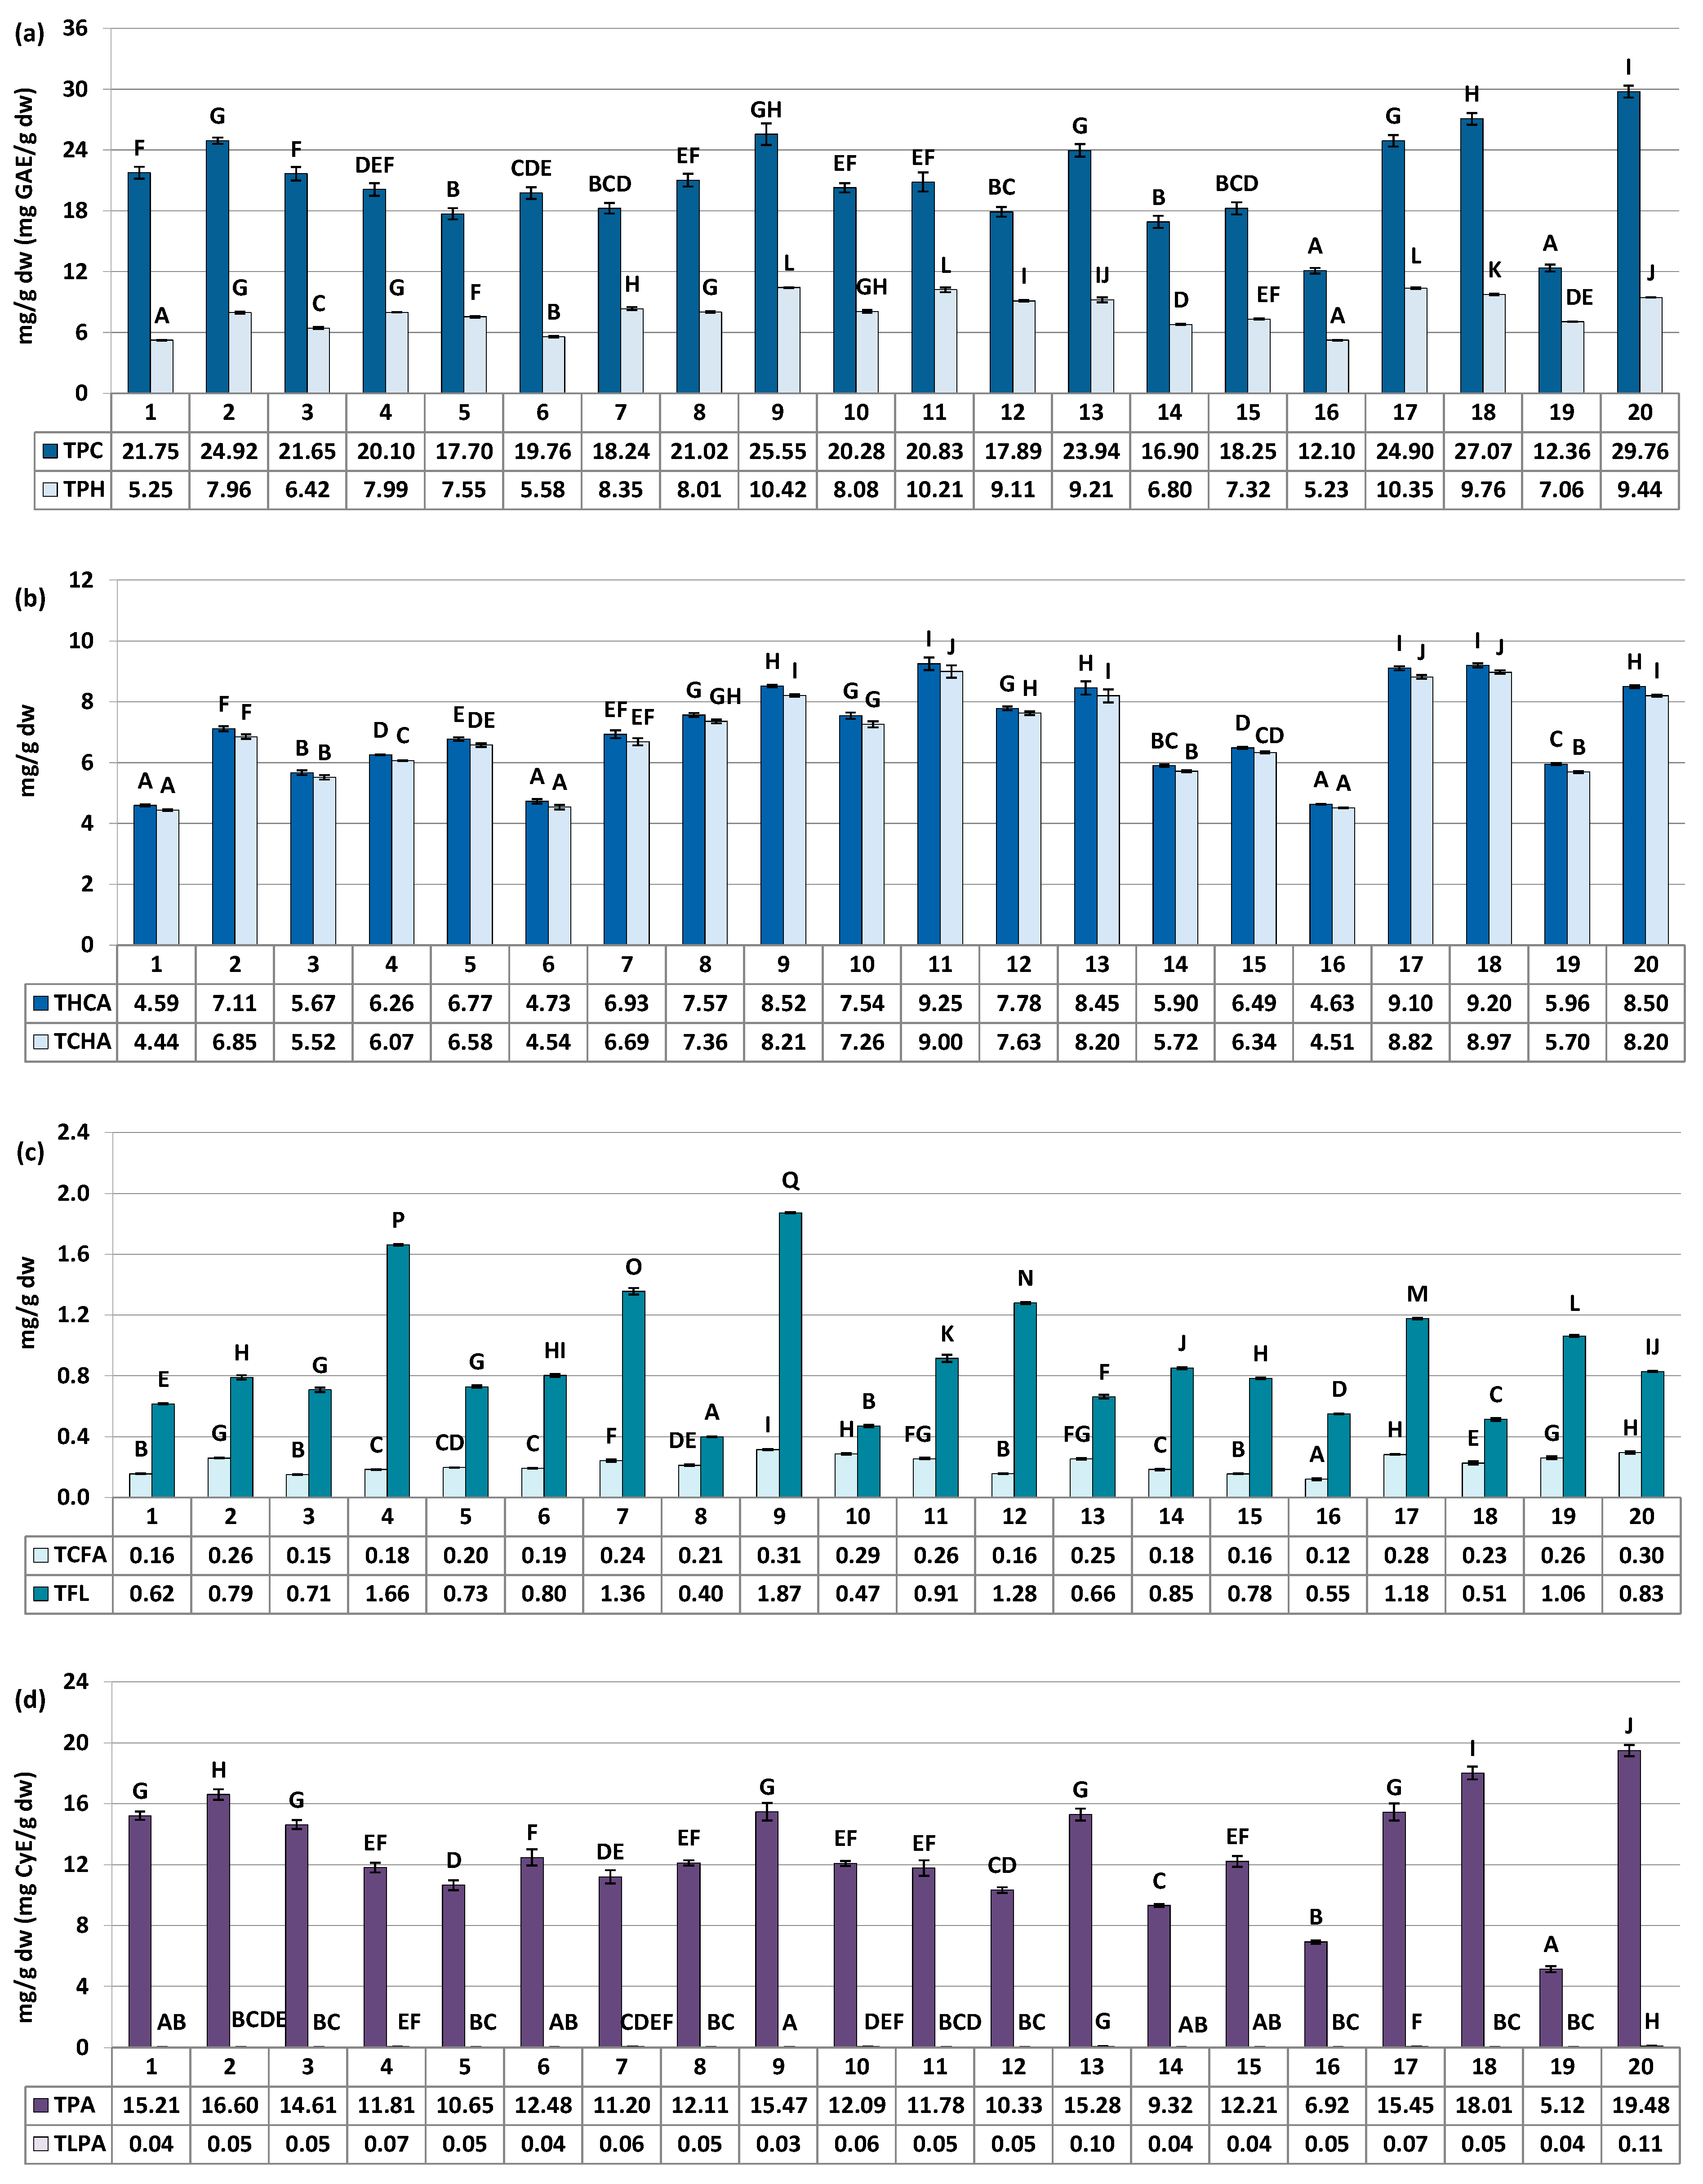
The quantitative profile of the samples was assessed through UV–Vis spectrophotometry in terms of total contents of polyphenols (TPC, determined by the Folin–Ciocalteu assay) and proanthocyanidins (TPA, determined by the n-butanol/HCl assay). Additionally, the HPLC-PDA method was employed to quantify nineteen primary individual compounds that were within the limit of quantification, and calculate the total content of all polyphenols detected by HPLC (TPH), as well as the contents of specific groups of polyphenols (flavonoids, hydroxycinnamic acid derivatives, mono- and dicaffeoylquinic acid isomers, low-molecular-weight proanthocyanidins, etc.). Figure 2 illustrates the variability in the levels of twelve individual compounds predominant or specific to the phenolic profile of rowanberries (six phenolic acids, five flavonoids, and one proanthocyanidin). Figure 3 presents the variation in the total phenolics (TPC, TPH) and the contents of specific groups of polyphenols. For more detailed information see Supplementary Materials (Tables S1 and S2).
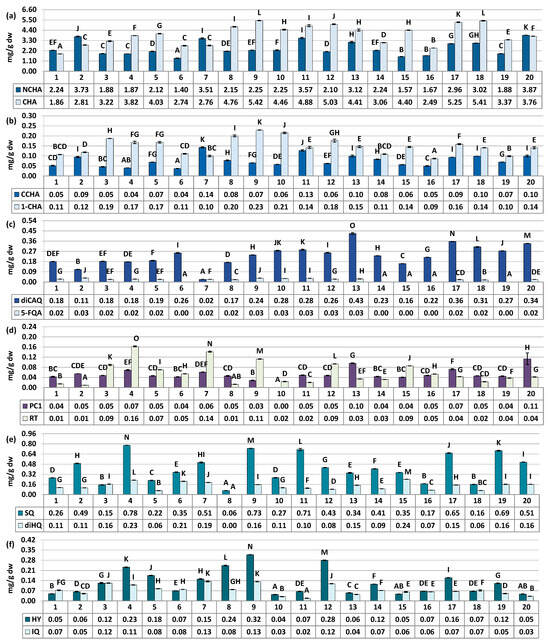
Figure 2.
Quantitative profile of individual compounds in the S. aucuparia fruits (mg/g fruits dw). Results are presented as the means ± SD (n = 3). For each parameter, different superscript letters on particular charts (A–O) indicate significant differences (p < 0.05). (a) NCHA, 3-O-caffeoylquinic acid; CHA, 5-O-caffeoylquinic acid. (b) CCHA, 4-O-caffeoylquinic acid; 1-CHA, 1-O-caffeoylquinic acid. (c) diCAQA, 3,5-O-dicaffeoylquinic acid; 5-FQA, 5-ferulquinin acid. (d) PC1, procyanidin C1; RT, rutin. (e) SQ, quercetin 3-O-β-sophoroside; diHQ, quercetin O-dihexoside. (f) HY, hyperoside; IQ, isoquercitrin.
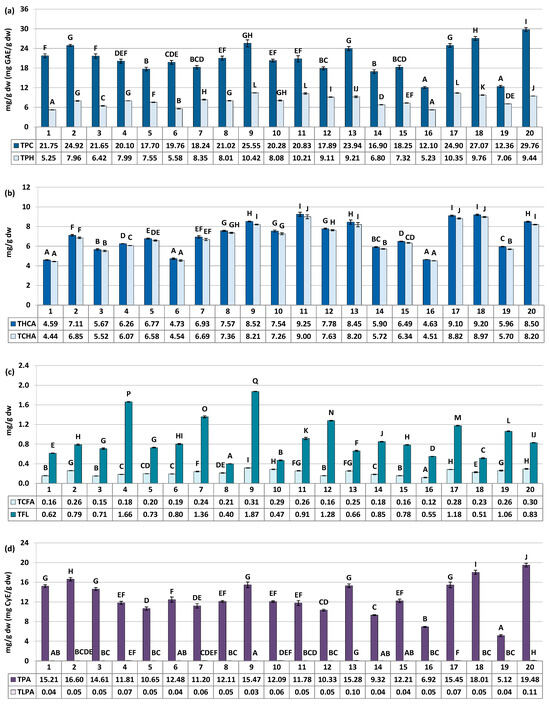
Figure 3.
Quantitative profile of groups of compounds in the S. aucuparia fruits (mg/g fruits dw). Results are presented as the means ± SD (n = 3). For each parameter, different letters on particular charts (A–Q) indicate significant differences (p < 0.05). (a) TPC, total phenolic content in gallic acid equivalents (GAE) determined by the Folin–Ciocalteu assay; TPH, total phenolic content determined by RP-HPLC-PDA. (b) THCA, total content of hydroxycinnamic acid derivatives (TCHA + TCFA); TCHA, total content of mono- and dicaffeoylquinic acids isomers. (c) TCFA, total content of phenolic acids derivatives other than TCHA; TFL, total content of flavonoids. (d) TPA, total proanthocyanidin content in cyanidin chloride equivalents (CyE) determined by the n-butanol/HCl assay; TLPA, total content of proanthocyanidin determined by RP-HPLC-PDA.
The major fruit constituents were mono- and dicaffeoylquinic acids (TCHA, 4.44–9.00 mg/g dw) and oligomeric and polymeric proanthocyanidins (TPA, 5.12–19.48 mg CyE/g dw) (Figure 2 and Figure 3). The TPC and TPH values determined using the Folin–Ciocalteu assay and HPLC-PDA, respectively, varied in a range of 12.10–29.76 mg GAE/g of fruits dw and 5.23–10.42 mg/g of fruits dw (Figure 3). These finding align with previous reports, which have indicated phenolic levels in rowanberries spanning from 5.25 mg GAE/g of fruits dw to 26.8 mg GAE/g of fruits dw, depending on sample origin and preparation [8,11,33]. Observed phenolic contents are also similar or higher than that of fruits of other Sorbus species, e.g., S. aria (3.9–29.8 mg GAE/g) or S. domestica (3.5–12.1 mg GAE/g) [11,33,34].
The variability of the samples in terms of total phenolic contents was relatively low, with coefficient of variation (CV) of 21.62% and 20.44% for the TPC and TPH levels, respectively (Table 3). However, when assessing quantitative differences in the contents of phenolic groups and individual compounds, the CVs increased significantly. They reached up to 43.59% for total flavonoids (TFL), and even higher values of 45.48%, 52.44%, 68.15%, and 75.87% were observed individually for IQ, SQ, HY, and RT, respectively. This pattern of variation, characterized by substantial differences in flavonoid quantities alongside lower variability in TPC, is consistent with findings previously reported for S. aucuparia and S. aria fruits collected from various locations in Serbia and Montenegro [33], as well as for S. domestica leaves colected from Poland and Croatia [35]. However, it is also worth to notice that flavonoids variability pattern seems to be closely species-related. For example, the content of RT in different populations of Cornus mas was about 2–20 µg/g of fresh berries, while for closely akin Cornus sanguinea it was about 2–120 µg/g [36]. The difference in flavonoids variability trend was also observed for fruits of black and red currant [37], as well as leaves and flowers of Crataegus ssp. [38], among others. Nevertheless, the results provide a further proof, that flavonoids seems to be the most changeable chemical group in rowan species, including S. aucuparia fruits.
Table 3.
The average contents and the coefficients of variation (CV) for phenolic groups and individual compounds present in the S. aucuparia fruits.
Observed variability can be attributed to various factors stemming from the multifaceted functions of flavonoids in plant physiology, particularly their role in the intricate interactions between plants and their environment [19,21,39]. For instance, they play a crucial role in safeguarding plant against herbivores, insects, nematodes, and pathogenic bacteria and fungi [7,29,30,31]. On the other hand, flavonoids can serve as attractants for pollinators, as well as birds or mammals, facilitating seed dispersal [7,32]. Moreover, plant secondary metabolites assume a critical role in the protection against abiotic stress conditions [19,20,21,39,40,41,42], among which access to light and solar radiation stands out as particularly significant factor for flavonoid biosynthesis in fruits [40]. For instance, the exposure to sunlight has been reported to induce the accumulation of flavonoids in various fruits, such as grape berries, cranberries, bilberries, raspberries, strawberries, pears, and apples. It has also been established, that UV and blue light exert the most pronounced effects on the expression of genes involved in the flavonoid biosynthesis. Within this group of compounds, flavonols, especially quercetin and kaempferol glycosides, appear to be the most responsive to environmental changes. Due to their specific chemical structure, characterized by the presence of an OH group in the C-3 position of the flavonoid skeleton and a double bond between C-2 and C-3 in the B-ring, flavonols are capable of selectively absorbing UV-B radiation. They also exhibit the ability to scavenge reactive oxygen species and mitigate photo-oxidative damage in plants [19,39]. The heightened sensitivity of flavonol biosynthesis to sunlight has been the subject of extensive research. For example, it has been shown that in grape berries exposed to shade, the accumulation of flavonols decreased significantly, in contrast to the less pronounced changes observed in other compounds tested, such as proanthocyanidins and anthocyanins [43]. Toxic heavy metals, salinity, water availability, and nutrient availability are among other environmental stress factors that influence the biosynthesis of different plant secondary metabolites [20,41,42].
However, in natural settings, plants are often exposed to multiple stressors simultaneously, making it challenging to predict the impact of all factors on the accumulation of specific compounds. Achieving such predictability would require tightly controlled breeding conditions, and even then, there would be still an element of uncertainty. This is because when two or more factors coincide, their effects can be additive, synergic, or one factor may take precedence [20].
Therefore, to ensure the quality of plant products, especially for functional applications, precise control over their composition is essential. This is particularly relevant for the active ingredients that primarily contribute to the desired biological properties. In the case of S. aucuparia fruits, various polyphenolic compounds present in complex fractions have been proposed to be responsible for their antioxidant and antidiabetic properties [5]. However, it remains to be determined, the variations in content of which polyphenols are the most significant in the context of fruits activity, and which might be considered irrelevant for the quality of rowanberries. To answer this question, we must first investigate to what extent the activity of rowanberries is subject to change.
3.3. The Variation in the Biological Activity Parameters
The ability of S. aucuparia fruit constituents to neutralize reactive oxygen species has been identified as a crucial mechanism contributing to the biological activity of rowanberries [5,9]. Among various radicals of physiological significance, the plant material demonstrated particularly strong affinity towards •OH [5]. This is of paramount importance, since •OH is one of the most highly reactive radical found in living organisms, capable of damaging various biomolecules and playing a role in the development of many cardiovascular and neurological disorders [44,45]. Secondly, the inhibitory activity of rowan fruits on carbohydrate-digesting enzymes, especially α-glucosidase [6,46], has been identified as an important mechanism that may be responsible for lowering blood glucose levels in vivo (tested so far in the mouse model of diabetes) [47]. Both of these effects are integral components of the biological activity of S. aucuparia fruits and could explain their traditional usage in diabetes management and prevention of diabetic complications associated with oxidative stress [5]. Therefore, the •OH scavenging and α-glucosidase inhibition were selected as activity models for assessing the variability in the biological effectiveness of rowanberries.
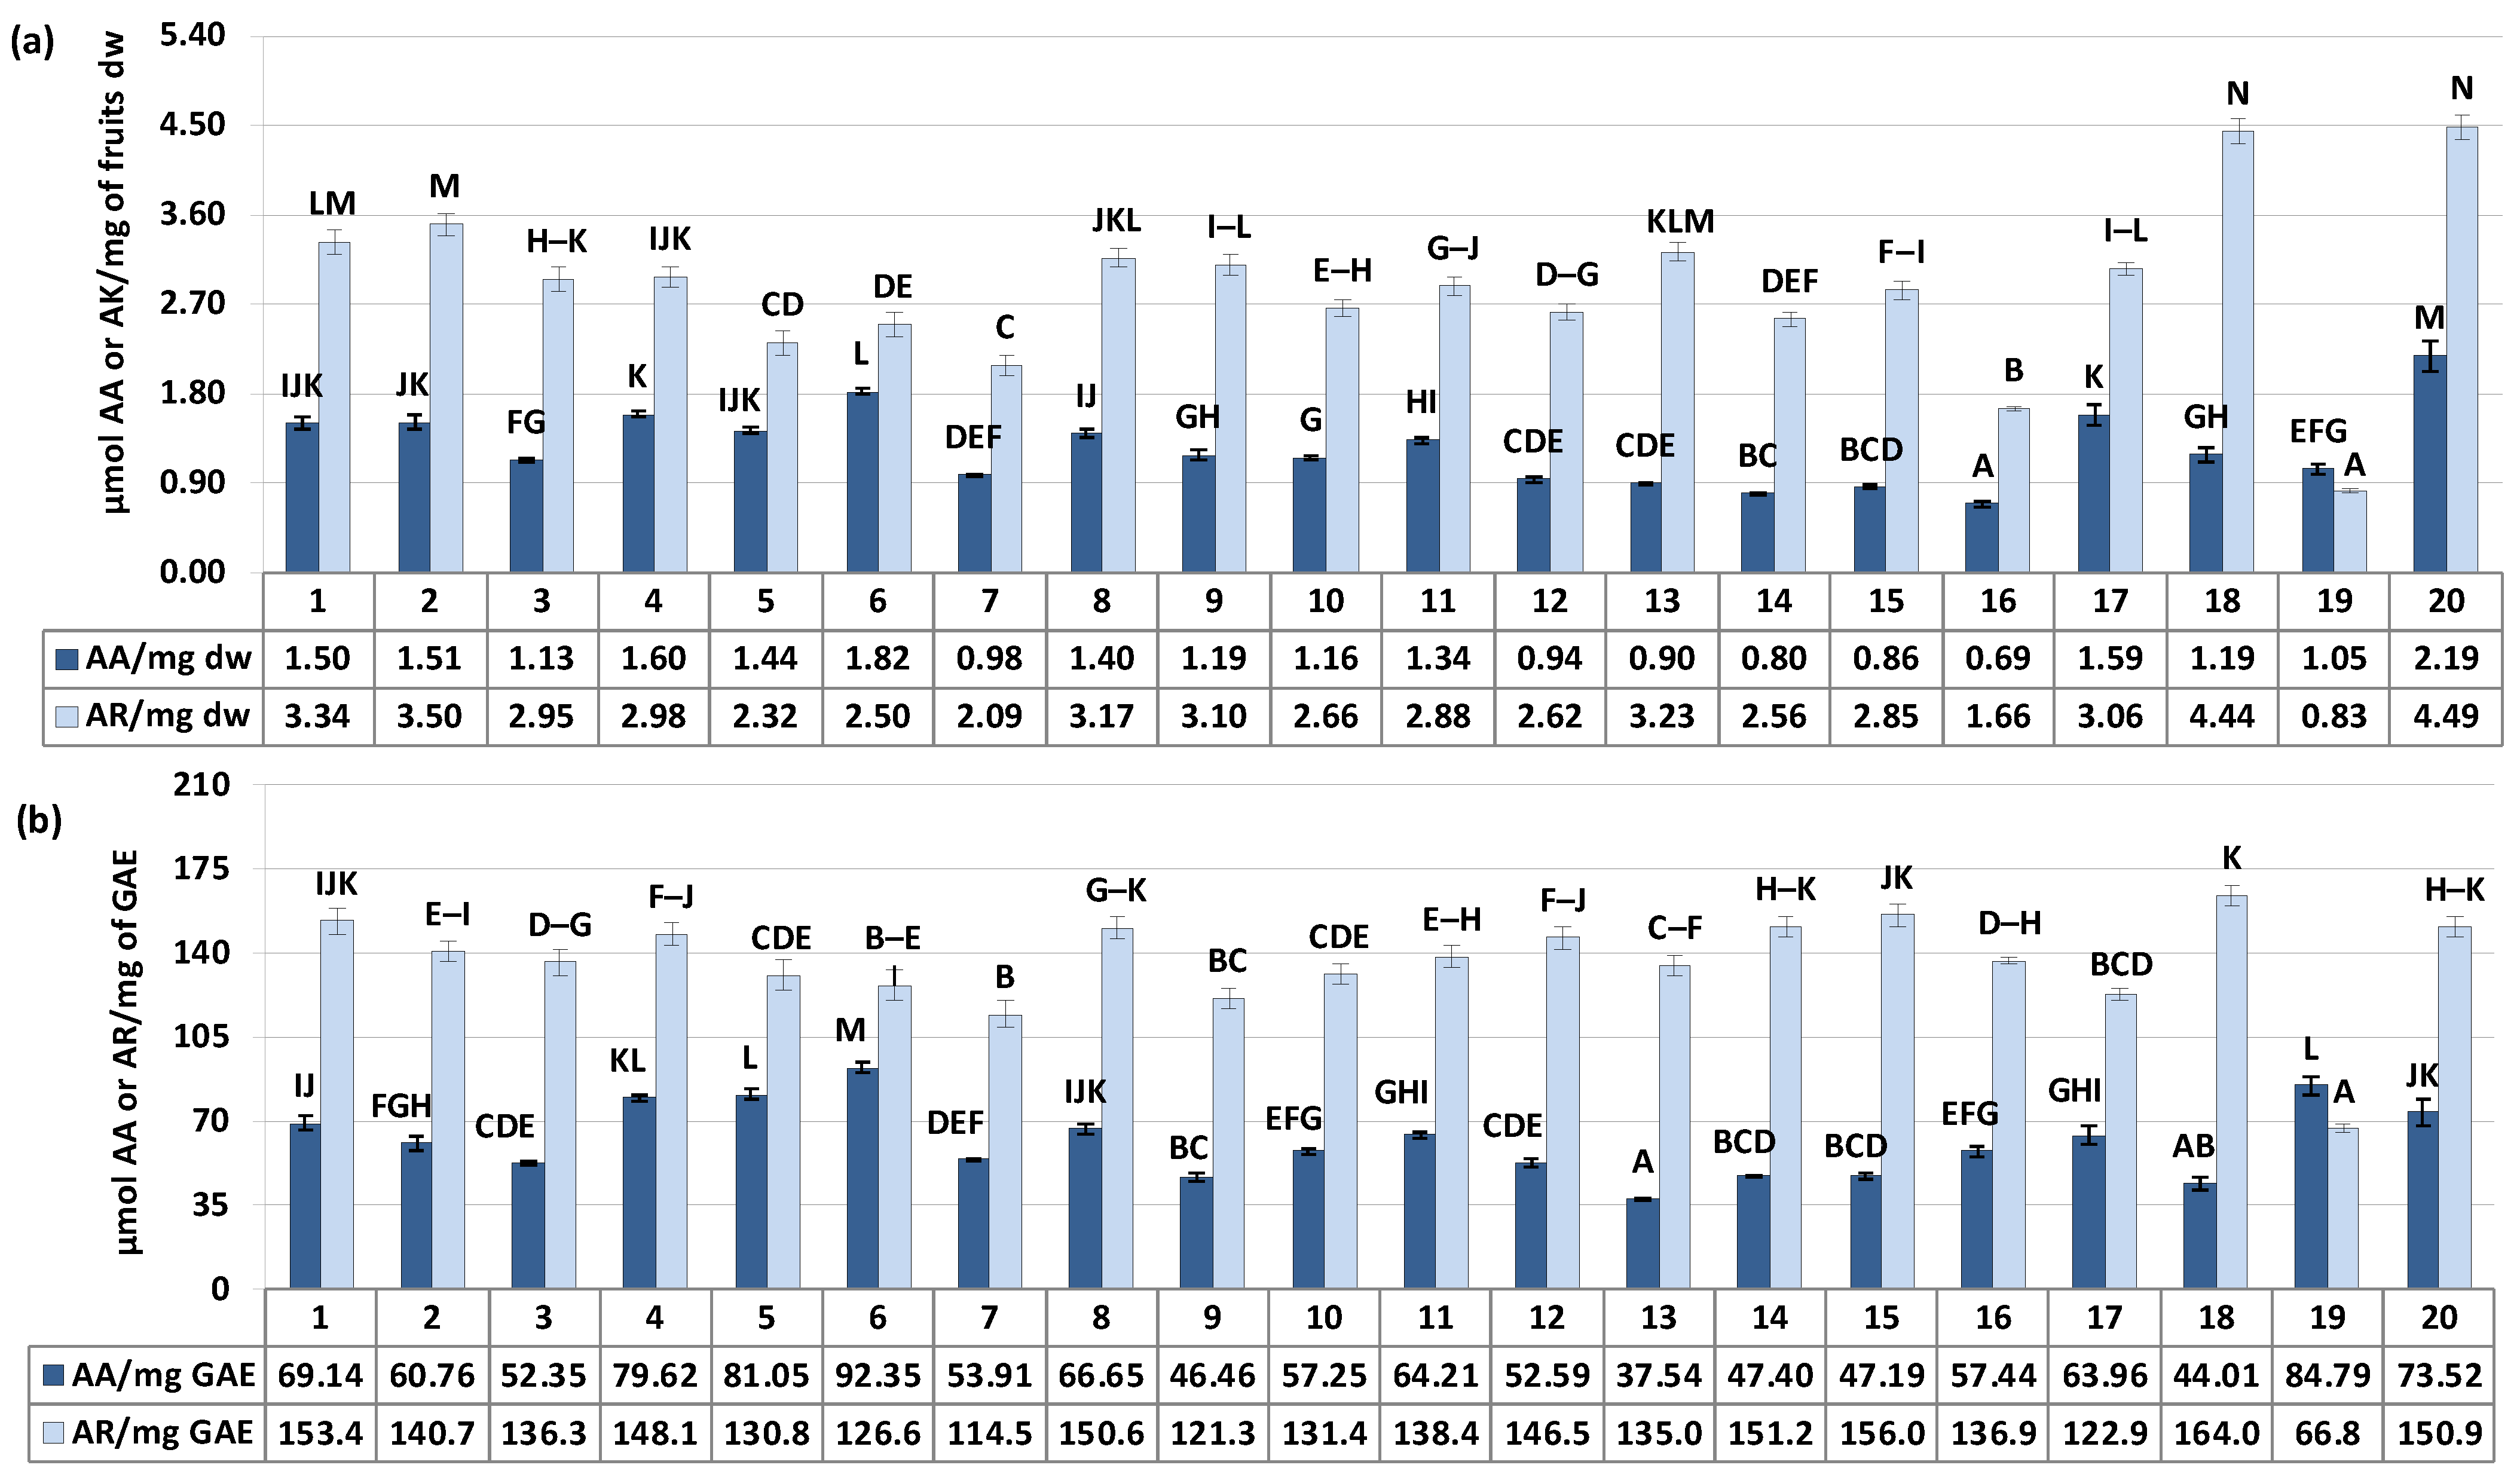
As illustrated in Figure 4a, the SC50/IC50 values (effective scavenging/inhibitory concentrations) expressed in ascorbic acid (AA) or acarbose (AR) equivalents ranged from 0.69 to 2.19 μmol AA/mg and 0.83 to 4.49 μmol AR/mg of fruits dry weight for •OH scavenging and α-glucosidase inhibitory activity, respectively, with the variation in samples (CV) at 29.61% and 28.85%. Considering the above results of polyphenols variability, these differences in activity may be the result of distinction in samples composition. Indeed, in accordance with our previous research [5] and literature data [6,46], the responses in the selected assays were dependent on phenolic content, showing a significant correlation with the total phenolic and total proanthocyanidin levels (r = 0.5890, p = 0.006 for TPC/•OH and r = 0.5547, p = 0.011 for TPA/•OH, in AA equivalents; r = 0.9167, p = 0.000 for TPC/α-glucosidase and r = 0.9305, p = 0.000 for TPA/α-glucosidase, in AR equivalents). However, it is known that the polyphenolsic content alone is not the sole determinant influencing plants activity. Equally important, might be the proportion between different constituents. As previously reported, the activity of flavonols, flavan-3-ols and caffeoylquinic acids against radicals can be synergistic, but this synergy strongly depends on their relative ratios [48].

Figure 4.
α-Glucosidase inhibition and scavenging activity against •OH radical of the S. aucuparia fruits. Data expressed in terms of acarbose (AR, for the α-glucosidase assay) and ascorbic acid (AA, for the •OH scavenging assay) equivalents per (a) fruits dry weight (μmol AR/mg dw or μmol AA/mg dw) or (b) per polyphenols weight (μmol AR/mg GAE or μmol AA/mg GAE) based on the IC50/SC50 values. Acarbose IC50 176.4 ± 7.6 μg/mL (1.55 μmol/mg), ascorbic acid SC50 155.5 ± 3.3 μg/mL (5.68 μmol/mg). Error bars indicate SD values (n = 3). Values on particular charts labelled with the same letter (A–N) did not differ significantly at α = 0.05.
Therefore, the last subject to investigate is to determine the impact of chemical composition variability on biological properties of rowanberries, and to what extent should quality control measures be implemented for fruit products to ensure their value?
3.4. The Selection of Variability Markers of Rowanberries Composition and Activity: Chemometric Analysis
To better understand the variability of phenolic composition, the relationship between individual components, and their influence on the biological activity of S. aucuparia fruits, a deeper analysis using chemometric tools (HCA and PCA) was performed.
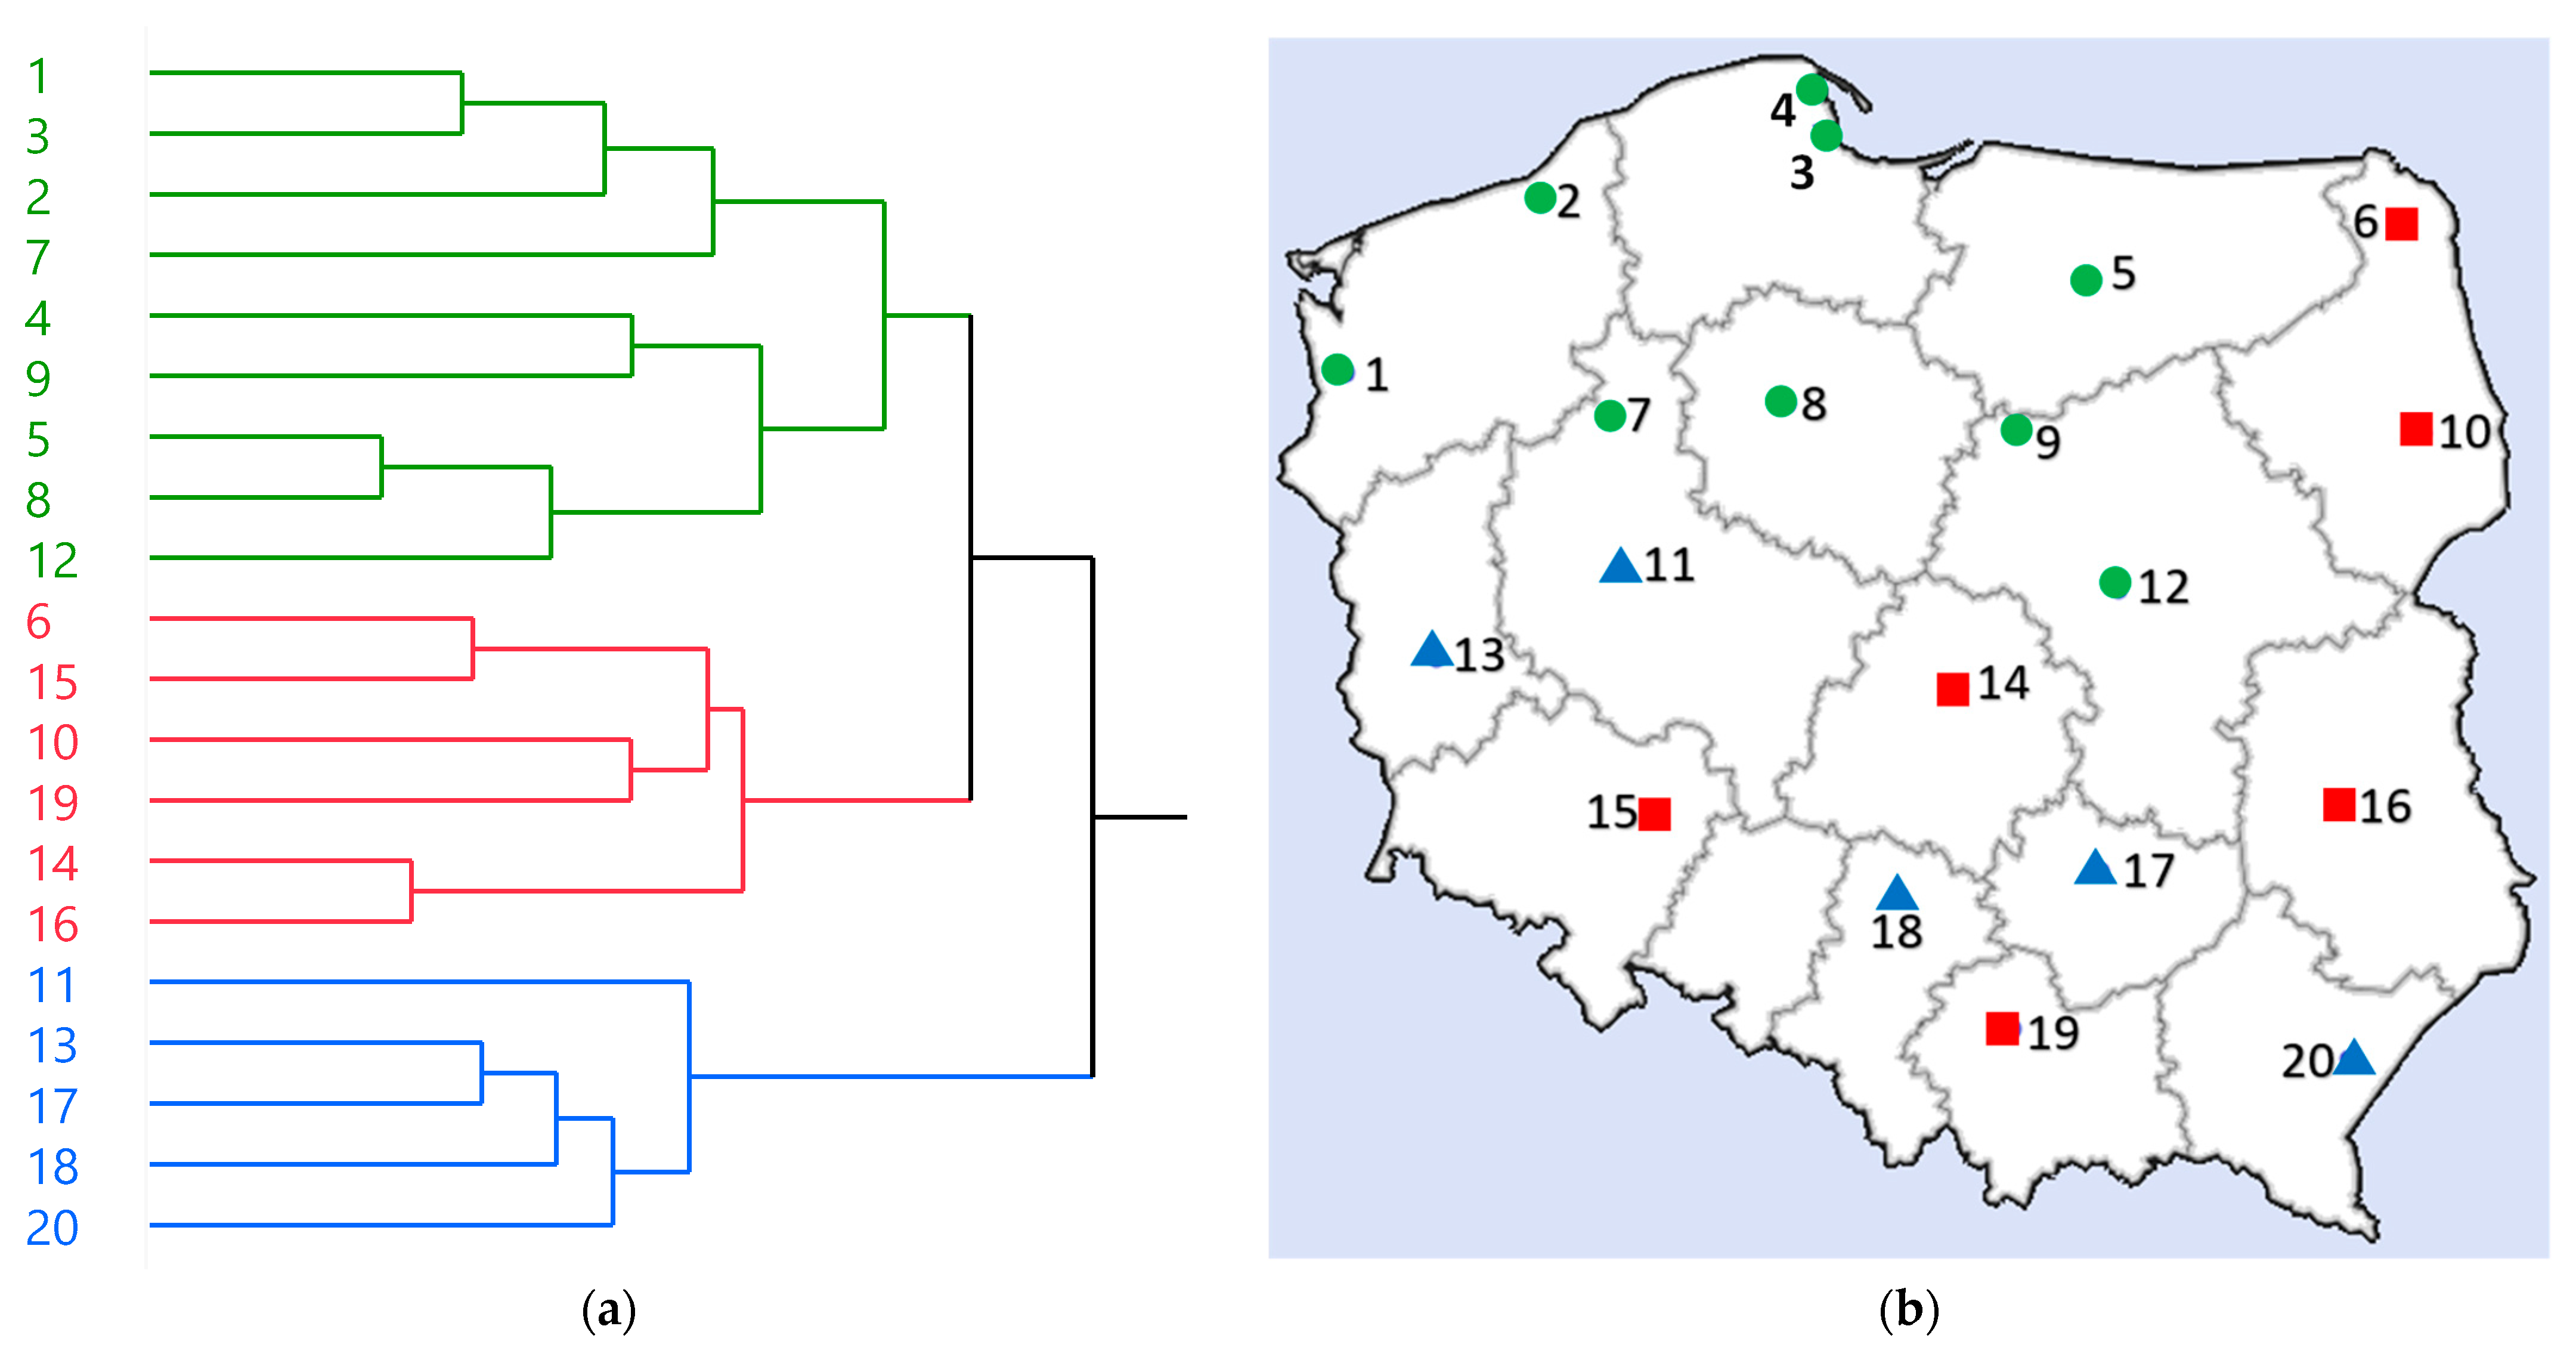
First, the HCA was performed based on the quantification results of 19 major phenolics (compounds that were within the limit of quantification of HPLC-PDA), TPA levels, and •OH scavenging and α-glucosidase inhibition parameters (22 variables in total). As a result, the samples were categorized into three groups: these obtained specifically from northern Poland (green cluster; circle), these from eastern and also partially from southern Poland (red cluster; square), and these partially from southern and western Poland (blue cluster; triangle) (Figure 5). The results indicate that while there are overlaps in geographical locations between blue and red clusters, the chemical composition and biological properties of rowanberries in Poland may be influenced, to some extent, by their geographic origin.
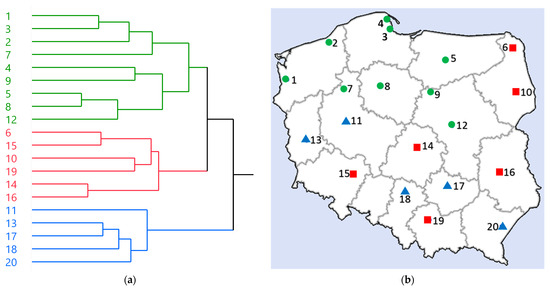
Figure 5.
HCA analysis results. (a) Dendrogram obtained by HCA; (b) A map of Poland showing the origin of samples divided into groups based on HCA; green cluster, circle (samples nos. 1, 2, 3, 4, 5, 7, 8, 9, 12); red cluster, square (samples nos. 6, 10, 14, 15, 16, 19); blue cluster, triangle (samples nos. 11, 13, 17, 18, 20).
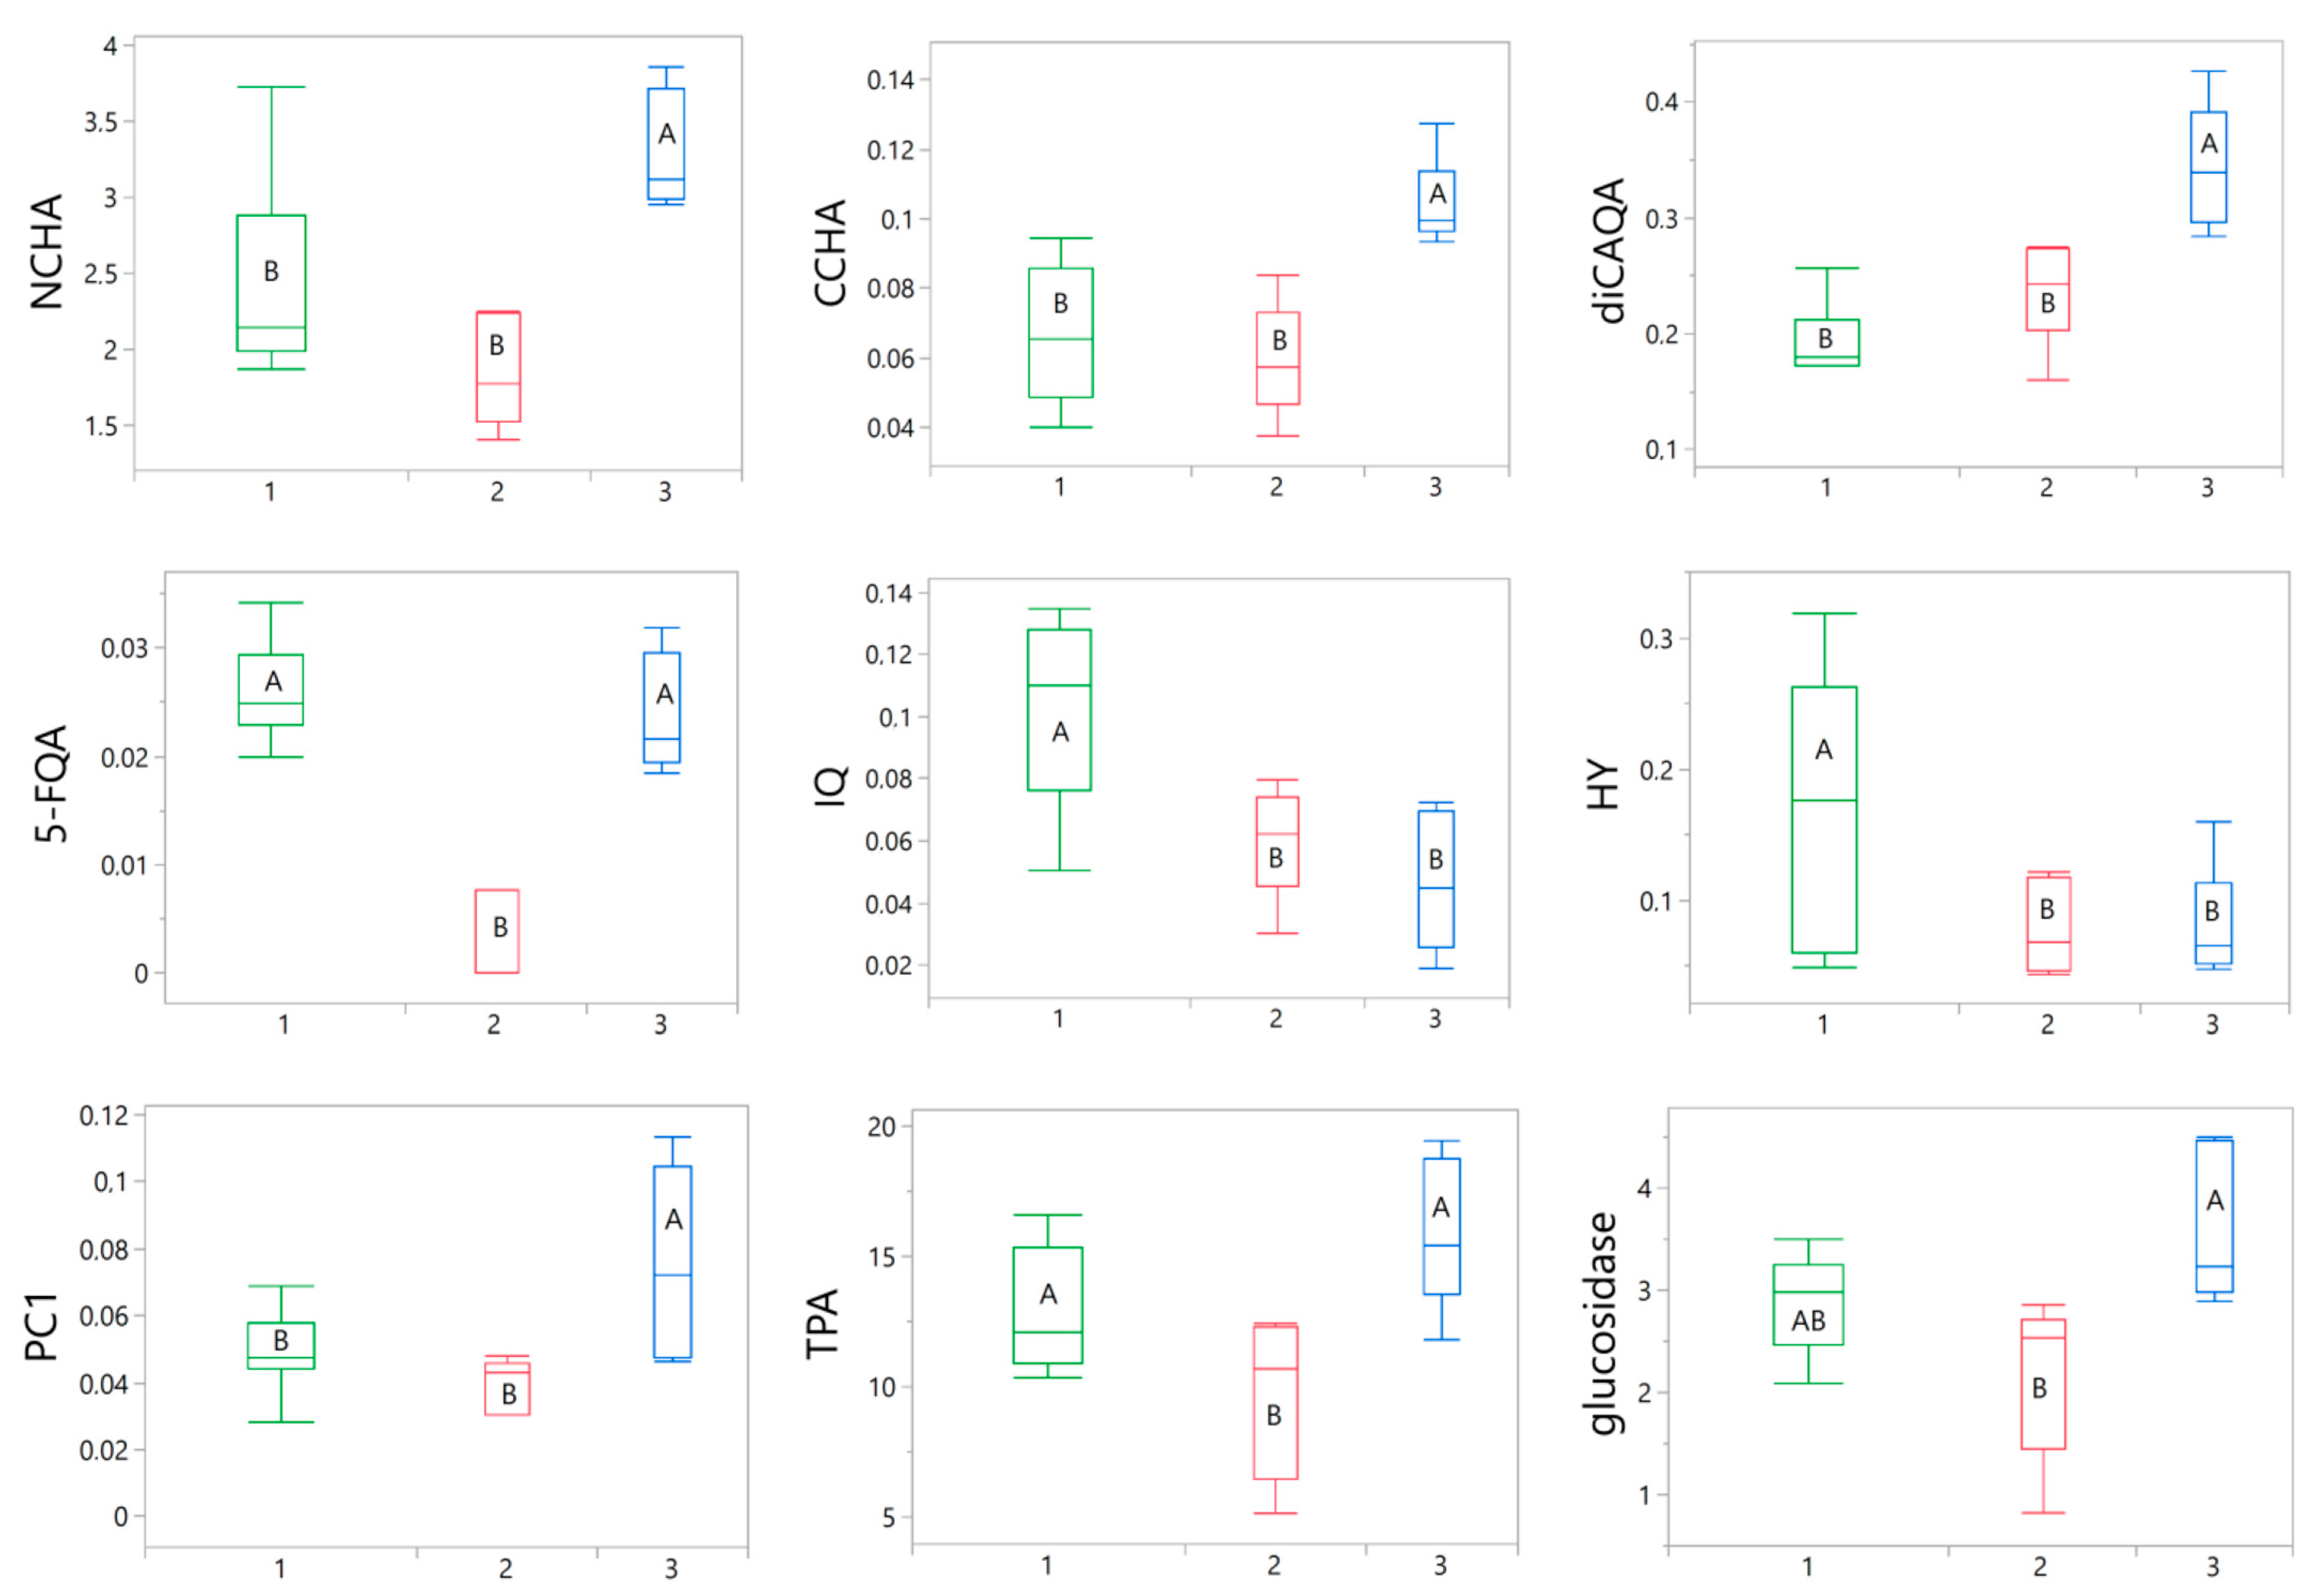
Subsequently, an inter-cluster ANOVA analysis was conducted to identify the parameters influencing the categorization. Out of all the tested variables, only nine were found to significantly contribute to the differentiation of the samples. These variables included 3-O-caffeoylquinic acid (NCHA), 4-O-caffeoylquinic acid (CCHA), 3,5-O-dicaffeoylquinic acid (diCAQA), 5-feruloylqunic acid (5-FQA), HY, IQ, procyanidin C1 (PC1), TPA, and α-glucosidase inhibition. The variations in these parameters among the groups are presented in Figure 6.
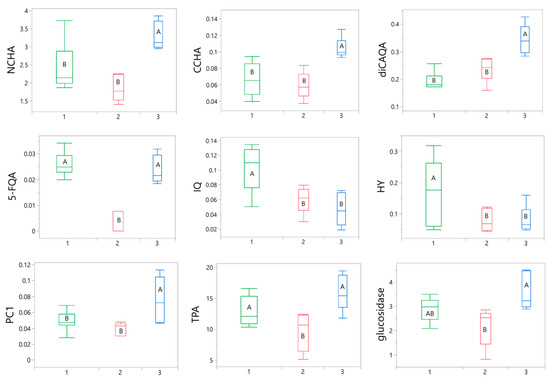
Figure 6.
Box plots illustrating the variations in nine selected parameters between green (1), red (2), and blue (3) clusters. The width of the boxes depends on the number of samples in particular cluster. The statistical significance of differences between the mean values was determined using a one-way ANOVA, followed by the post hoc Fisher’s LSD for multiple comparison. Within particular chart means for boxes labeled with the same letter (A, B) did not differ significantly at α = 0.05. IQ, isoquercitrin; HY, hyperoside; CCHA, 4-O-caffeoylquinic acid; NCHA, 3-O-caffeoylquinic acid; 5-FQA, 5-feruloylquinic acid; diCAQA, 3,5-O-dicaffeoylquinic acid; PC1, procyanidin C1; TPA, total proanthocyanidins; glucosidase, α-glucosidase inhibitory activity.
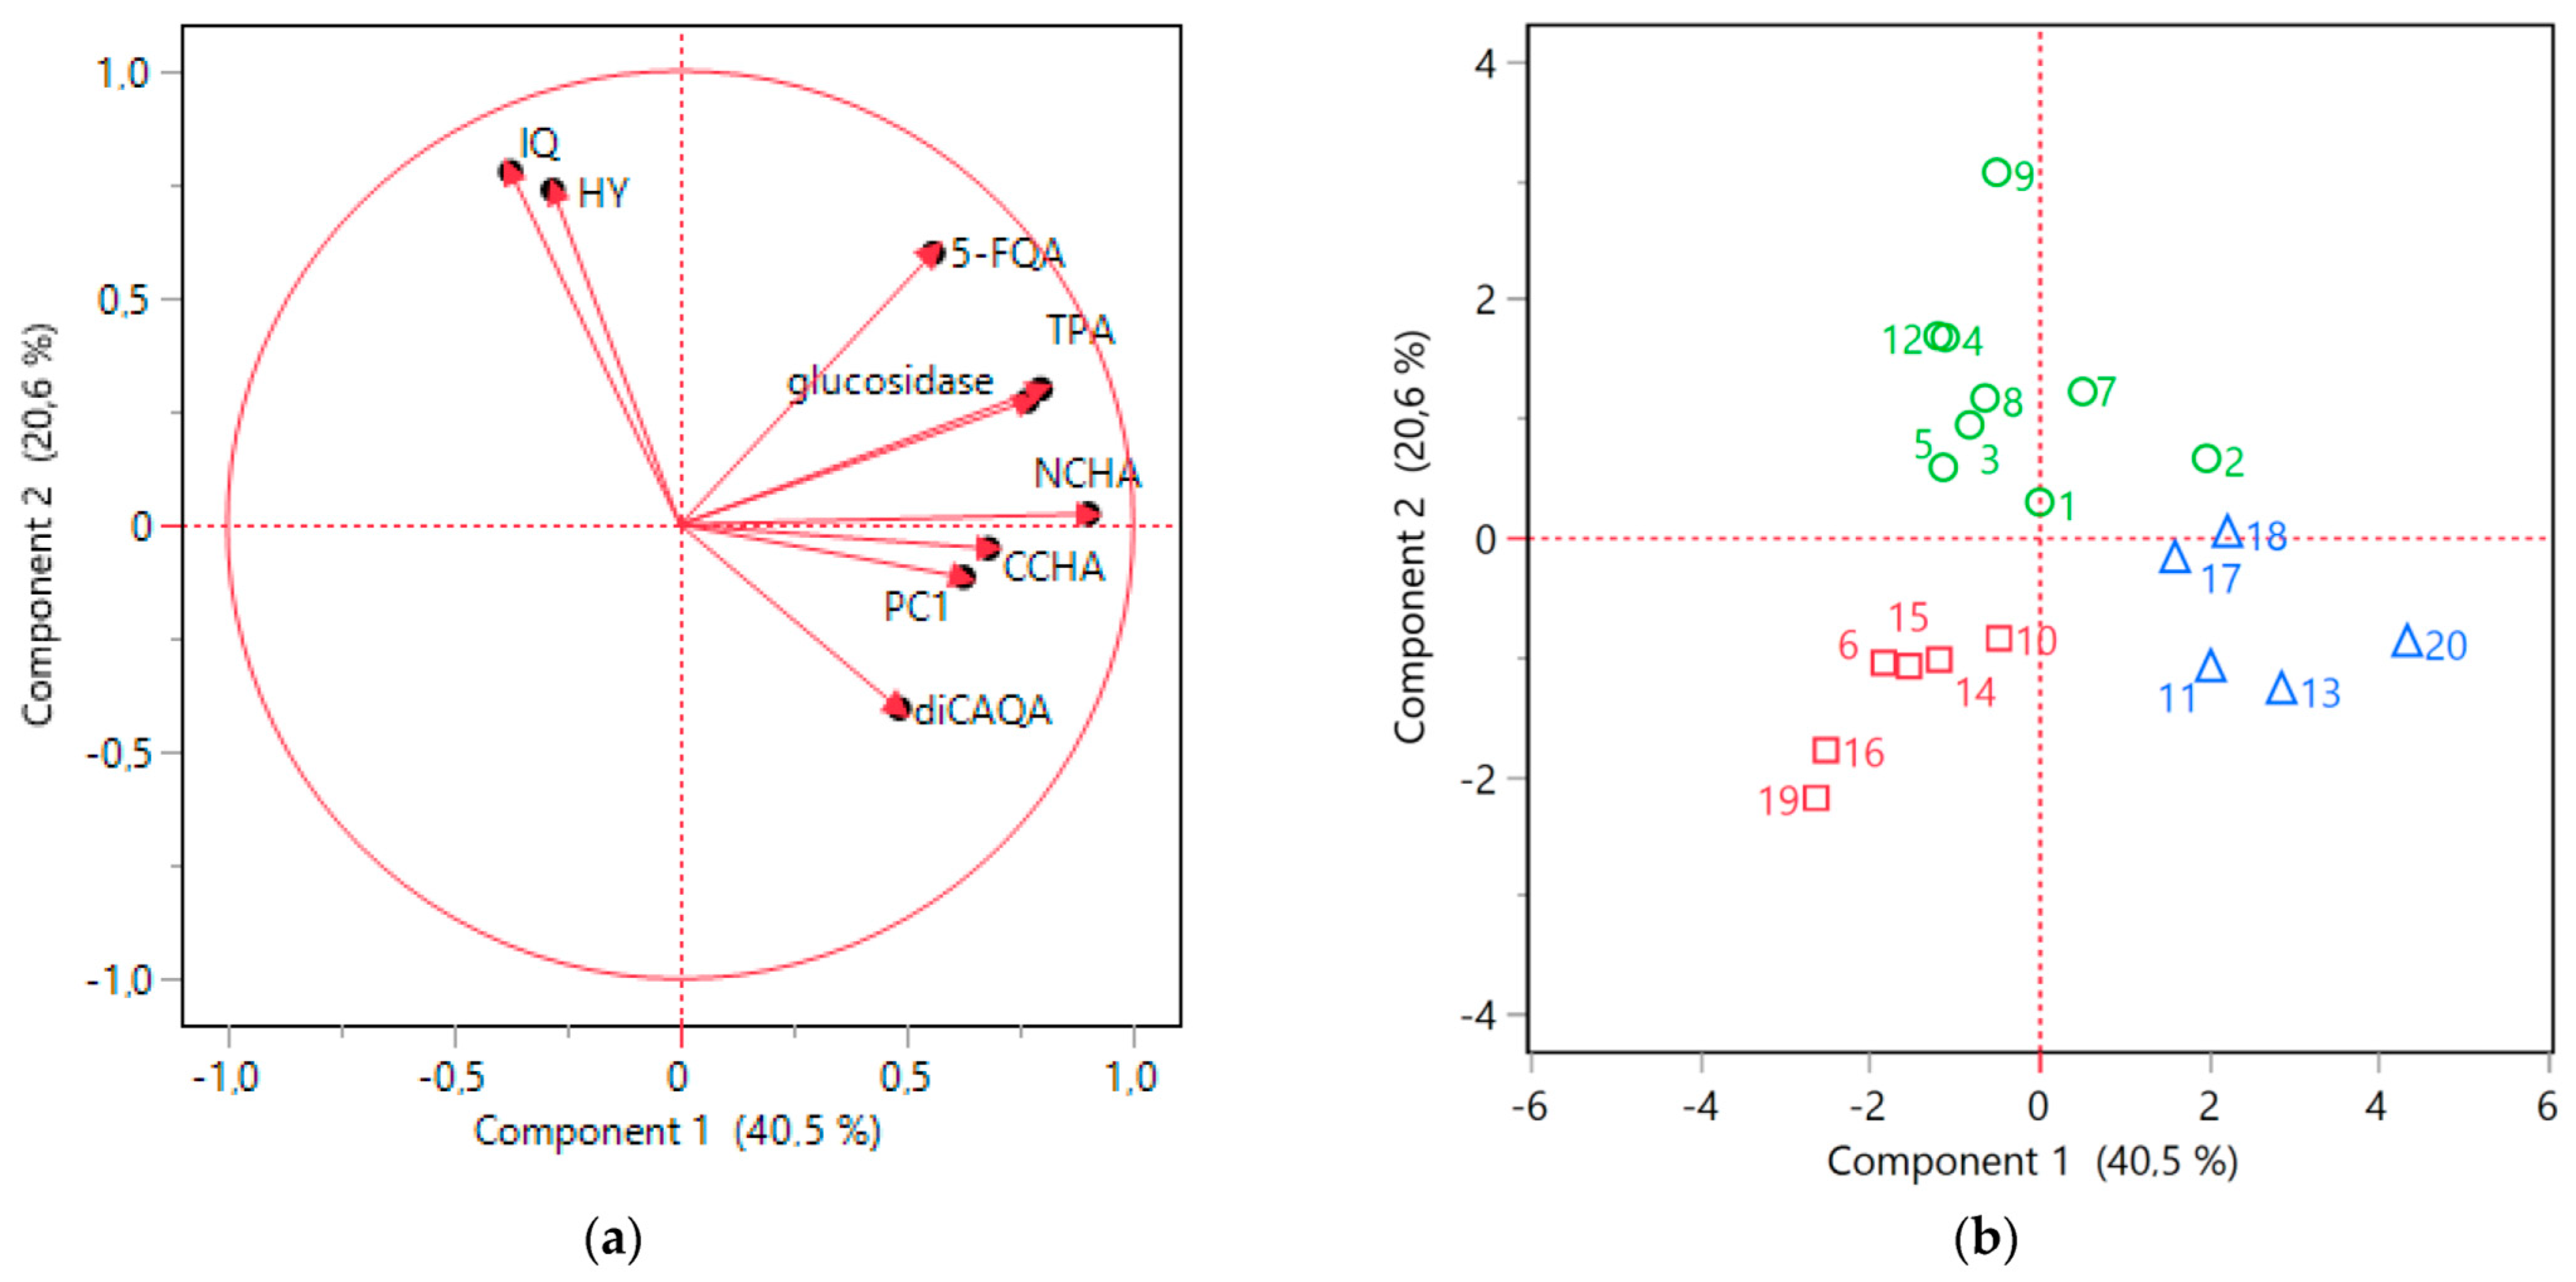
The nine selected parameters were subsequently subjected to PCA to explore the interrelationships between the variables. The first two principal components (Component 1 and Component 2) collectively accounted for over 60% of variability in the data. The resulting scores plot was in accordance with the HCA outcomes, demonstrating a clear distinction between the clusters identified earlier (Figure 7b). Moreover, the collective findings from ANOVA and PCA provided a more detailed characterization of these specific clusters.

Figure 7.
PCA analysis results. (a) Loading plot; (b) score plot for 9 investigated variables (isoquercitrin, IQ; hyperoside, HY; 4-O-caffeoylquinic acid, CCHA; 3-O-caffeoylquinic acid, NCHA; 5-feruloylquinic acid, 5-FQA; 3,5-O-dicaffeoylquinic acid, diCAQA; procyanidin C1, PC1; total proanthocyanidins, TPA; and α-glucosidase inhibitory activity). Green cluster, circle (samples nos. 1, 2, 3, 4, 5, 7, 8, 9, 12); red cluster, square (samples nos. 6, 10, 14, 15, 16, 19); blue cluster, triangle (samples nos. 11, 13, 17, 18, 20).
The blue cluster was distinguished by high Component 1 values, which were significantly positively influenced by elevated levels of phenolic acids and procyanidins included in the analysis (Figure 7b). Indeed, the samples belonging to blue cluster contained on average significantly higher levels of NCHA, CCHA, diCAQA, and PC1 (Figure 6). Furthermore, the loading plot (Figure 7a) reaffirmed the substantial correlation previously observed between TPA levels and α-glucosidase inhibitory activity. The potency of α-glucosidase inhibition also positively loaded onto Component 1, with the samples in the blue cluster displaying the highest activity in this regard.
All the samples within the green cluster exhibited positive Component 2 scores, primarily associated with the notable presence of IQ and HY (Figure 7a,b), which were found to be, on average, more abundant in this cluster compared to the others (Figure 6). A robust correlation between the levels of the two flavonols was also evident (Figure 7a). Although the green cluster had lower contents of NCHA, CCHA, and diCAQA compared to the blue cluster, no statistically significant differences were observed between the two clusters in terms α-glucosidase inhibitory activity. This suggest that high levels of flavonoids might partly compensate for the lower phenolic acids levels in the green cluster.
The red cluster comprised samples with negative scores for both Component 1 and Component 2 (Figure 7b). This was reflected in lower flavonoid (IQ and HY) content compared to the samples of the green cluster and a lower phenolic acid content compared to the samples from blue cluster (Figure 6). Additionally, the red cluster exhibited reduced TPA and α-glucosidase inhibitory activity compared to both of the other clusters. Thus, samples grouped in this cluster might be considered of inferior quality, particularly for functional applications aimed at inhibiting sugar absorption.
Considering the conducted chemometric analysis, it appears that the total proanthocyanidin content (TPA) along with seven specific individual phenolic compounds could serve as valuable variability markers of S. aucuparia fruits. The individual constituents comprise two flavonoids (IQ, HY), four phenolic acids (NCHA, CCHA, diCAQA, 5-FQA), and one proanthocyanidin (PC1). These parameters have been proven effective in categorizing the tested samples into distinct groups that differ in composition.
Some of these differences might have attributed to the geographic origin and associated climatic conditions. The samples belonging to the green cluster, originating from the northern part of Poland, might have benefited from a milder climate influenced by the proximity of the Baltic Sea. This region experiences cooler summers and relatively warmer winters compared to the rest of the country [49]. Such climatic conditions appear to favor the biosynthesis of quercetin derivatives, particularly its simple monoglycosides such as IQ and HY. Similar pattern of flavonoids biosynthesis was previously reported for, e.g., S. domestica leaves—samples collected from the seaside location in Croatia accumulated even up to several dozen times higher amount of IQ and HY than samples from the central part of Poland [35].
The eastern region of Poland is under the influence of Eurasian continental air masses, resulting in harsher winters and hotter summers. Furthermore, the eastern region’s growing season tends to be shorter compared to the western part of the country [49], which may limit the production of active metabolism and account for the comparatively poorer results obtained for samples within the red cluster sourced from the eastern boundary. The maritime air reaching the western part of Poland seems, in turn, to promote the production of active metabolites, especially proanthocyanidins and phenolic acids. Nonetheless, some variations in composition (especially for samples from southern part of Poland) could not be solely attributed to the broad geographic origin factors and might be influenced by more localized factors, such as soil conditions. Moreover, some factors may have a dual effect on the plants metabolites production, depending on their intensity and duration. For example, it was reported that while moderate drought stress promote the polyphenols biosynthesis, the prolonged drought leads to a reduction in fruits mass and the content of polyphenols in the, e.g., S. domestica fruits [34]. This may also partly explain the intertwining of blue and red clusters, where different air mass and other conditions can affect the plant material growth.
The observed differences in the levels of selected variability markers were also associated with the biological properties of the fruits, especially their α-glucosidase inhibitory potential. To achieve the highest activity in this regard, it is advisable to ensure high levels of TPA and phenolic acids, particularly the predominant NCHA. Moreover, the plant material from northeastern parts of Poland appears to be more suitable, on average, for functional applications in this context. As for •OH scavenging activity, this study did not identify clear markers of antioxidant effectiveness, as there were no statistically significant inter-cluster differences. This could be attributed to the complex interactions between different constituents (additive and/or synergistic) [50]. However, it is worth noting that sample 6 in the red cluster displayed one of the highest •OH neutralizing potential, making it an outlier among the other samples in this cluster, which exhibited below-average scavenging activity. In fact, after excluding sample 6 from the analysis, red cluster had significantly lower antioxidant capacity compared to two other cluster. Therefore, in our opinion, the selected phenolics can still be considered as markers of antioxidant activity suitable for the quality control of rowanberries, and they should be suitable for most of the samples.
Additionally, considering the impact of polyphenol proportions on antioxidant synergy [43], the distinctive ratio of TFL, TCHA, and TPA (1:5:15) in sample 6 might be worth further studies to determine if this specific composition might be the cause of the unexpectedly high scavenging potential of the sample.
4. Conclusions
This study contributes to the current understanding of the geographical variability in the phenolic composition and biological activity of S. aucuparia fruits. The results indicate that the overall variation in rowanberries in Poland is generally low to moderate for most of the tested factors, with the exception of flavonoid content. The variability appears to be impacted at least partially by geographic location, which might help explain the conflicting data reported on S. aucuparia fruit composition from different countries or regions [5,10,12,13,14,15,16,17]. Moreover, it highlights the importance of rigorous quality control for rowanberries. To address this, we employed statistical methods to identify eight parameters that are optimal for the effective quality control of rowanberries. By evaluating the content of these selected markers, we were able to differentiate the tested fruits into distinct groups based on their composition and classify the samples as more or less valuable plant materials for functional applications. Importantly, this approach yielded results comparable to those obtained through full phytochemical profiling and its efficiency makes it suitable for routine testing, saving both time and cost.
Supplementary Materials
The following supporting information can be downloaded at: https://www.mdpi.com/article/10.3390/antiox12111967/s1, Table S1: Quantitative profile of individual compounds in the S. aucuparia fruits (mg/g fruits dw). Table S2: Quantitative profile of groups of compounds in the S. aucuparia fruits (mg/g fruits dw).
Author Contributions
Conceptualization, M.R. and M.A.O.; methodology, M.R. and A.O.-J.; formal analysis, M.R. and A.O.-J.; investigation, M.R., A.M. and M.G.; resources, M.R. and M.A.O.; data curation, M.R.; writing—original draft preparation, M.R. and A.O.-J.; writing—review and editing, M.R., A.O.-J. and M.A.O.; visualization, M.R.; supervision, M.A.O.; project administration, M.R.; funding acquisition, M.R. and M.A.O. All authors have read and agreed to the published version of the manuscript.
Funding
This research was financially supported by National Science Centre, Poland through grant No. 2017/27/N/NZ9/02134. In addition, experiments not covered by the above grant (e.g., α-glucosidase activity testing) were supported by the Medical University of Lodz (grant No. 503/3-022-01/503-31-001).
Institutional Review Board Statement
Not applicable.
Informed Consent Statement
Not applicable.
Data Availability Statement
Data are contained within this article.
Acknowledgments
The authors would like to thank the staff of the Department of Pharmacognosy and Molecular Basis of Phytotherapy, Faculty of Pharmacy, Medical University of Warsaw, for enabling access to the UHPLC-MS equipment. Moreover, the authors would like to thank those who contributed to the harvest of the plant material: the staff of the Geopark—Botanical Garden in Kielce; the staff of the Arboretum and Department of Physiography in Bolestraszyce; Judyta Cielecka-Piontek from Department of Pharmacognosy, University of Medical Sciences in Poznań; Grażyna Zgórka from Department of Pharmacognosy with the Medicinal Plant Garden, Medical University of Lublin; Monika Czerwińska from Department of Biochemistry and Pharmacogenomics, Medical University of Warsaw; Daniel Załuski, from the Department of Pharmaceutical Botany and Pharmacognosy, Collegium Medicum Bydgoszcz; Michał Tomczyk from Department of Pharmacognosy, Medical University of Bialystok; Adam Matkowski from Department of Pharmaceutical Biology and Biotechnology, Wroclaw Medical University; Klaudia Michalska from Department of Phytochemistry, Institute of Pharmacology, Polish Academy of Sciences, Cracow; Anna Zakrzewska; Żaneta Molińska; as well as those who help with initial chemical characteristics of plant materials: Mateusz Kałmuk and Karol Dwojak.
Conflicts of Interest
The authors declare no conflict of interest.
References
- Räty, M.; Caudullo, G.; de Rigo, D. Sorbus aucuparia in Europe: Distribution, Habitat, Usage and Threats. In European Atlas of Forest Tree Species; San-Miguel-Ayanz, J., de Rigo, D., Caudullo, G., Houston Durrant, T., Mauri, A., Eds.; Publ. Off. EU: Luxembourg, 2016; pp. 176–177. [Google Scholar]
- Batsatsashvili, K.; Mehdiyeva, N.P.; Fayvush, G.; Kikvidze, Z.; Khutsishvili, M.; Maisaia, I.; Sikharulidze, S.; Tchelidze, D.; Aleksanyan, A.; Alizade, V.M.; et al. Sorbus aucuparia L. Sorbus torminalis (L.) Crantz Rosaceae. In Ethnobotany of the Caucasus; Bussmann, R.W., Ed.; Springer: Cham, Switzerland, 2017; pp. 665–672. ISBN 978-3-319-49411-1. [Google Scholar]
- Zlobin, A.A.; Martinson, E.A.; Litvinets, S.G.; Ovechkina, I.A.; Durnev, E.A.; Ovodova, R.G. Pectin Polysaccharides of Rowan Sorbus aucuparia L. Russ. J. Bioorg. Chem. 2012, 38, 702–706. [Google Scholar] [CrossRef]
- Facciola, S. Cornucopia II: A Source Book of Edible Plants; Kampong Publications: Vista, CA, USA, 1998; ISBN 9780962808722. [Google Scholar]
- Rutkowska, M.; Kolodziejczyk-Czepas, J.; Owczarek, A.; Zakrzewska, A.; Magiera, A.; Olszewska, M.A. Novel Insight into Biological Activity and Phytochemical Composition of Sorbus aucuparia L. Fruits: Fractionated Extracts as Inhibitors of Protein Glycation and Oxidative/Nitrative Damage of Human Plasma Components. Food Res. Int. 2021, 147, 110526. [Google Scholar] [CrossRef]
- Boath, A.S.; Stewart, D.; McDougall, G.J. Berry Components Inhibit α-Glucosidase In Vitro: Synergies between Acarbose and Polyphenols from Black Currant and Rowanberry. Food Chem. 2012, 135, 929–936. [Google Scholar] [CrossRef]
- Grussu, D.; Stewart, D.; McDougall, G.J. Berry Polyphenols Inhibit α-Amylase In Vitro: Identifying Active Components in Rowanberry and Raspberry. J. Agric. Food Chem. 2011, 59, 2324–2331. [Google Scholar] [CrossRef]
- Kähkönen, M.P.; Hopia, A.I.; Heinonen, M. Berry Phenolics and Their Antioxidant Activity. J. Agric. Food Chem. 2001, 49, 4076–4082. [Google Scholar] [CrossRef]
- Mlcek, J.; Rop, O.; Jurikova, T.; Sochor, J.; Fisera, M.; Balla, S.; Baron, M.; Hrabe, J. Bioactive Compounds in Sweet Rowanberry Fruits of Interspecific Rowan Crosses. Cent. Eur. J. Biol. 2014, 9, 1078–1086. [Google Scholar] [CrossRef]
- Kylli, P.; Nohynek, L.; Puupponen-Pimiä, R.; Westerlund-Wikström, B.; McDougall, G.; Stewart, D.; Heinonen, M. Rowanberry Phenolics: Compositional Analysis and Bioactivities. J. Agric. Food Chem. 2010, 58, 11985–11992. [Google Scholar] [CrossRef] [PubMed]
- Olszewska, M.A.; Michel, P. Antioxidant Activity of Inflorescences, Leaves and Fruits of Three Sorbus Species in Relation to Their Polyphenolic Composition. Nat. Prod. Res. 2009, 23, 1507–1521. [Google Scholar] [CrossRef] [PubMed]
- Aladedunye, F.; Matthäus, B. Phenolic Extracts from Sorbus aucuparia (L.) and Malus baccata (L.) Berries: Antioxidant Activity and Performance in Rapeseed Oil during Frying and Storage. Food Chem. 2014, 159, 273–281. [Google Scholar] [CrossRef] [PubMed]
- Bobinaitė, R.; Grootaert, C.; Van Camp, J.; Šarkinas, A.; Liaudanskas, M.; Žvikas, V.; Viškelis, P.; Rimantas Venskutonis, P. Chemical Composition, Antioxidant, Antimicrobial and Antiproliferative Activities of the Extracts Isolated from the Pomace of Rowanberry (Sorbus aucuparia L.). Food Res. Int. 2020, 136, 109310. [Google Scholar] [CrossRef]
- Bujor, A.; Miron, A.; Luca, S.V.; Skalicka-Wozniak, K.; Silion, M.; Ancuceanu, R.; Dinu, M.; Girard, C.; Demougeot, C.; Totoson, P. Metabolite Profiling, Arginase Inhibition and Vasorelaxant Activity of Cornus mas, Sorbus aucuparia and Viburnum opulus Fruit Extracts. Food Chem. Toxicol. 2019, 133, 110764. [Google Scholar] [CrossRef]
- Gil-Izquierdo, A.; Mellenthin, A. Identification and Quantitation of Flavonols in Rowanberry (Sorbus aucuparia L.) Juice. Eur. Food Res. Technol. 2001, 213, 12–17. [Google Scholar] [CrossRef]
- Mikulic-Petkovsek, M.; Krska, B.; Kiprovski, B.; Veberic, R. Bioactive Components and Antioxidant Capacity of Fruits from Nine Sorbus Genotypes. J. Food Sci. 2017, 82, 647–658. [Google Scholar] [CrossRef]
- Zymone, K.; Raudone, L.; Raudonis, R.; Marksa, M.; Ivanauskas, L.; Janulis, V. Phytochemical Profiling of Fruit Powders of Twenty Sorbus L. Cultivars. Molecules 2018, 23, 2593. [Google Scholar] [CrossRef]
- Sołtys, A.; Galanty, A.; Podolak, I. Ethnopharmacologically Important but Underestimated Genus Sorbus: A Comprehensive Review. Phytochem. Rev. 2020, 19, 491–526. [Google Scholar] [CrossRef]
- Khalid, M.; Saeed-ur-Rahman; Bilal, M.; Huang, D.F. Role of Flavonoids in Plant Interactions with the Environment and against Human Pathogens—A Review. J. Integr. Agric. 2019, 18, 211–230. [Google Scholar] [CrossRef]
- Ncube, B.; Finnie, J.F.; Van Staden, J. Quality from the Field: The Impact of Environmental Factors as Quality Determinants in Medicinal Plants. S. Afr. J. Bot. 2012, 82, 11–20. [Google Scholar] [CrossRef]
- Mierziak, J.; Kostyn, K.; Kulma, A. Flavonoids as Important Molecules of Plant Interactions with the Environment. Molecules 2014, 19, 16240–16265. [Google Scholar] [CrossRef]
- Muyumba, N.W.; Mutombo, S.C.; Sheridan, H.; Nachtergael, A.; Duez, P. Quality Control of Herbal Drugs and Preparations: The Methods of Analysis, Their Relevance and Applications. Talanta Open 2021, 4, 100070. [Google Scholar] [CrossRef]
- Ożarowski, A.; Jaroniewski, W. Rośliny Lecznicze i Ich Praktyczne Zastosowanie; Wydawnictwo Instytutu Wydawniczego Związków Zawodowych: Warszawa, Poland, 1987; pp. 179–180. [Google Scholar]
- Rocznik Meteorologiczny. Instytut Meteorologii i Gospodarki Wodnej—Państwowy Instytut Badawczy; Szokalska, A., Ed.; Biuro Badań nad Klimatem Polski, Wydział Baz Danych: Warszawa, Poland, 2019; pp. 1–358. [Google Scholar]
- Olszewska, M.A.; Presler, A.; Michel, P. Profiling of Phenolic Compounds and Antioxidant Activity of Dry Extracts from the Selected Sorbus Species. Molecules 2012, 17, 3093–3113. [Google Scholar] [CrossRef]
- Fu, R.; Zhang, Y.; Guo, Y.; Liu, F.; Chen, F. Determination of Phenolic Contents and Antioxidant Activities of Extracts of Jatropha curcas L. Seed Shell, a by-Product, a New Source of Natural Antioxidant. Ind. Crops Prod. 2014, 58, 265–270. [Google Scholar] [CrossRef]
- Marchelak, A.; Owczarek, A.; Rutkowska, M.; Michel, P.; Kolodziejczyk-Czepas, J.; Nowak, P.; Olszewska, M.A. New Insights into Antioxidant Activity of Prunus spinosa Flowers: Extracts, Model Polyphenols and Their Phenolic Metabolites in Plasma towards Multiple in Vivo-Relevant Oxidants. Phytochem. Lett. 2019, 30, 288–295. [Google Scholar] [CrossRef]
- Kim, Y.-M.; Jeong, Y.-K.; Wang, M.-H.; Lee, W.-Y.; Rhee, H.-I. Inhibitory Effect of Pine Extract on α-Glucosidase Activity and Postprandial Hyperglycemia. Nutrition 2005, 21, 756–761. [Google Scholar] [CrossRef]
- Clifford, M.N.; Johnston, K.L.; Knight, S.; Kuhnert, N. Hierarchical Scheme for LC-MSn Identification of Chlorogenic Acids. J. Agric. Food Chem. 2003, 51, 2900–2911. [Google Scholar] [CrossRef]
- Clifford, M.N.; Knight, S.; Kuhnert, N. Discriminating between the Six Isomers of Dicaffeoylquinic Acid by LC-MS N. J. Agric. Food Chem. 2005, 53, 3821–3832. [Google Scholar] [CrossRef]
- Jaiswal, R.; Kuhnert, N. Identification and Characterization of Five New Classes of Chlorogenic Acids in Burdock (Arctium lappa L.) Roots by Liquid Chromatography/Tandem Mass Spectrometry. Food Funct. 2011, 2, 63–71. [Google Scholar] [CrossRef]
- Wu, Z.-J.; Ma, X.-L.; Fang, D.-M.; Qi, H.-Y.; Ren, W.-J.; Zhang, G.-L. Analysis of Caffeic Acid Derivatives from Osmanthus yunnanensis Using Electrospray Ionization Quadrupole Time-of-Flight Mass Spectrometry. Eur. J. Mass Spectrom. 2009, 15, 415–429. [Google Scholar] [CrossRef]
- Šavikin, K.P.; Zdunić, G.M.; Krstić-Milošević, D.B.; Šircelj, H.J.; Stešević, D.D.; Pljevljakušić, D.S. Sorbus aucuparia and Sorbus aria as a Source of Antioxidant Phenolics, Tocopherols, and Pigments. Chem. Biodivers. 2017, 14, e1700329. [Google Scholar] [CrossRef]
- Poljak, I.; Vahčić, N.; Liber, Z.; Tumpa, K.; Pintar, V.; Zegnal, I.; Vidaković, A.; Valković, B.; Kajba, D.; Idžojtić, M. Morphological and Chemical Diversity and Antioxidant Capacity of the Service Tree (Sorbus domestica L.) Fruits from Two Eco-geographical Regions. Plants 2021, 10, 1691. [Google Scholar] [CrossRef]
- Rutkowska, M.; Dubicka, M.; Olszewska, M.A. Comparison of Phenolic Profile and in Vitro Antioxidant Capacity of Sorbus domestica L. Leaf Samples from Poland and Croatia. Acta Biol. Cracoviensia Ser. Bot. 2019, 61, 19–29. [Google Scholar] [CrossRef]
- Popović, Z.; Matić, R.; Bajić-Ljubičić, J.; Tešević, V.; Bojović, S. Geographic Variability of Selected Phenolic Compounds in Fresh Berries of Two Cornus Species. Trees—Struct. Funct. 2018, 32, 203–214. [Google Scholar] [CrossRef]
- Mattila, P.H.; Hellström, J.; Karhu, S.; Pihlava, J.M.; Veteläinen, M. High Variability in Flavonoid Contents and Composition between Different North-European Currant (Ribes spp.) Varieties. Food Chem. 2016, 204, 14–20. [Google Scholar] [CrossRef]
- Alirezalu, A.; Salehi, P.; Ahmadi, N.; Sonboli, A.; Aceto, S.; Maleki, H.H.; Ayyari, M. Flavonoids Profile and Antioxidant Activity in Flowers and Leaves of Hawthorn Species (Crataegus spp.) from Different Regions of Iran. Int. J. Food Prop. 2018, 21, 452–470. [Google Scholar] [CrossRef]
- Falcone Ferreyra, M.L.; Rius, S.P.; Casati, P. Flavonoids: Biosynthesis, Biological Functions, and Biotechnological Applications. Front. Plant Sci. 2012, 3, 222. [Google Scholar] [CrossRef] [PubMed]
- Zoratti, L.; Karppinen, K.; Escobar, A.L.; Häggman, H.; Jaakola, L. Light-Controlled Flavonoid Biosynthesis in Fruits. Front. Plant Sci. 2014, 5, 534. [Google Scholar] [CrossRef]
- Prinsloo, G.; Nogemane, N. The Effects of Season and Water Availability on Chemical Composition, Secondary Metabolites and Biological Activity in Plants. Phytochem. Rev. 2018, 17, 889–902. [Google Scholar] [CrossRef]
- Šamec, D.; Karalija, E.; Šola, I.; Vujčić Bok, V.; Salopek-Sondi, B. The Role of Polyphenols in Abiotic Stress Response: The Influence of Molecular Structure. Plants 2021, 10, 118. [Google Scholar] [CrossRef] [PubMed]
- Downey, M.O.; Harvey, J.S.; Robinson, S.P. The Effect of Bunch Shading on Berry Development and Flavonoid Accumulation in Shiraz Grapes. Aust. J. Grape Wine Res. 2004, 10, 55–73. [Google Scholar] [CrossRef]
- Engwa, G.A. Free Radicals and the Role of Plant Phytochemicals as Antioxidants Against Oxidative Stress-Related Diseases. Phytochem.—Source Antioxid. Role Dis. Prev. 2018, 7, 49–74. [Google Scholar] [CrossRef]
- Lipinski, B. Hydroxyl Radical and Its Scavengers in Health and Disease. Oxid. Med. Cell. Longev. 2011, 2011, 809696. [Google Scholar] [CrossRef]
- Hasbal, G.; Yilmaz Ozden, T.; Can, A. In Vitro Antidiabetic Activities of Two Sorbus Species. Eur. J. Biol. 2017, 76, 57–60. [Google Scholar] [CrossRef]
- Wei, J.; Zhang, G.; Zhang, X.; Gao, J.; Zhou, Z.; Fan, J. Polyphenols from Sorbus aucuparia Ameliorate Insulin Resistance and Metabolic Disorders in Diabetic Mice. Curr. Top. Nutraceutical Res. 2016, 14, 227–233. [Google Scholar]
- Rutkowska, M.; Olszewska, M.A.; Kolodziejczyk-Czepas, J.; Nowak, P.; Owczarek, A. Sorbus domestica Leaf Extracts and Their Activity Markers: Antioxidant Potential and Synergy Effects in Scavenging Assays of Multiple Oxidants. Molecules 2019, 24, 2289. [Google Scholar] [CrossRef]
- Kundzewicz, Z.W.; Matczak, P. Climate Change Regional Review: Poland. WIREs Clim. Change 2012, 3, 297–311. [Google Scholar] [CrossRef]
- Zhang, B.; Xia, T.; Duan, W.; Zhang, Z.; Li, Y.; Fang, B.; Xia, M.; Wang, M. Effects of Organic Acids, Amino Acids and Phenolic Compounds on Antioxidant Characteristic of Zhenjiang Aromatic Vinegar. Molecules 2019, 24, 3799. [Google Scholar] [CrossRef] [PubMed]
Disclaimer/Publisher’s Note: The statements, opinions and data contained in all publications are solely those of the individual author(s) and contributor(s) and not of MDPI and/or the editor(s). MDPI and/or the editor(s) disclaim responsibility for any injury to people or property resulting from any ideas, methods, instructions or products referred to in the content. |
© 2023 by the authors. Licensee MDPI, Basel, Switzerland. This article is an open access article distributed under the terms and conditions of the Creative Commons Attribution (CC BY) license (https://creativecommons.org/licenses/by/4.0/).