Author Contributions
Conceptualization, J.F.-L. and M.C.A.; methodology, C.A.-V., R.M.-B., S.L.-G., A.V.-P. and G.B.; writing—original draft preparation, C.A.-V., R.M.-B., S.L.-G., M.C.A. and J.F.-L.; writing—review and editing, C.A.-V., R.M.-B., S.L.-G., G.B., M.Q.-V., T.A.-Q., Á.V.-V., M.C.A. and J.F.-L.; supervision, J.F.-L. and M.C.A.; project administration, J.F.-L. and M.C.A.; funding acquisition, Á.V.-V., M.C.A. and J.F.-L. All authors have read and agreed to the published version of the manuscript.
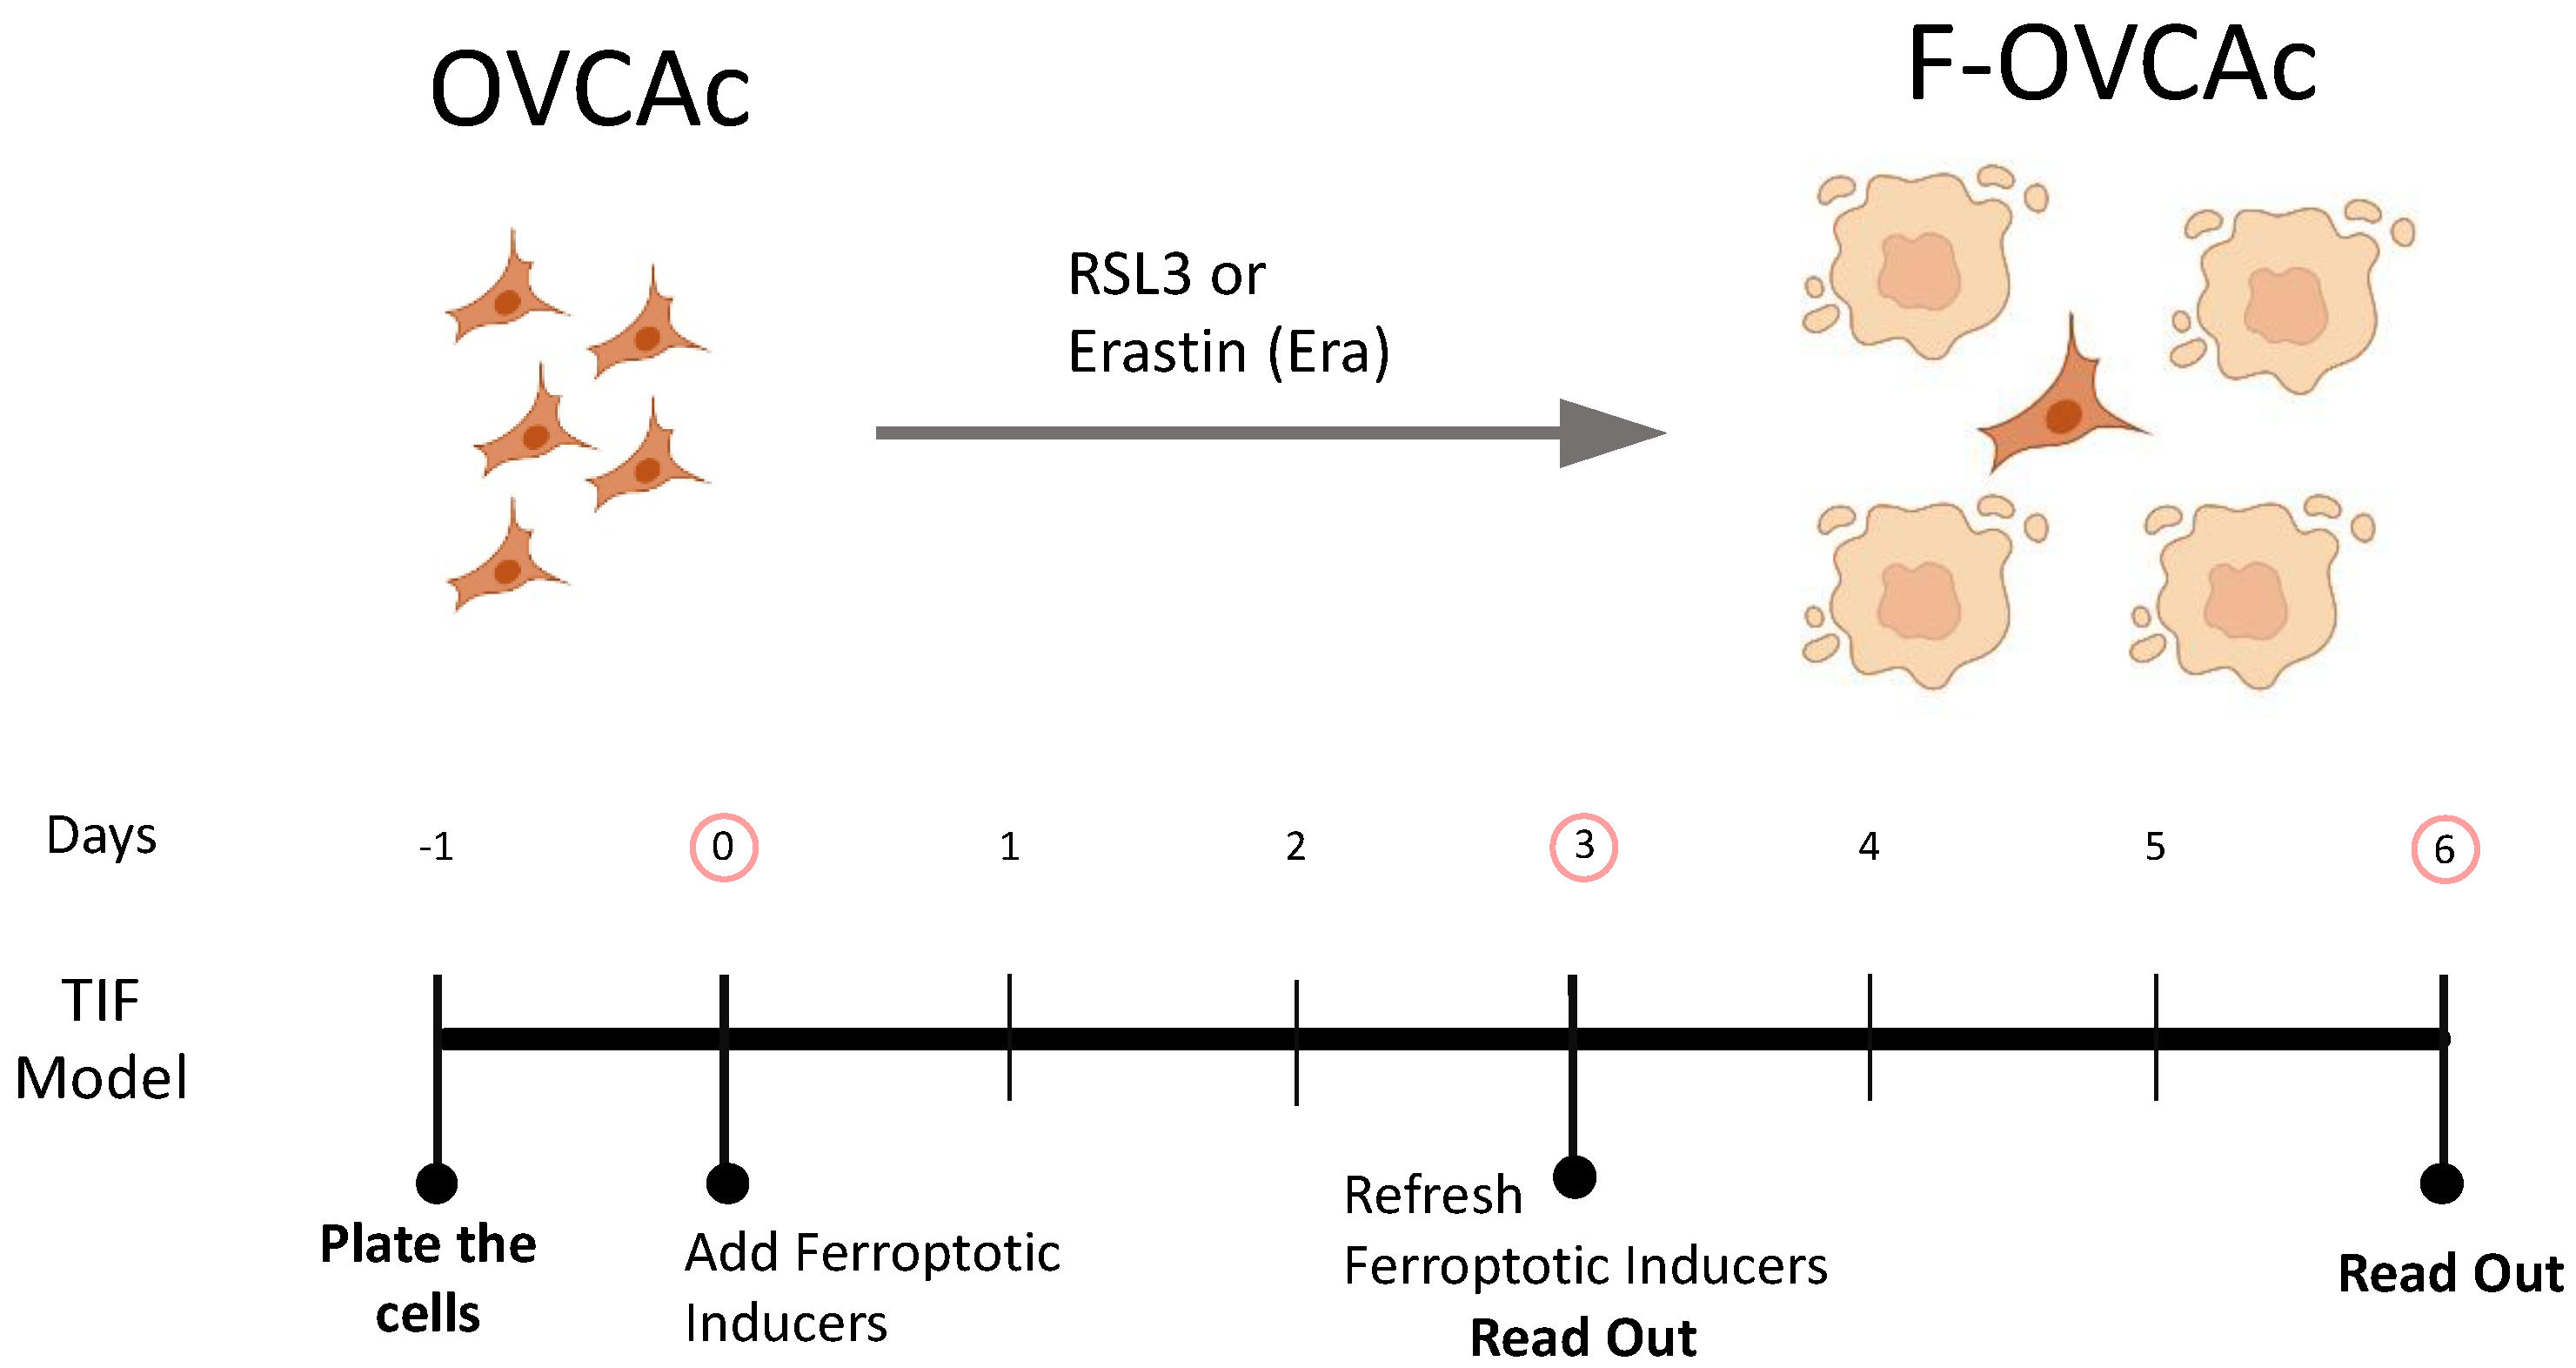
Figure 1.
Schematic representation of ferroptosis induction in OVCAc. OVCAc: epithelial ovarian cancer cells; TIF: Therapy-induced ferroptosis; F-OVCAc: Ferroptotic Epithelial ovarian cancer cells.
Figure 1.
Schematic representation of ferroptosis induction in OVCAc. OVCAc: epithelial ovarian cancer cells; TIF: Therapy-induced ferroptosis; F-OVCAc: Ferroptotic Epithelial ovarian cancer cells.
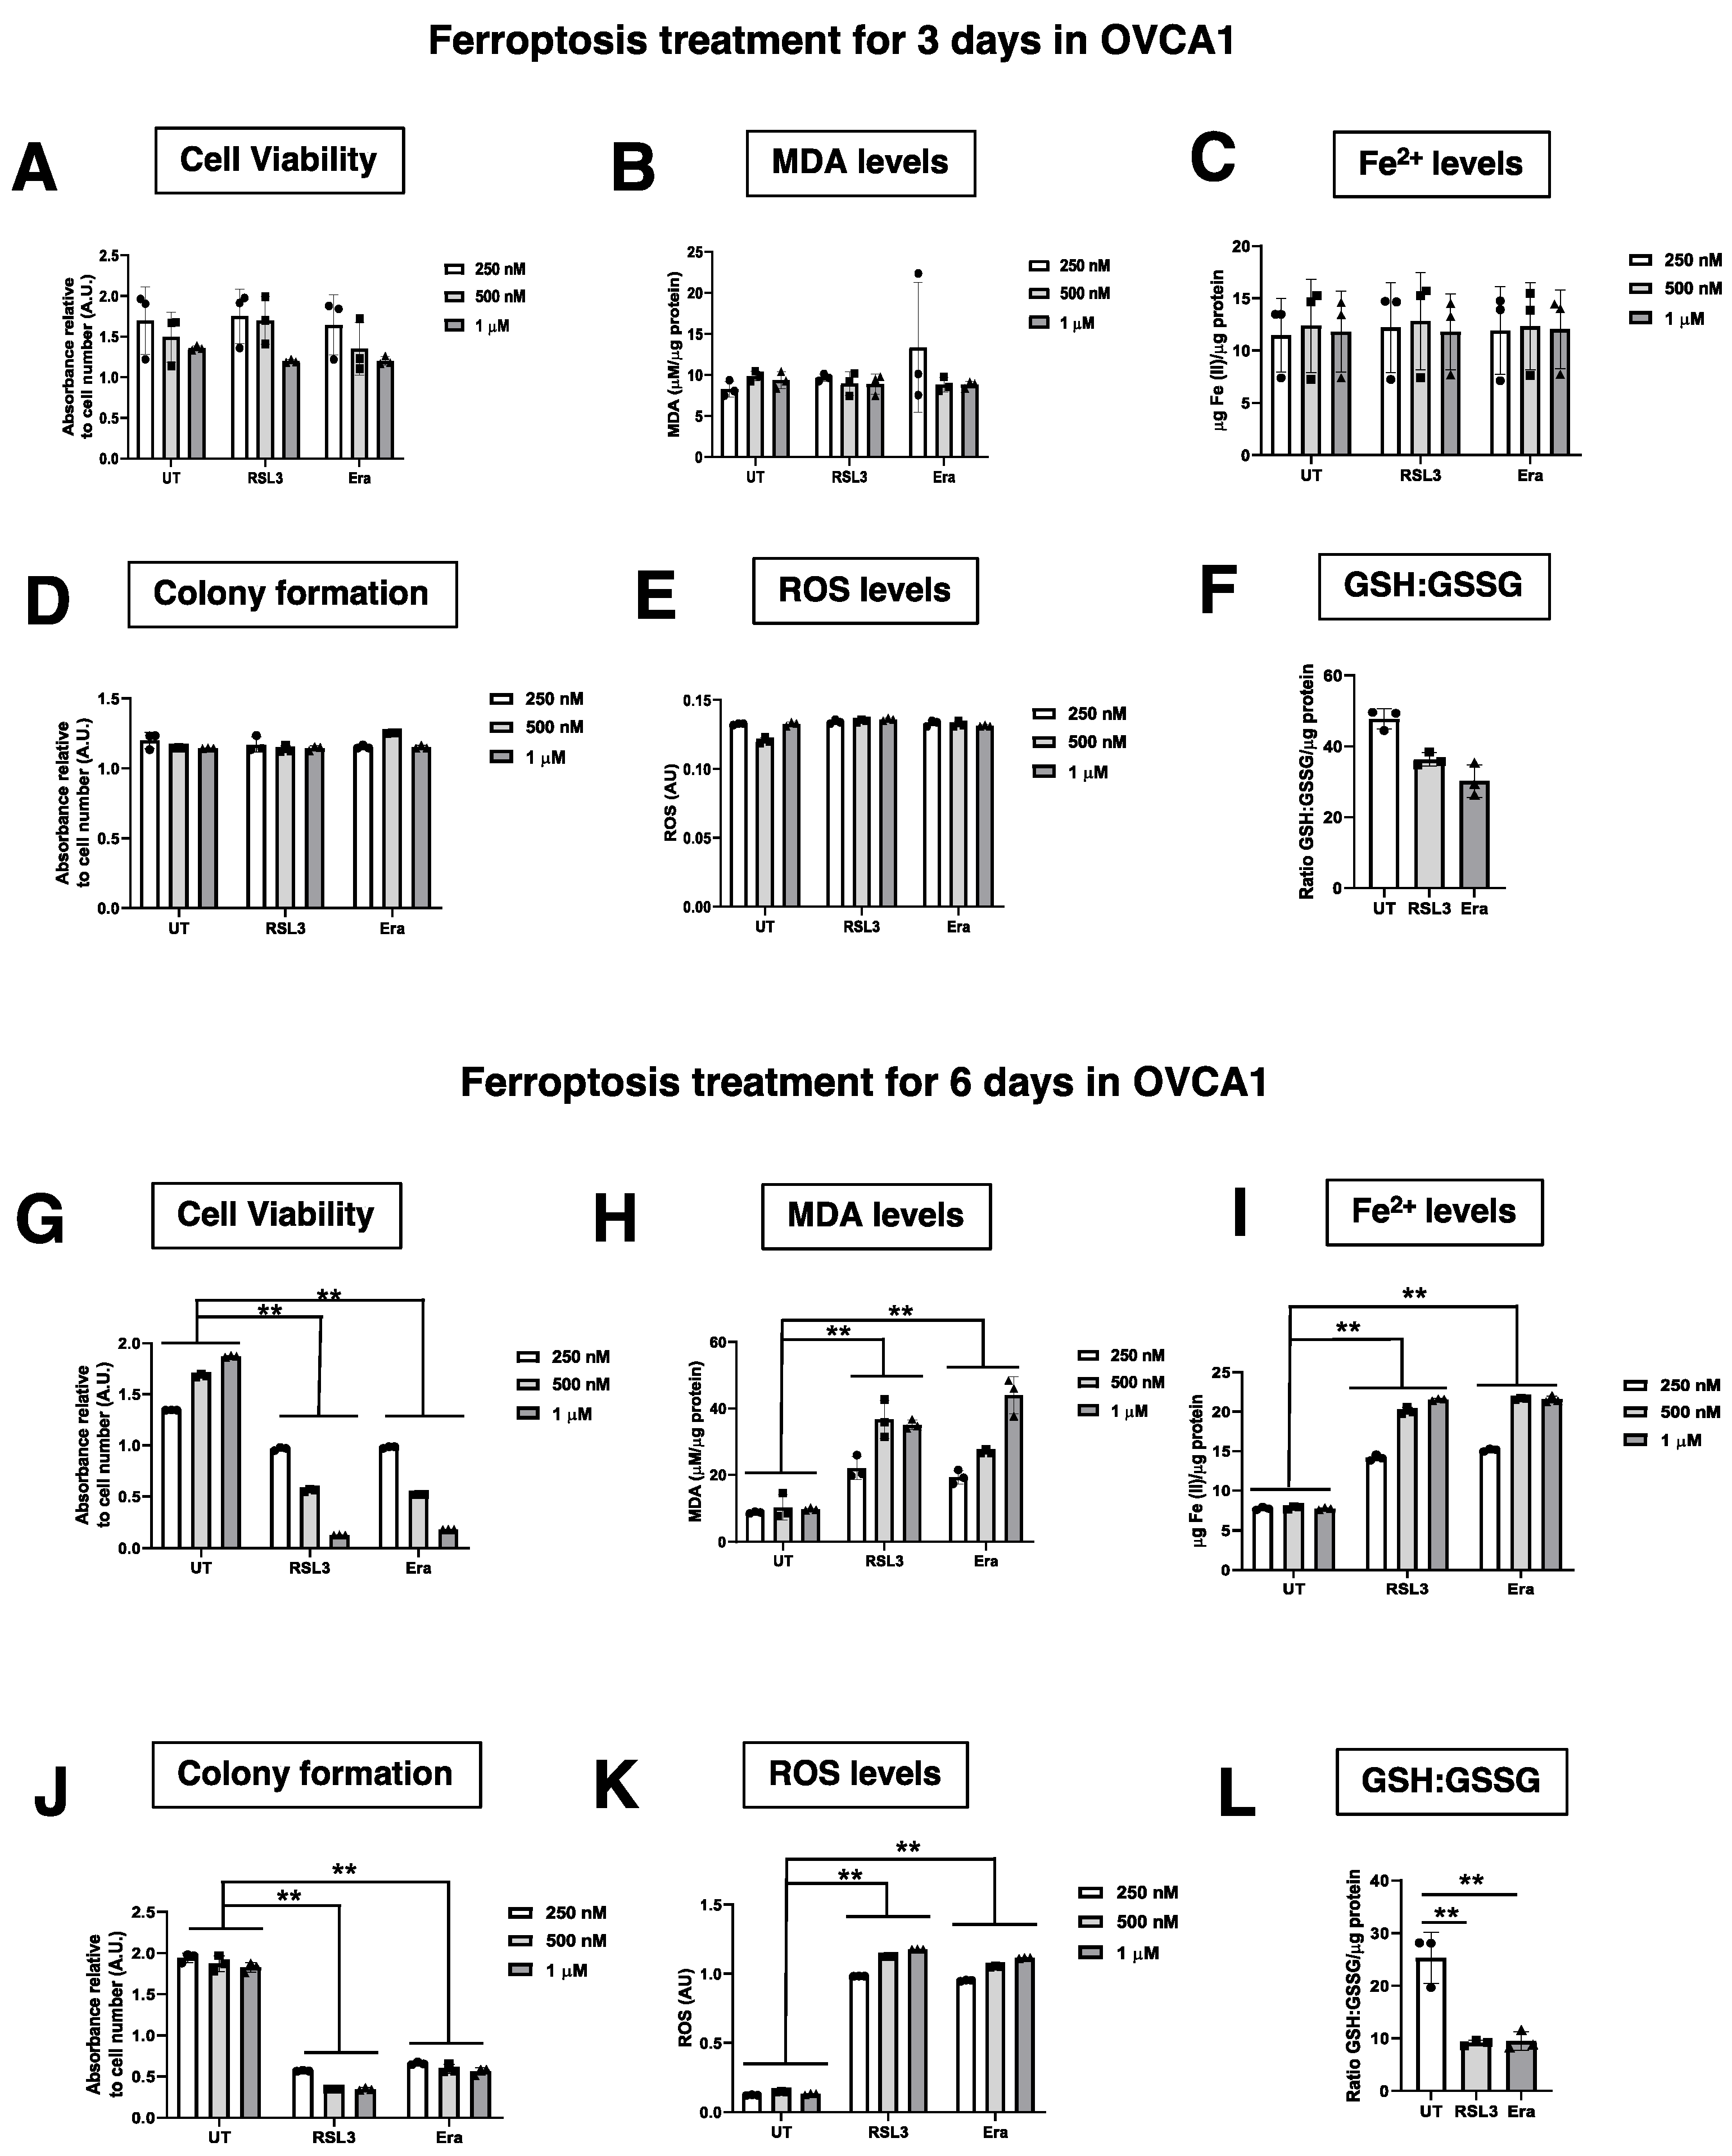
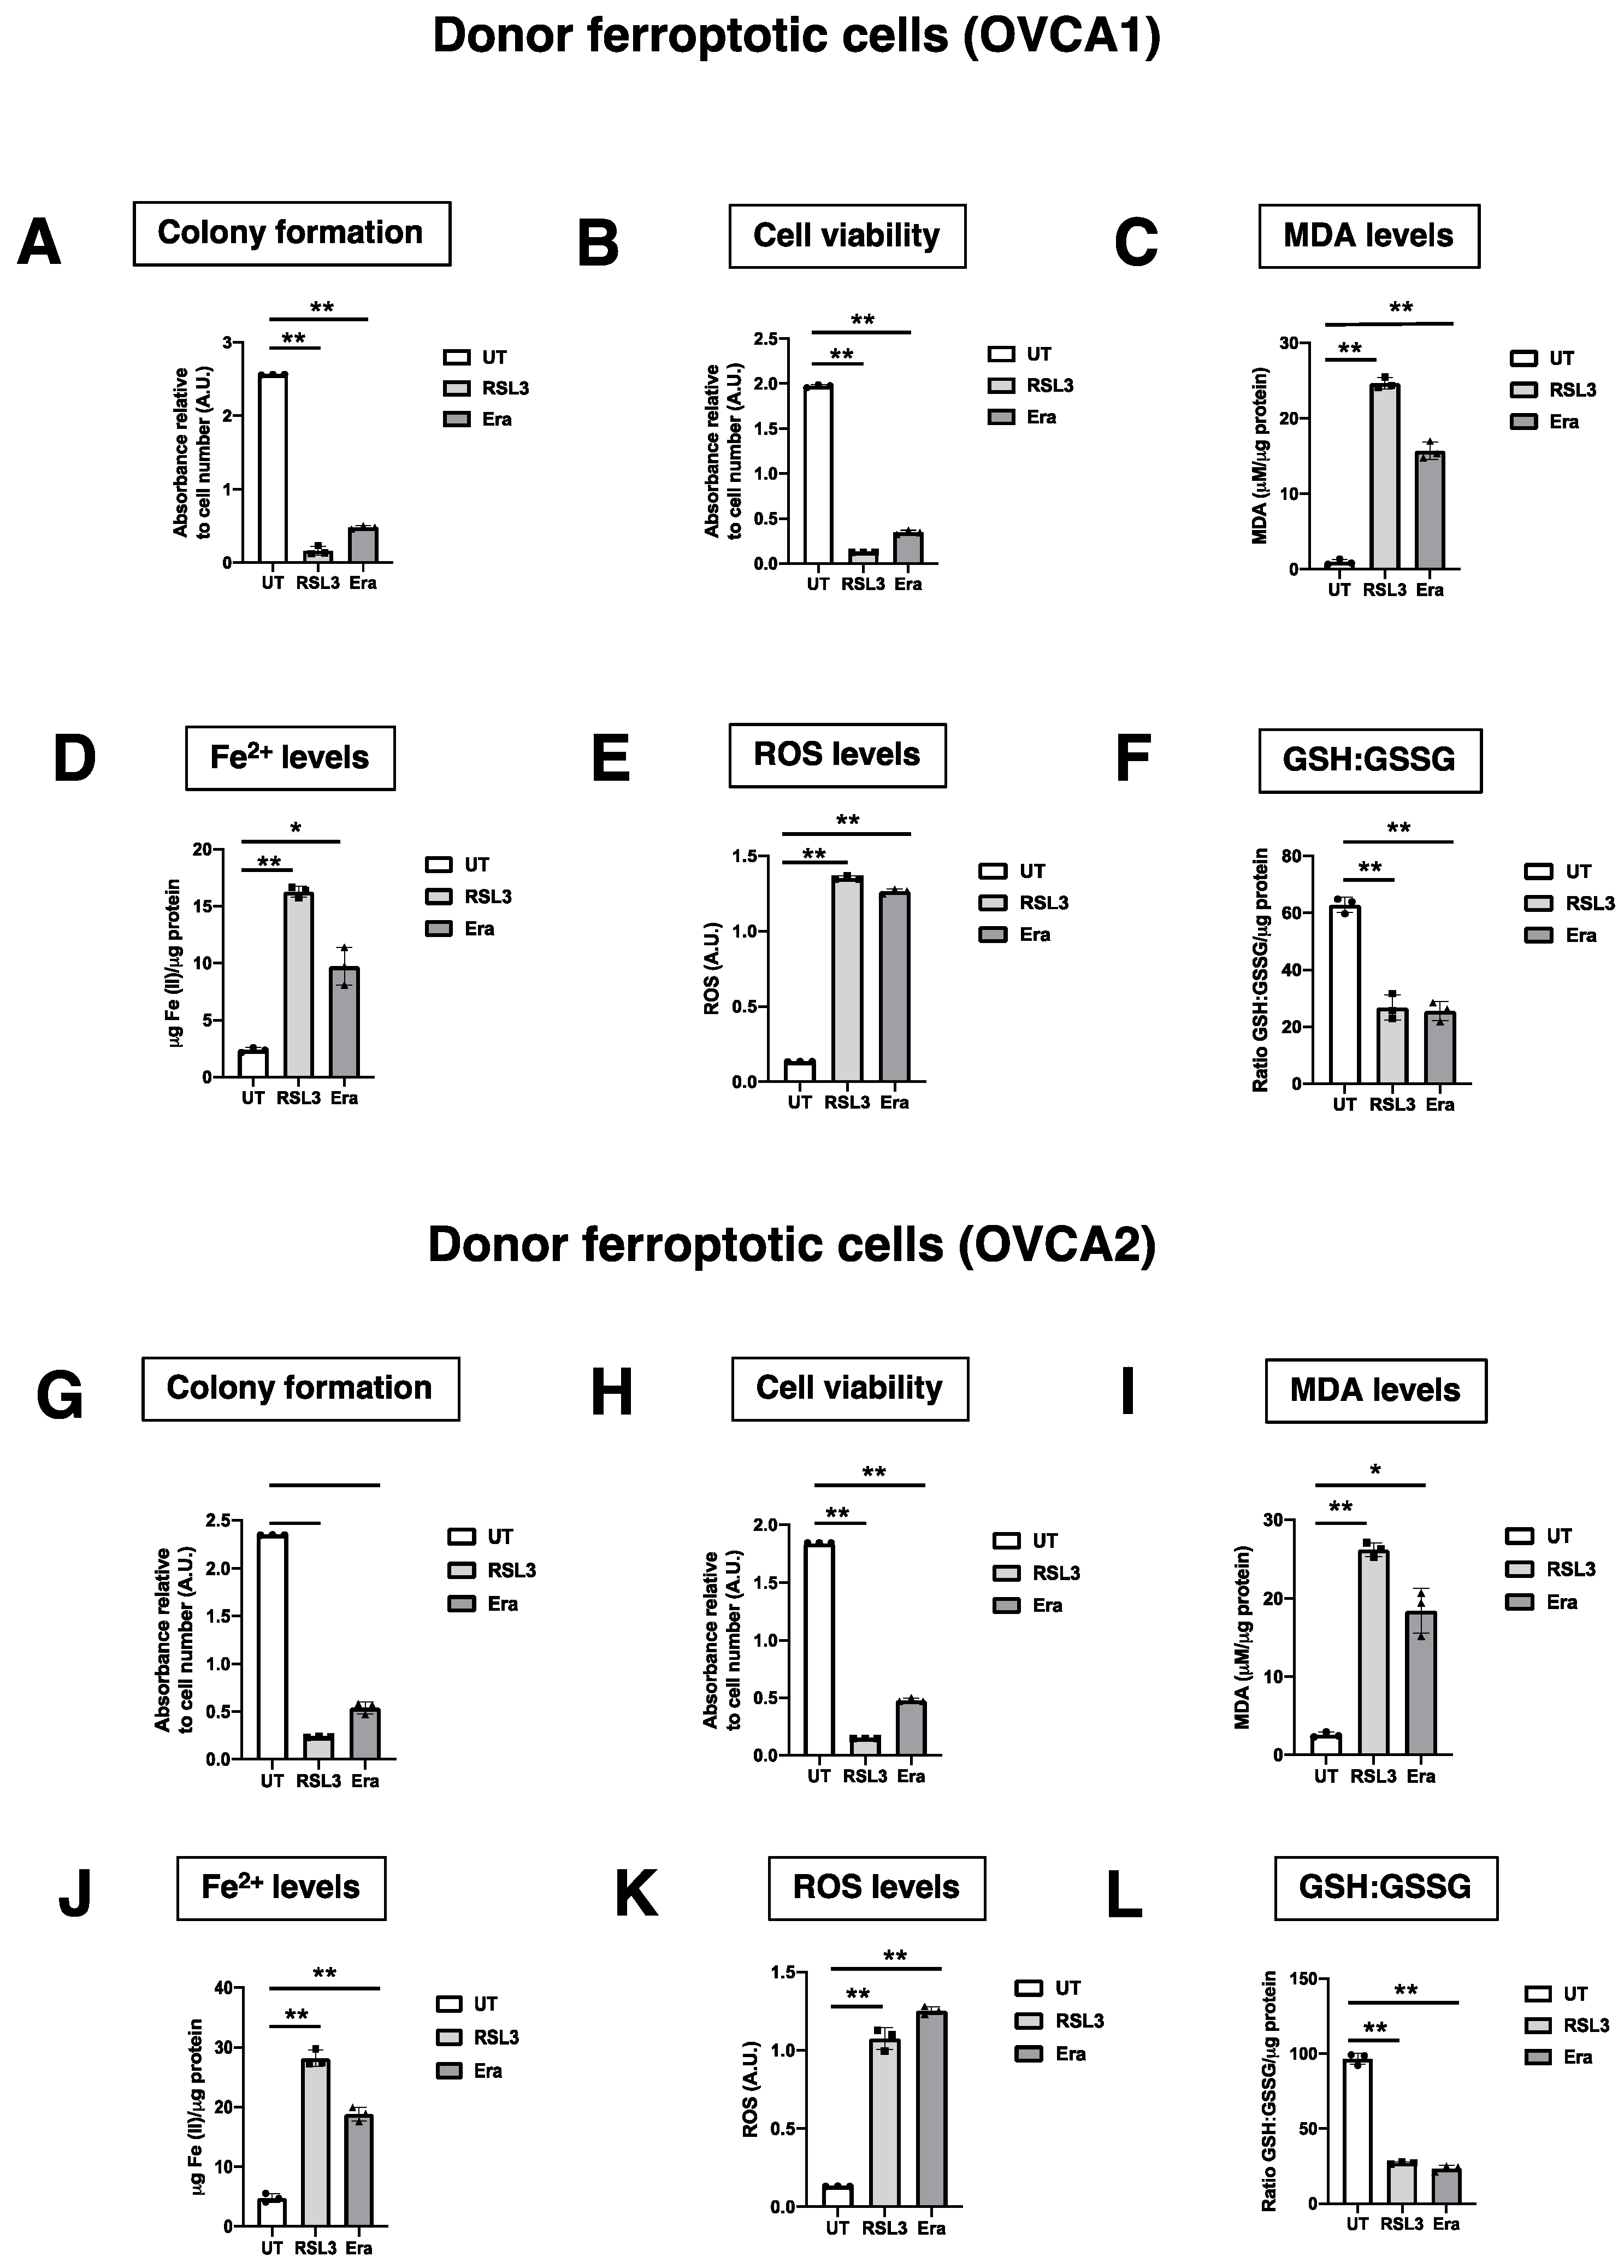
Figure 2.
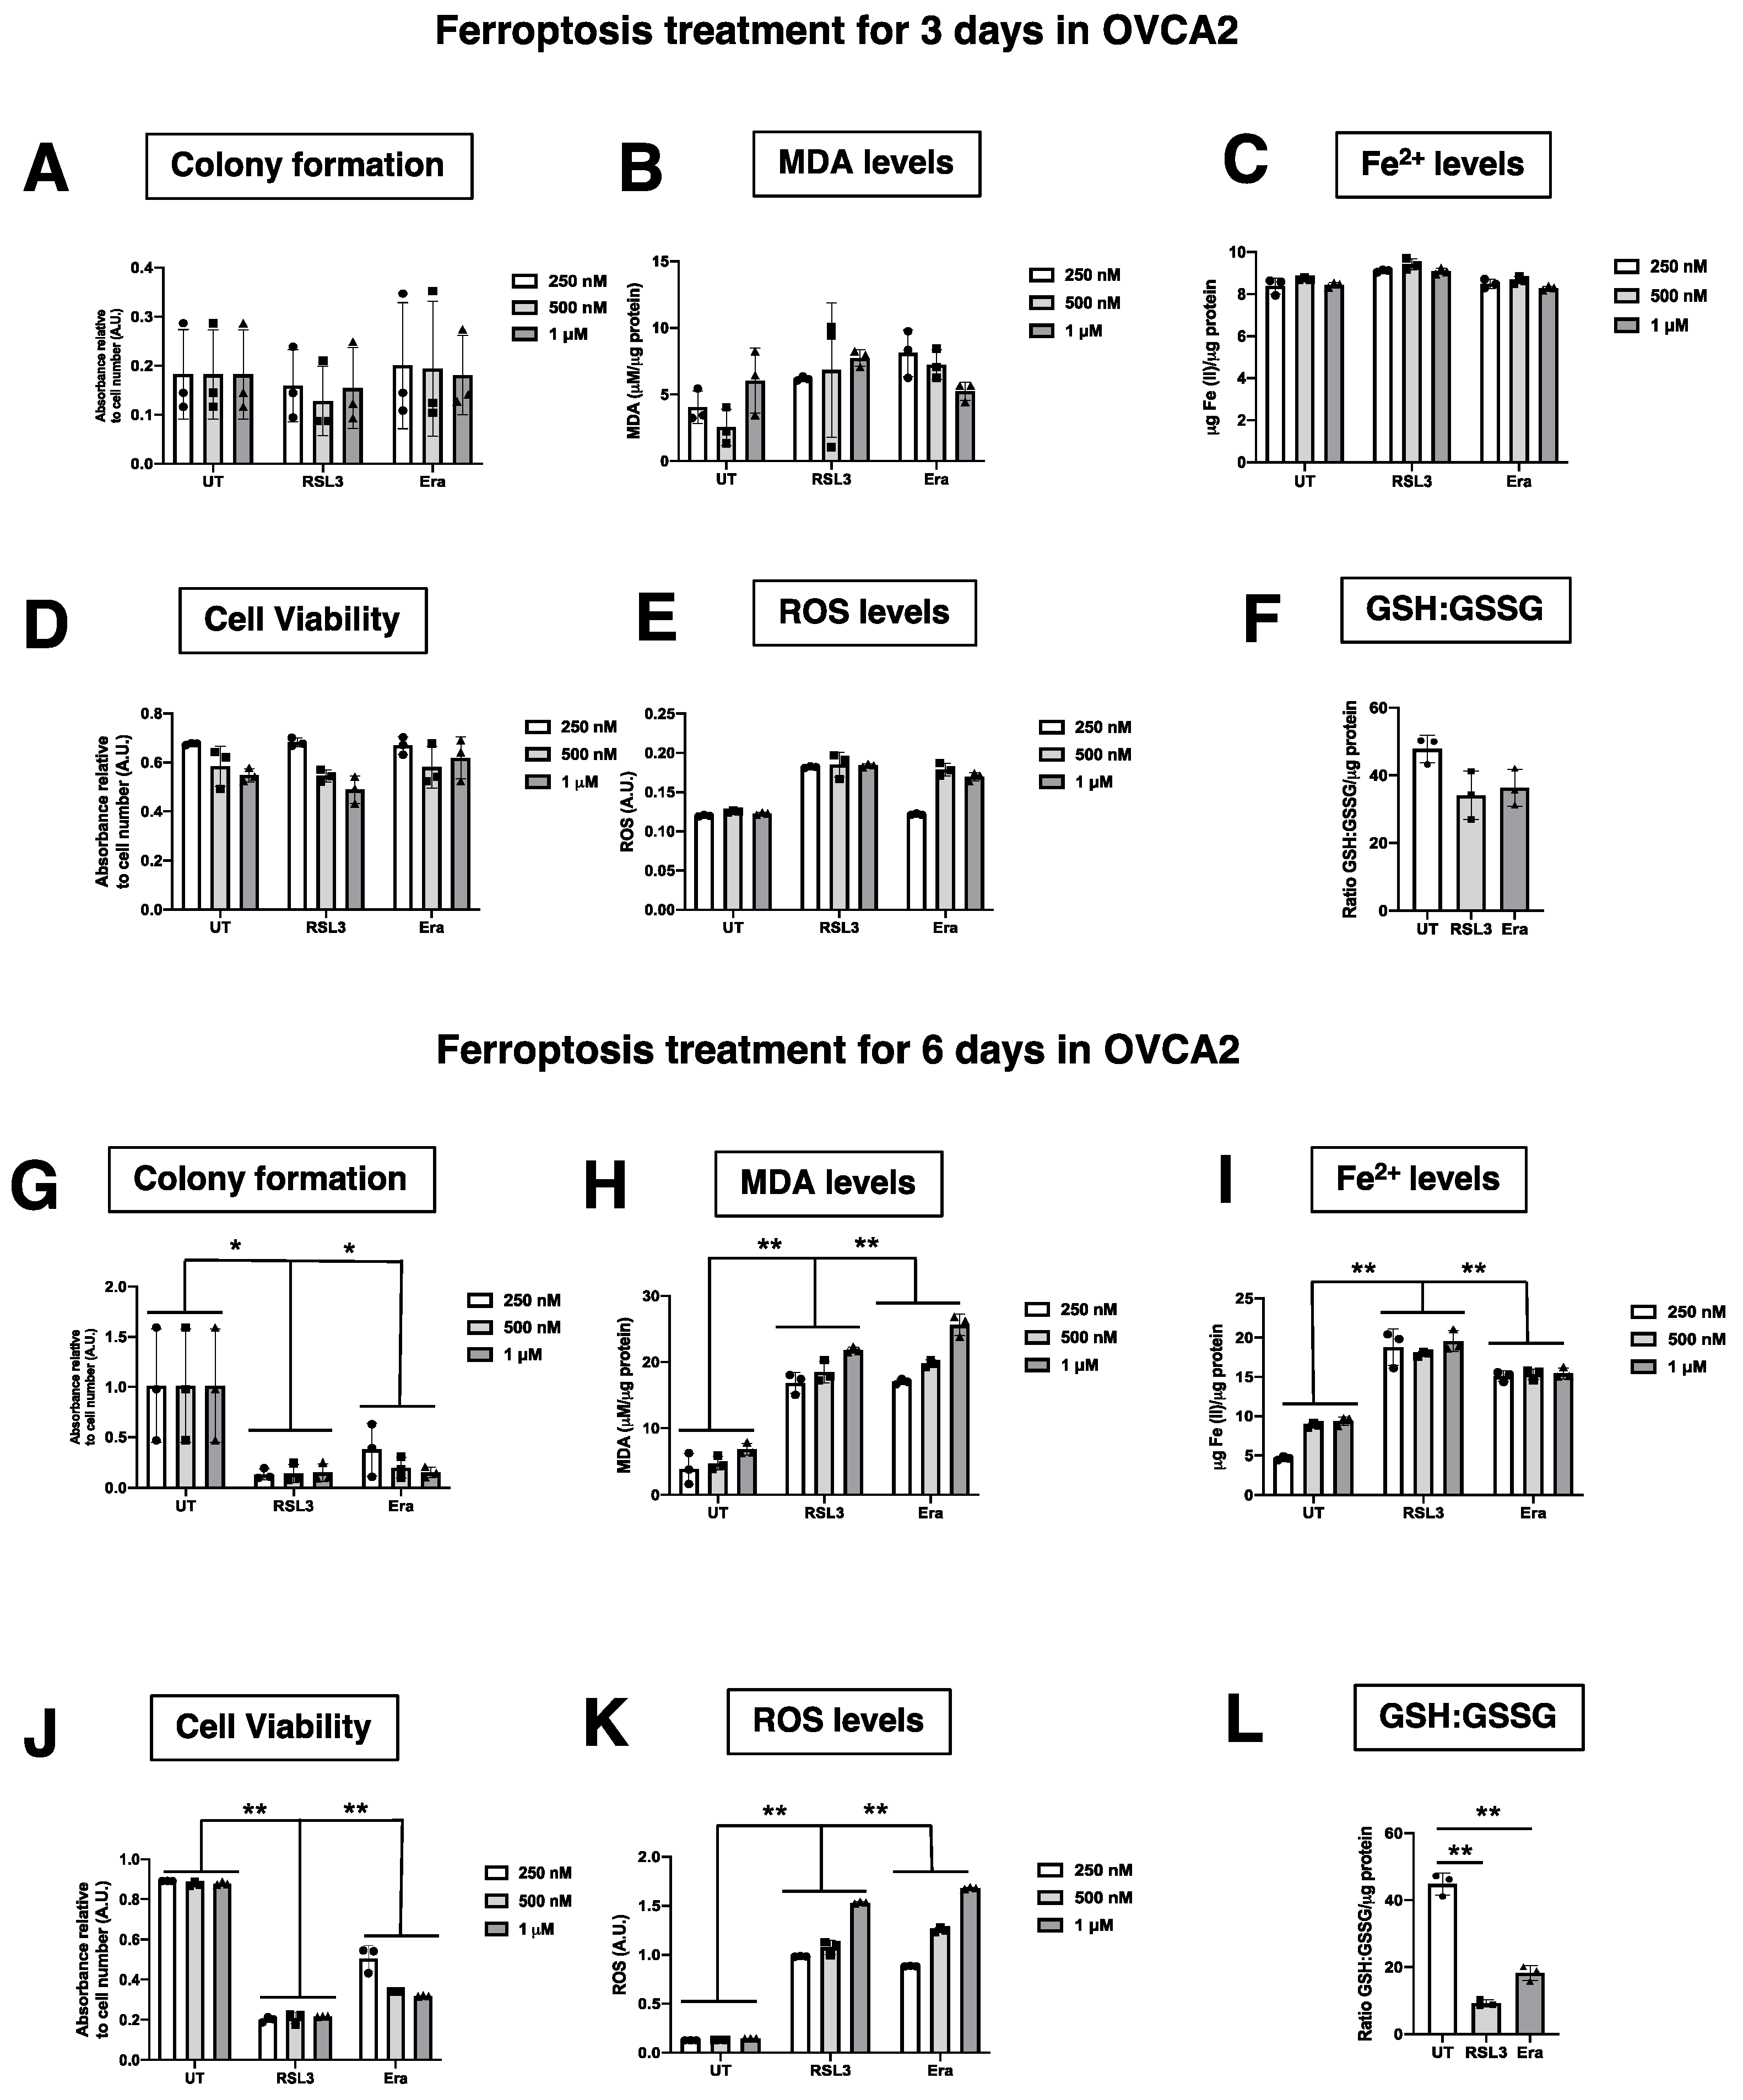
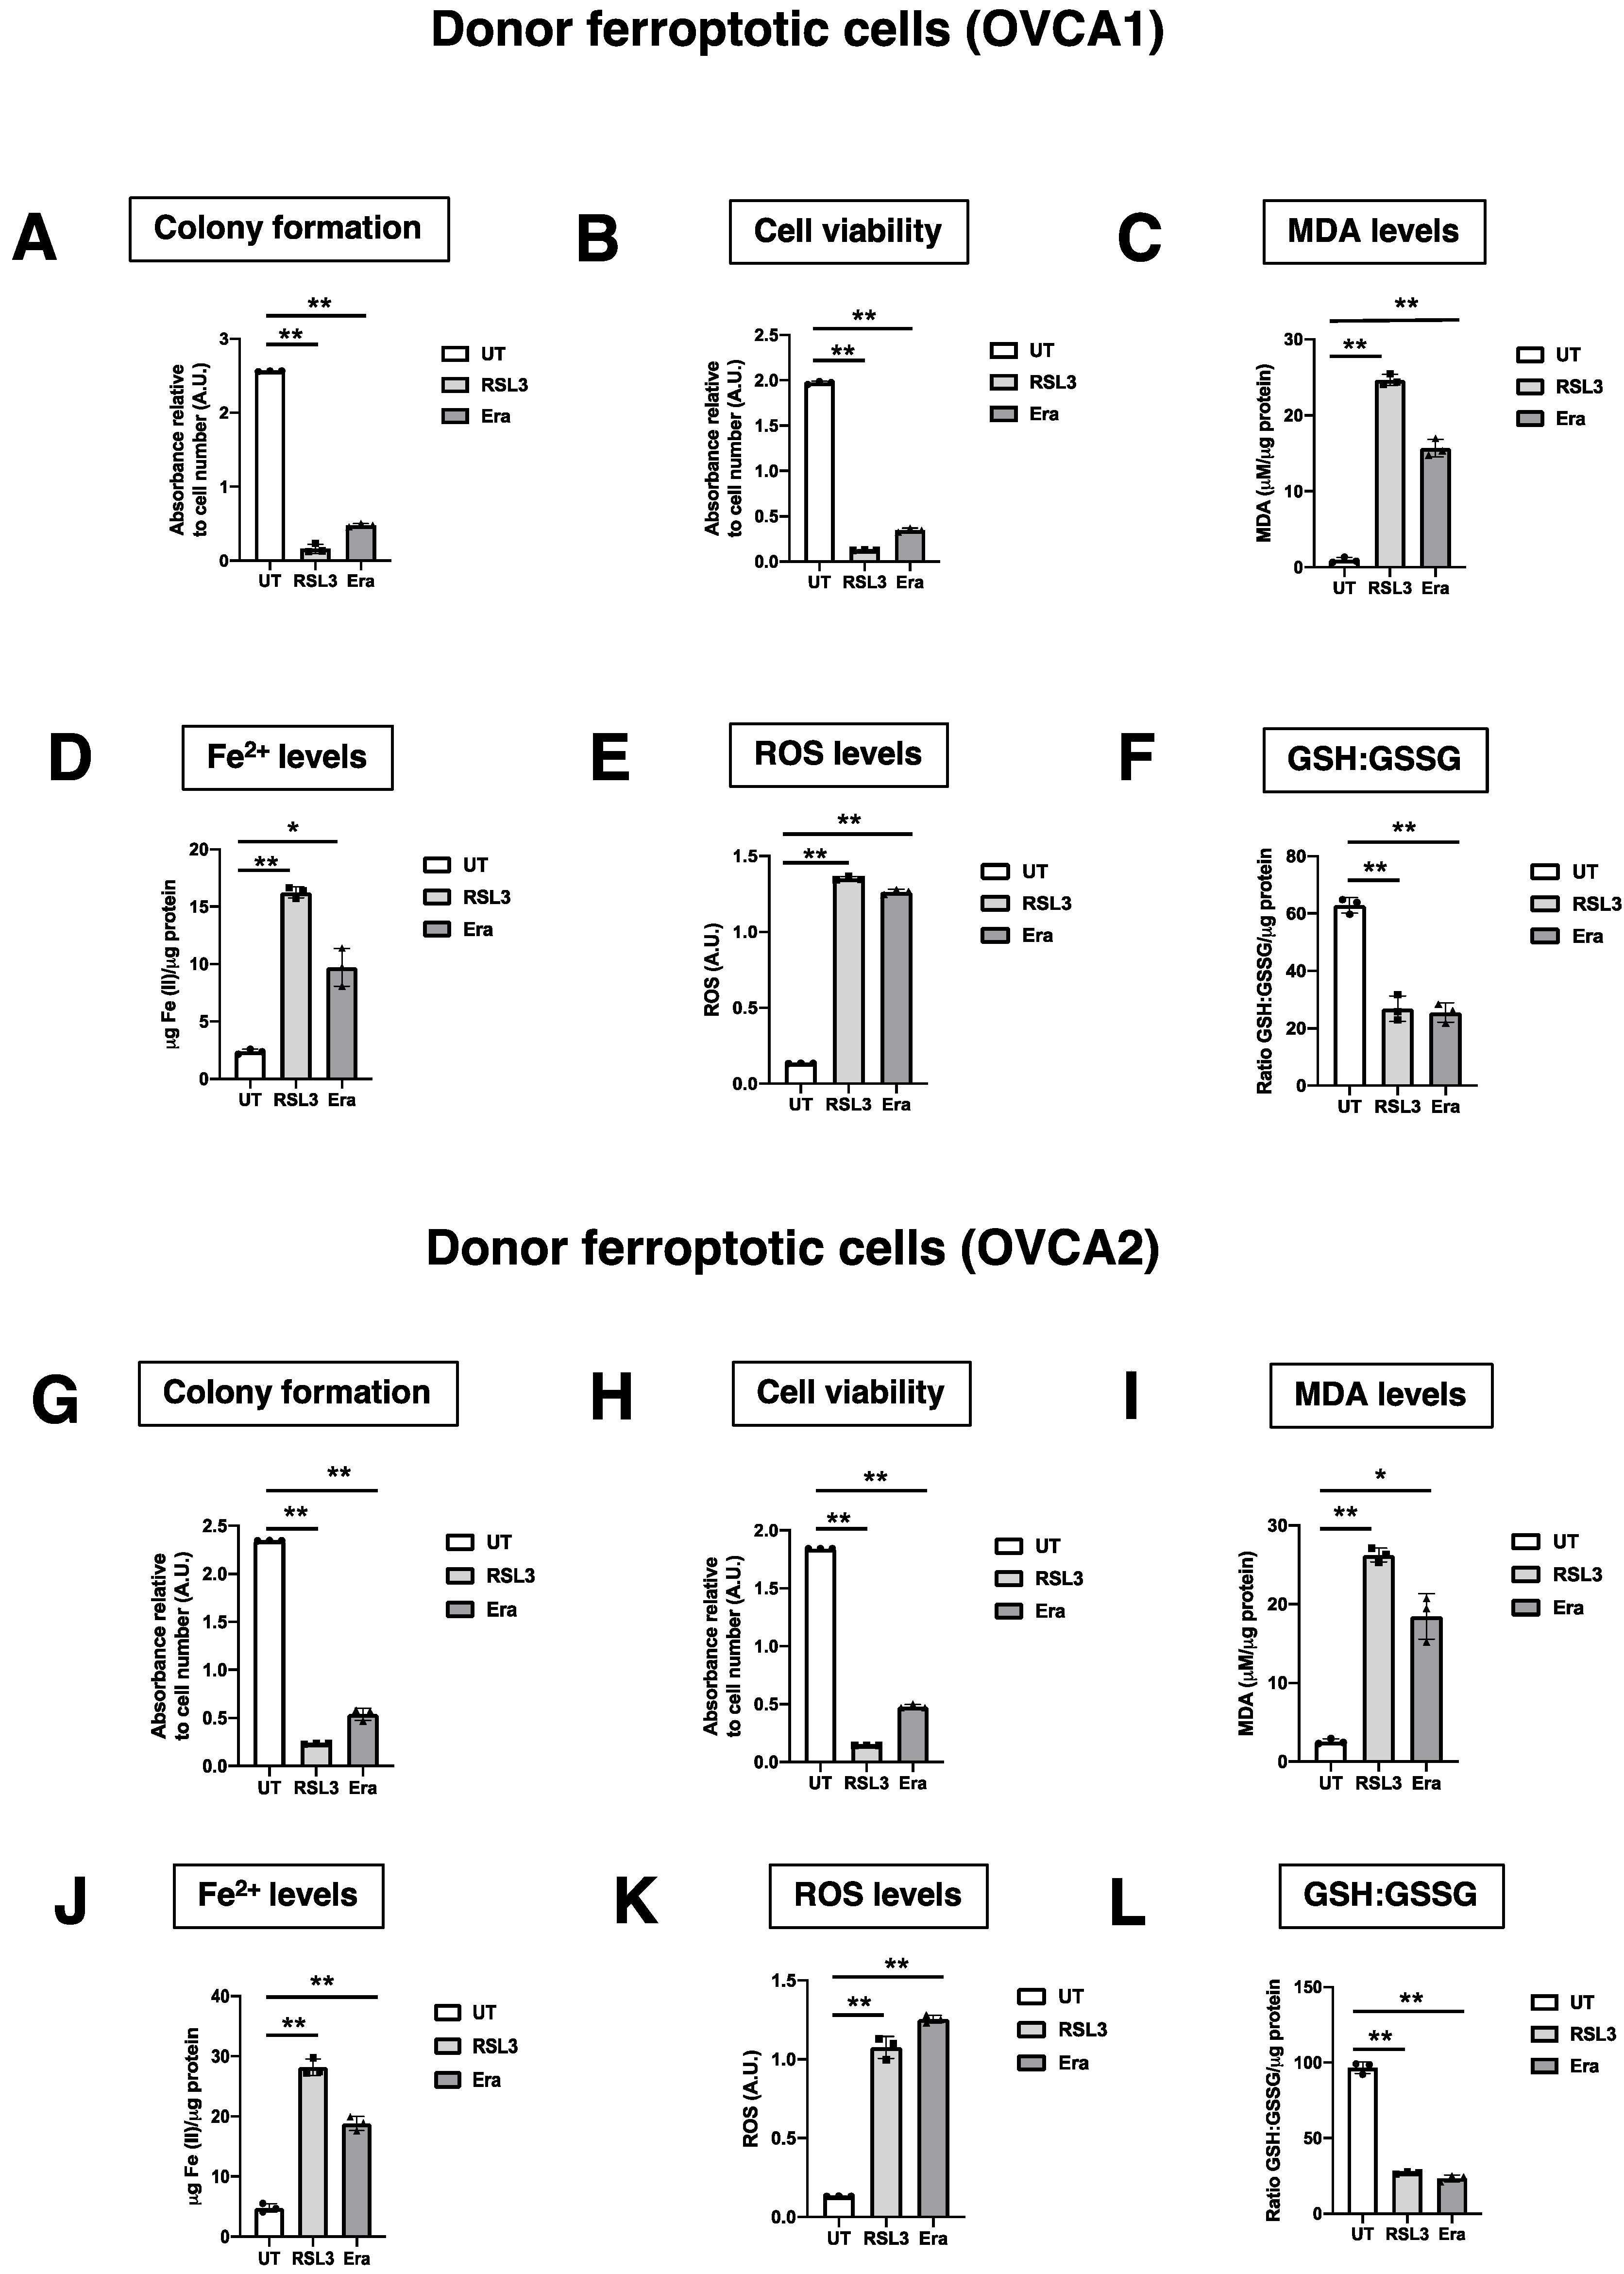
Evaluation of ferroptosis induction in OVCAc. (A) Histogram of cell viability in OVCAc treated with several concentrations (250 nM, 500 nM and 1 µM) of ferroptotic inducers ((1S,3R)-RSL3 (RSL3) and Erastin (Era)) for 3 days measured by MTT assay in OVCA1; (B) Histogram of Malondialdehyde (MDA) levels in OVCAc treated with several concentrations (250 nM, 500 nM and 1 µM) of ferroptotic inducers ((1S,3R)-RSL3 (RSL3) and Erastin (Era)) for 3 days in OVCA1; (C) Histogram of Iron (II) (Fe2+) levels in OVCAc treated with several concentrations (250 nM, 500 nM and 1 µM) of ferroptotic inducers ((1S,3R)-RSL3 (RSL3) and Erastin (Era)) for 3 days; (D) Histogram of colony formation in OVCAc treated with several concentrations (250 nM, 500 nM and 1 µM) of ferroptotic inducers ((1S,3R)-RSL3 (RSL3) and Erastin (Era)) for 3 days in OVCA1; (E) Histogram of reactive oxygen species (ROS) levels in OVCAc treated with several concentrations (250 nM, 500 nM and 1 µM) of ferroptotic inducers ((1S,3R)-RSL3 (RSL3) and Erastin (Era)) for 3 days in OVCA1; (F) Histogram of ratio GSH:GSSG in OVCAc treated with 500 nM of ferroptotic inducers ((1S,3R)-RSL3 (RSL3) and Erastin (Era)) for 3 days in OVCA1; (G) Histogram of cell viability in OVCAc treated with several concentrations (250 nM, 500 nM and 1 µM) of ferroptotic inducers ((1S,3R)-RSL3 (RSL3) and Erastin (Era)) for 6 days measured by MTT assay in OVCA1; (H) Histogram of Malondialdehyde (MDA) levels in OVCAc treated with several concentrations (250 nM, 500 nM and 1 µM) of ferroptotic inducers ((1S,3R)-RSL3 (RSL3) and Erastin (Era)) for 6 days in OVCA1; (I) Histogram of Iron (II) (Fe2+) levels in OVCAc treated with several concentrations (250 nM, 500 nM and 1 µM) of ferroptotic inducers ((1S,3R)-RSL3 (RSL3) and Erastin (Era)) for 6 days in OVCA1; (J) Histogram of colony formation in OVCAc treated with several concentrations (250 nM, 500 nM and 1 µM) of ferroptotic inducers ((1S,3R)-RSL3 (RSL3) and Erastin (Era)) for 6 days in OVCA1; (K) Histogram of reactive oxygen species (ROS) levels in OVCAc treated with several concentrations (250 nM, 500 nM and 1 µM) of ferroptotic inducers ((1S,3R)-RSL3 (RSL3) and Erastin (Era)) for 6 days in OVCA1; (L) Histogram of ratio GSH:GSSG in OVCAc treated with 500 nM of ferroptotic inducers ((1S,3R)-RSL3 (RSL3) and Erastin (Era)) for 6 days in OVCA1. The graphs show the mean ± SD of three independent experiments. ** p < 0.01.
Figure 2.
Evaluation of ferroptosis induction in OVCAc. (A) Histogram of cell viability in OVCAc treated with several concentrations (250 nM, 500 nM and 1 µM) of ferroptotic inducers ((1S,3R)-RSL3 (RSL3) and Erastin (Era)) for 3 days measured by MTT assay in OVCA1; (B) Histogram of Malondialdehyde (MDA) levels in OVCAc treated with several concentrations (250 nM, 500 nM and 1 µM) of ferroptotic inducers ((1S,3R)-RSL3 (RSL3) and Erastin (Era)) for 3 days in OVCA1; (C) Histogram of Iron (II) (Fe2+) levels in OVCAc treated with several concentrations (250 nM, 500 nM and 1 µM) of ferroptotic inducers ((1S,3R)-RSL3 (RSL3) and Erastin (Era)) for 3 days; (D) Histogram of colony formation in OVCAc treated with several concentrations (250 nM, 500 nM and 1 µM) of ferroptotic inducers ((1S,3R)-RSL3 (RSL3) and Erastin (Era)) for 3 days in OVCA1; (E) Histogram of reactive oxygen species (ROS) levels in OVCAc treated with several concentrations (250 nM, 500 nM and 1 µM) of ferroptotic inducers ((1S,3R)-RSL3 (RSL3) and Erastin (Era)) for 3 days in OVCA1; (F) Histogram of ratio GSH:GSSG in OVCAc treated with 500 nM of ferroptotic inducers ((1S,3R)-RSL3 (RSL3) and Erastin (Era)) for 3 days in OVCA1; (G) Histogram of cell viability in OVCAc treated with several concentrations (250 nM, 500 nM and 1 µM) of ferroptotic inducers ((1S,3R)-RSL3 (RSL3) and Erastin (Era)) for 6 days measured by MTT assay in OVCA1; (H) Histogram of Malondialdehyde (MDA) levels in OVCAc treated with several concentrations (250 nM, 500 nM and 1 µM) of ferroptotic inducers ((1S,3R)-RSL3 (RSL3) and Erastin (Era)) for 6 days in OVCA1; (I) Histogram of Iron (II) (Fe2+) levels in OVCAc treated with several concentrations (250 nM, 500 nM and 1 µM) of ferroptotic inducers ((1S,3R)-RSL3 (RSL3) and Erastin (Era)) for 6 days in OVCA1; (J) Histogram of colony formation in OVCAc treated with several concentrations (250 nM, 500 nM and 1 µM) of ferroptotic inducers ((1S,3R)-RSL3 (RSL3) and Erastin (Era)) for 6 days in OVCA1; (K) Histogram of reactive oxygen species (ROS) levels in OVCAc treated with several concentrations (250 nM, 500 nM and 1 µM) of ferroptotic inducers ((1S,3R)-RSL3 (RSL3) and Erastin (Era)) for 6 days in OVCA1; (L) Histogram of ratio GSH:GSSG in OVCAc treated with 500 nM of ferroptotic inducers ((1S,3R)-RSL3 (RSL3) and Erastin (Era)) for 6 days in OVCA1. The graphs show the mean ± SD of three independent experiments. ** p < 0.01.

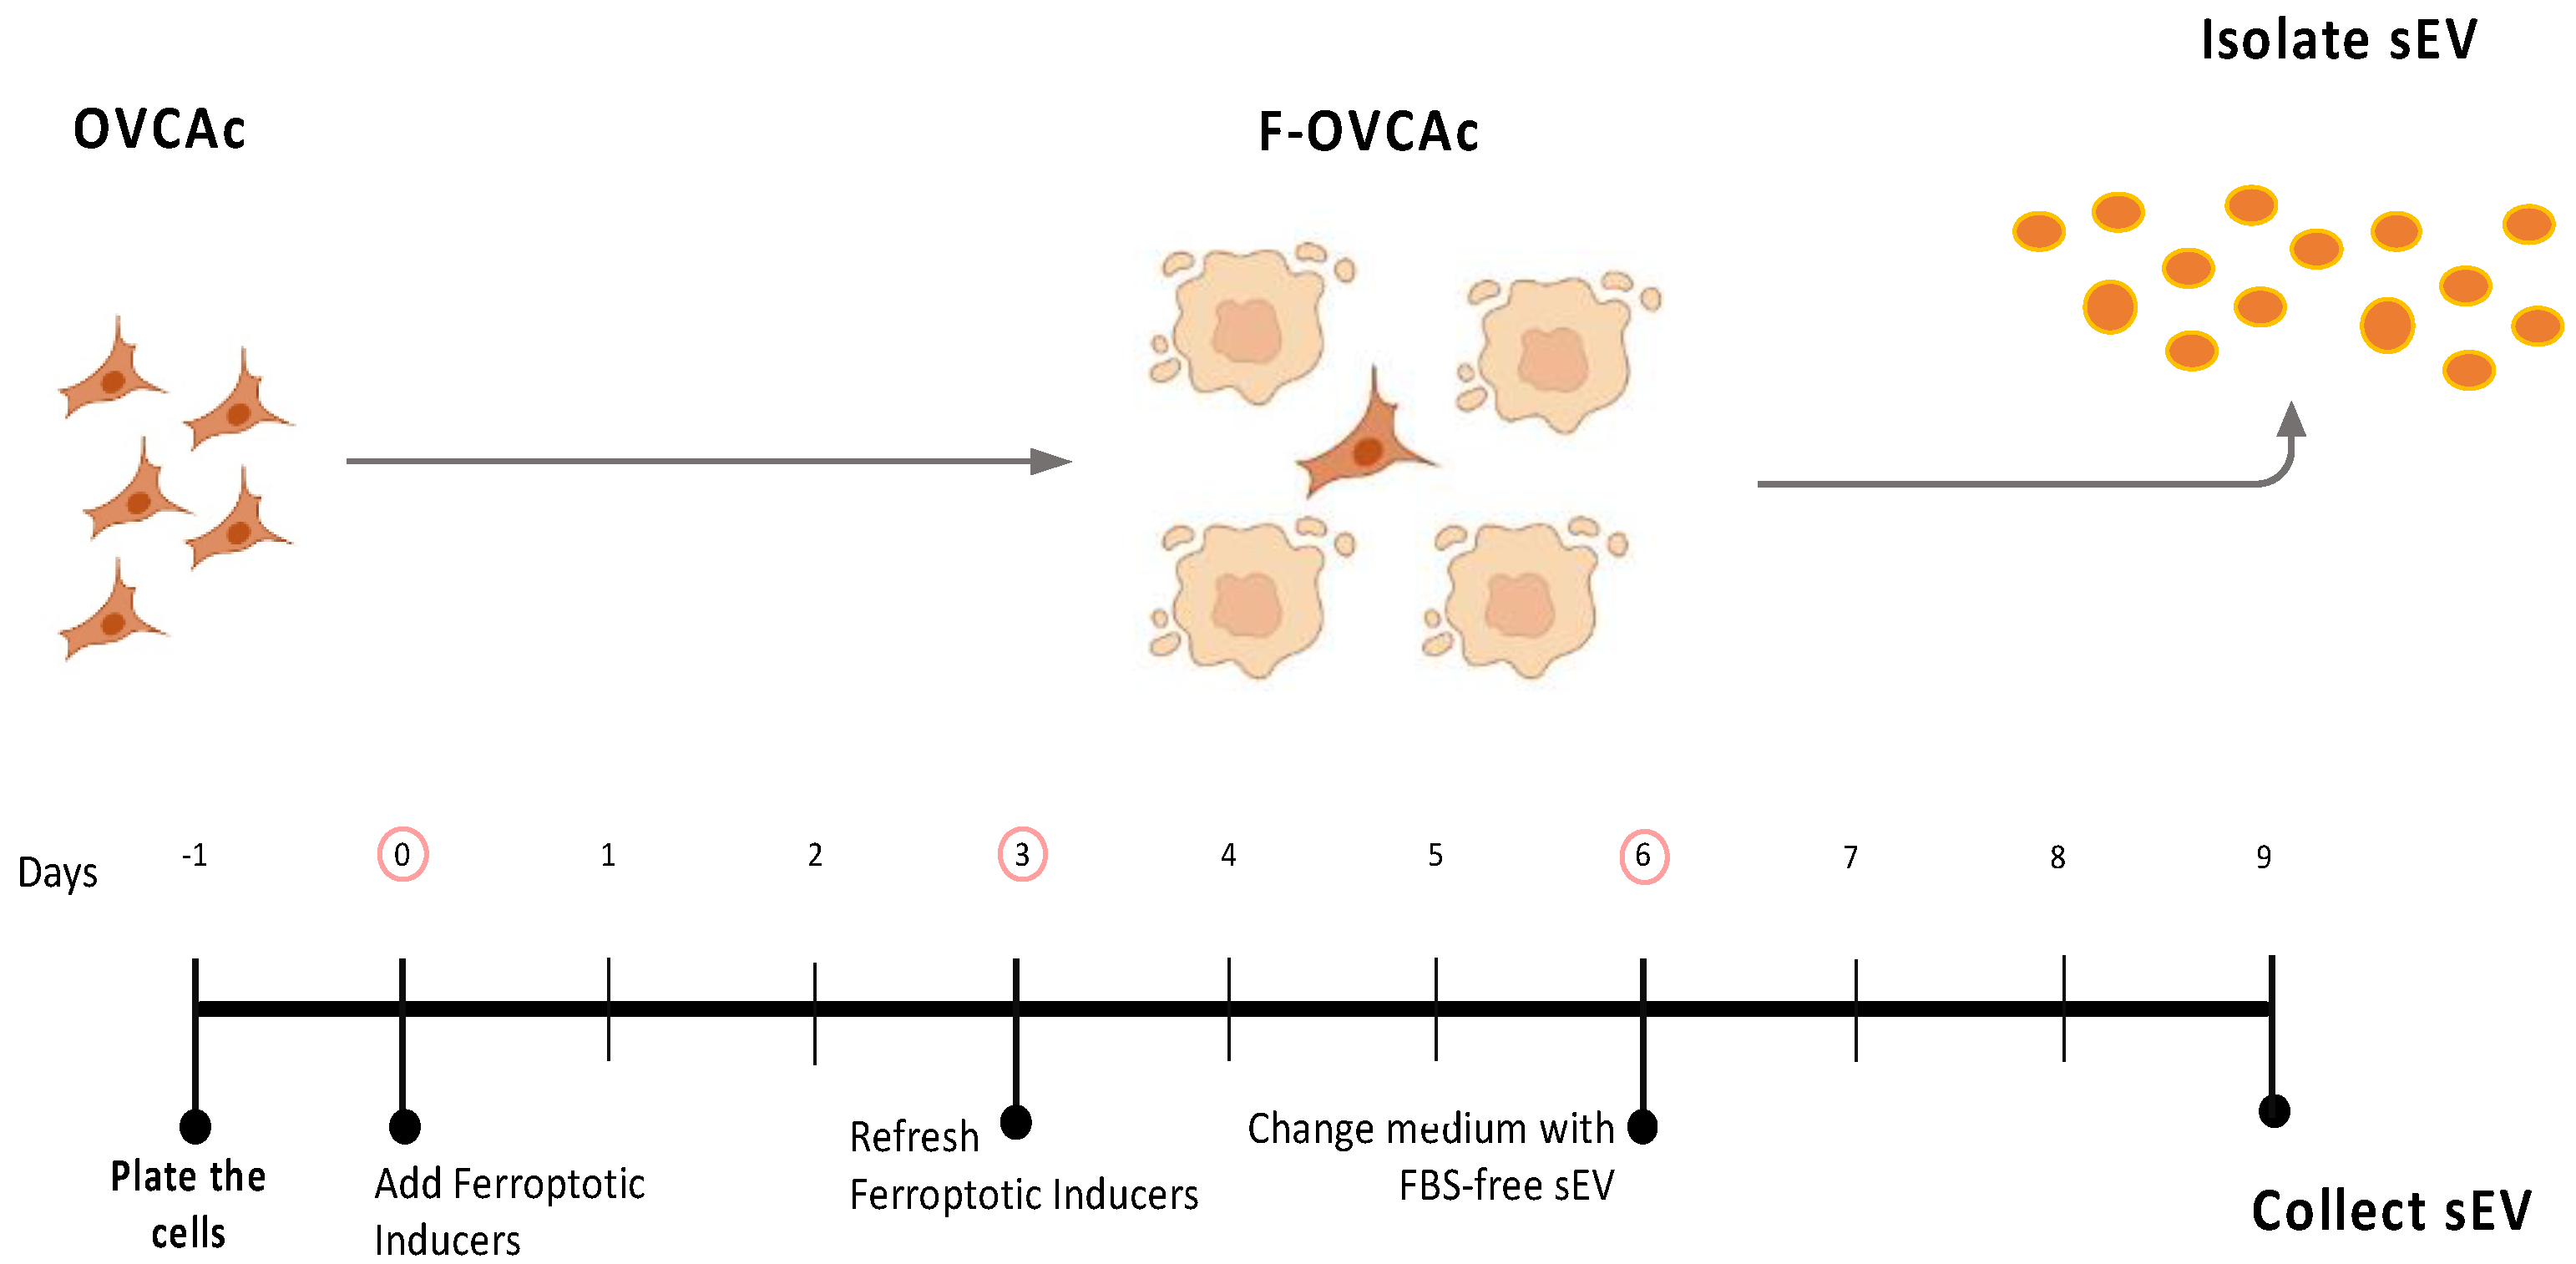
Figure 3.
Schematic representation of isolation of small extracellular vesicles (sEV) from ferroptotic epithelial ovarian cancer cells (F-OVCAc).
Figure 3.
Schematic representation of isolation of small extracellular vesicles (sEV) from ferroptotic epithelial ovarian cancer cells (F-OVCAc).
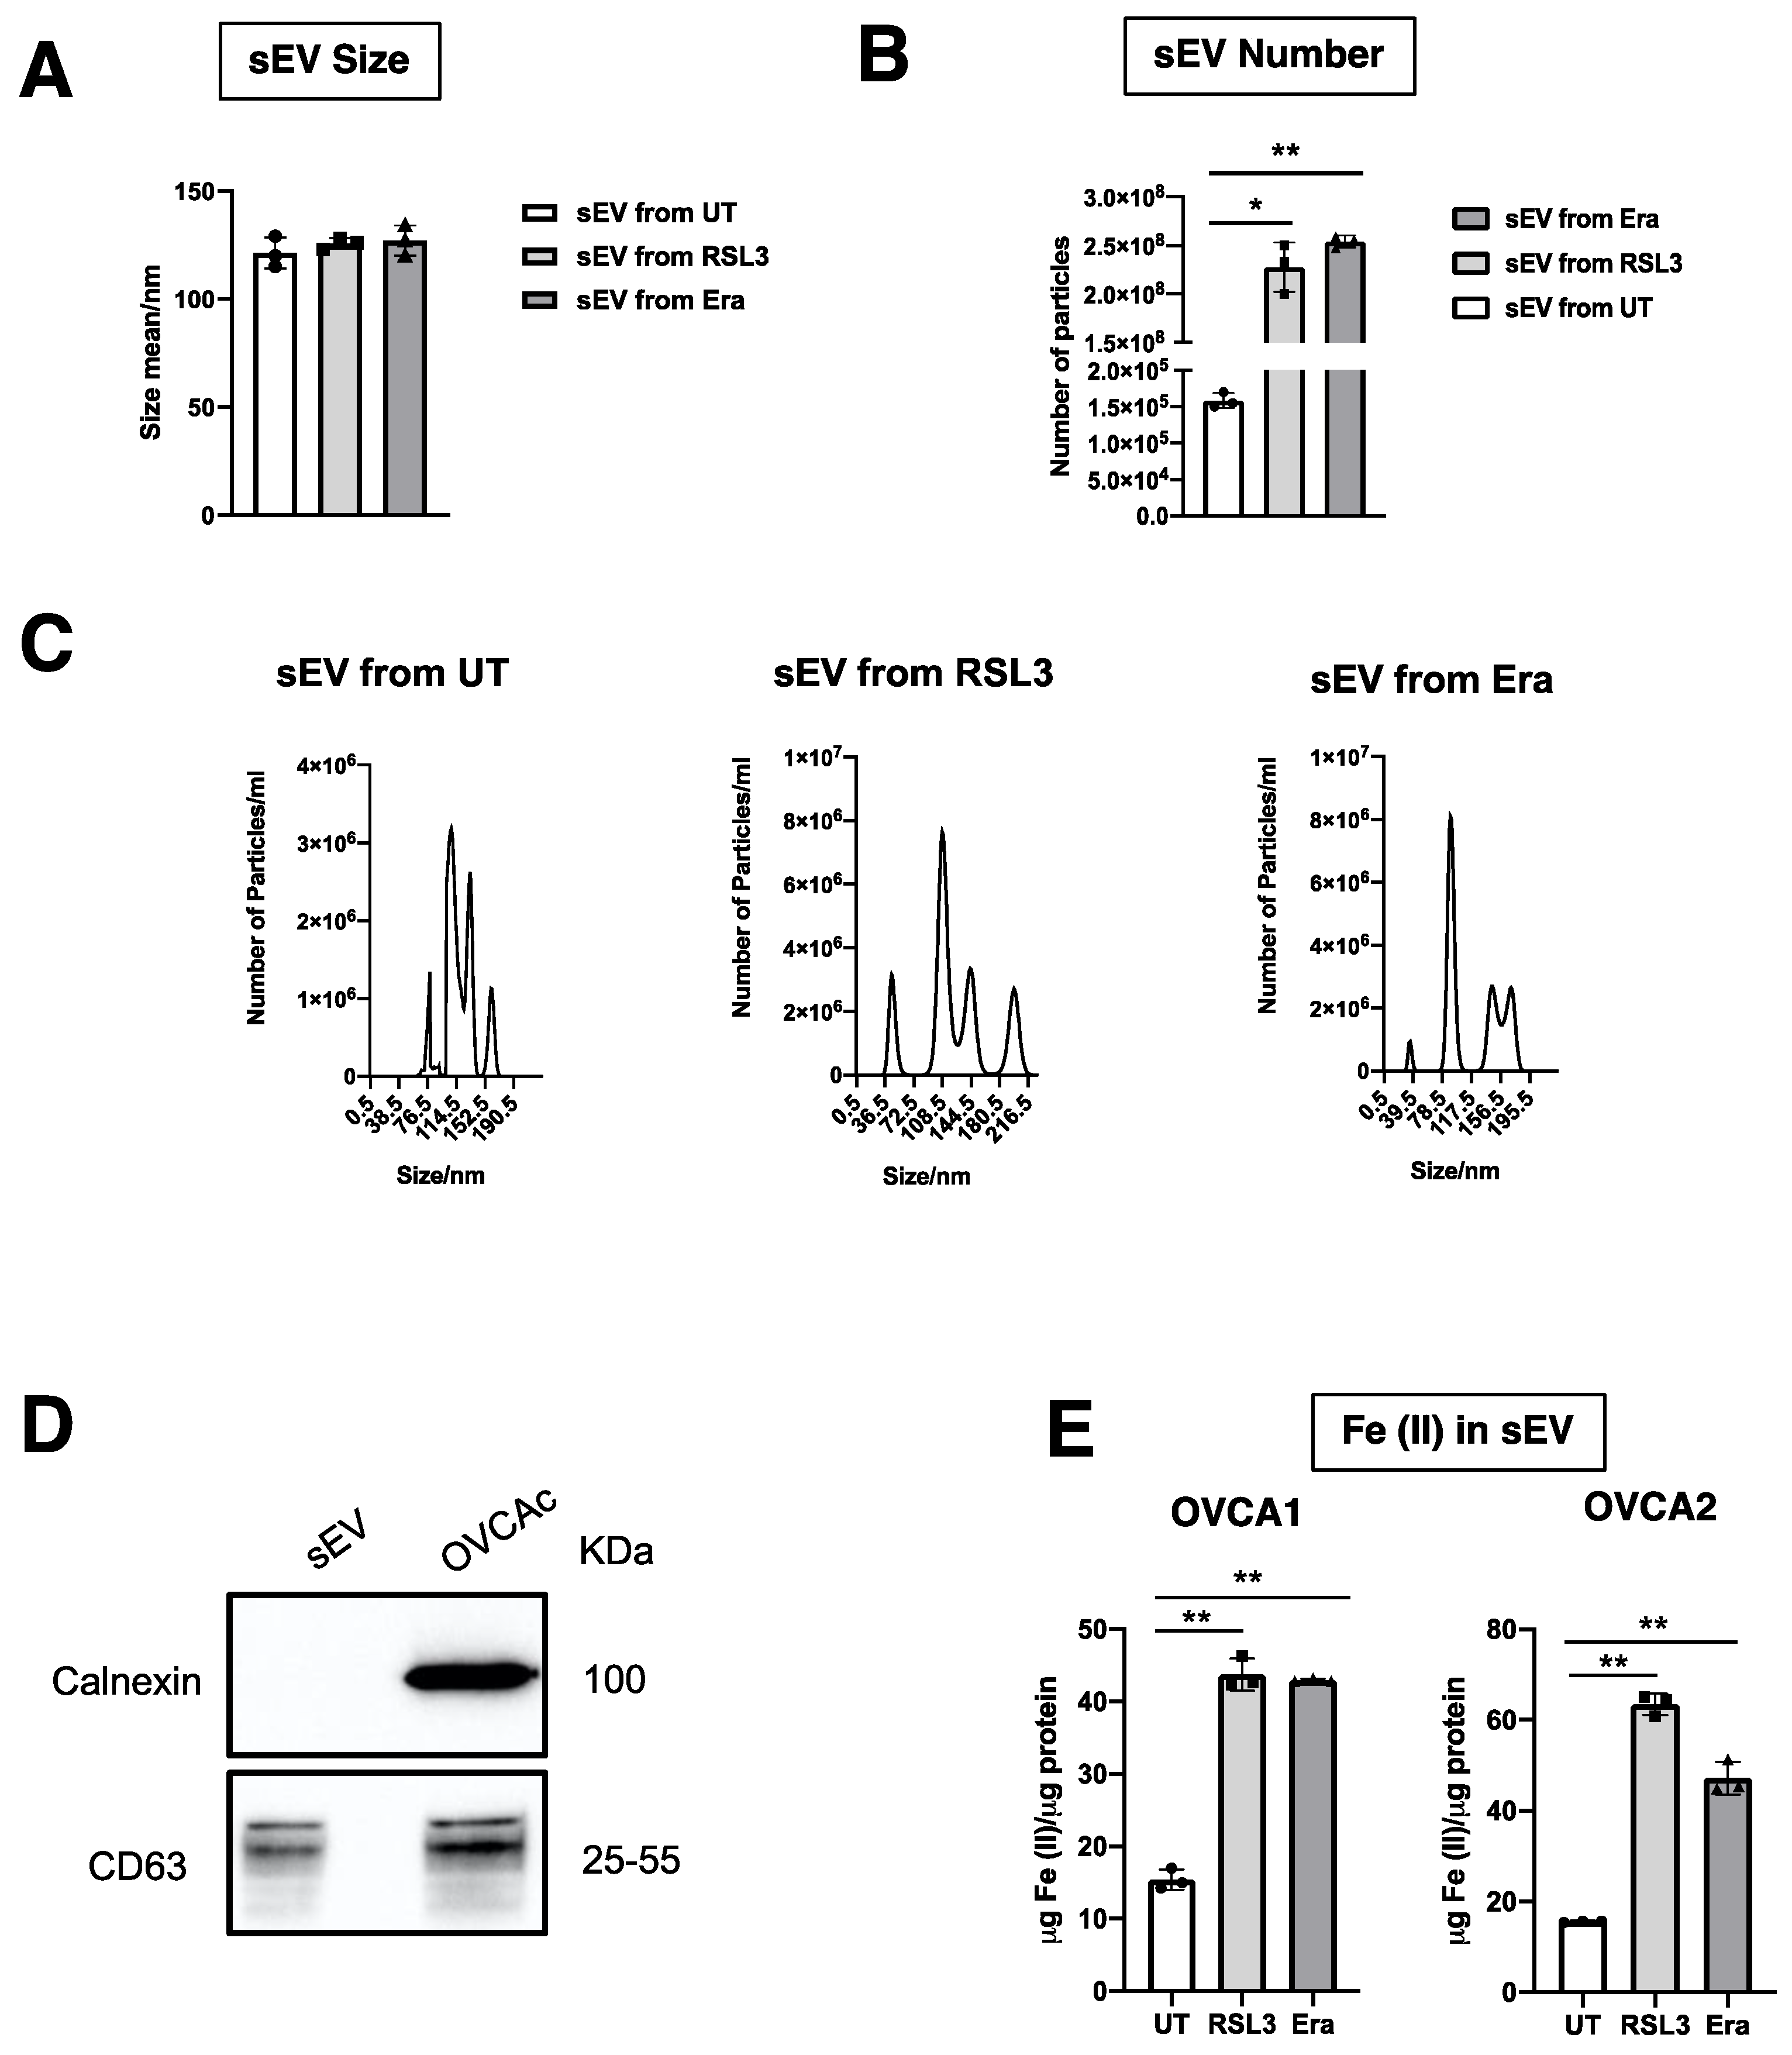
Figure 4.
Characterization of sEV from F-OVCAc. (A) Mean hydrodynamic diameter size and (B) number of sEV from F-OVCAc measured by Nanoparticle Tracking Analysis (NTA) in OVCA1; (C) Histogram distribution of sEV from UT, RSL3 and Era by Nanoparticle Tracking Analysis (NTA) in OVCA1; (D) EV-related marker (CD63) and lack of contaminant (Calnexin) in cells and sEV by WB in OVCA1; (E) Histogram of Iron (II) (Fe2+) levels in sEV from OVCAc treated with 500 nM of ferroptotic inducers ((1S,3R)-RSL3 (RSL3) and Erastin (Era)) for 6 days in OVCA1 and OVCA2. The graphs show the mean ± SD of three independent experiments. * p < 0.05, ** p < 0.01.
Figure 5.
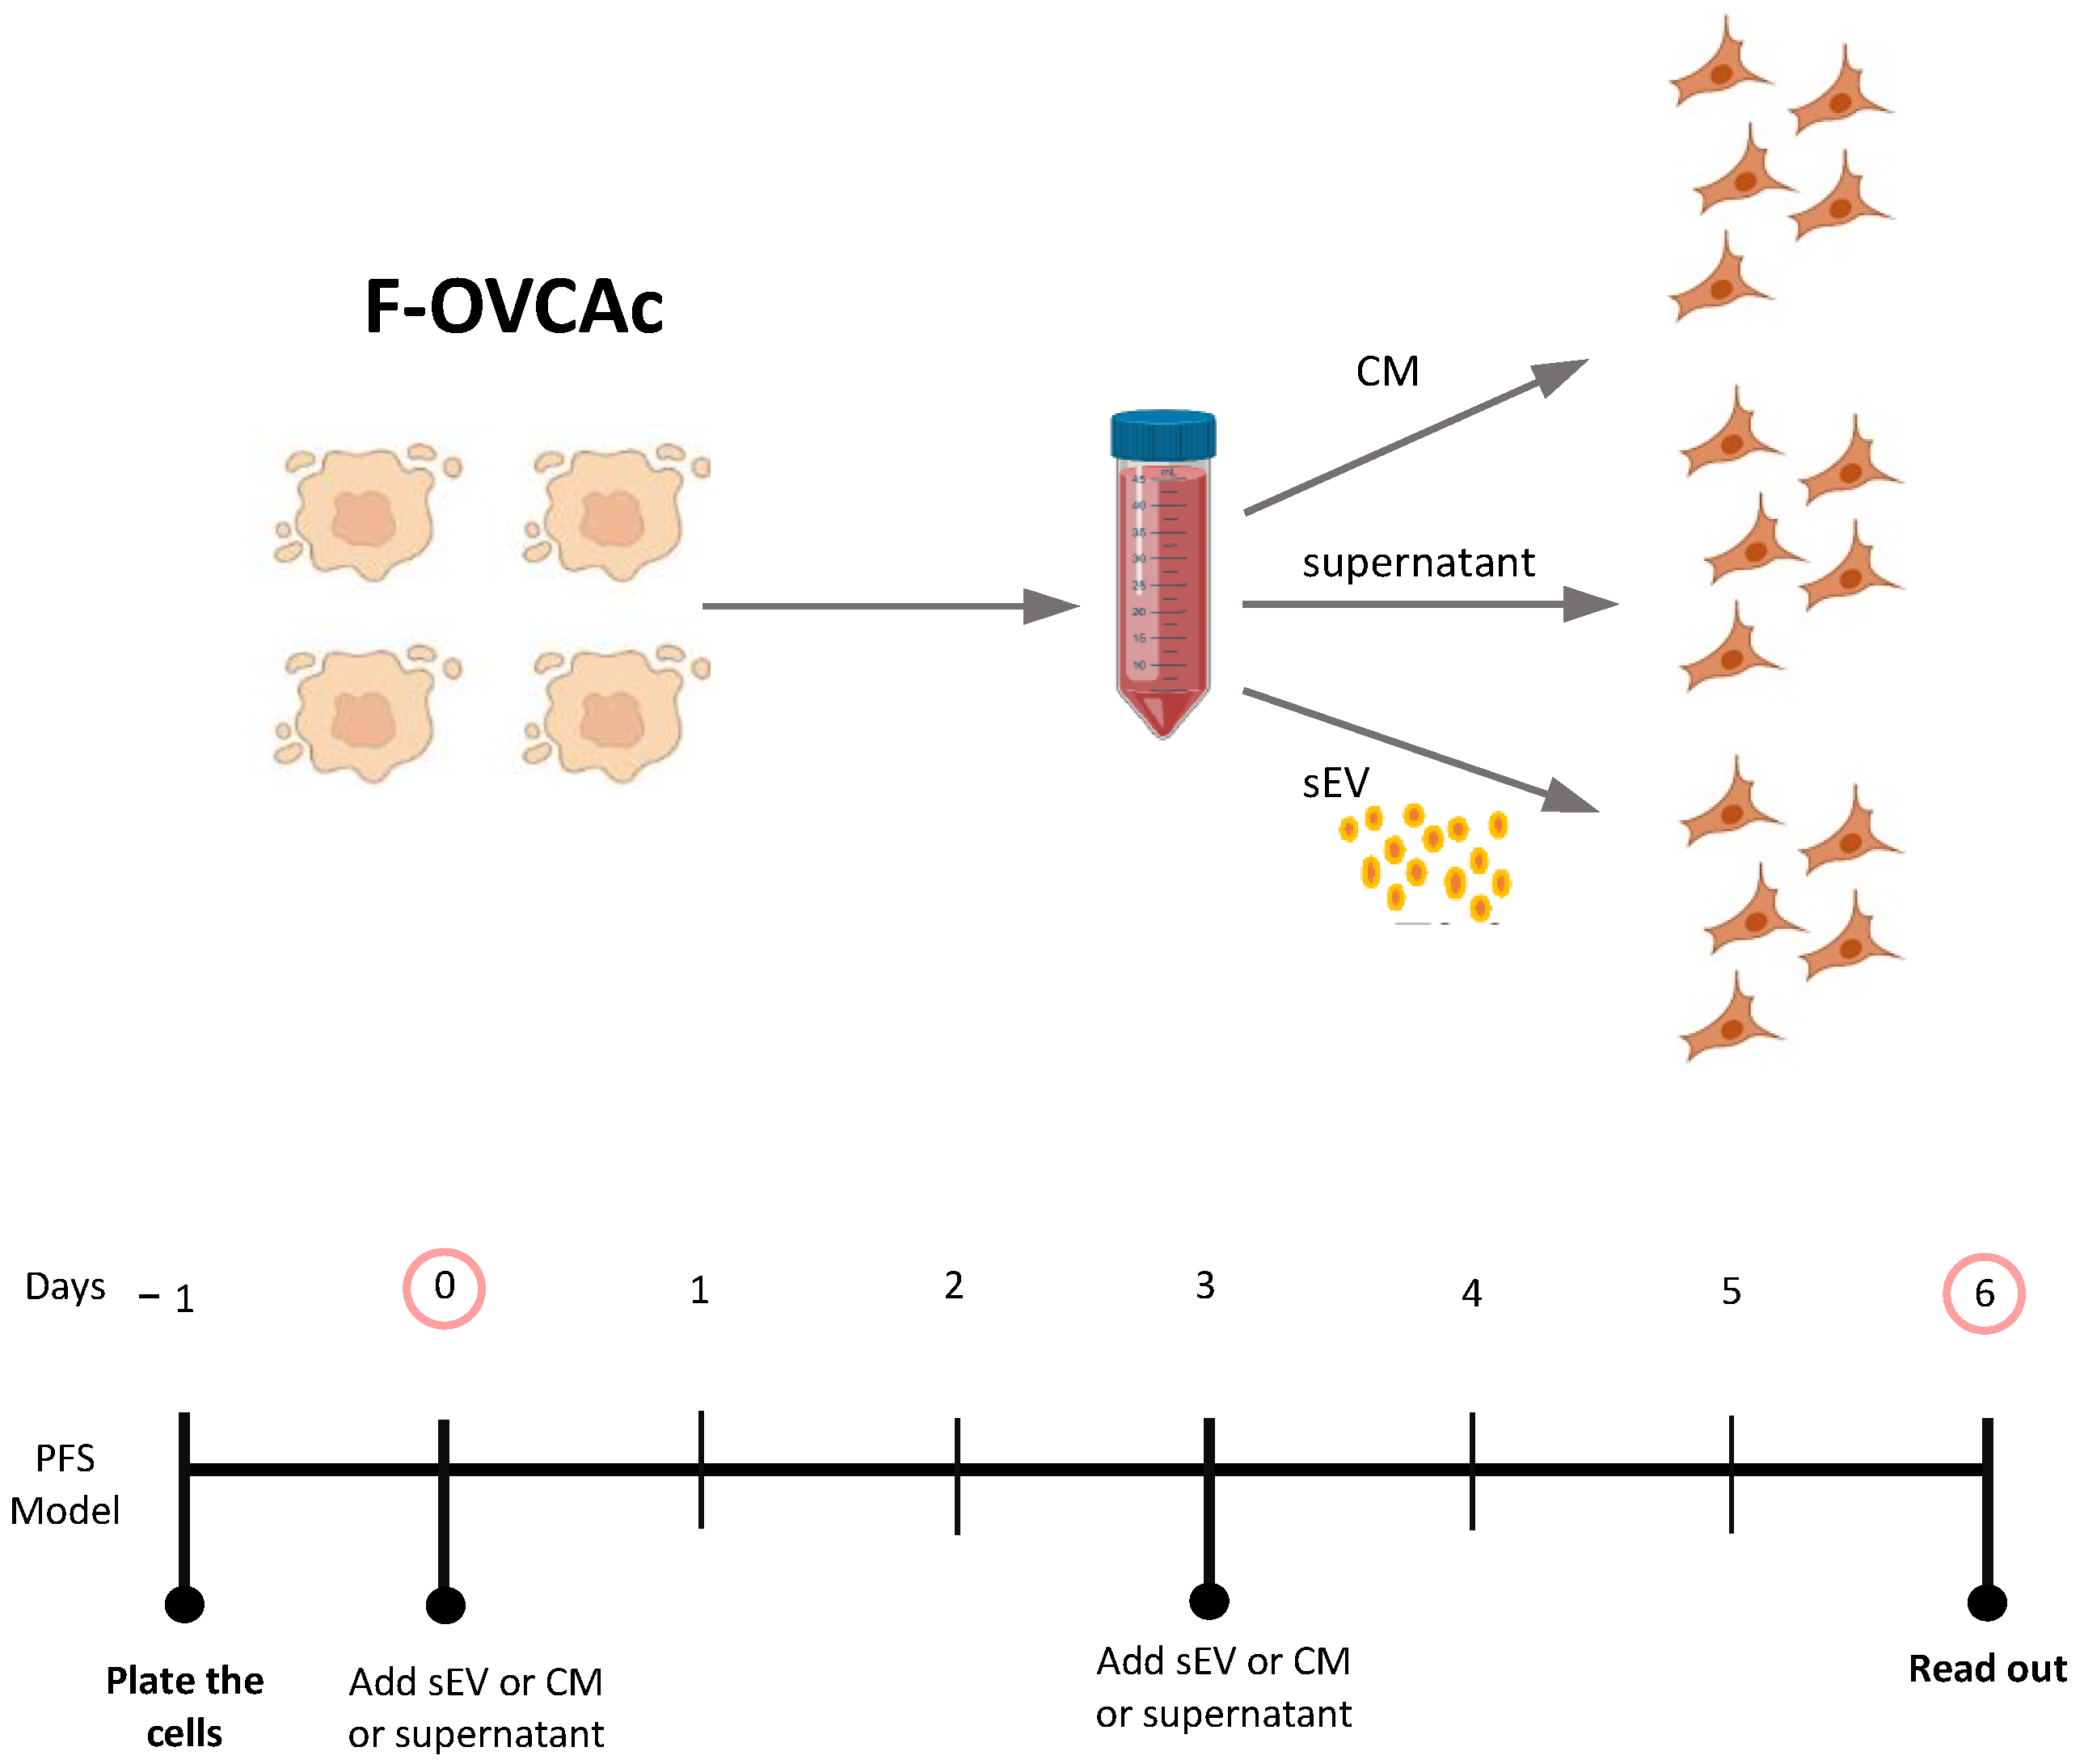
Schematic representation of OVCAc treated with conditioned medium (CM) and two fractions of CM (Supernatant (SN) and sEV) from F-OVCAc.
Figure 5.
Schematic representation of OVCAc treated with conditioned medium (CM) and two fractions of CM (Supernatant (SN) and sEV) from F-OVCAc.
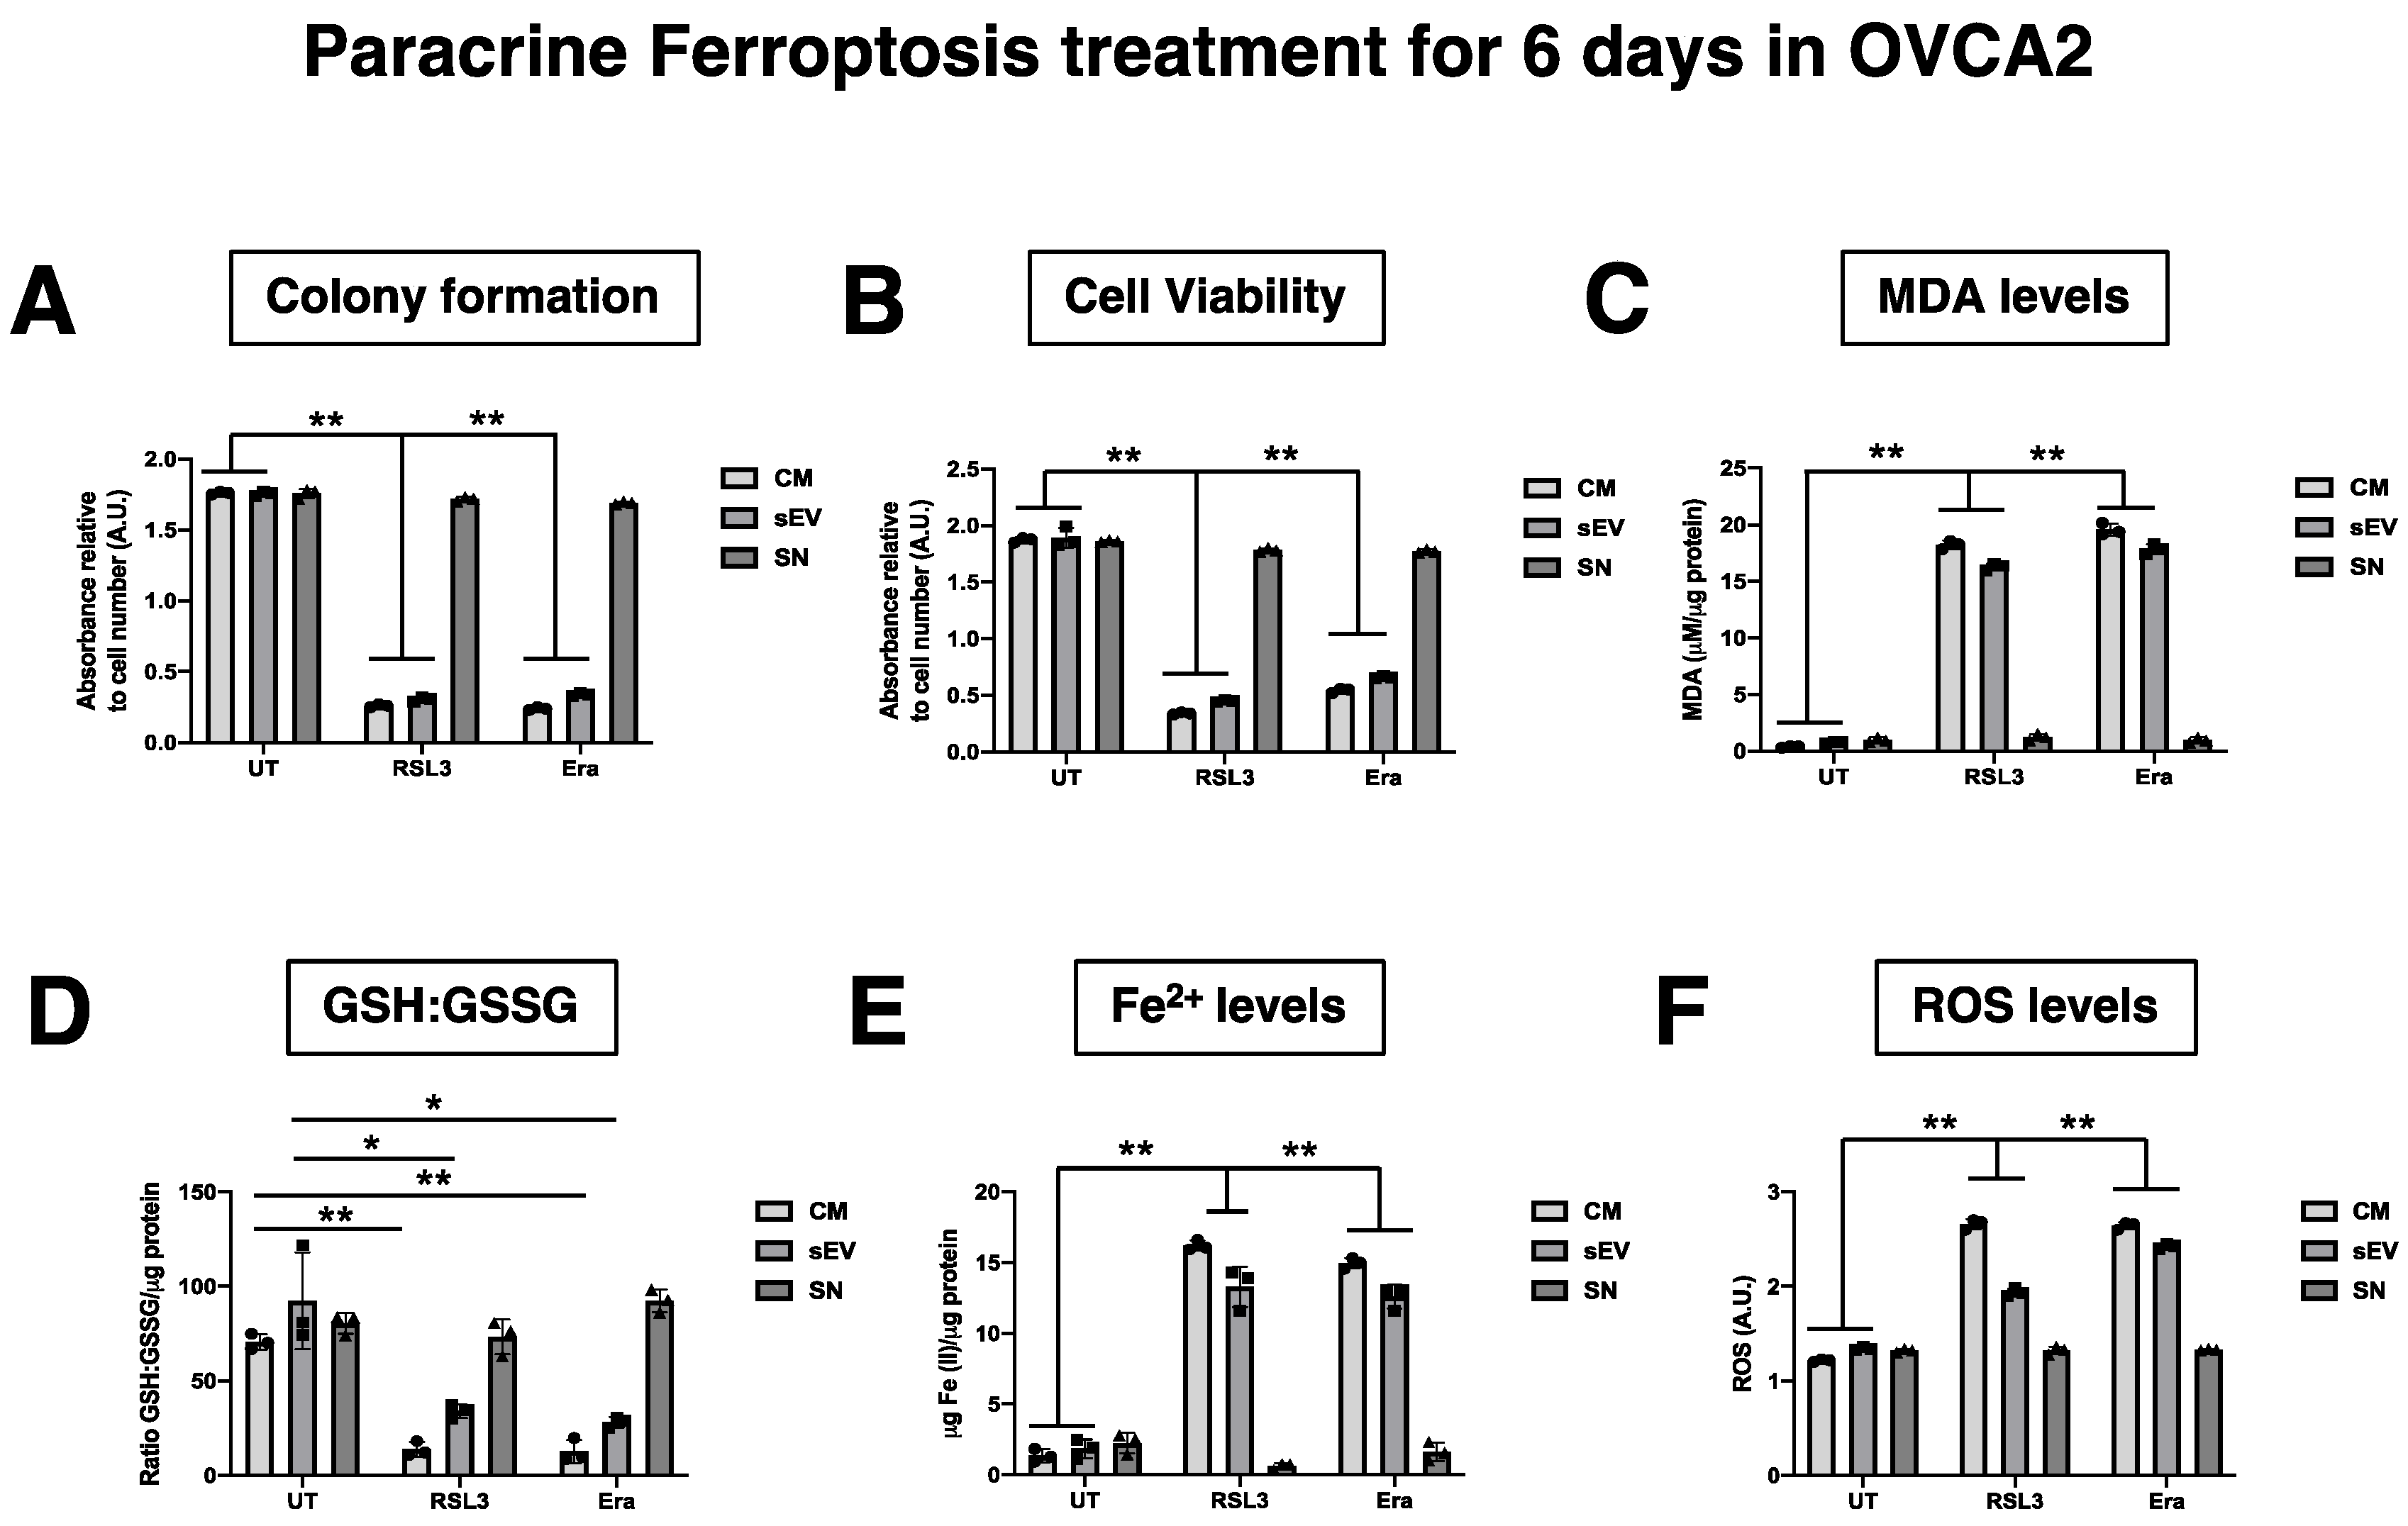
Figure 6.
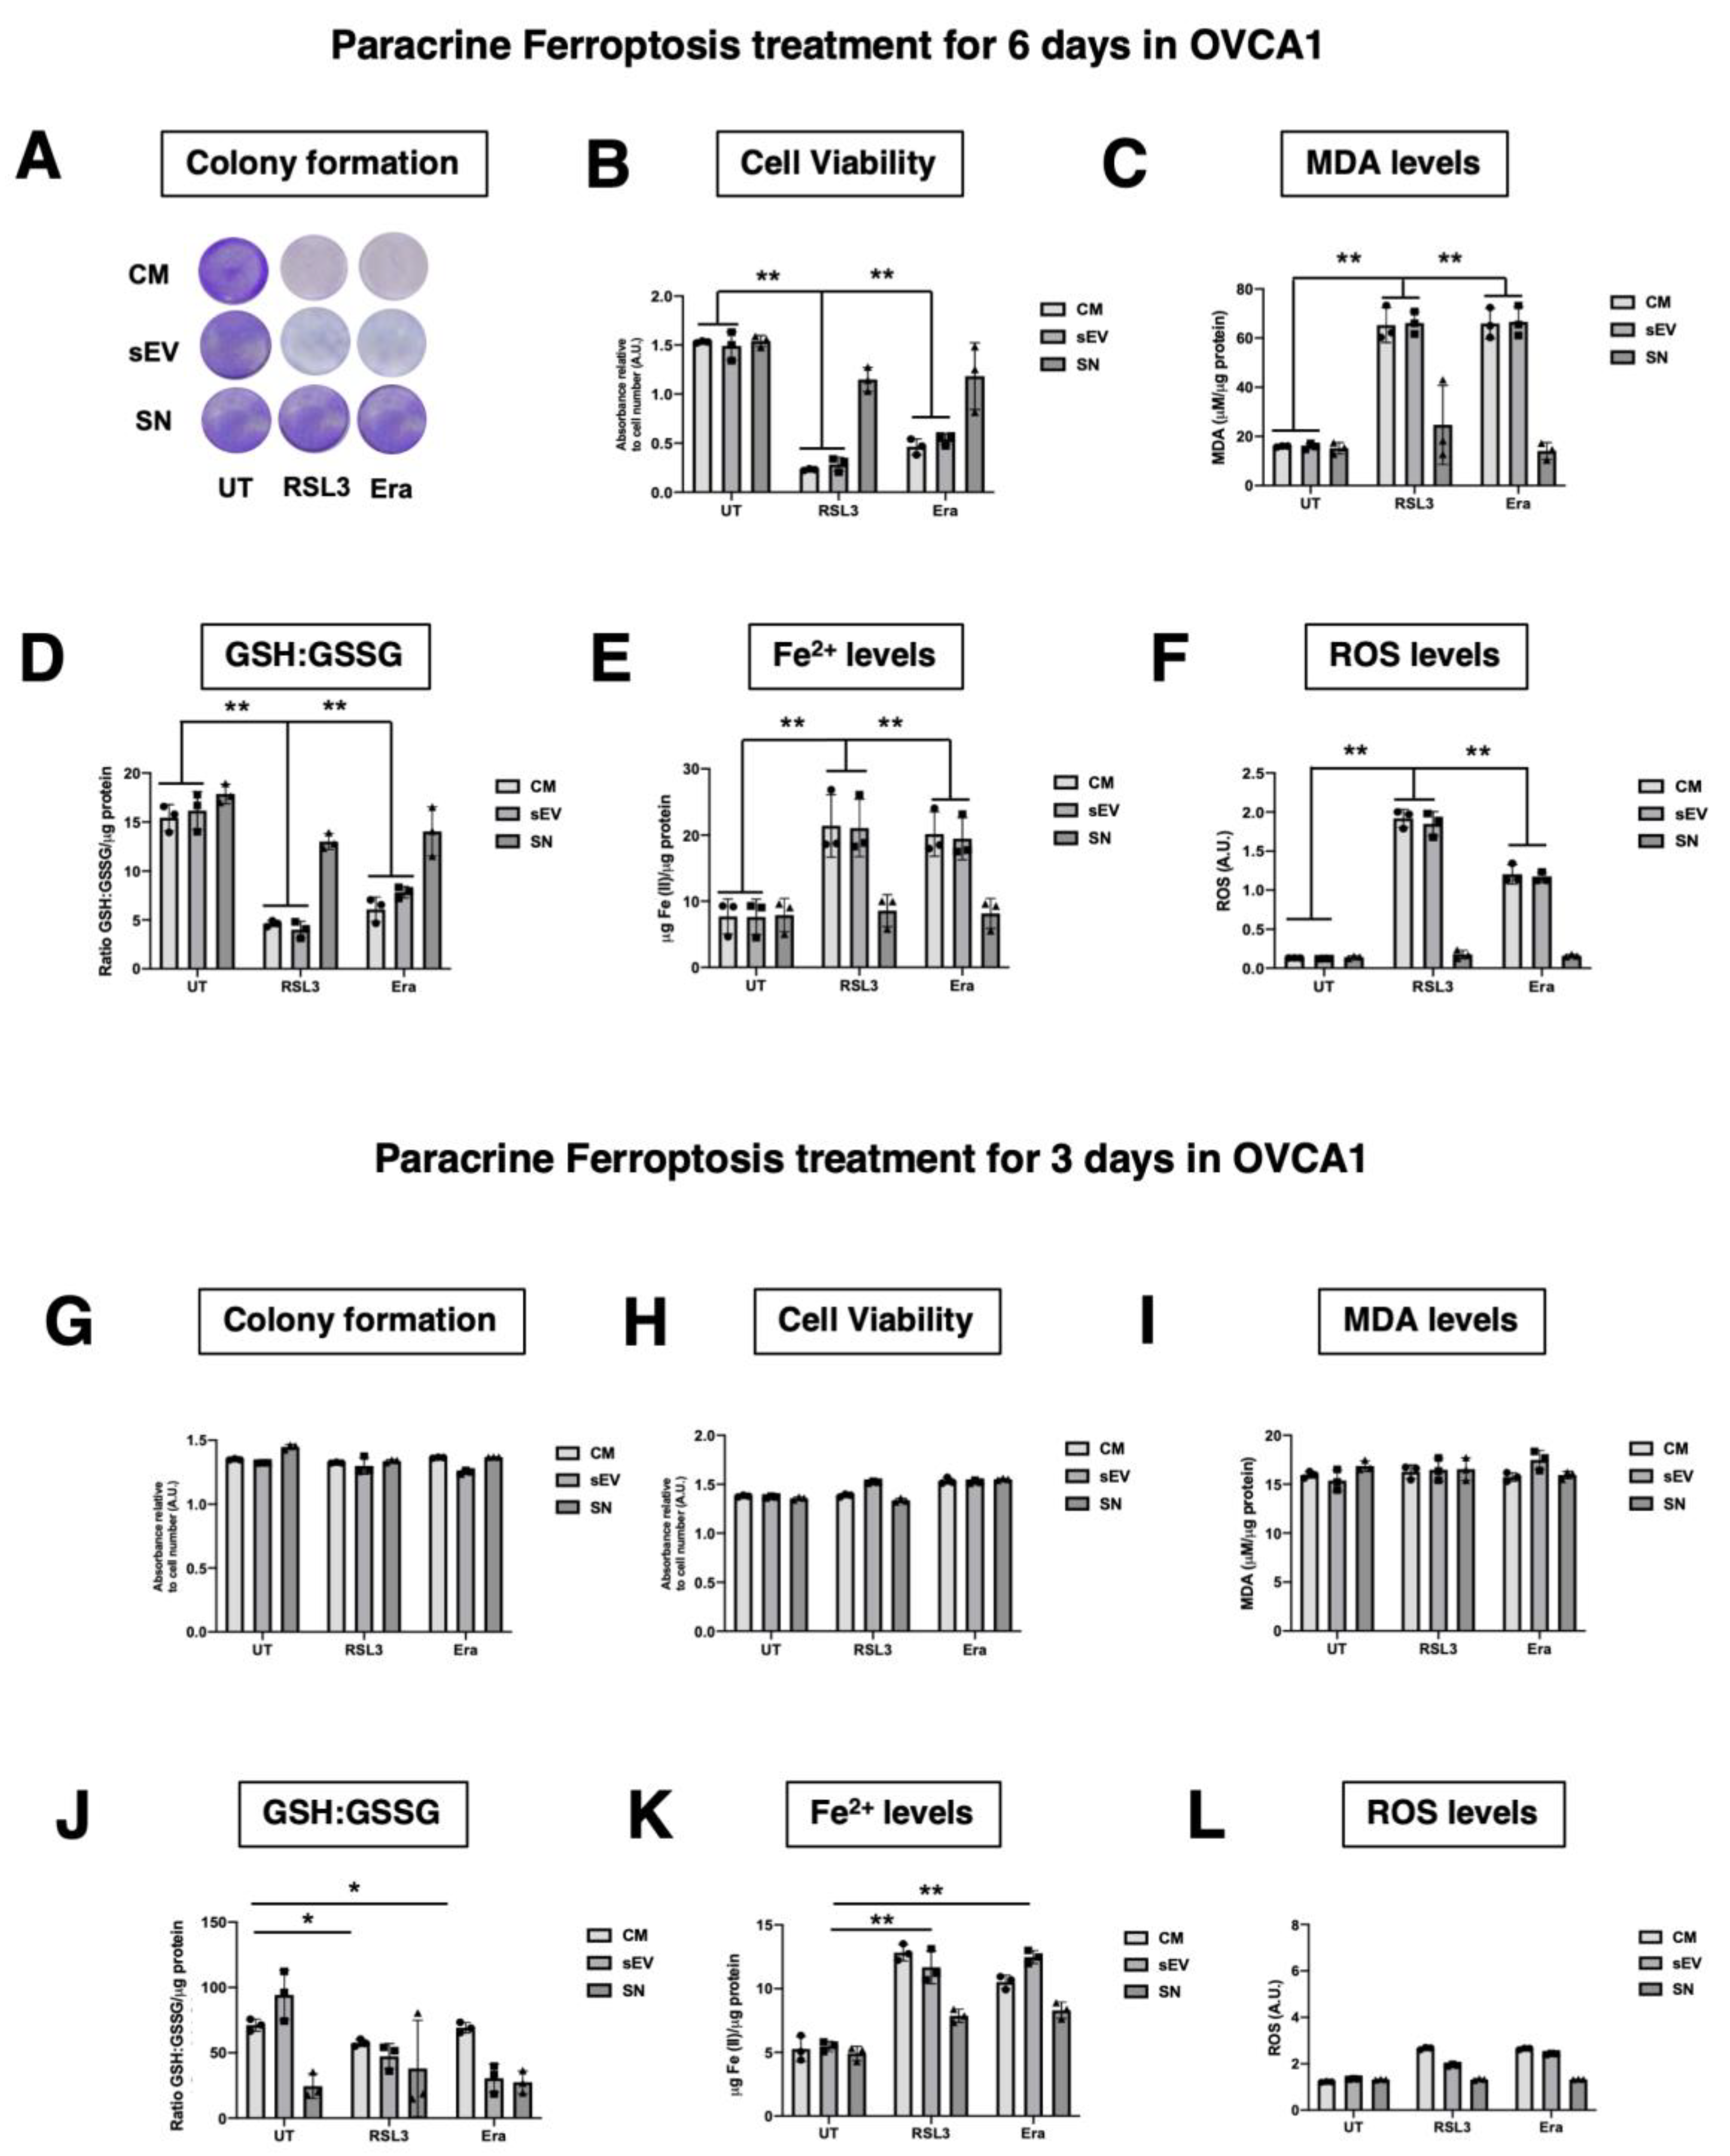
Functionality Analysis of CM and different fractions (SN or sEV) of the conditioned medium of F-OVCAs on OVCAs. (A) Representative images of colony formation in OVCAc treated with CM, SN or sEV from F-OVCAc for 6 days in OVCA1; (B) Histogram of cell viability by MTT assay in OVCAc treated with SN or sEV from F-OVCAc for 6 days in OVCA1; (C) Histogram of Malondialdehyde (MDA) levels in OVCAc treated with CM, SN or sEV from F-OVCAc for 6 days in OVCA1; (D) Histogram of ratio GSH/GSSG (Reduced Glutathione/Oxidized Glutathione) levels in OVCAc treated with CM, SN or sEV from F-OVCAc for 6 days in OVCA1; (E) Histogram of Iron (II) (Fe2+) levels in OVCAc treated with CM, SN or sEV from F-OVCAc for 6 days in OVCA1; (F) Histogram of reactive oxygen species (ROS) levels in OVCAc treated with CM, SN or sEV from F-OVCAc for 6 days in OVCA1; (G) Histogram of colony formation in OVCAc treated with CM, SN or sEV from F-OVCAc for 3 days in OVCA1; (H) Histogram of cell viability by MTT assay in OVCAc treated with CM, SN or sEV from F-OVCAc for 3 days in OVCA1; (I) Histogram of Malondialdehyde (MDA) levels in OVCAc treated with CM, SN or sEV from F-OVCAc for 3 days in OVCA1; (J) Histogram of ratio GSH/GSSG (Reduced Glutathione/Oxidized Glutathione) levels in OVCAc treated with CM, SN or sEV from F-OVCAc for 3 days in OVCA1; (K) Histogram of Iron (II) (Fe2+) levels in OVCAc treated with CM, SN or sEV from F-OVCAc for 3 days in OVCA1; (L) Histogram of reactive oxygen species (ROS) levels in OVCAc treated with CM, SN or sEV from F-OVCAc for 3 days in OVCA1. The graphs show the mean ± SD of three independent experiments. * p < 0.05 and ** p < 0.01.
Figure 6.
Functionality Analysis of CM and different fractions (SN or sEV) of the conditioned medium of F-OVCAs on OVCAs. (A) Representative images of colony formation in OVCAc treated with CM, SN or sEV from F-OVCAc for 6 days in OVCA1; (B) Histogram of cell viability by MTT assay in OVCAc treated with SN or sEV from F-OVCAc for 6 days in OVCA1; (C) Histogram of Malondialdehyde (MDA) levels in OVCAc treated with CM, SN or sEV from F-OVCAc for 6 days in OVCA1; (D) Histogram of ratio GSH/GSSG (Reduced Glutathione/Oxidized Glutathione) levels in OVCAc treated with CM, SN or sEV from F-OVCAc for 6 days in OVCA1; (E) Histogram of Iron (II) (Fe2+) levels in OVCAc treated with CM, SN or sEV from F-OVCAc for 6 days in OVCA1; (F) Histogram of reactive oxygen species (ROS) levels in OVCAc treated with CM, SN or sEV from F-OVCAc for 6 days in OVCA1; (G) Histogram of colony formation in OVCAc treated with CM, SN or sEV from F-OVCAc for 3 days in OVCA1; (H) Histogram of cell viability by MTT assay in OVCAc treated with CM, SN or sEV from F-OVCAc for 3 days in OVCA1; (I) Histogram of Malondialdehyde (MDA) levels in OVCAc treated with CM, SN or sEV from F-OVCAc for 3 days in OVCA1; (J) Histogram of ratio GSH/GSSG (Reduced Glutathione/Oxidized Glutathione) levels in OVCAc treated with CM, SN or sEV from F-OVCAc for 3 days in OVCA1; (K) Histogram of Iron (II) (Fe2+) levels in OVCAc treated with CM, SN or sEV from F-OVCAc for 3 days in OVCA1; (L) Histogram of reactive oxygen species (ROS) levels in OVCAc treated with CM, SN or sEV from F-OVCAc for 3 days in OVCA1. The graphs show the mean ± SD of three independent experiments. * p < 0.05 and ** p < 0.01.

Figure 7.
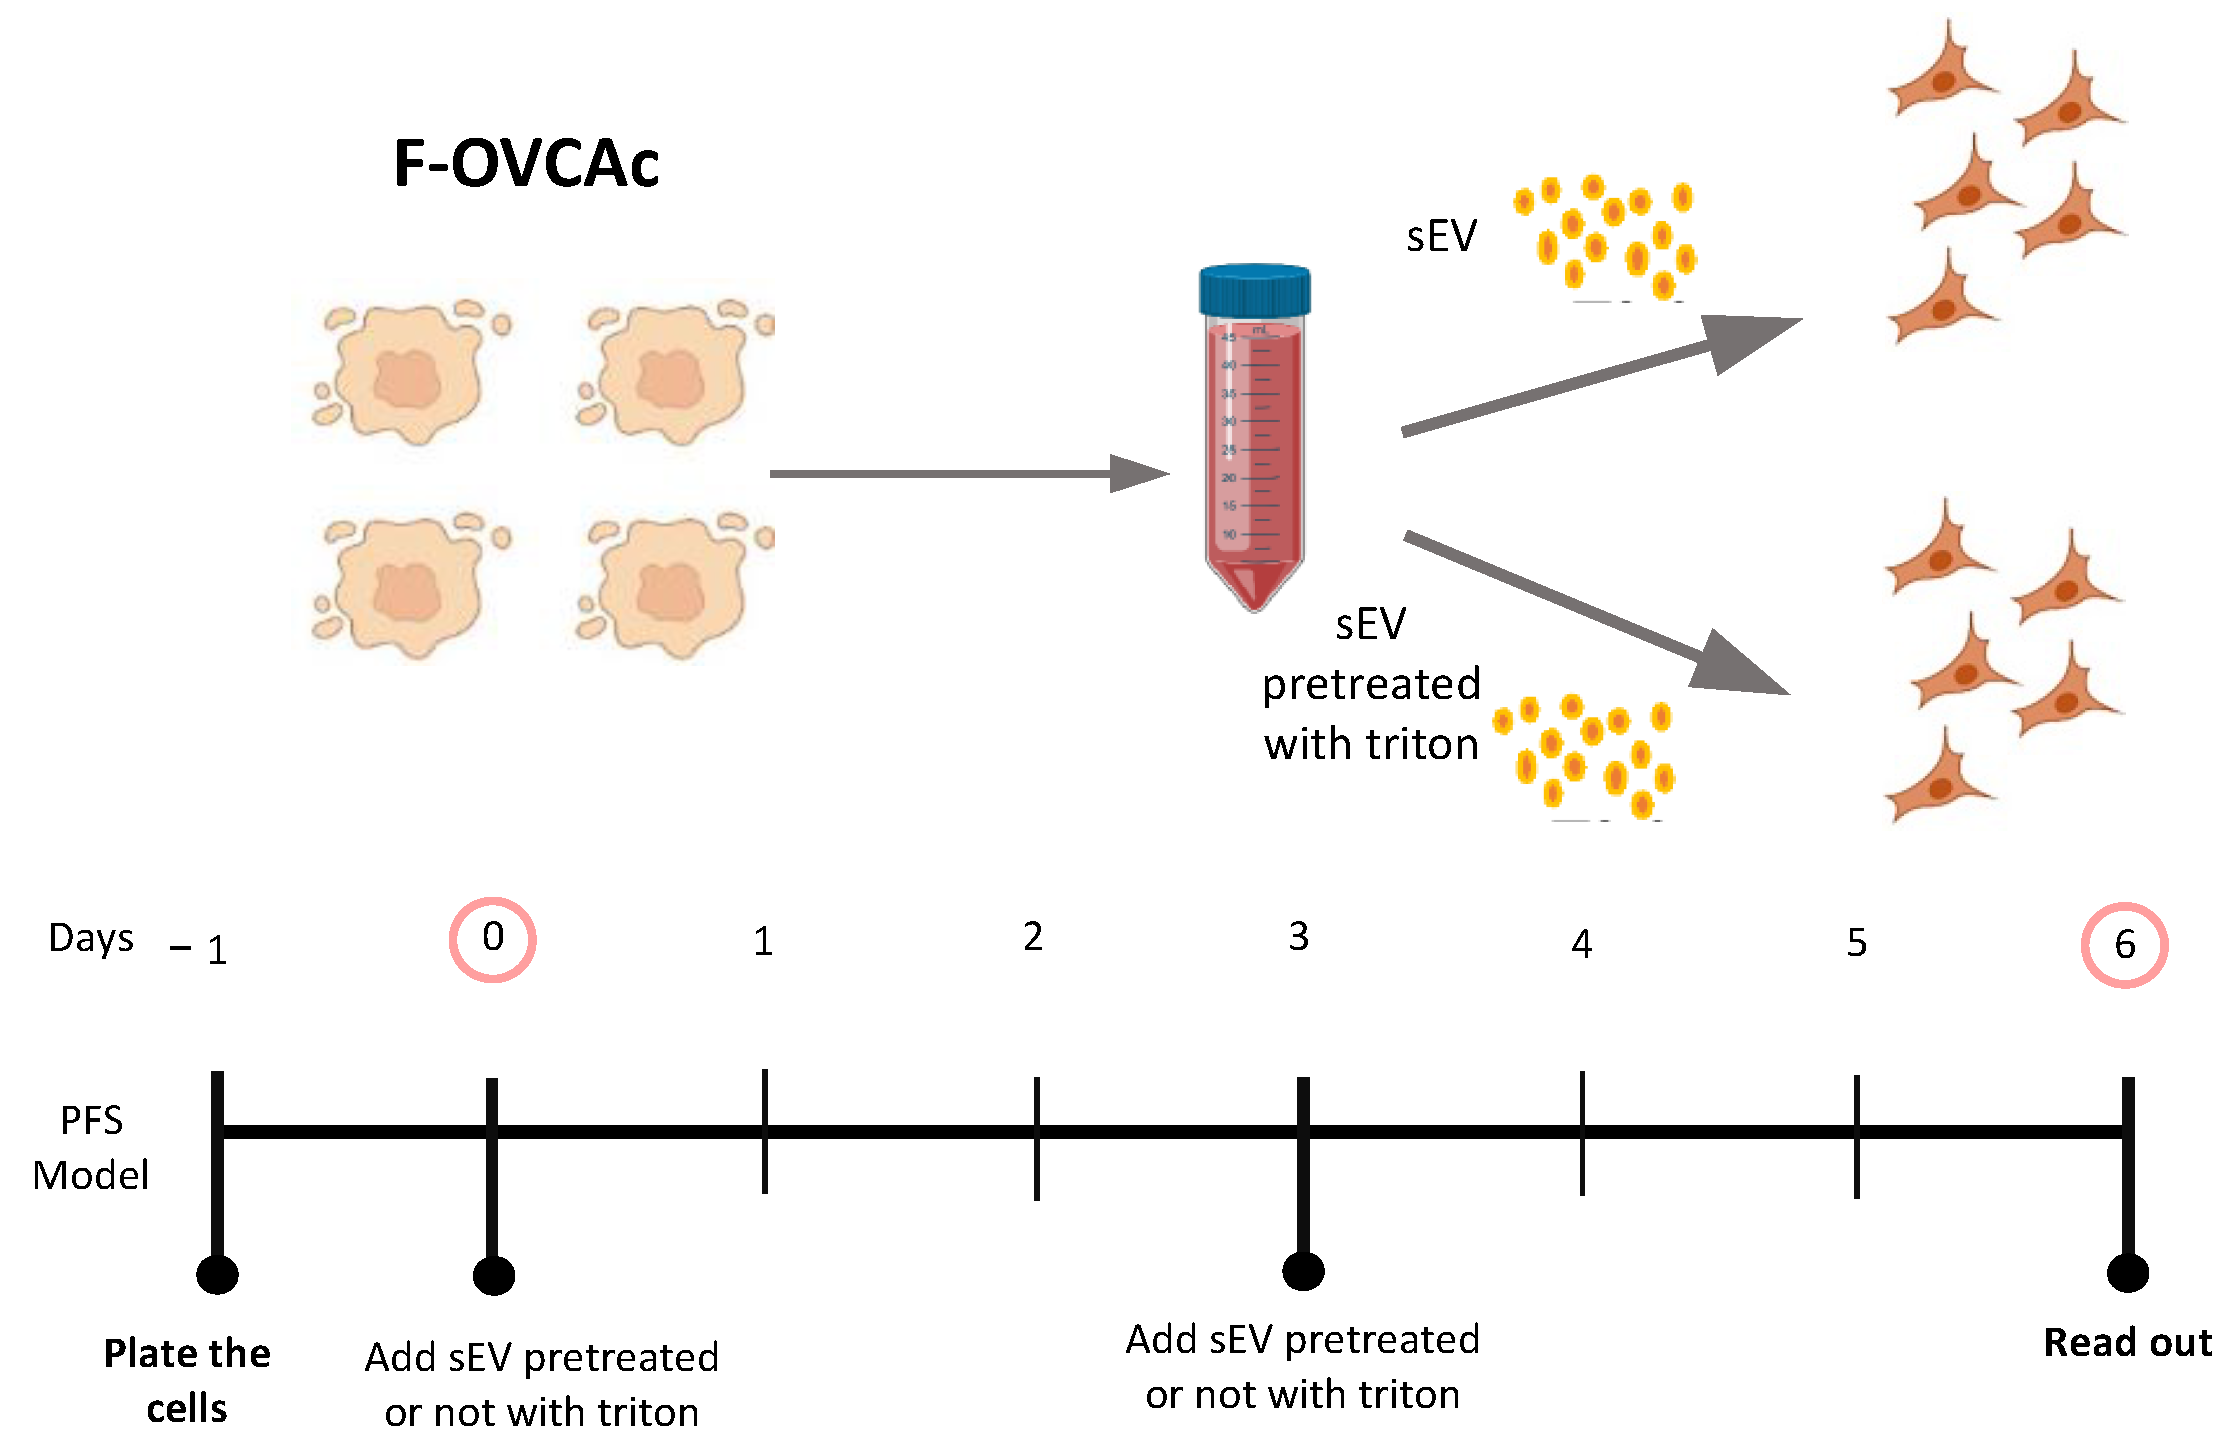
Schematic representation of ferroptotic paracrine transmission using defunctionalized sEV by Triton-X.
Figure 7.
Schematic representation of ferroptotic paracrine transmission using defunctionalized sEV by Triton-X.
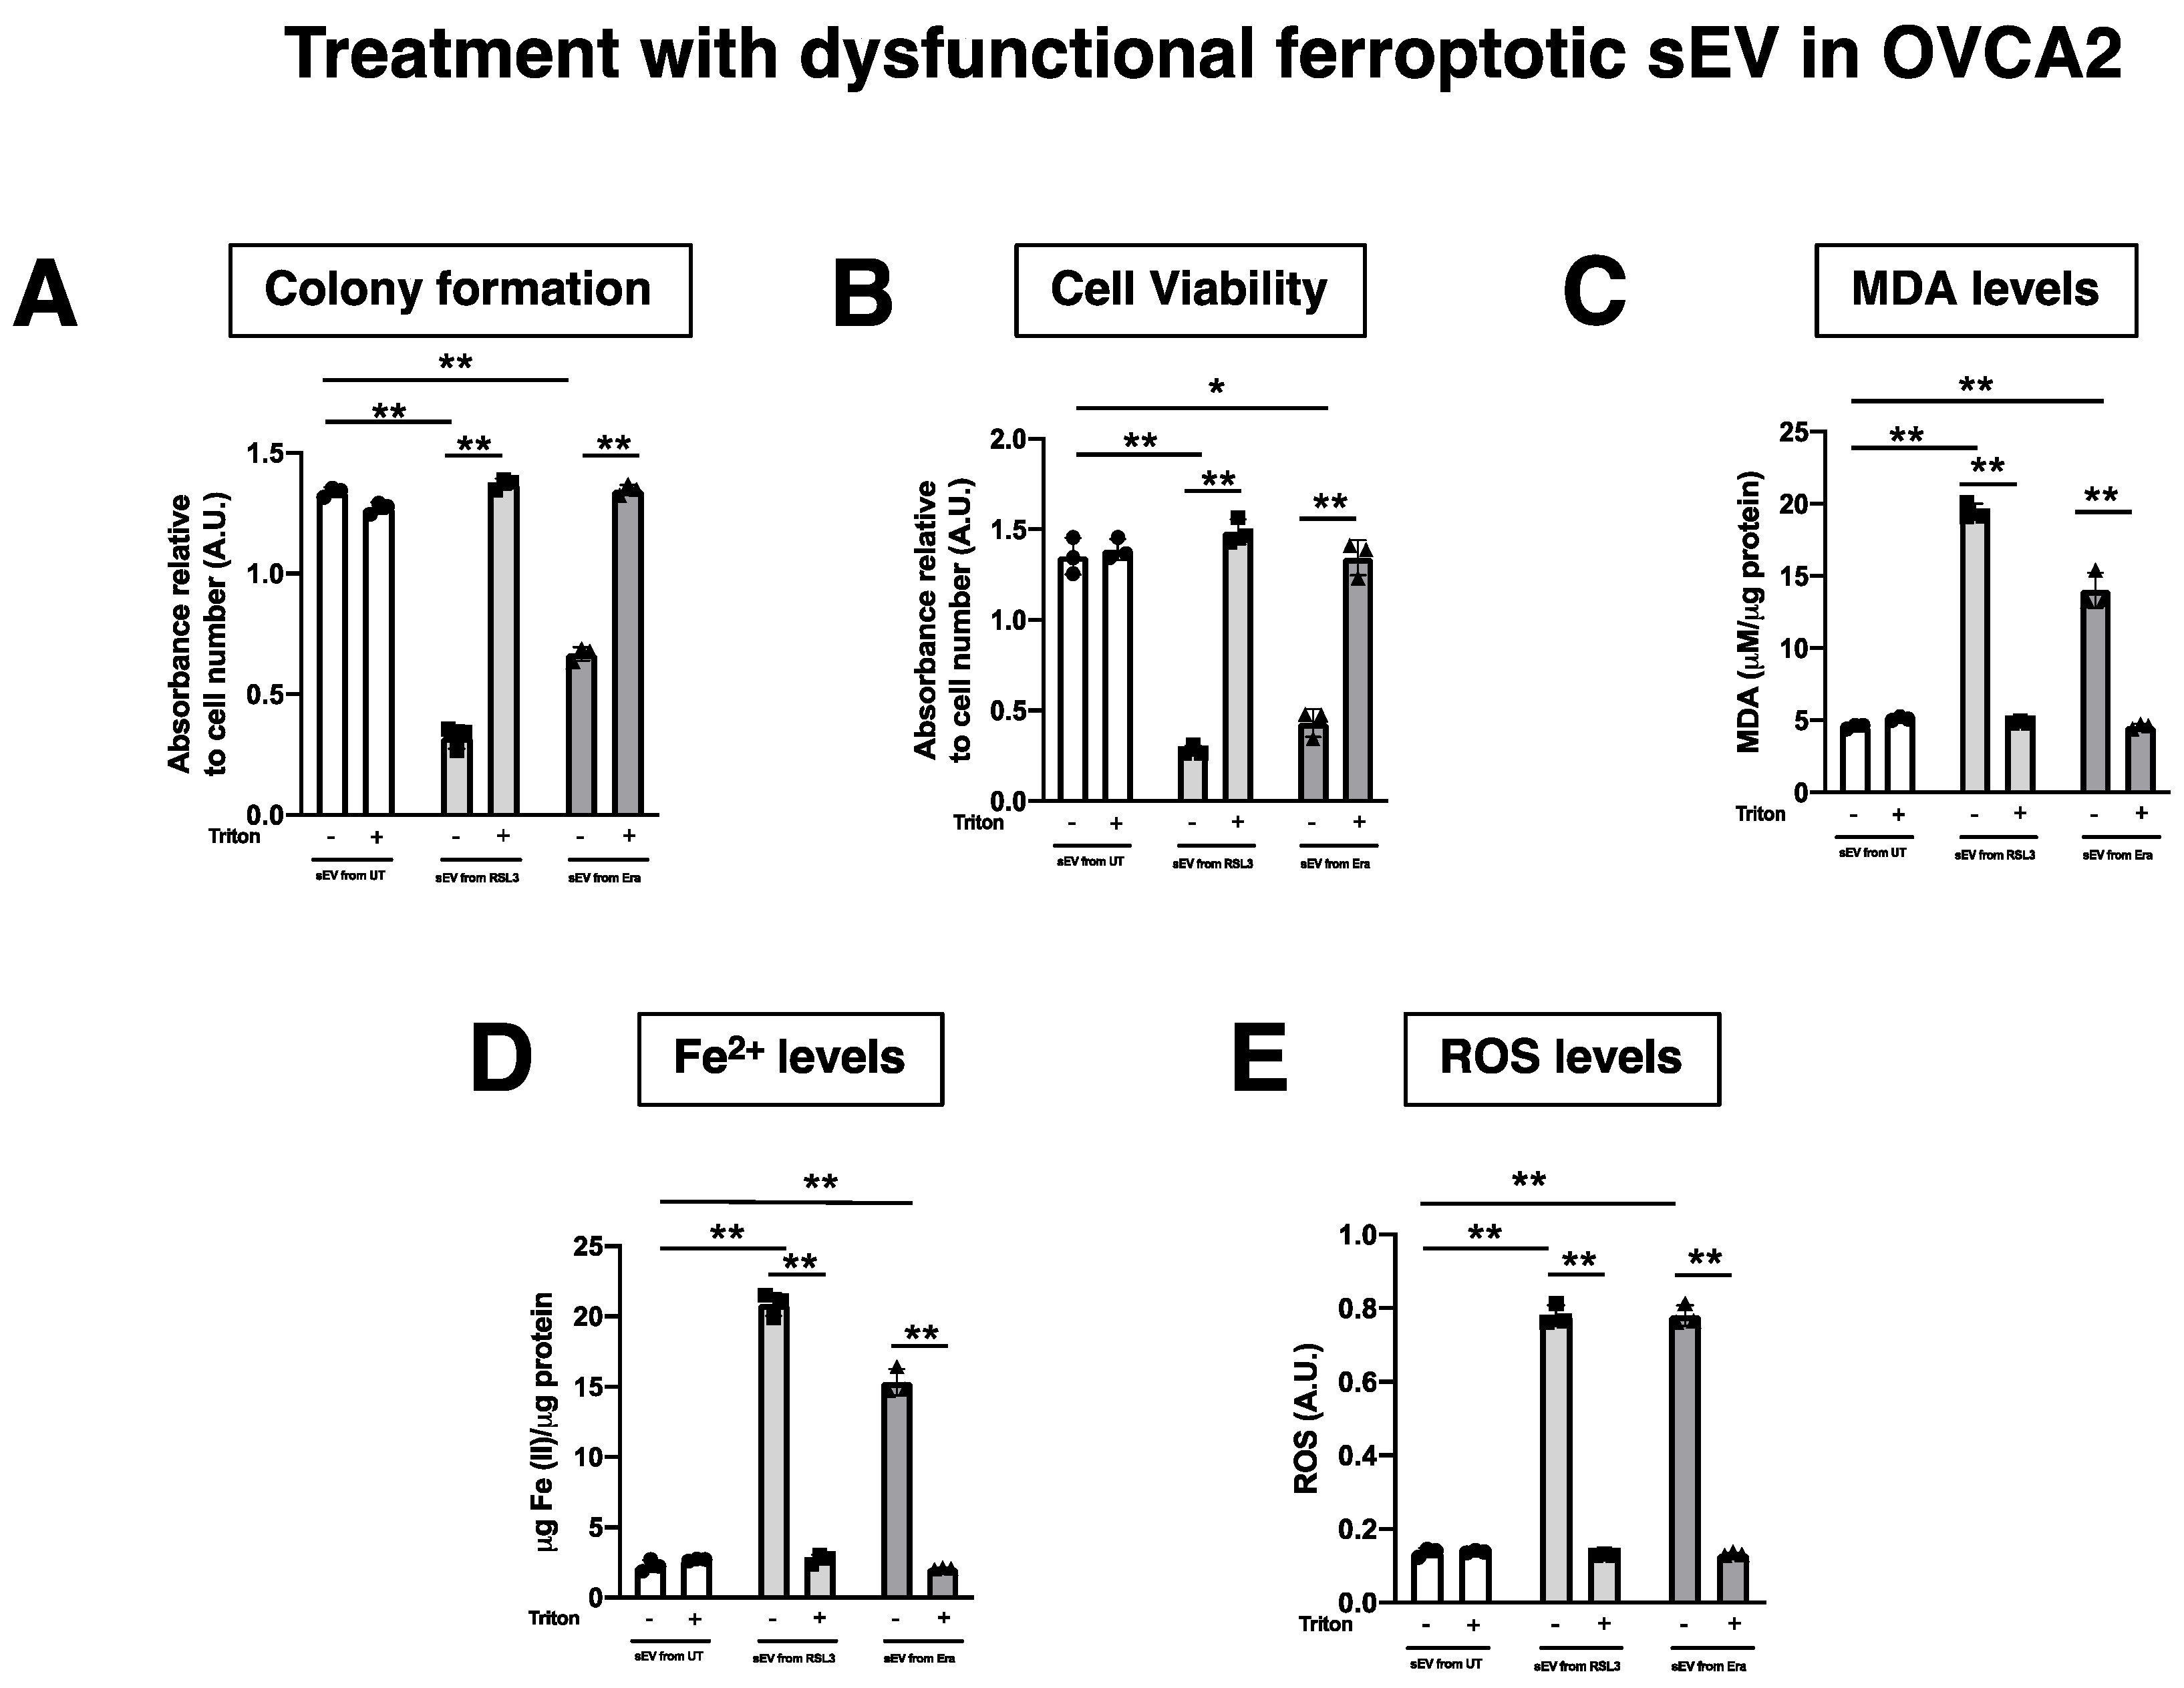
Figure 8.
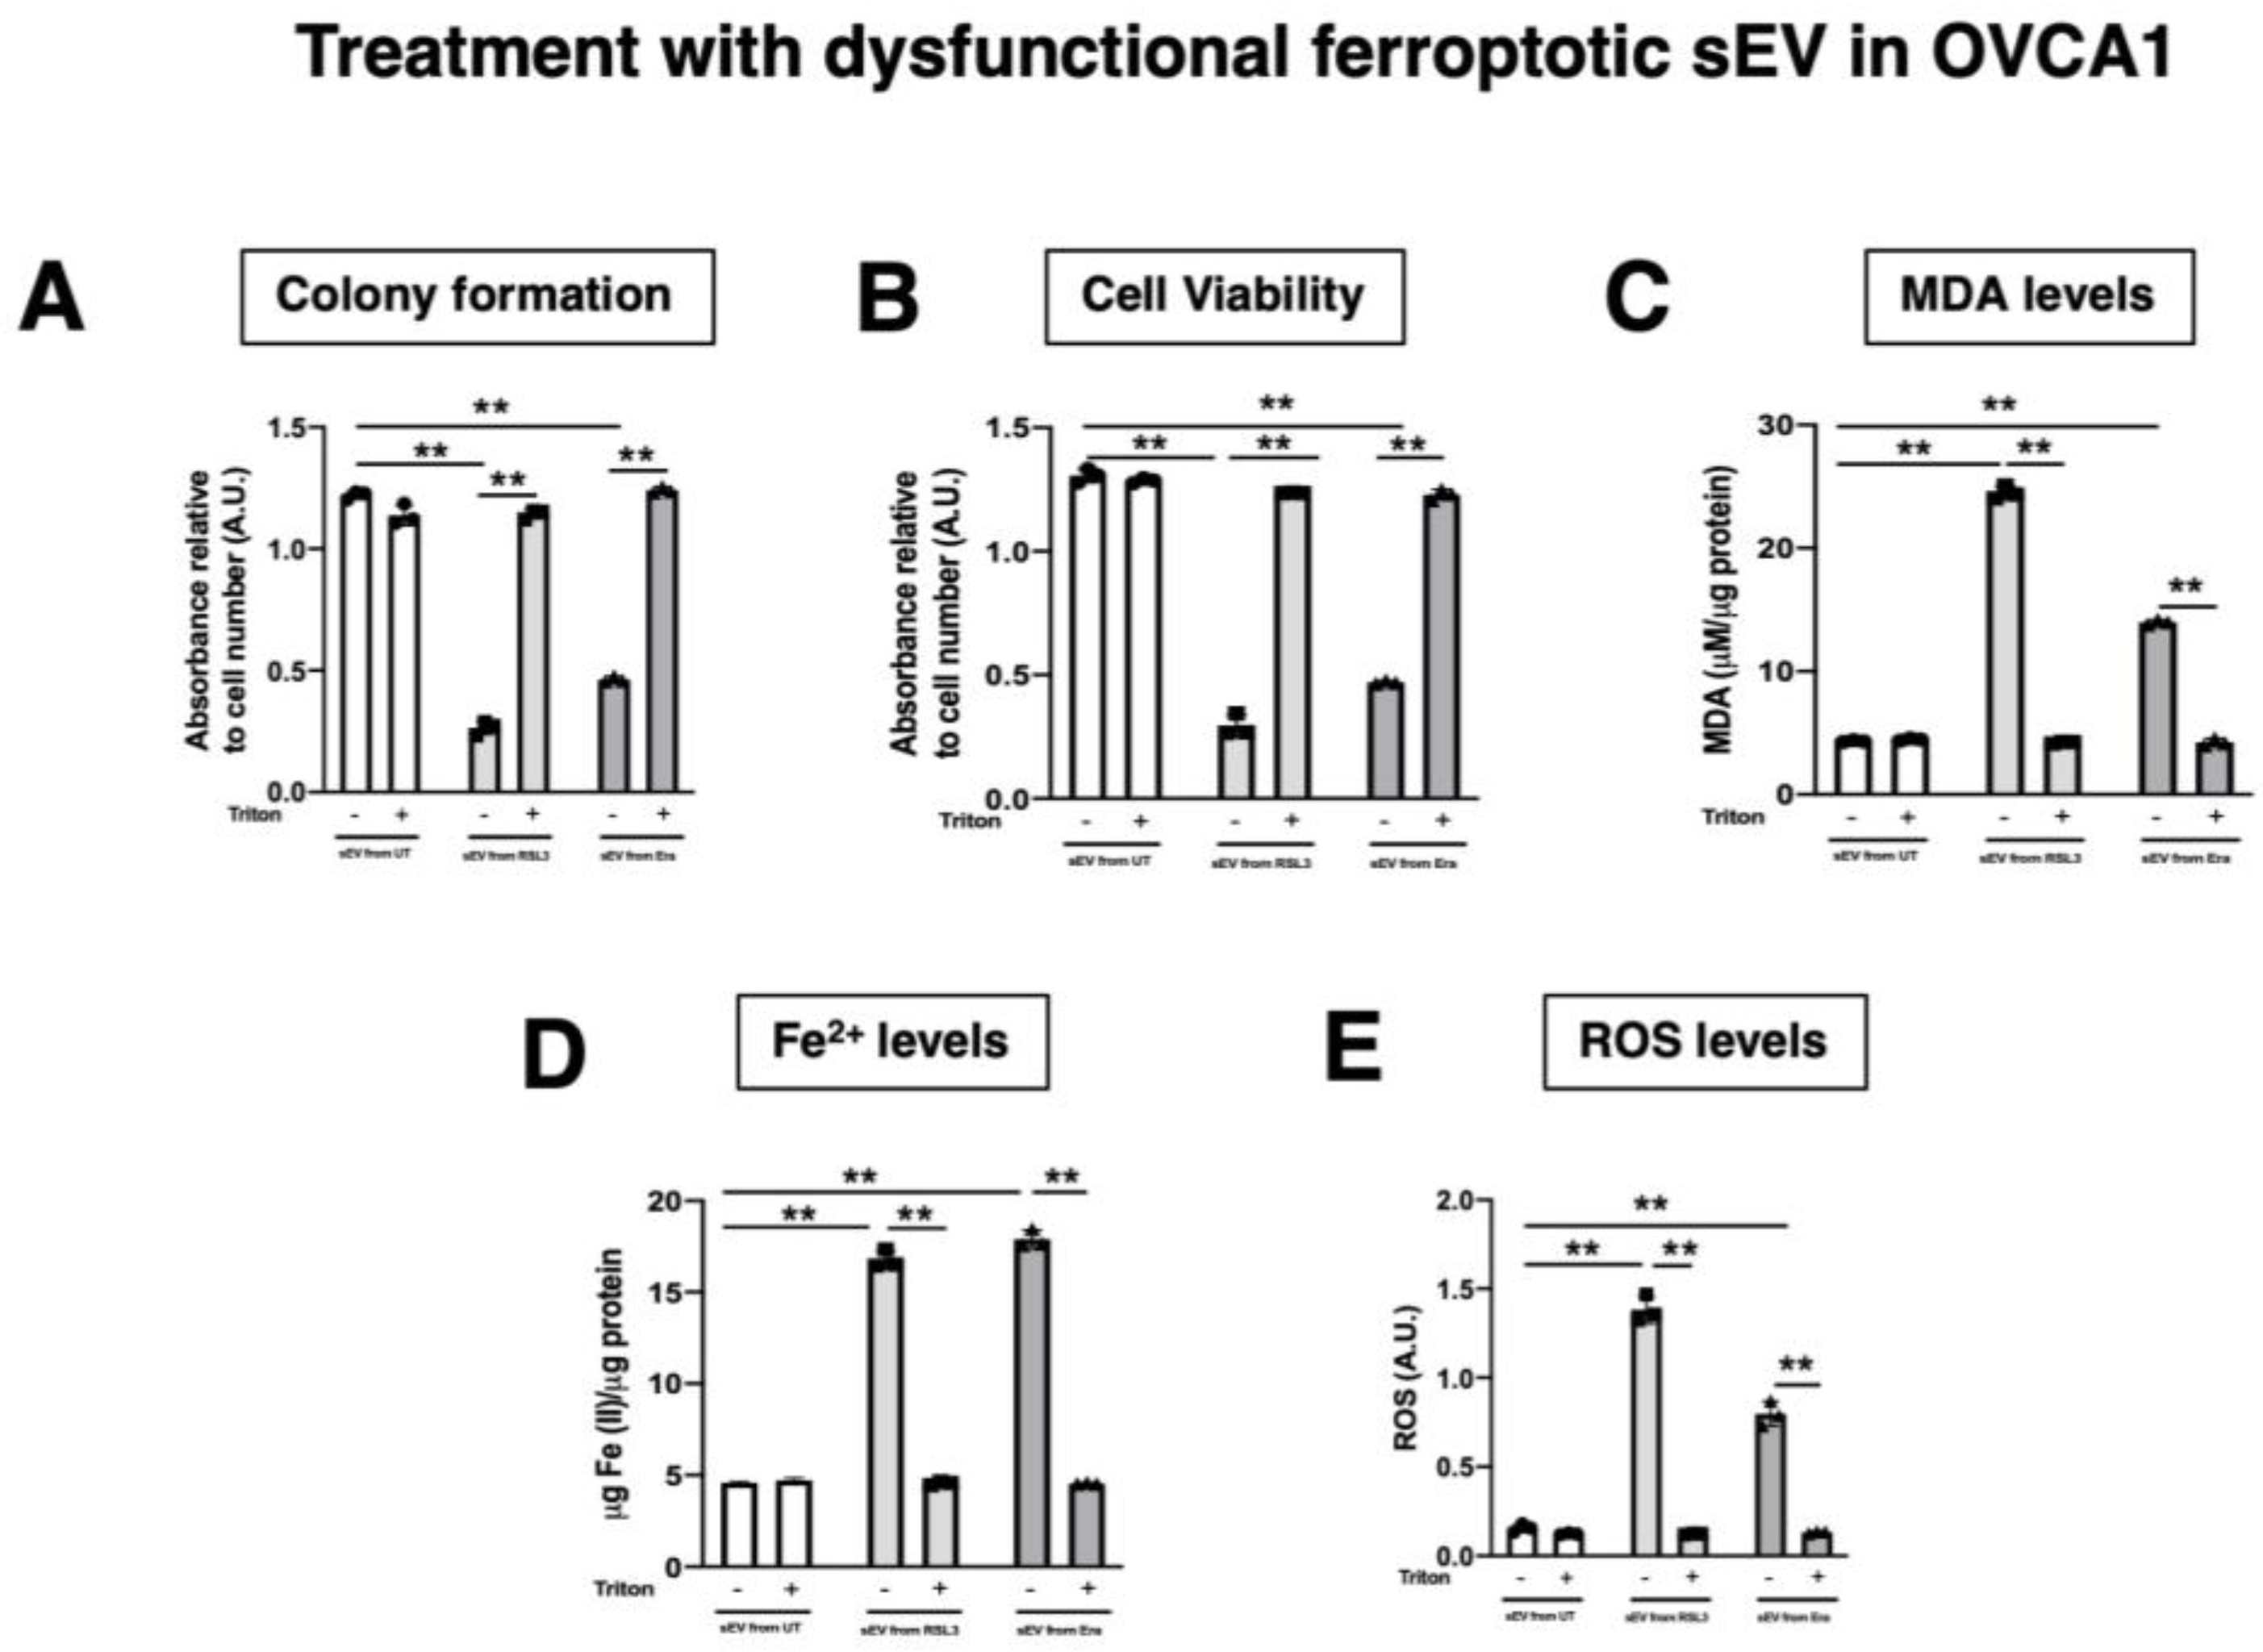
Determination inhibition of ferroptosis paracrine transmission using defunctionalized sEV by Triton-X. (A) Histogram of colony formation in OVCAc treated with sEV from F-OVCAc for 6 days using crystal violet assay; (B) Histogram of cell viability using MTT assay in OVCAc treated with sEV with/without pre-treatment with Triton-X from F-OVCAc for 6 days in OVCA1; (C) Histogram of Malondialdehyde (MDA) levels in OVCAc treated with sEV with/without pre-treatment with Triton-X from F-OVCAc for 6 days in OVCA1; (D) Histogram of Iron (II) (Fe2+) levels in OVCAc treated with sEV with/without pre-treatment with Triton-X from F-OVCAc for 6 days in OVCA1; (E) Histogram of reactive oxygen species (ROS) levels in OVCAc treated sEV with/without pre-treatment with Triton-X from F-OVCAc for 6 days in OVCA1. The graphs show the mean ± SD of three independent experiments. ** p < 0.01.
Figure 8.
Determination inhibition of ferroptosis paracrine transmission using defunctionalized sEV by Triton-X. (A) Histogram of colony formation in OVCAc treated with sEV from F-OVCAc for 6 days using crystal violet assay; (B) Histogram of cell viability using MTT assay in OVCAc treated with sEV with/without pre-treatment with Triton-X from F-OVCAc for 6 days in OVCA1; (C) Histogram of Malondialdehyde (MDA) levels in OVCAc treated with sEV with/without pre-treatment with Triton-X from F-OVCAc for 6 days in OVCA1; (D) Histogram of Iron (II) (Fe2+) levels in OVCAc treated with sEV with/without pre-treatment with Triton-X from F-OVCAc for 6 days in OVCA1; (E) Histogram of reactive oxygen species (ROS) levels in OVCAc treated sEV with/without pre-treatment with Triton-X from F-OVCAc for 6 days in OVCA1. The graphs show the mean ± SD of three independent experiments. ** p < 0.01.
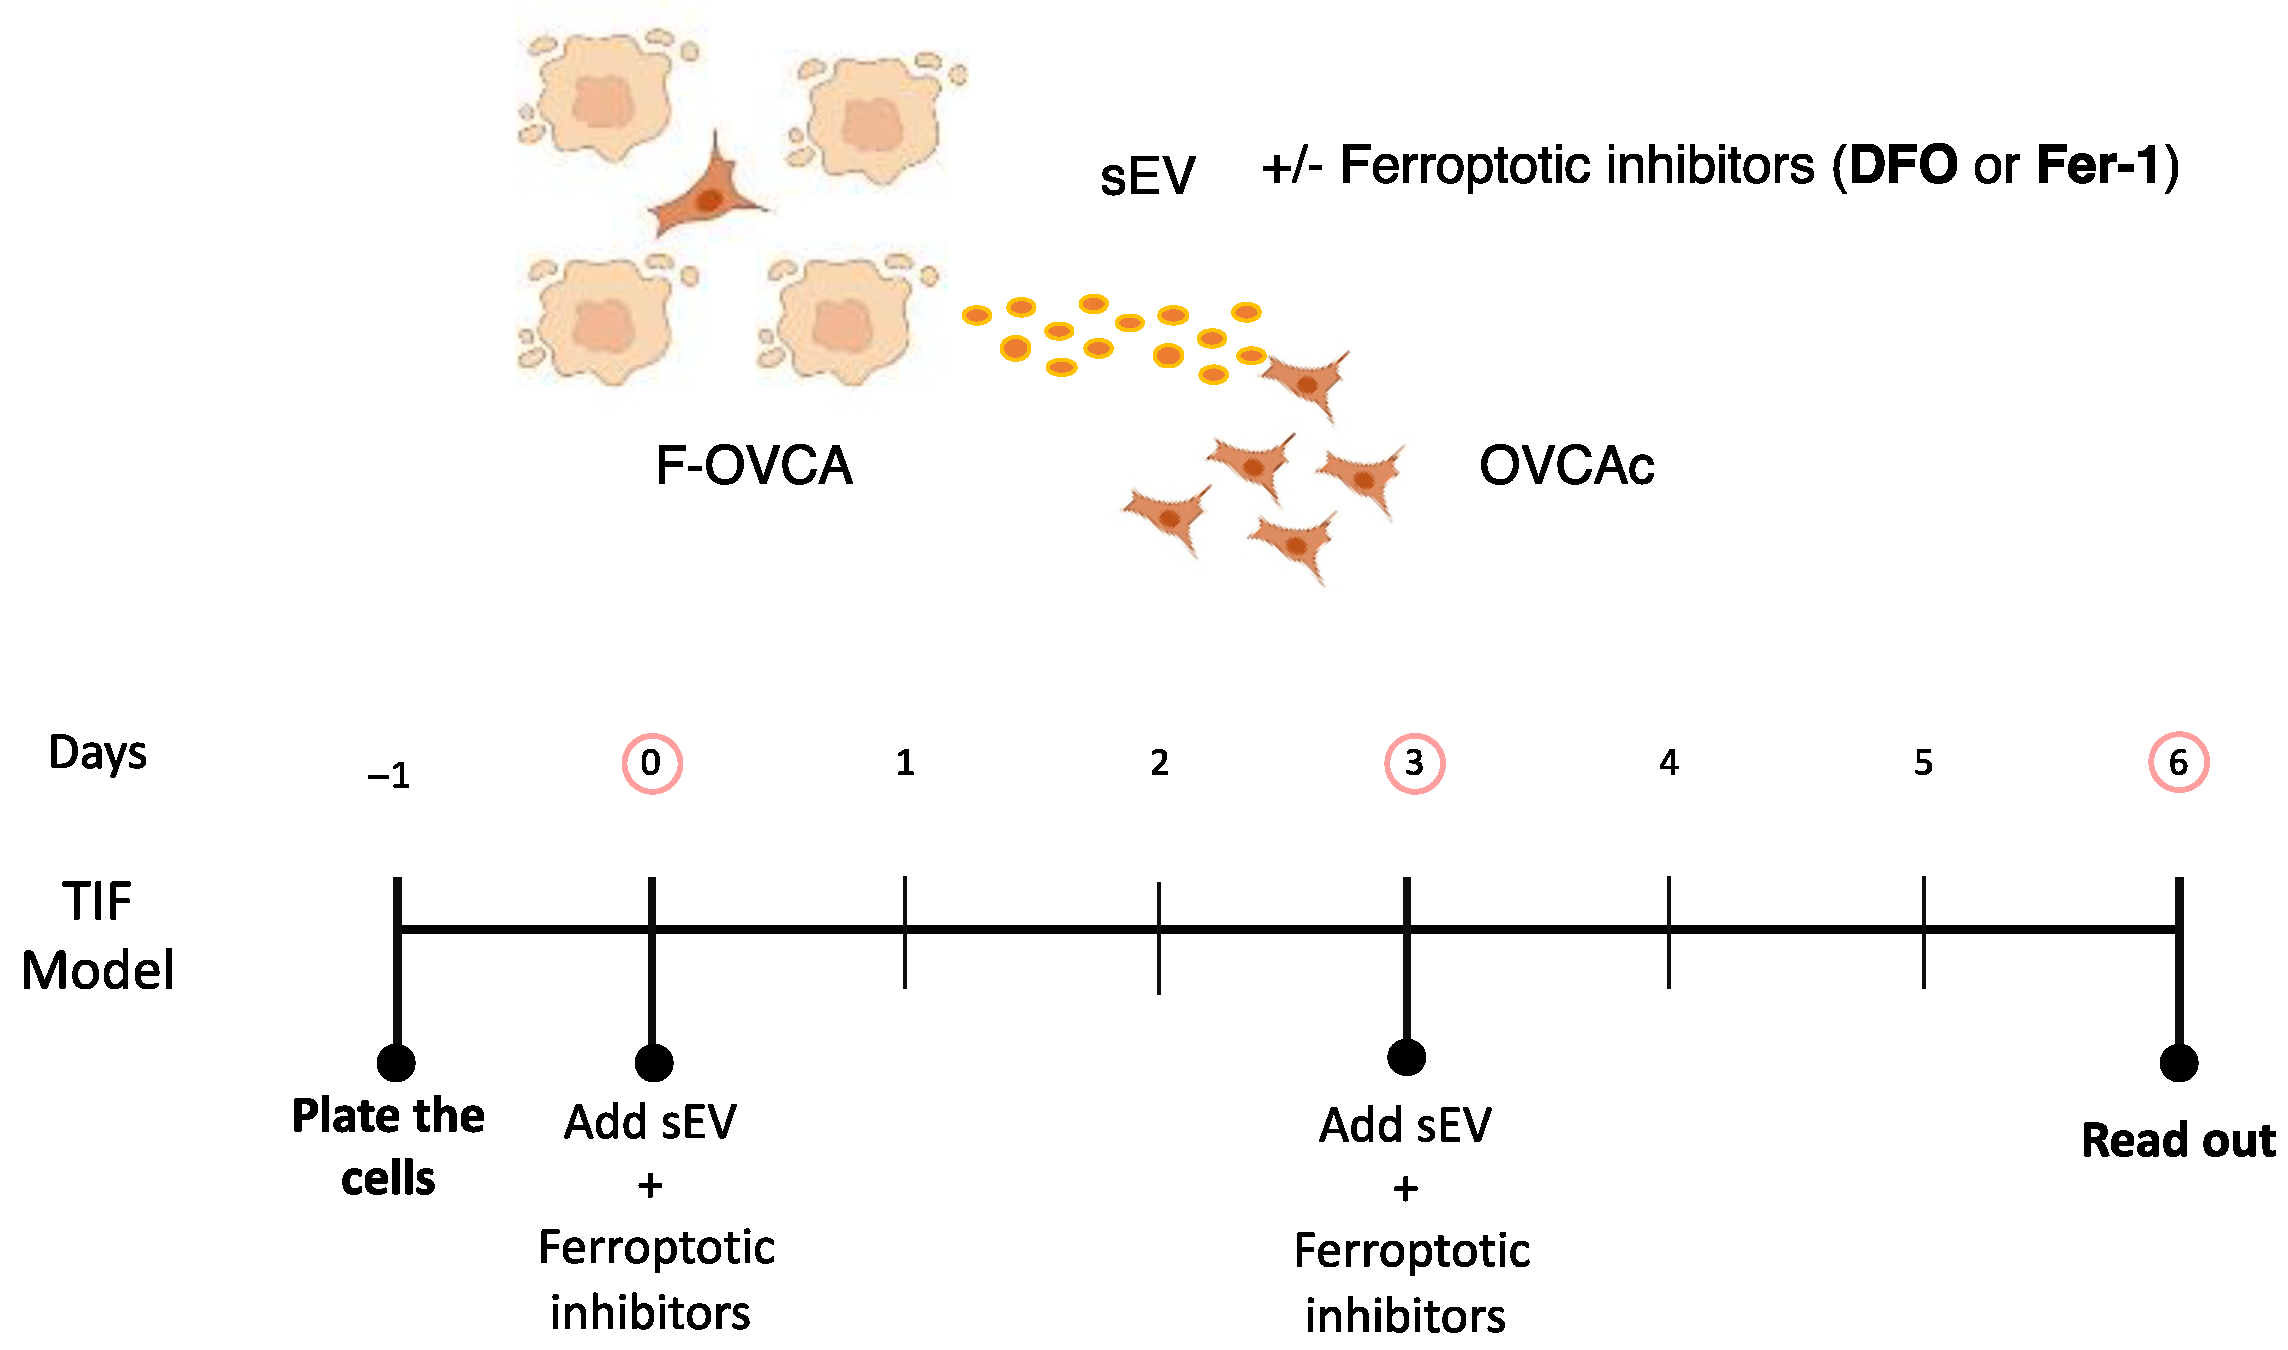
Figure 9.
Schematic representation of ferroptotic paracrine through sEV inhibition.
Figure 9.
Schematic representation of ferroptotic paracrine through sEV inhibition.
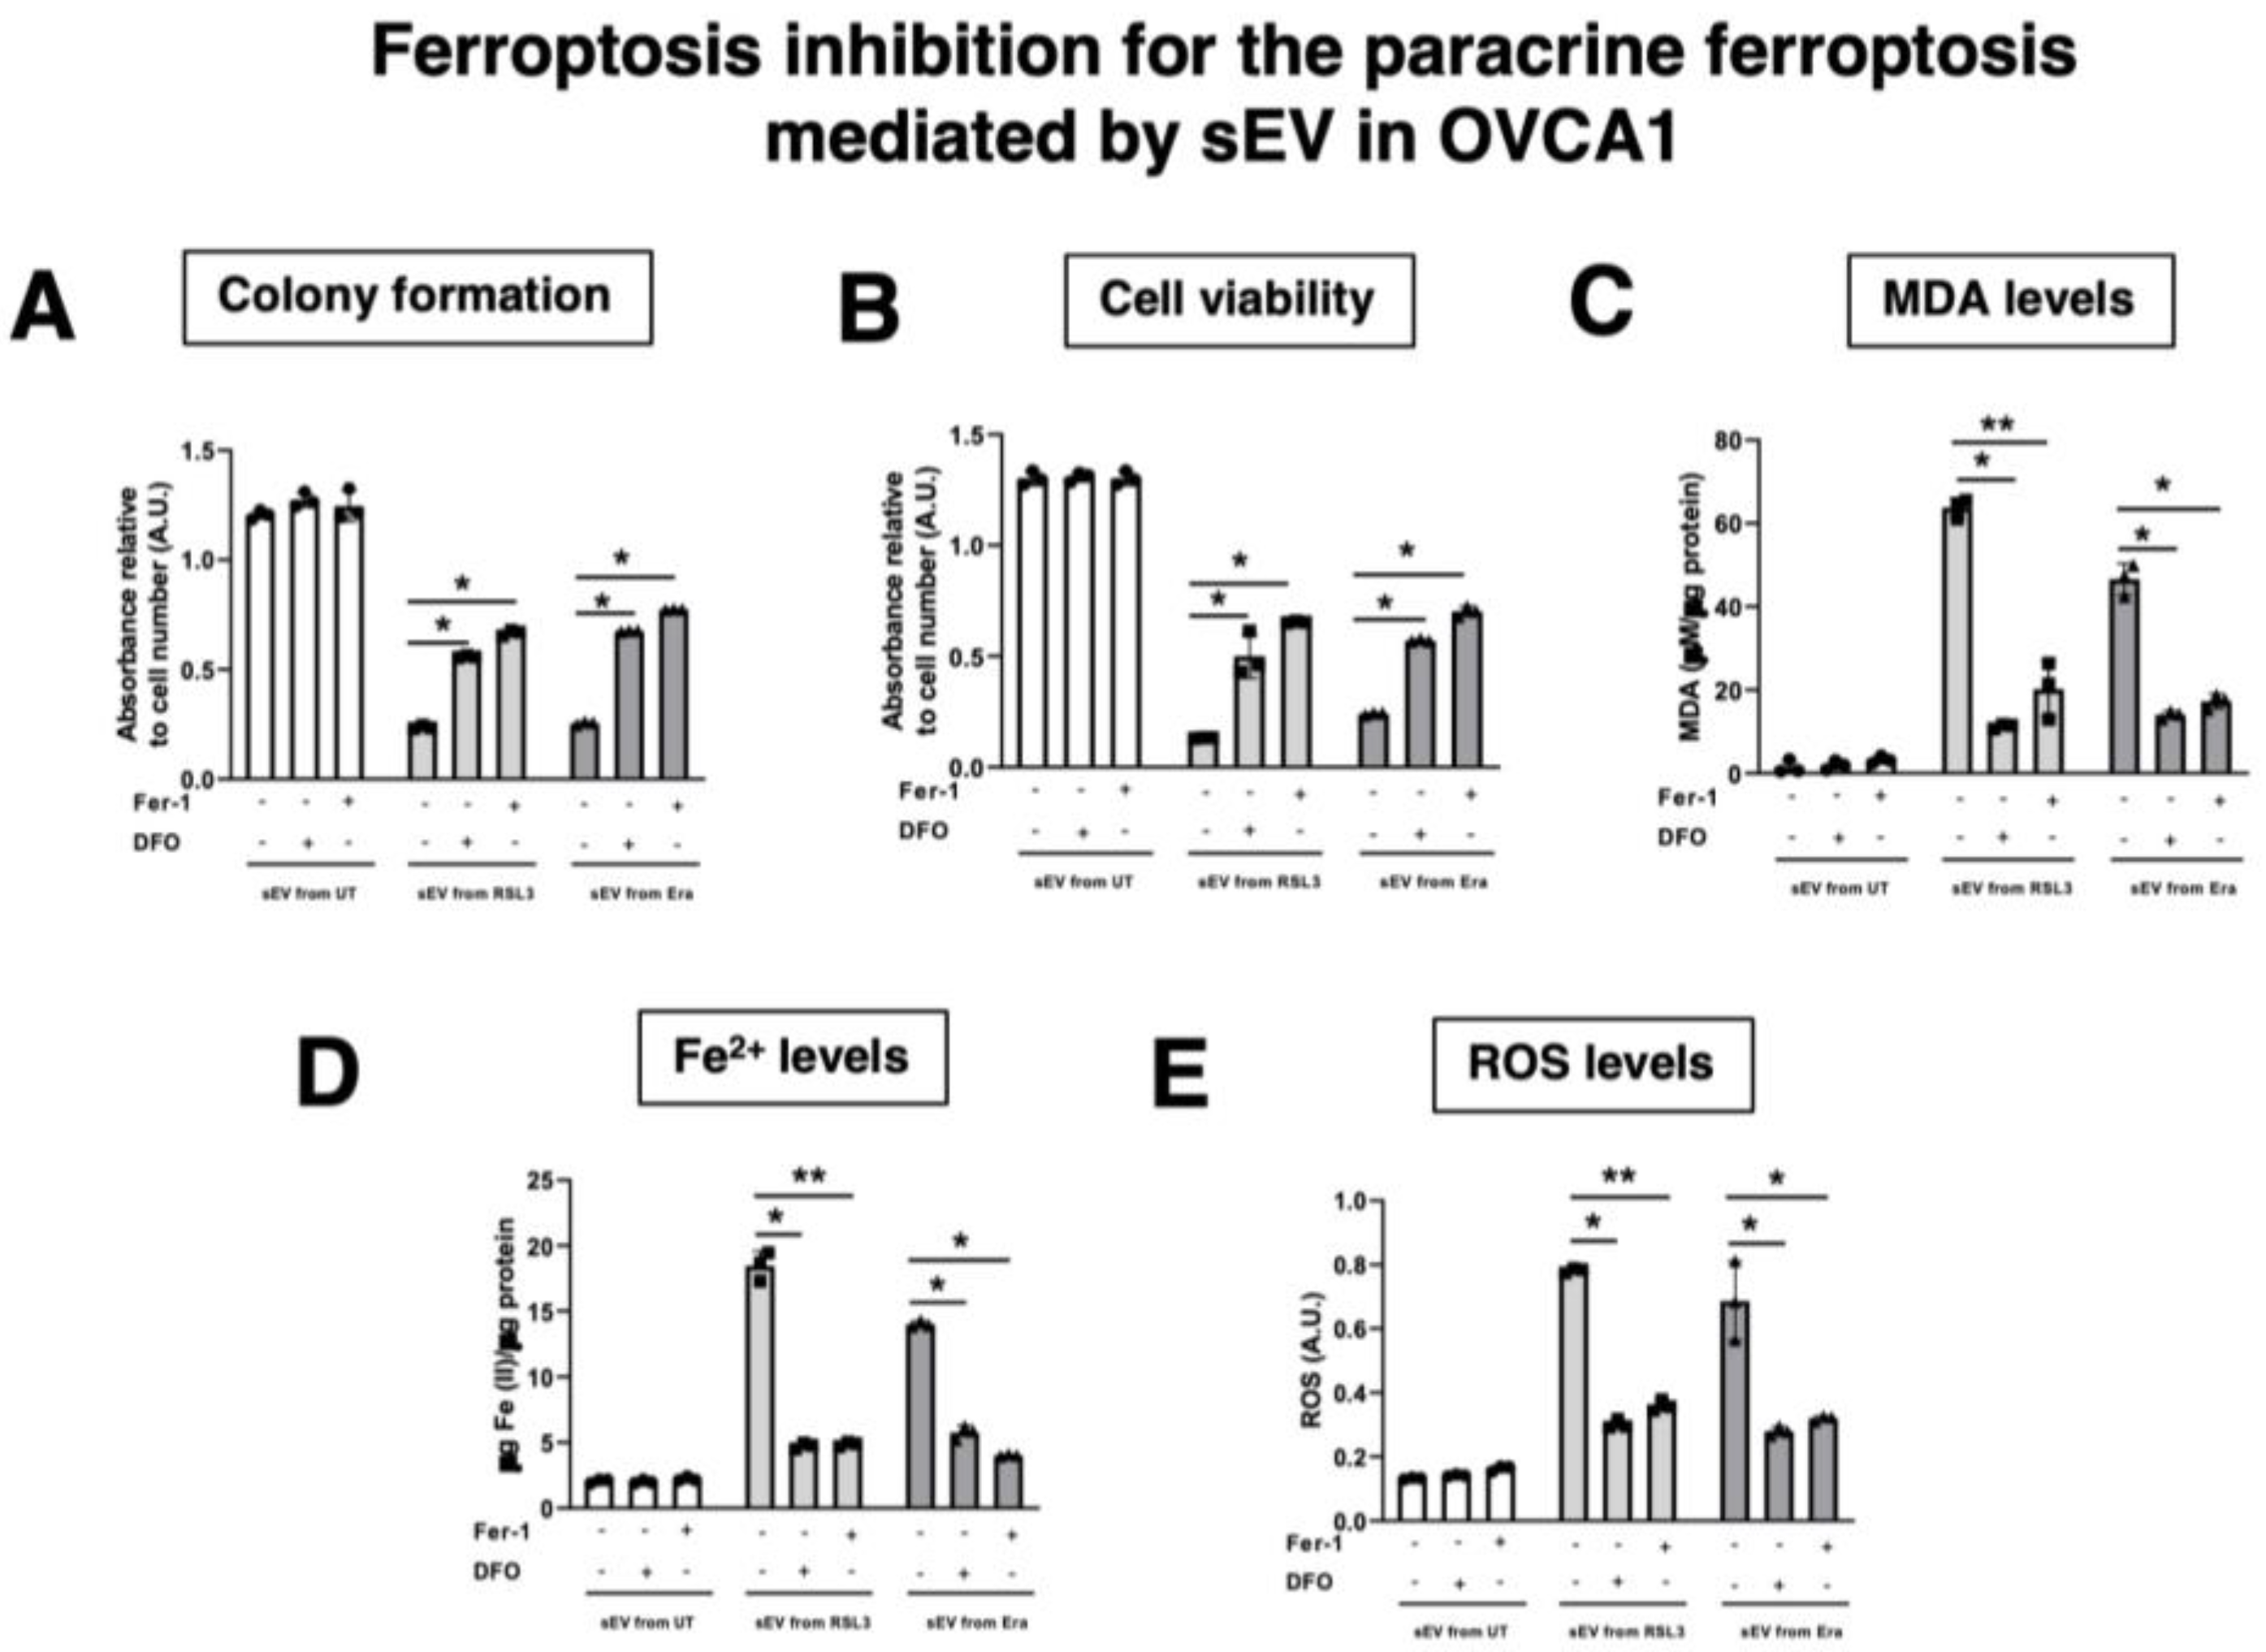
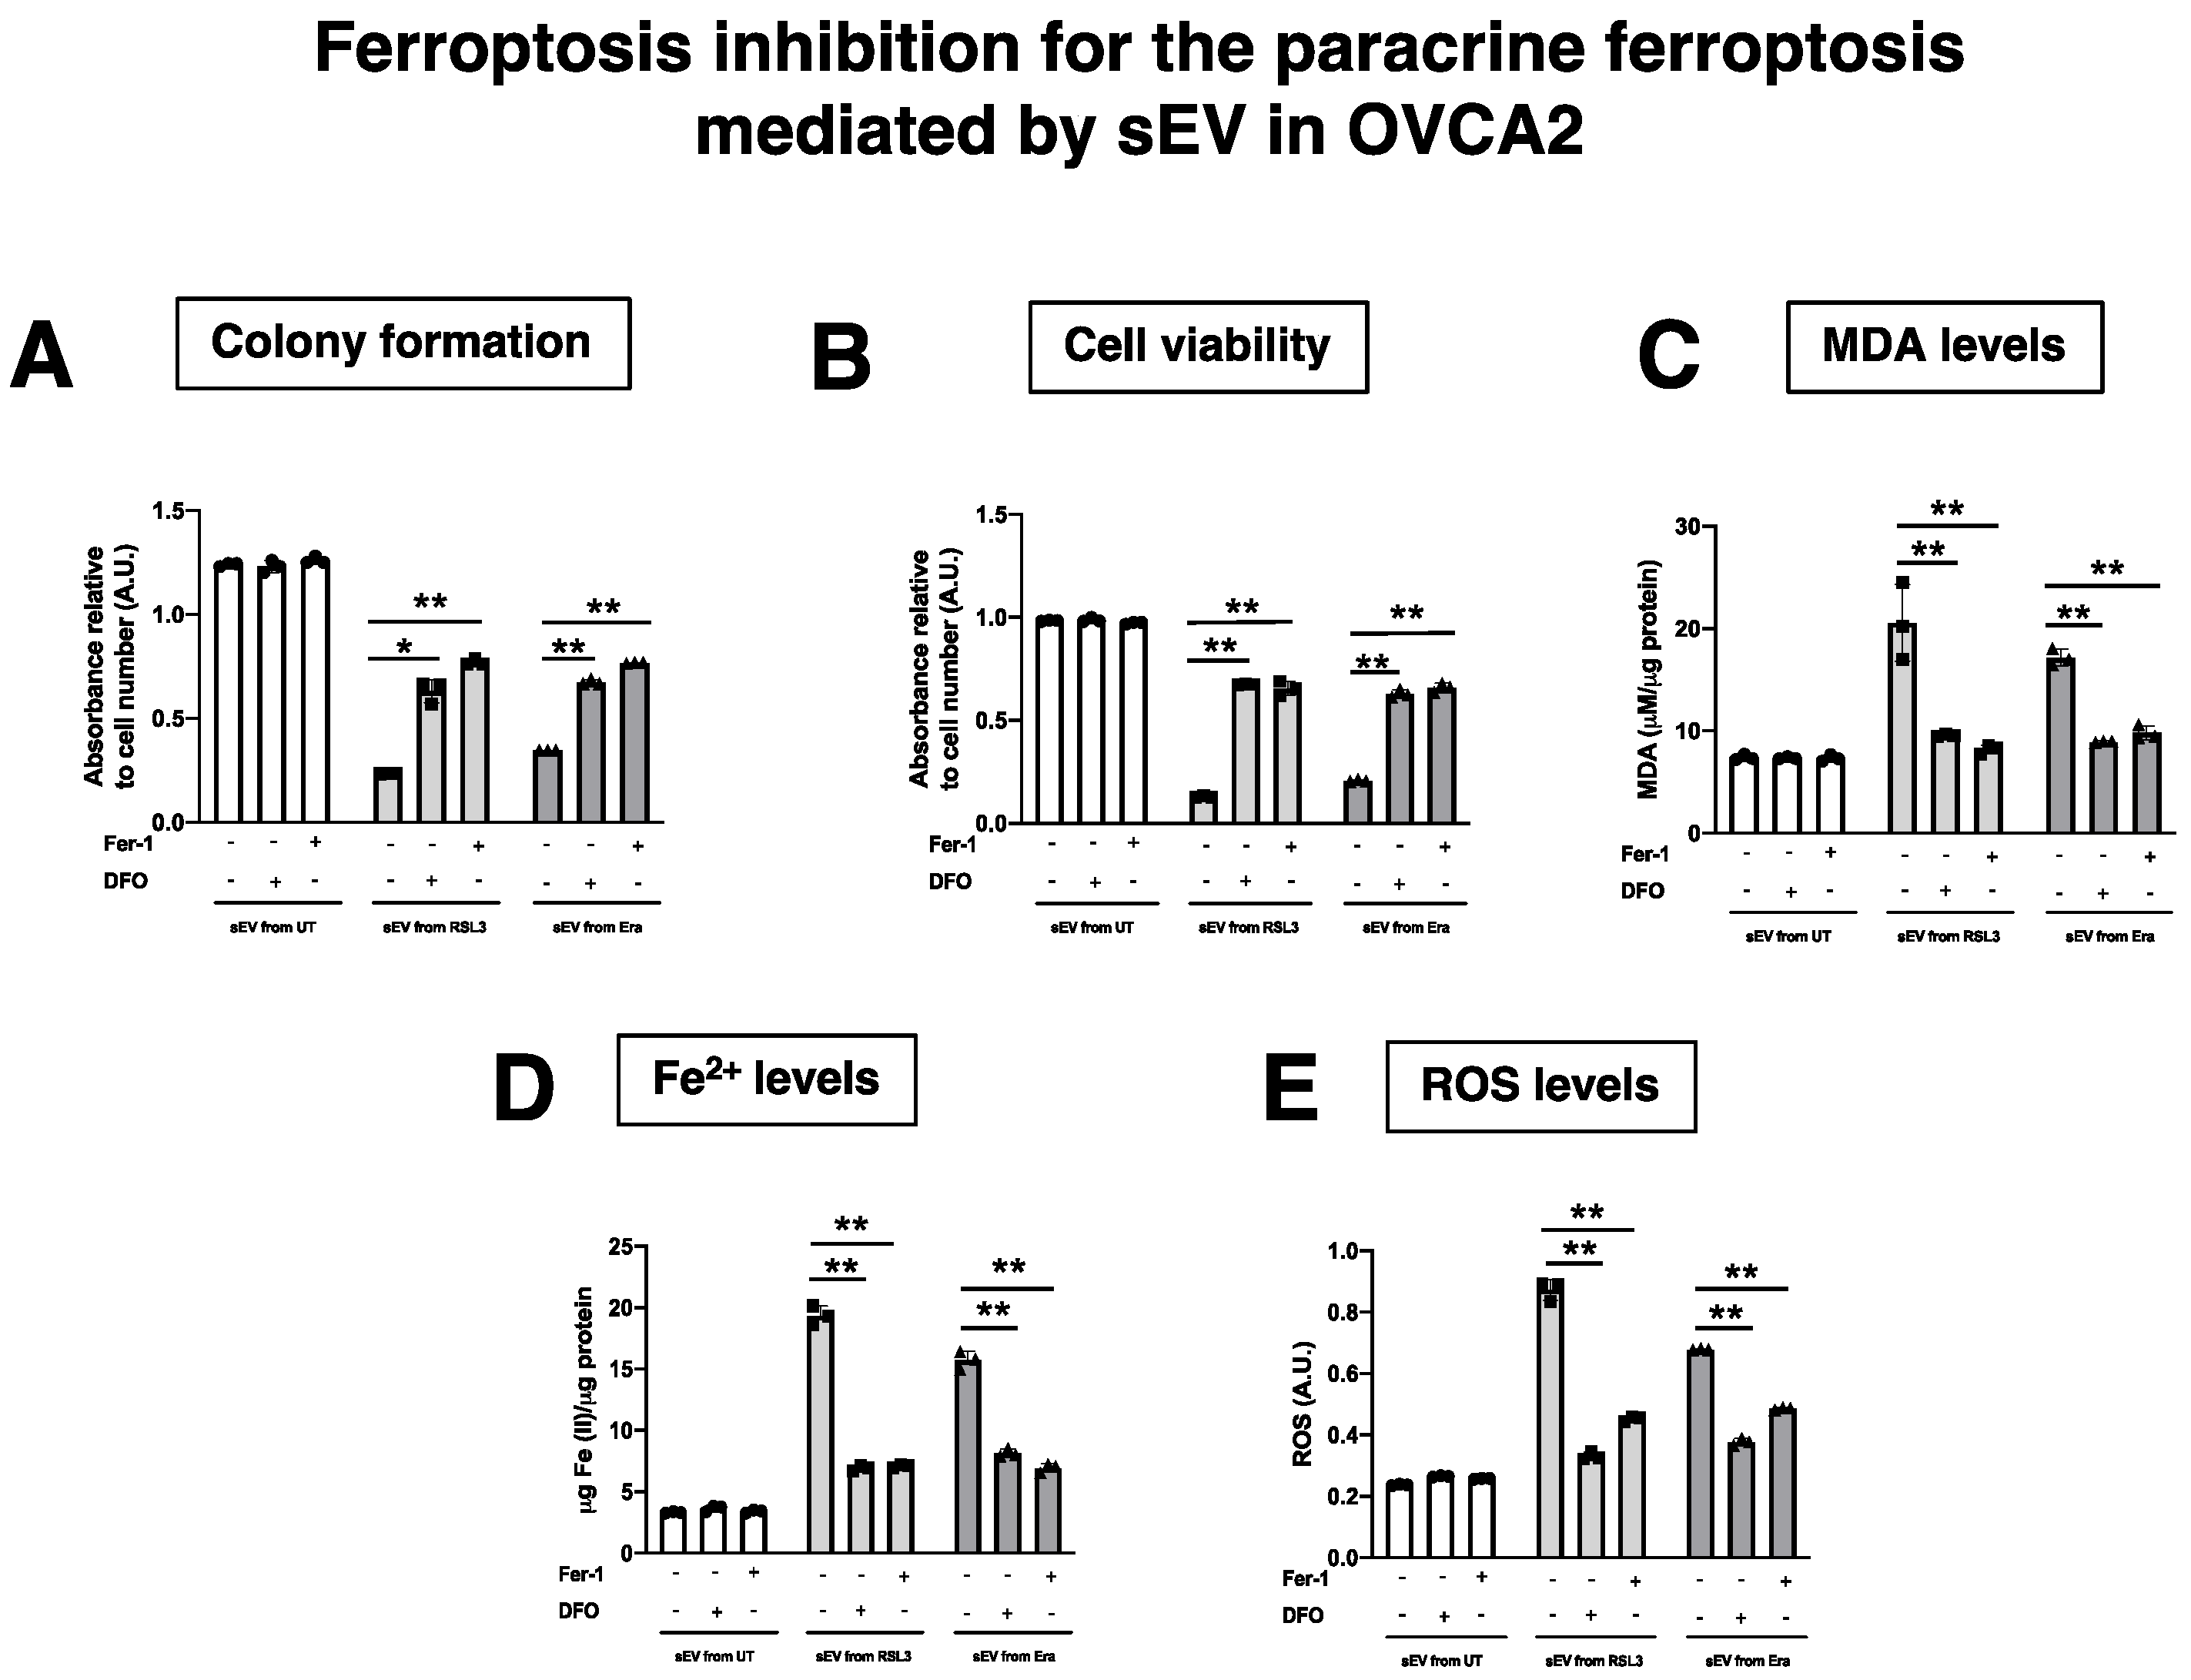
Figure 10.
Determination inhibition for ferroptosis paracrine transmission by sEV in OVCAc. (A) Histogram of colony formation in OVCAc treated with sEV from F-OVCAc for 6 days using crystal violet assay; (B) Histogram of cell viability using MTT assay in OVCAc treated with sEV from F-OVCAc with/without ferroptotic inhibitors (Ferrostatin-1 (Fer-1) and Deferoxamine (DFO)) for 6 days in OVCA1; (C) Histogram of Malondialdehyde (MDA) levels in OVCAc treated with sEV from F-OVCAc with/without ferroptotic inhibitors (Fer-1 and DFO) for 6 days in OVCA1; (D) Histogram of Iron (II) (Fe2+) levels in OVCAc treated with sEV from F-OVCAc with/without ferroptotic inhibitors (Fer-1 and DFO) for 6 days in OVCA1; (E) Histogram of reactive oxygen species (ROS) levels in OVCAc treated with sEV from F-OVCAc with/without ferroptotic inhibitors (Fer-1 and DFO) for 6 days in OVCA1. The graphs show the mean ± SD of three independent experiments. * p < 0.05 and ** p < 0.01.
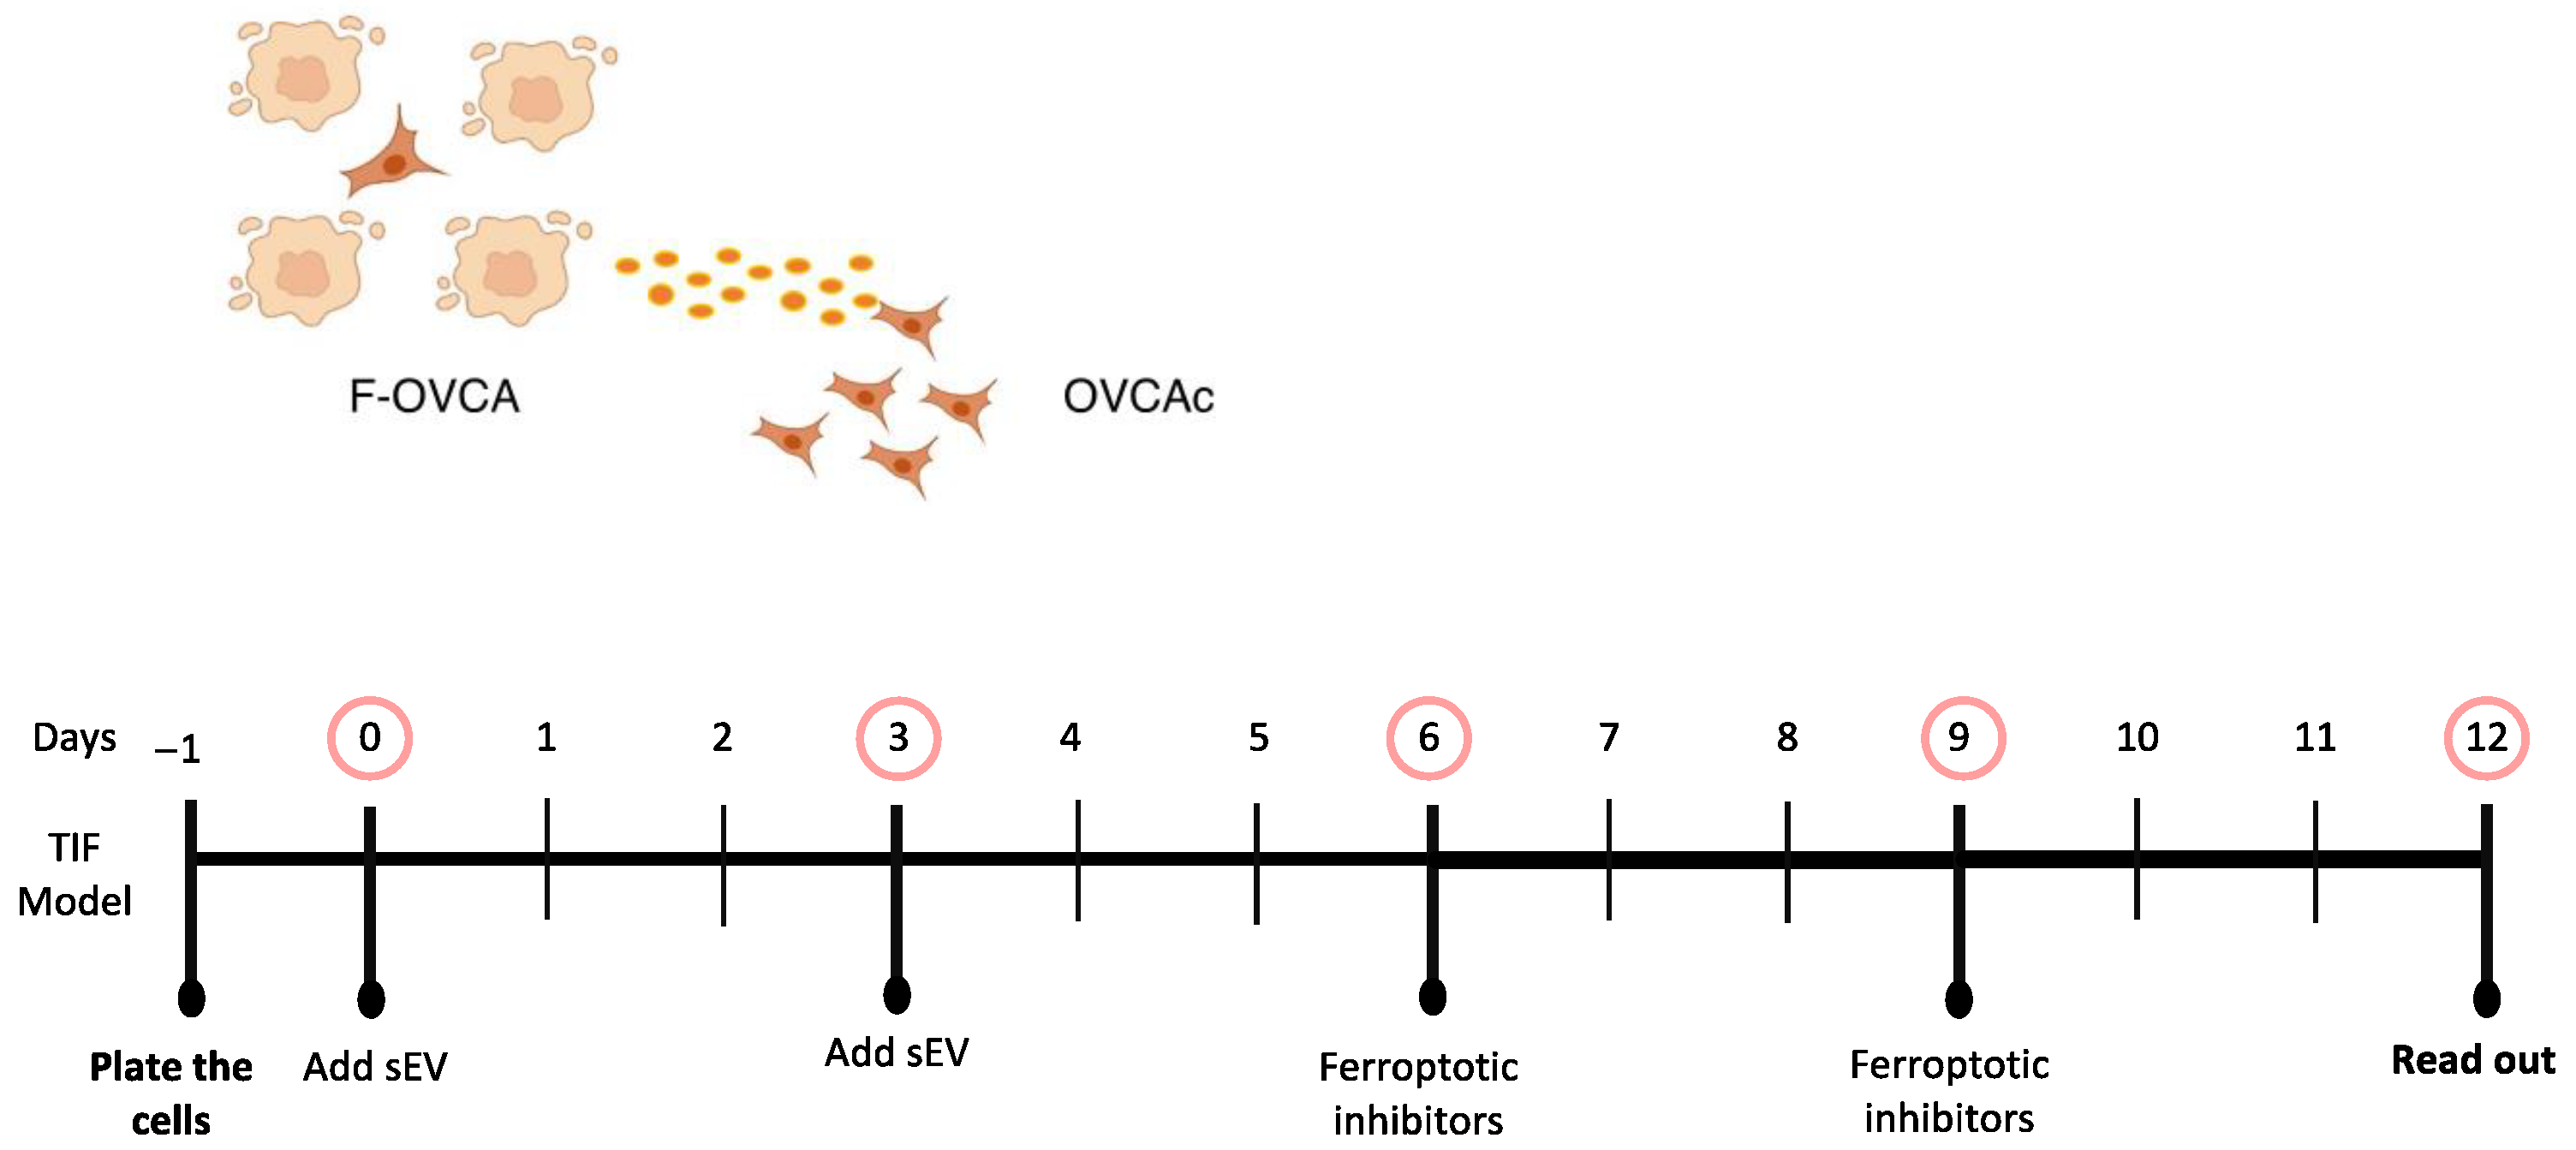
Figure 11.
Schematic representation of ferroptotic paracrine through sEV inhibition after starting the process.
Figure 11.
Schematic representation of ferroptotic paracrine through sEV inhibition after starting the process.
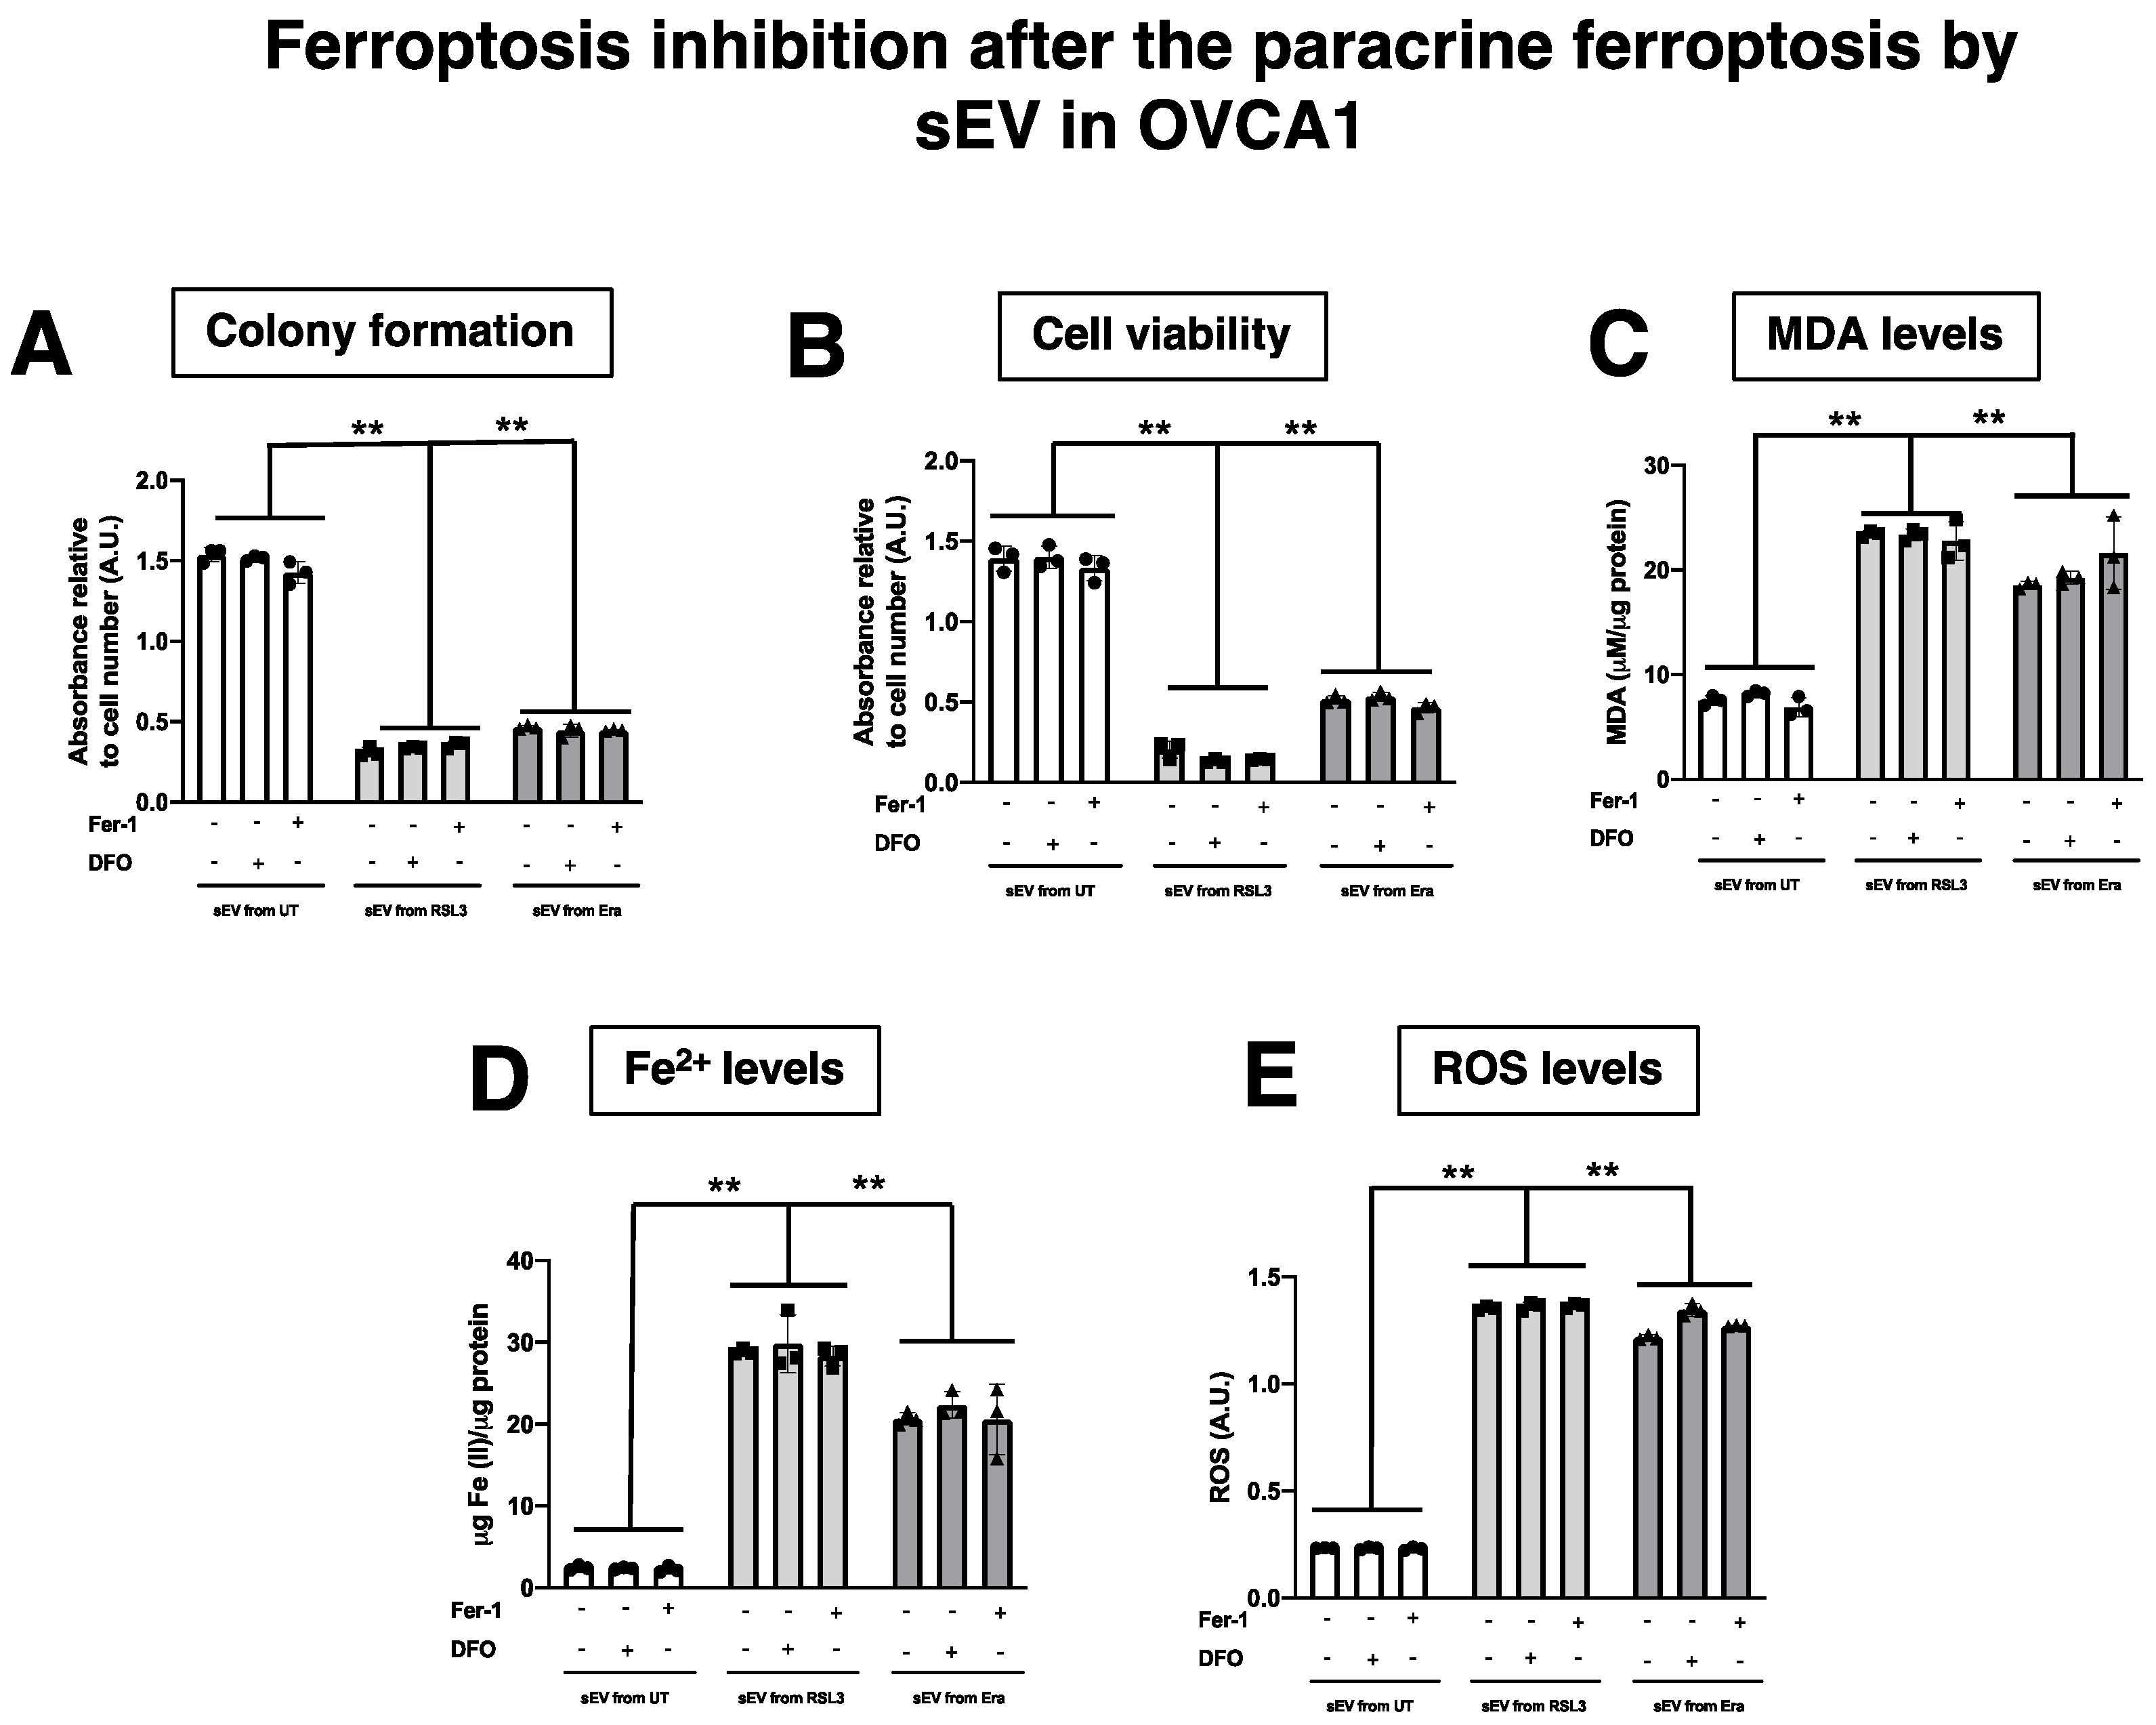
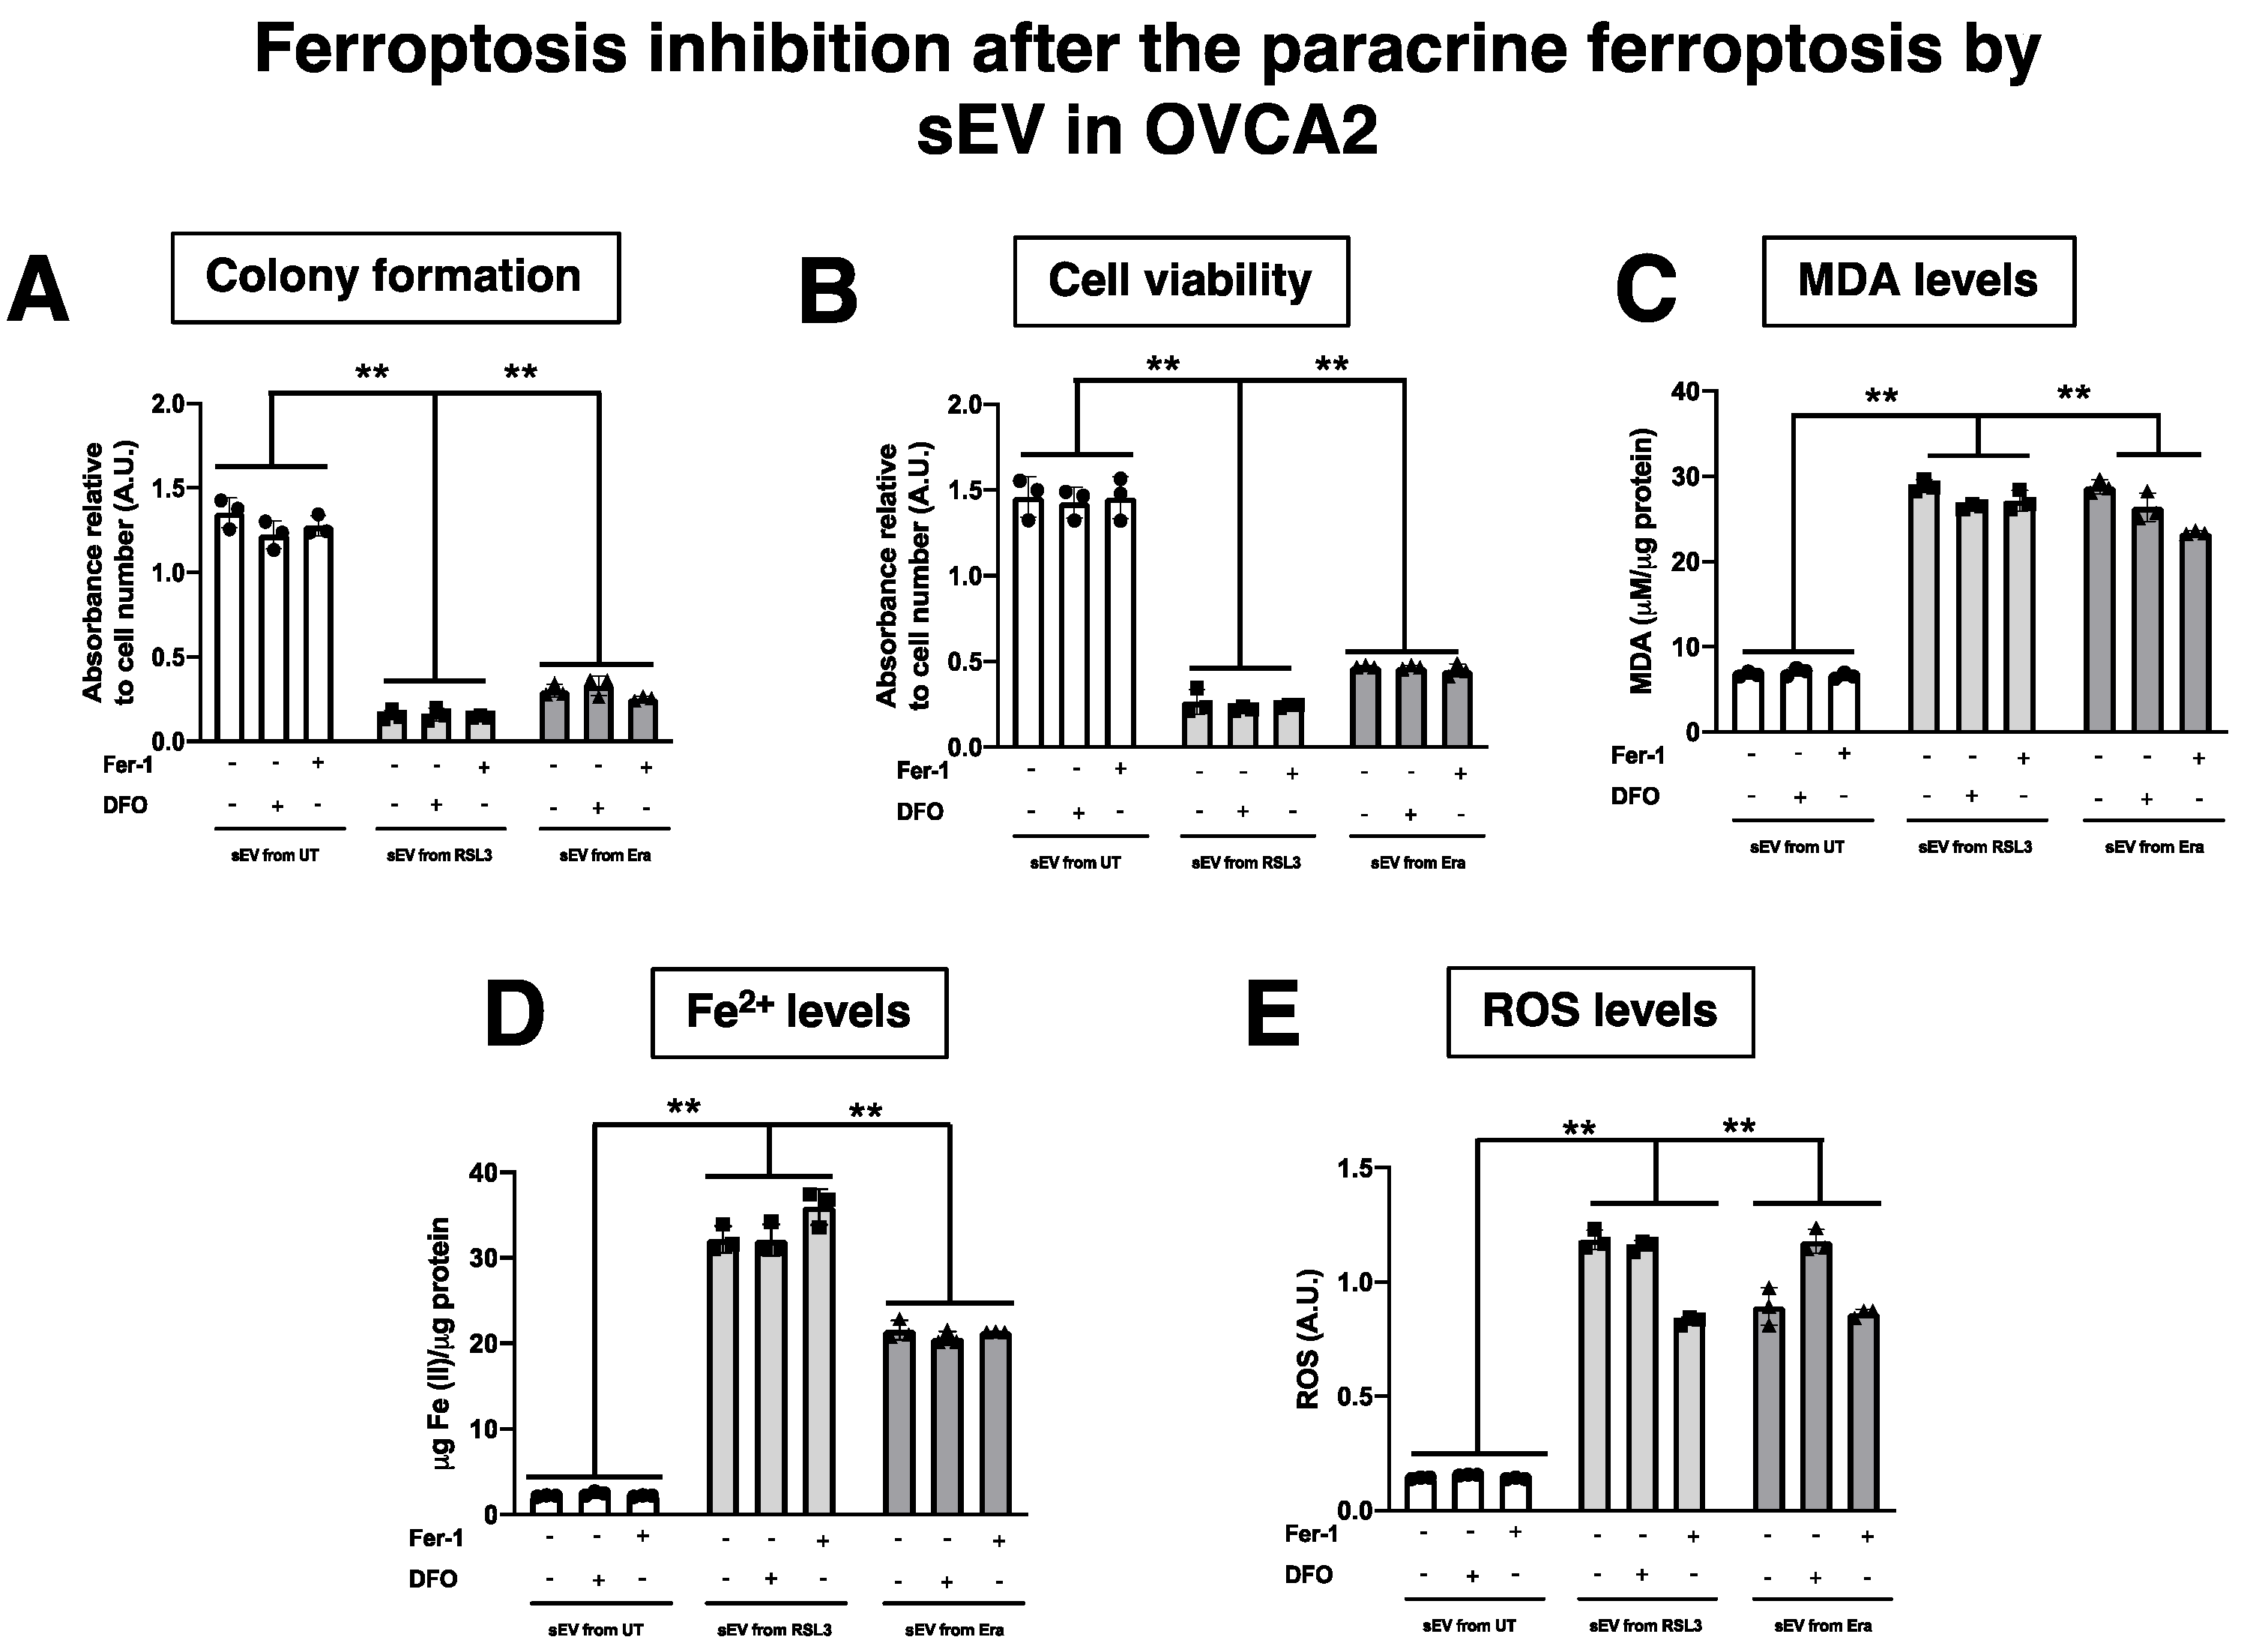
Figure 12.
Determination inhibition after the ferroptosis paracrine transmission by sEV in OVCAc. (A) Histogram of colony formation using crystal violet assay and (B) Histogram of cell viability using MTT assay in OVCAc treated with sEV from F-OVCAc for 6 days and with/without ferroptotic inhibitors (Ferrostatin-1 (Fer-1) and Deferoxamine (DFO)) for 6 days in OVCA1; (C) Histogram of Malondialdehyde (MDA) levels in OVCAc treated with sEV from F-OVCAc for 6 days and with/without ferroptotic inhibitors (Fer-1 and DFO) for 6 days in OVCA1; (D) Histogram of Iron (II) (Fe2+) levels in OVCAc treated with sEV from F-OVCAc for 6 days and with/without ferroptotic inhibitors (Fer-1 and DFO) for 6 days in OVCA1; (E) Histogram of reactive oxygen species (ROS) levels in OVCAc treated with sEV from F-OVCAc for 6 days and with/without ferroptotic inhibitors (Fer-1 and DFO) for 6 days in OVCA1. The graphs show the mean ± SD of three independent experiments. ** p < 0.01.
Figure 13.
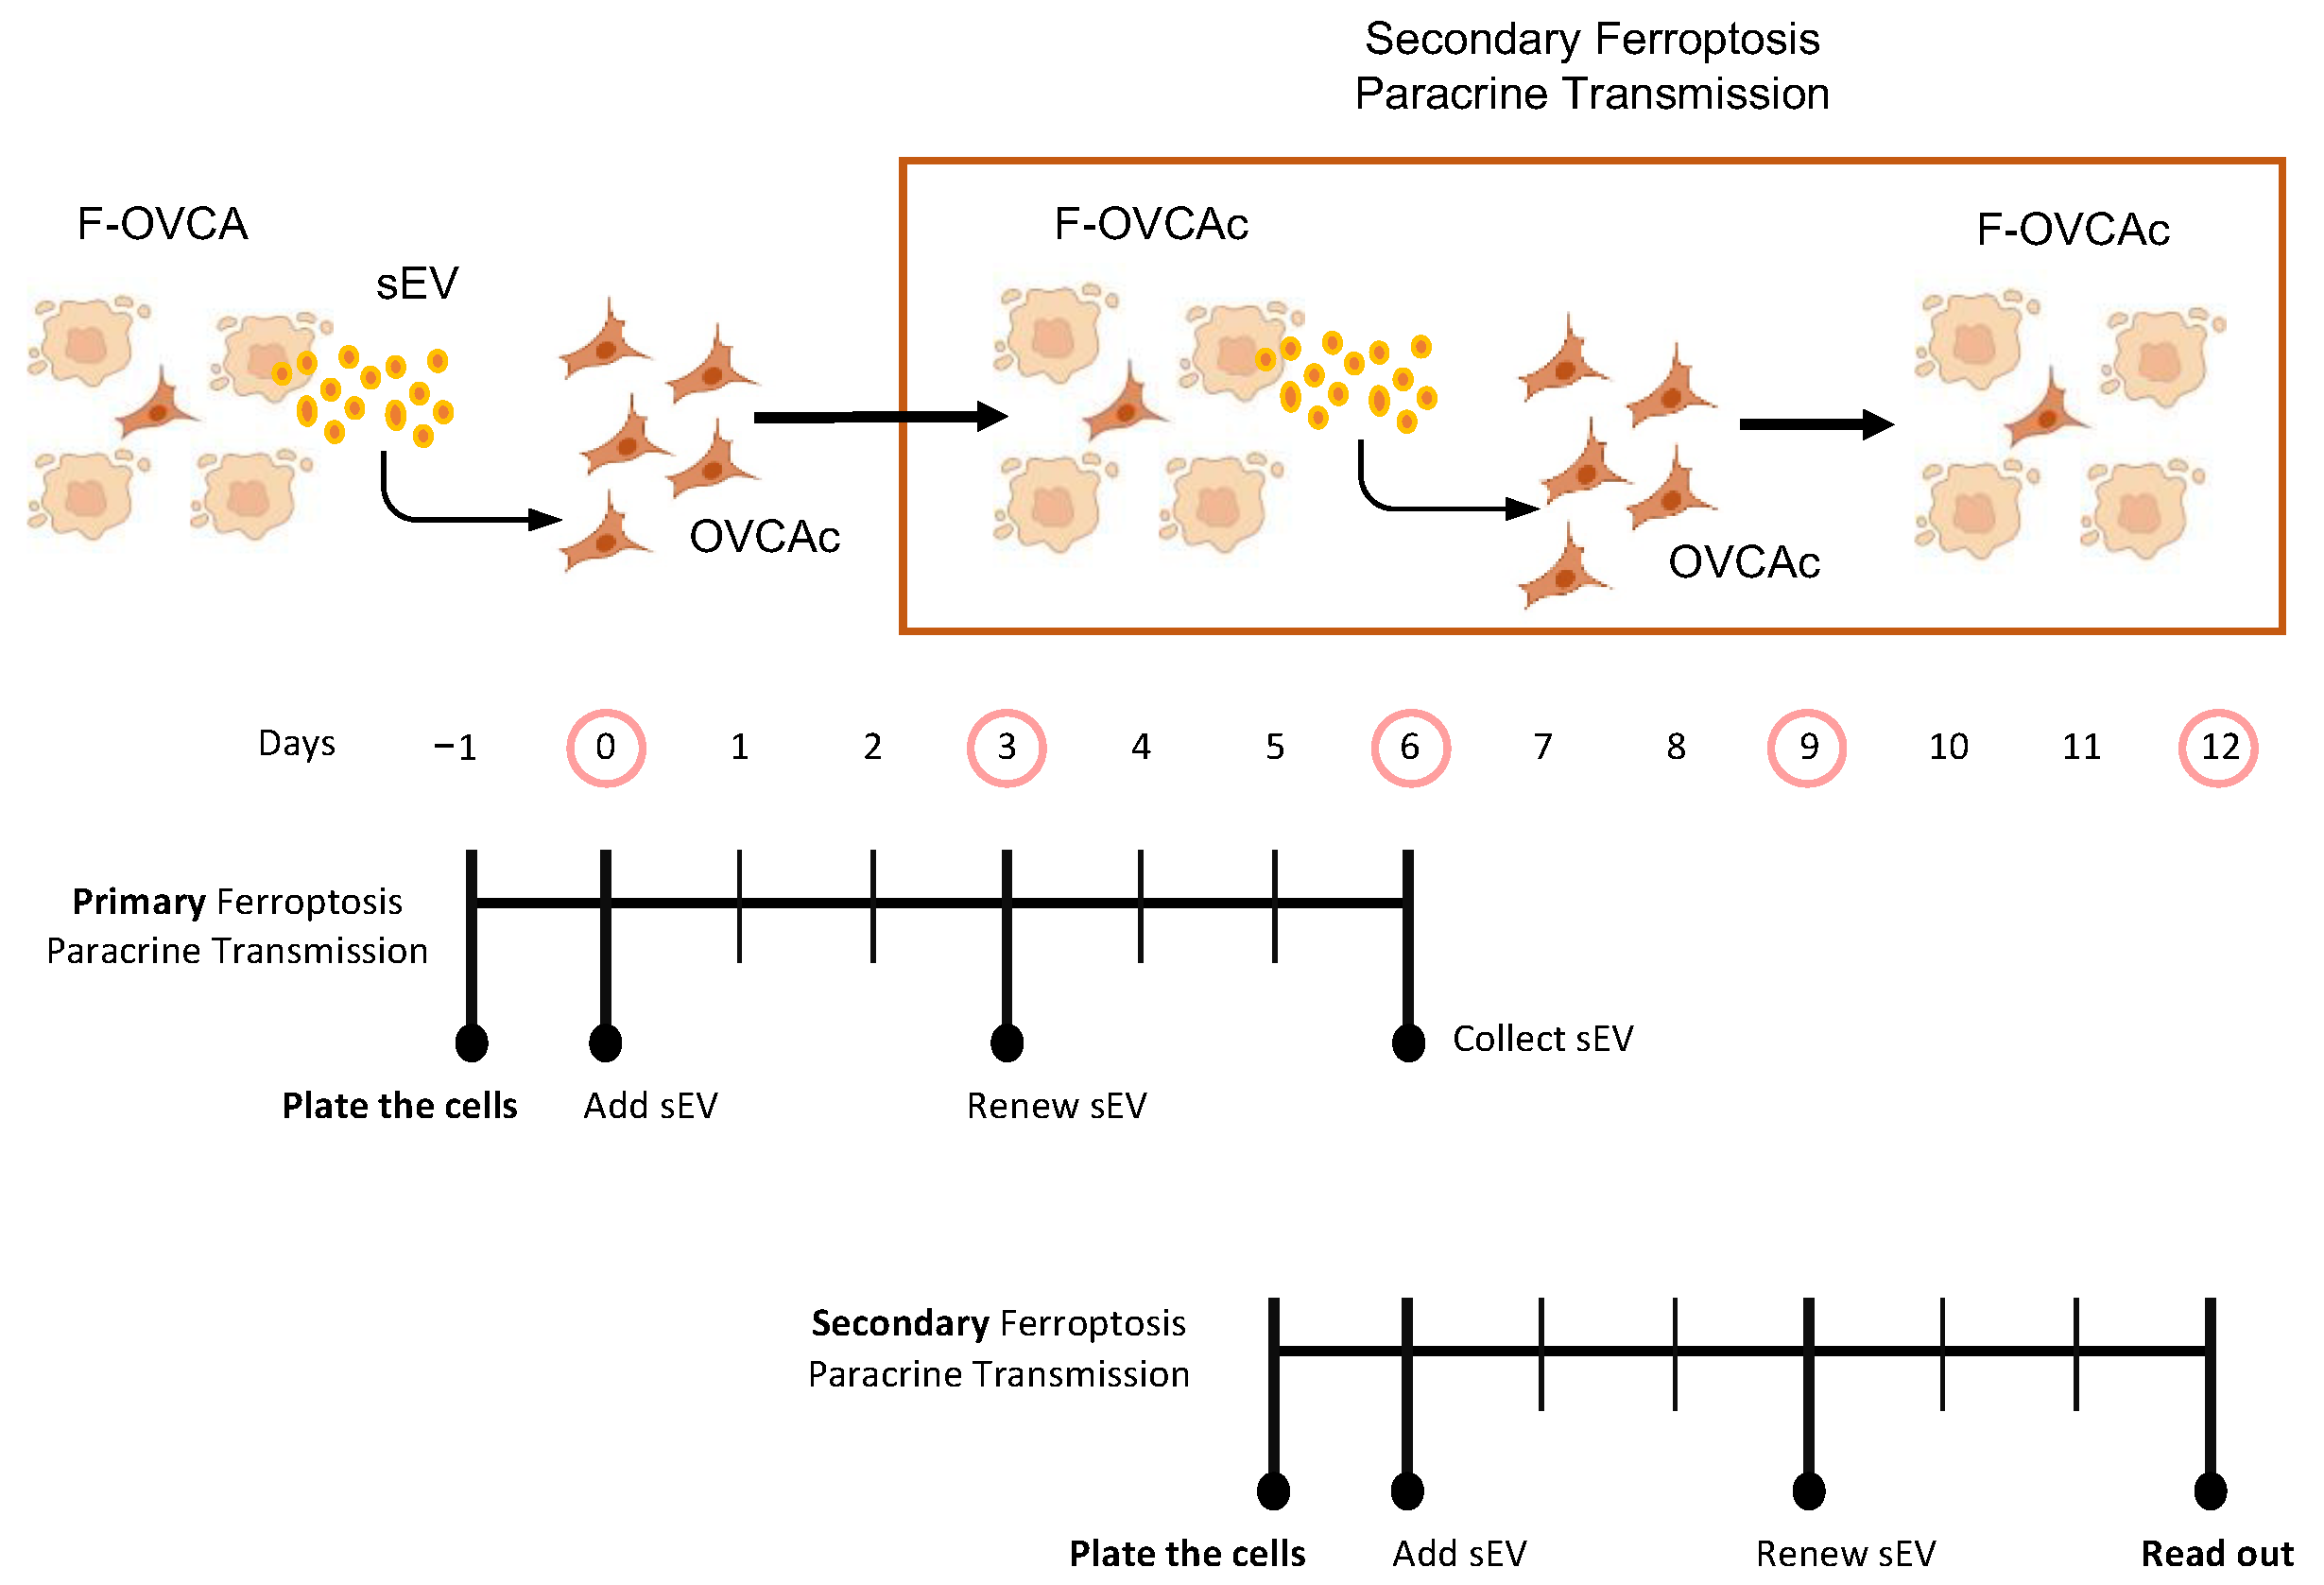
Schematic representation of secondary ferroptotic paracrine through sEV.
Figure 13.
Schematic representation of secondary ferroptotic paracrine through sEV.
Figure 14.
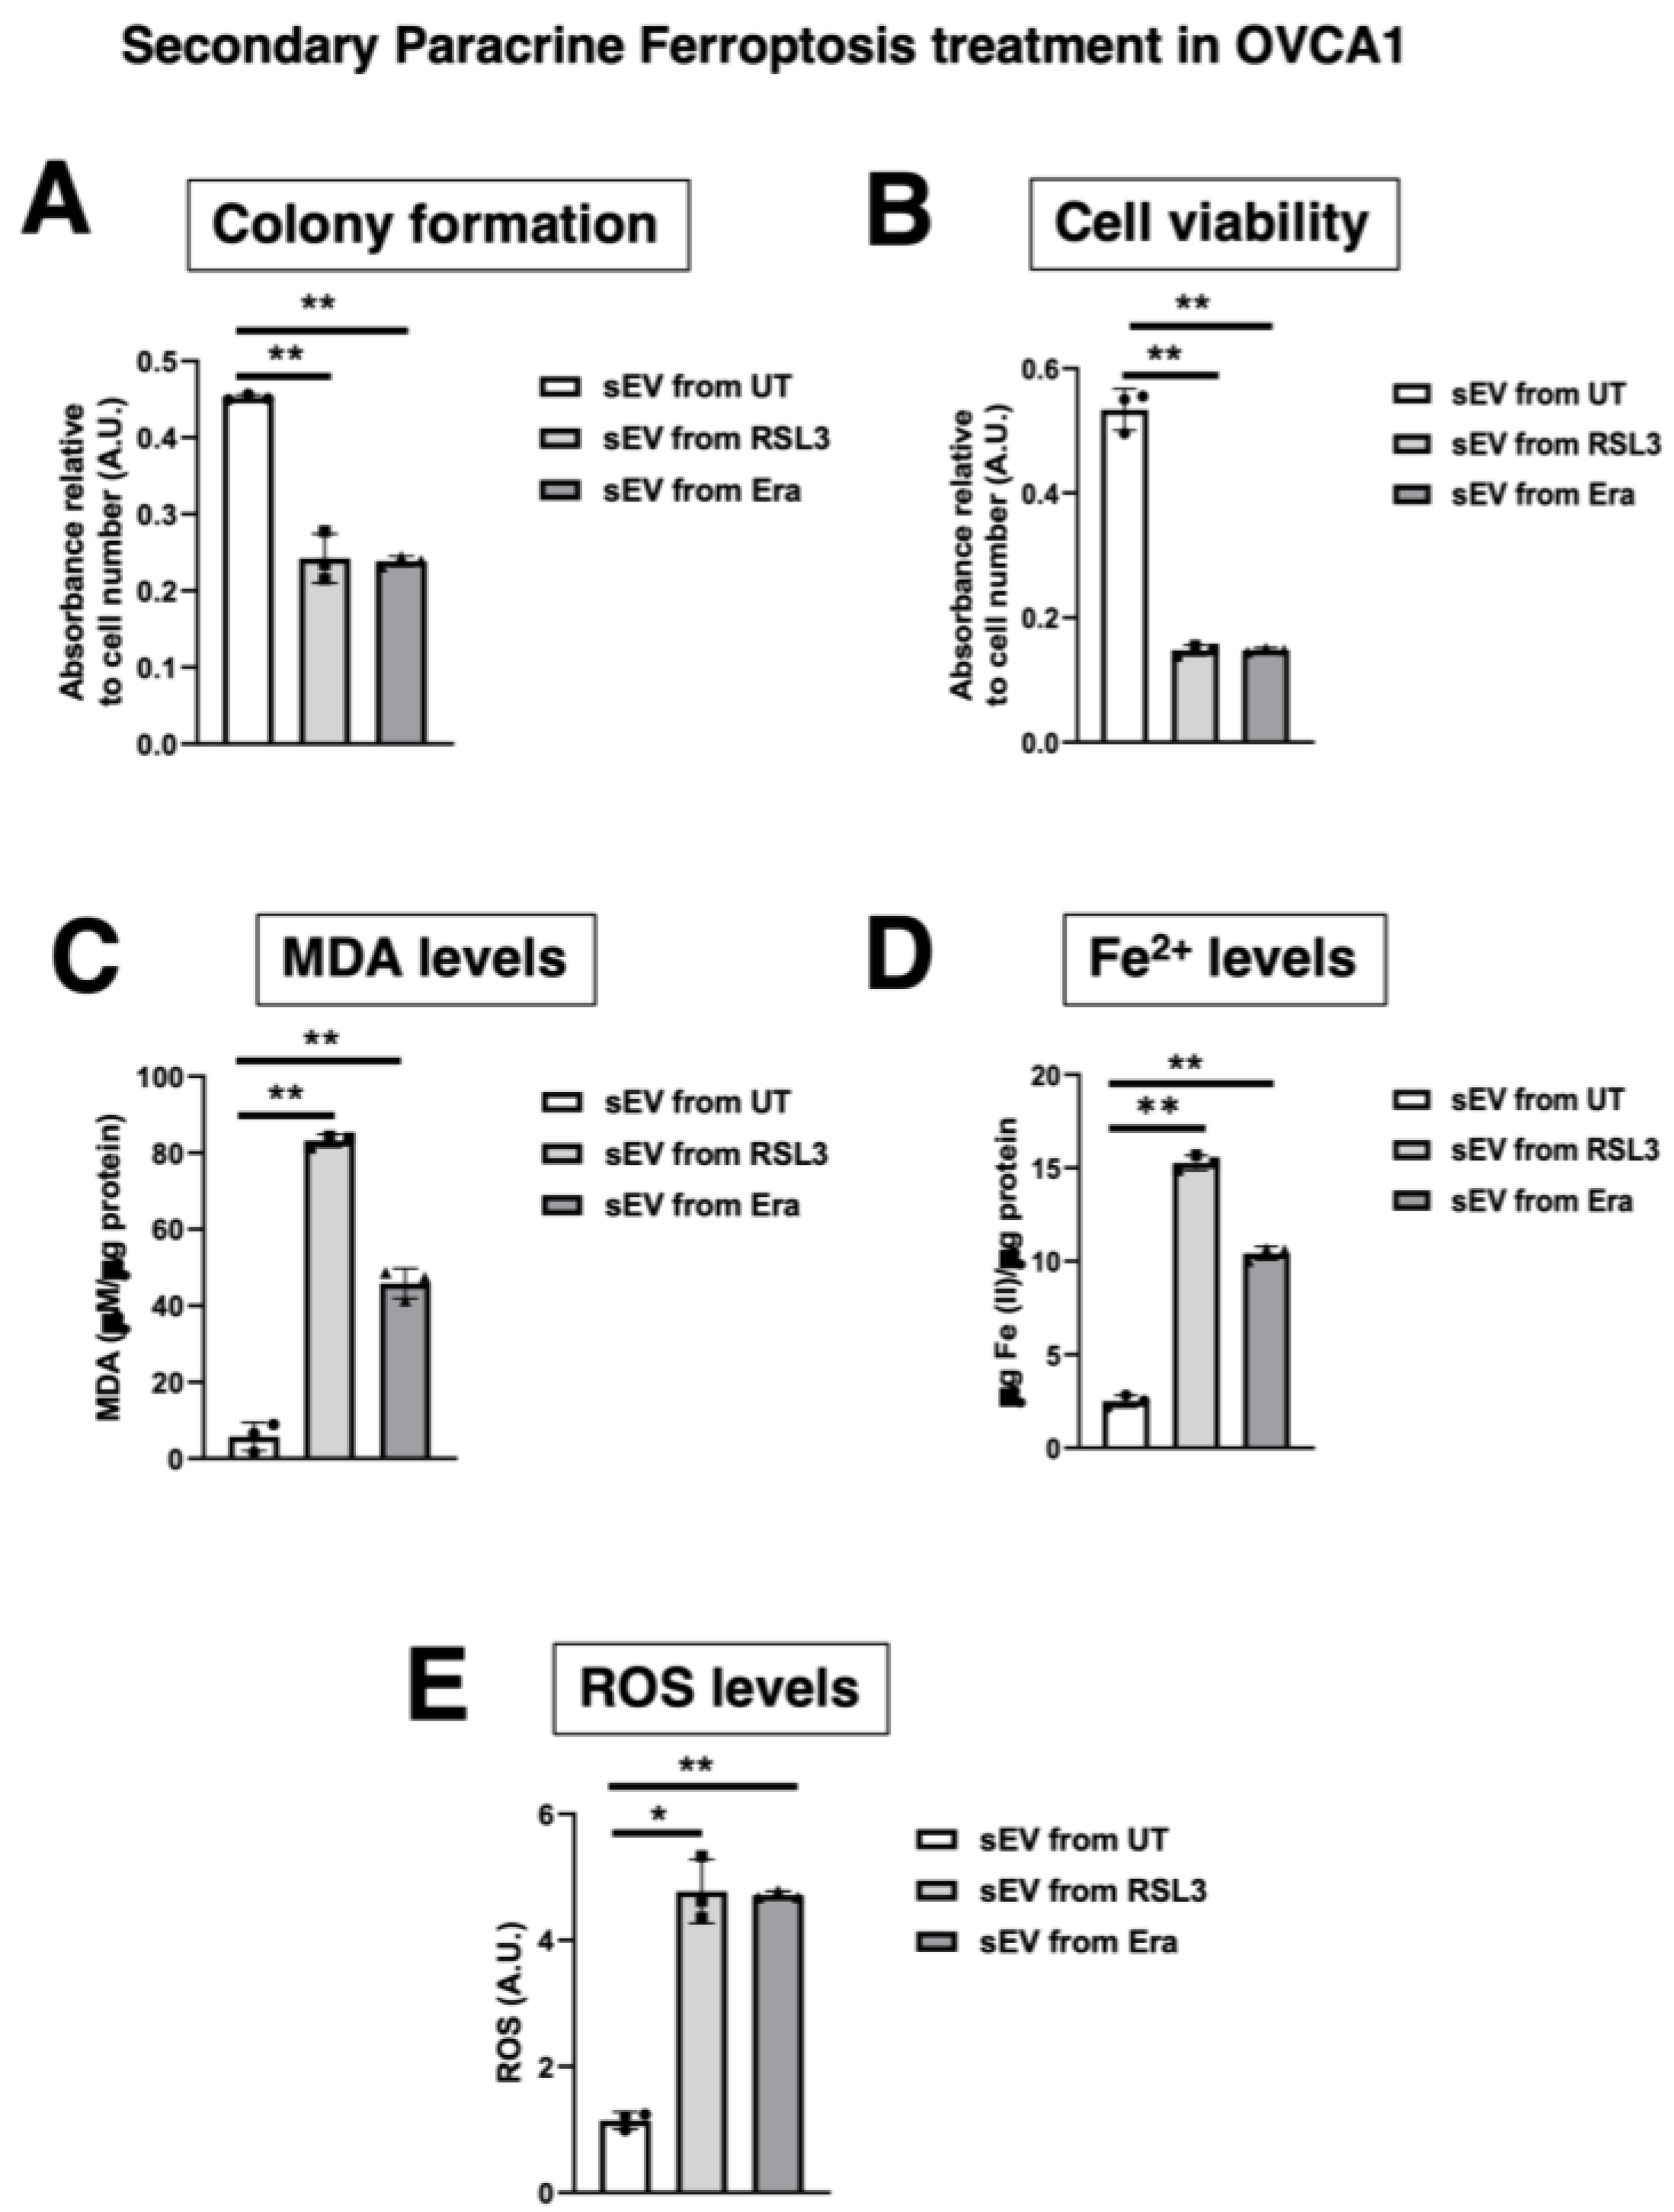
Ferroptosis parameters in secondary ferroptosis paracrine transmission by sEV in OVCAc. (A) Histogram of colony formation in OVCAc treated with sEV from OVCAc treated with sEV from F-OVCA-induced by sEV for 6 days in OVCA1; (B) Histogram of cell viability using MTT assay in OVCAc treated with sEV from F-OVCAc-induced by sEV for 6 days in OVCA1; (C) Histogram of Malondialdehyde (MDA) levels in OVCAc treated with sEV from F-OVCAc-induced by sEV for 6 days in OVCA1; (D) Histogram of Iron (II) (Fe2+) levels in OVCAc treated with sEV from F-OVCAc- induced with sEV in OVCA1; (E) Histogram of reactive oxygen species (ROS) levels in OVCAc treated with sEV from F-OVCA-induced by sEV for 6 days in OVCA1. The graphs show the mean ± SD of three independent experiments. * p < 0.05 and ** p < 0.01.
Figure 14.
Ferroptosis parameters in secondary ferroptosis paracrine transmission by sEV in OVCAc. (A) Histogram of colony formation in OVCAc treated with sEV from OVCAc treated with sEV from F-OVCA-induced by sEV for 6 days in OVCA1; (B) Histogram of cell viability using MTT assay in OVCAc treated with sEV from F-OVCAc-induced by sEV for 6 days in OVCA1; (C) Histogram of Malondialdehyde (MDA) levels in OVCAc treated with sEV from F-OVCAc-induced by sEV for 6 days in OVCA1; (D) Histogram of Iron (II) (Fe2+) levels in OVCAc treated with sEV from F-OVCAc- induced with sEV in OVCA1; (E) Histogram of reactive oxygen species (ROS) levels in OVCAc treated with sEV from F-OVCA-induced by sEV for 6 days in OVCA1. The graphs show the mean ± SD of three independent experiments. * p < 0.05 and ** p < 0.01.
Figure 15.
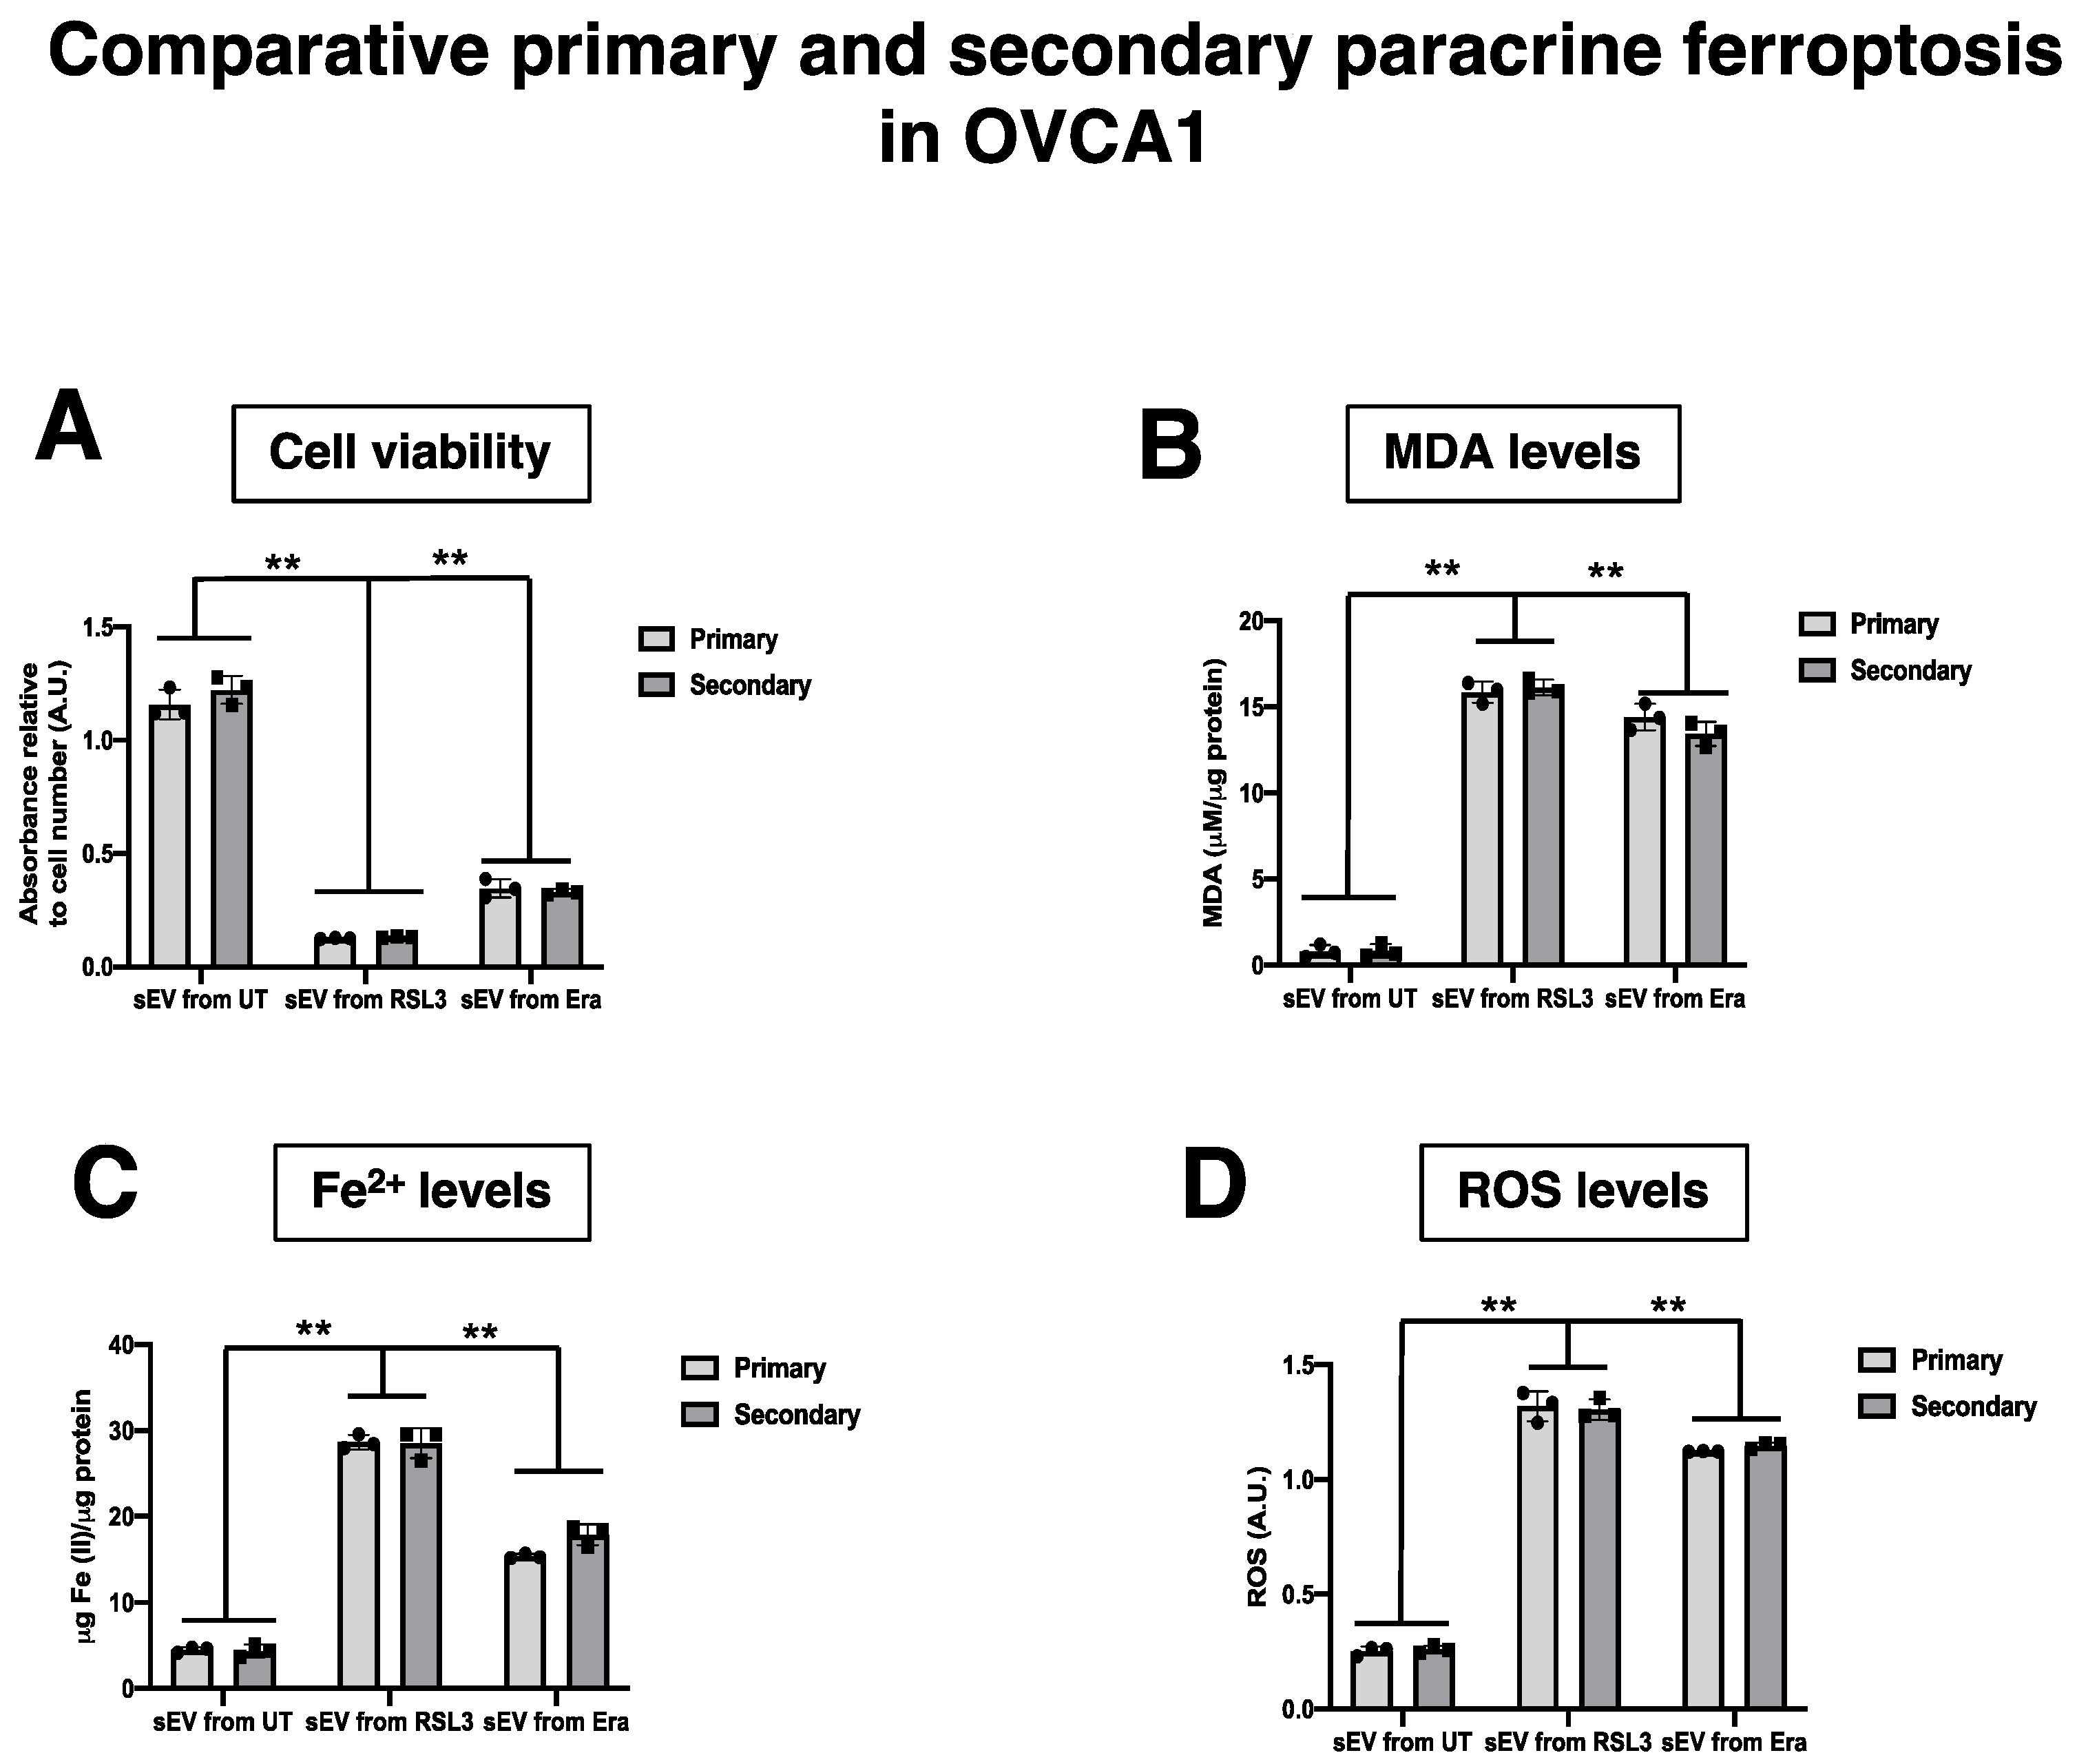
Ferroptosis parameters in the comparative primary and secondary ferroptosis paracrine transmission by sEV in OVCAc. (A) Histogram of colony formation in primary and secondary ferroptosis paracrine transmission for 6 days in OVCA1; (B) Histogram of cell viability using MTT assay in primary and secondary ferroptosis paracrine transmission for 6 days in OVCA1; (C) Histogram of Malondialdehyde (MDA) levels in in primary and secondary ferroptosis paracrine transmission for 6 days in OVCA1; (C) Histogram of Iron (II) (Fe2+) levels in primary and secondary ferroptosis paracrine transmission for 6 days in OVCA1. (D) Histogram of reactive oxygen species (ROS) levels in primary and secondary ferroptosis paracrine transmission for 6 days in OVCA1. The graphs show the mean ± SD of three independent experiments. ** p < 0.01.
Figure 15.
Ferroptosis parameters in the comparative primary and secondary ferroptosis paracrine transmission by sEV in OVCAc. (A) Histogram of colony formation in primary and secondary ferroptosis paracrine transmission for 6 days in OVCA1; (B) Histogram of cell viability using MTT assay in primary and secondary ferroptosis paracrine transmission for 6 days in OVCA1; (C) Histogram of Malondialdehyde (MDA) levels in in primary and secondary ferroptosis paracrine transmission for 6 days in OVCA1; (C) Histogram of Iron (II) (Fe2+) levels in primary and secondary ferroptosis paracrine transmission for 6 days in OVCA1. (D) Histogram of reactive oxygen species (ROS) levels in primary and secondary ferroptosis paracrine transmission for 6 days in OVCA1. The graphs show the mean ± SD of three independent experiments. ** p < 0.01.
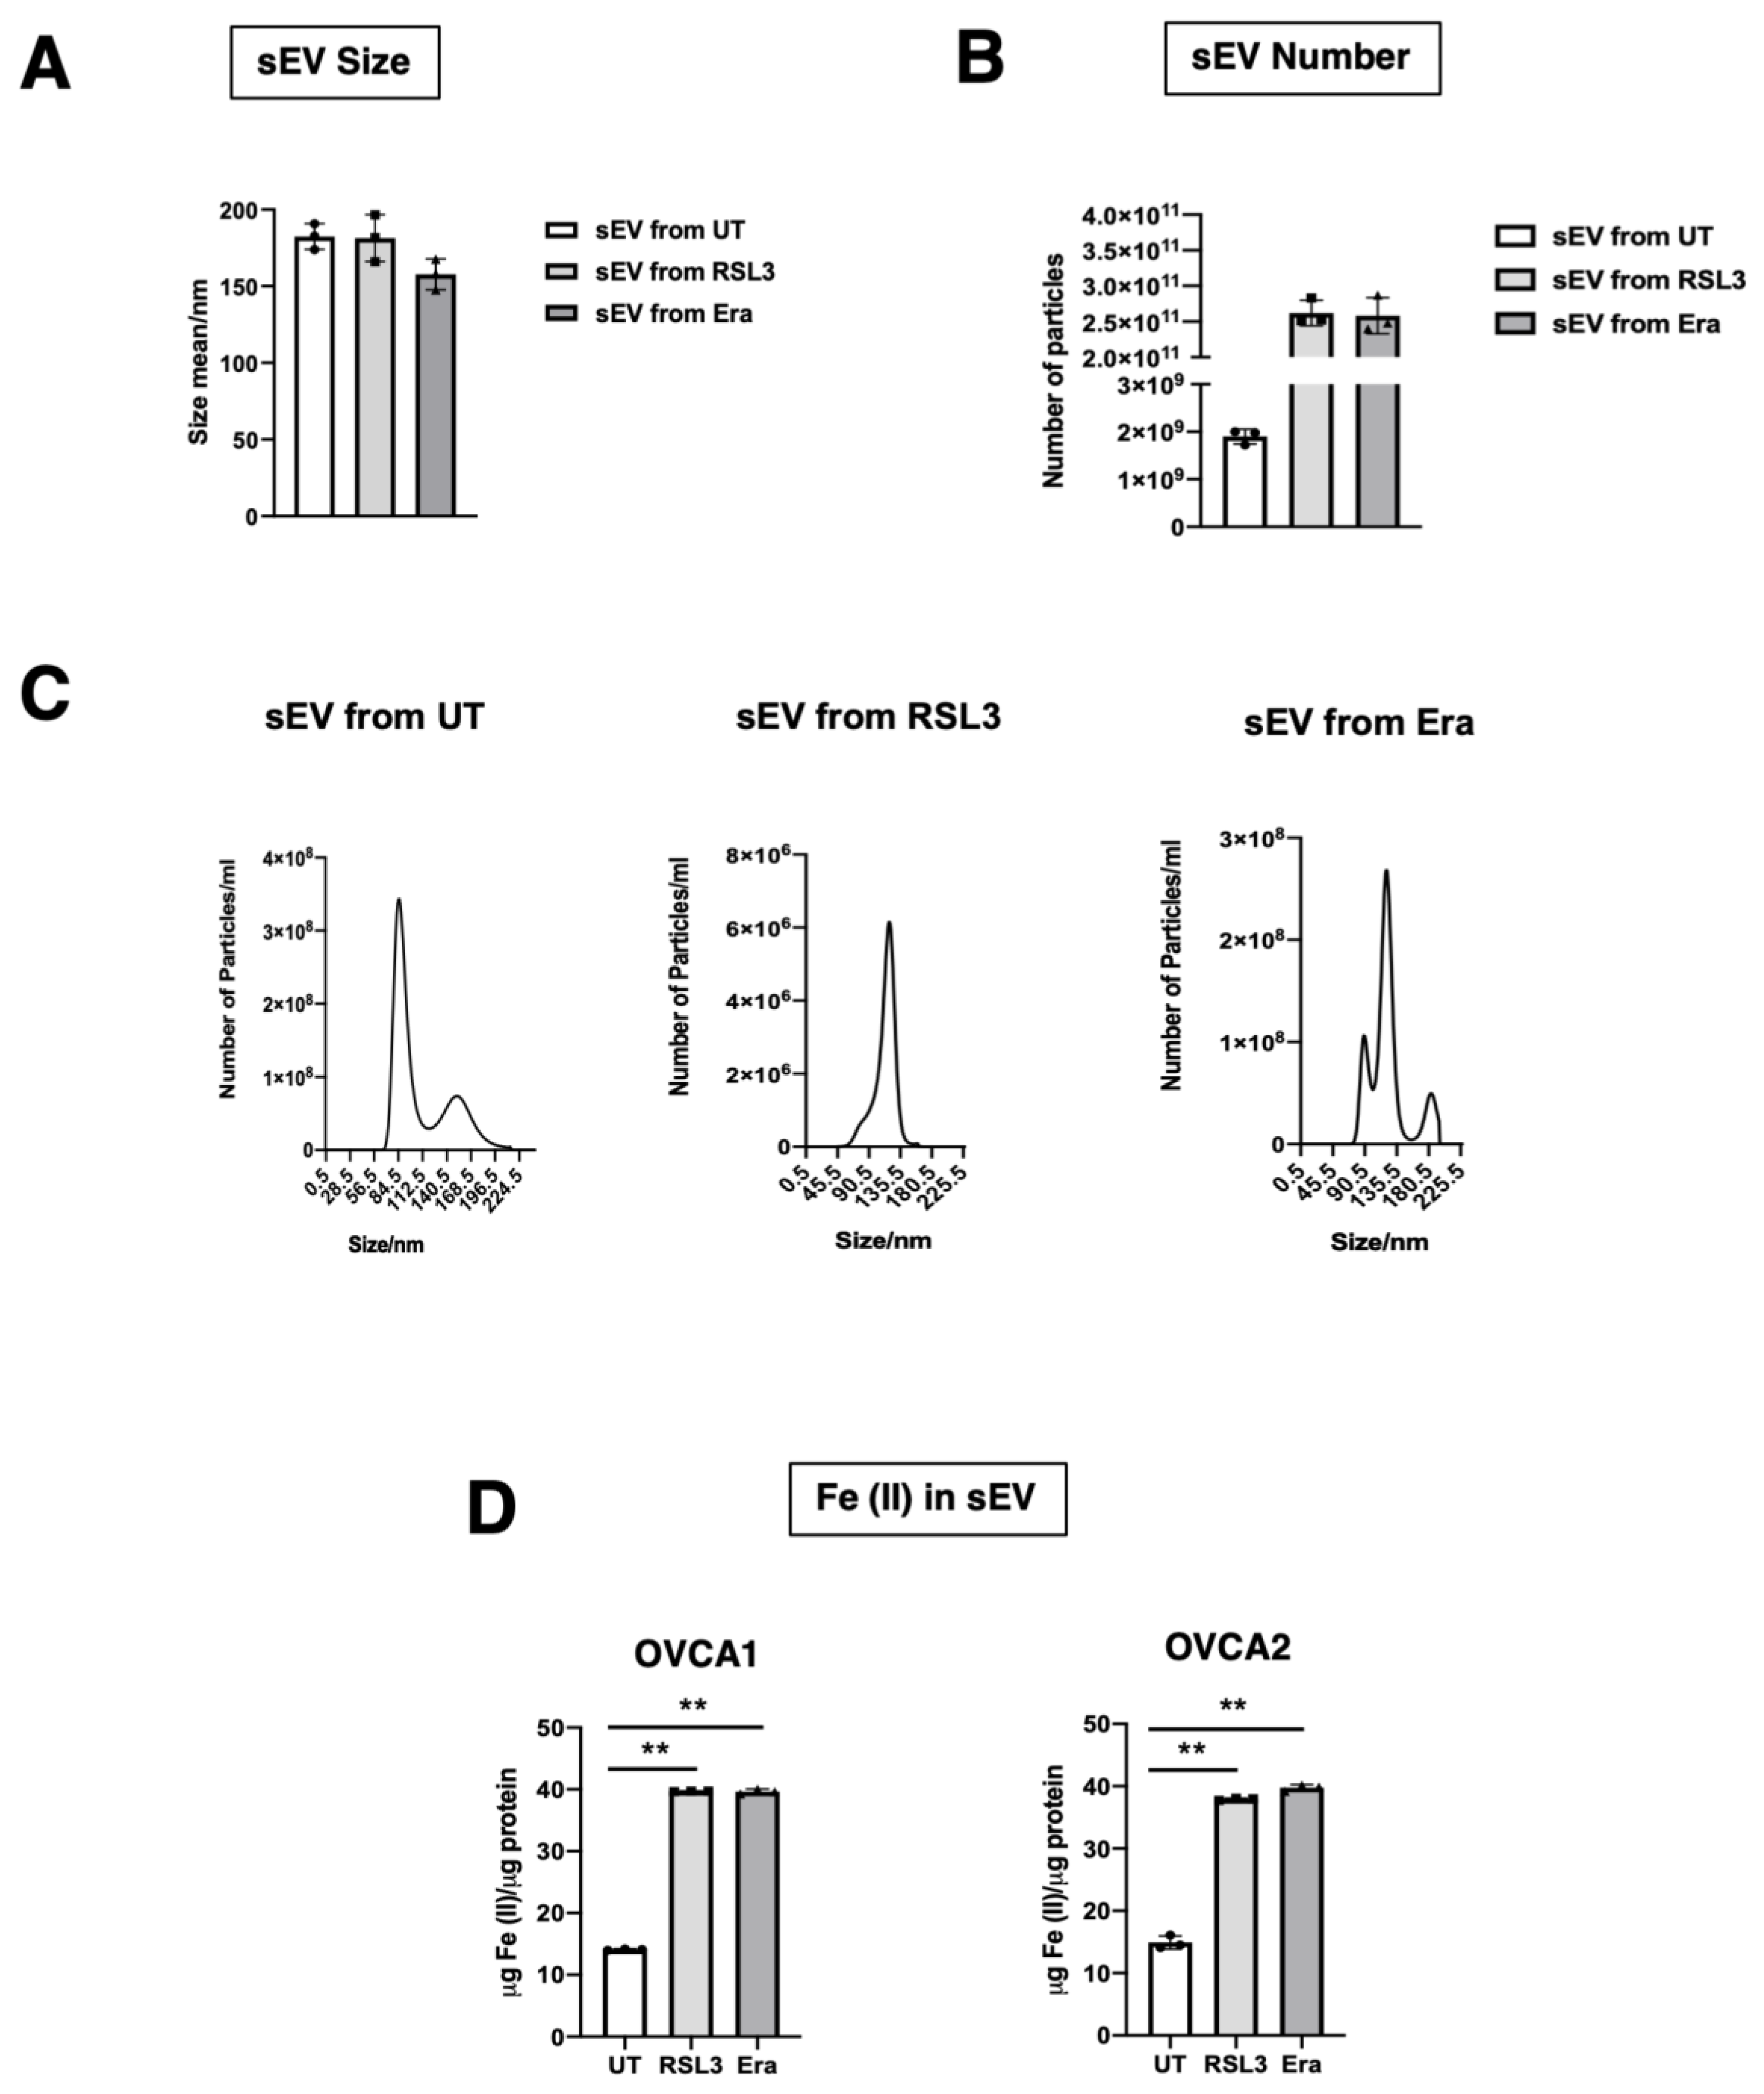
Figure 16.
Analysis of sEV delivery from secondary ferroptosis paracrine transmission by sEV in OVCAc. (
A) Mean particle size and (
B) number of sEV from F-OVCAc induced by sEV measured by Nanoparticle Tracking Analysis (NTA). (
C) Histogram distribution of sEV from F-OVCAc induced by sEV by Nanoparticle Tracking Analysis (NTA) in OVCA1 (
D) Histogram of Iron (II) (Fe
2+) levels in F-OVCAc induced by sEV in OVCA1 and OVCA2. The graphs show the mean ± SD of three independent experiments. **
p < 0.01. Related to
Figure 10.
Figure 17.
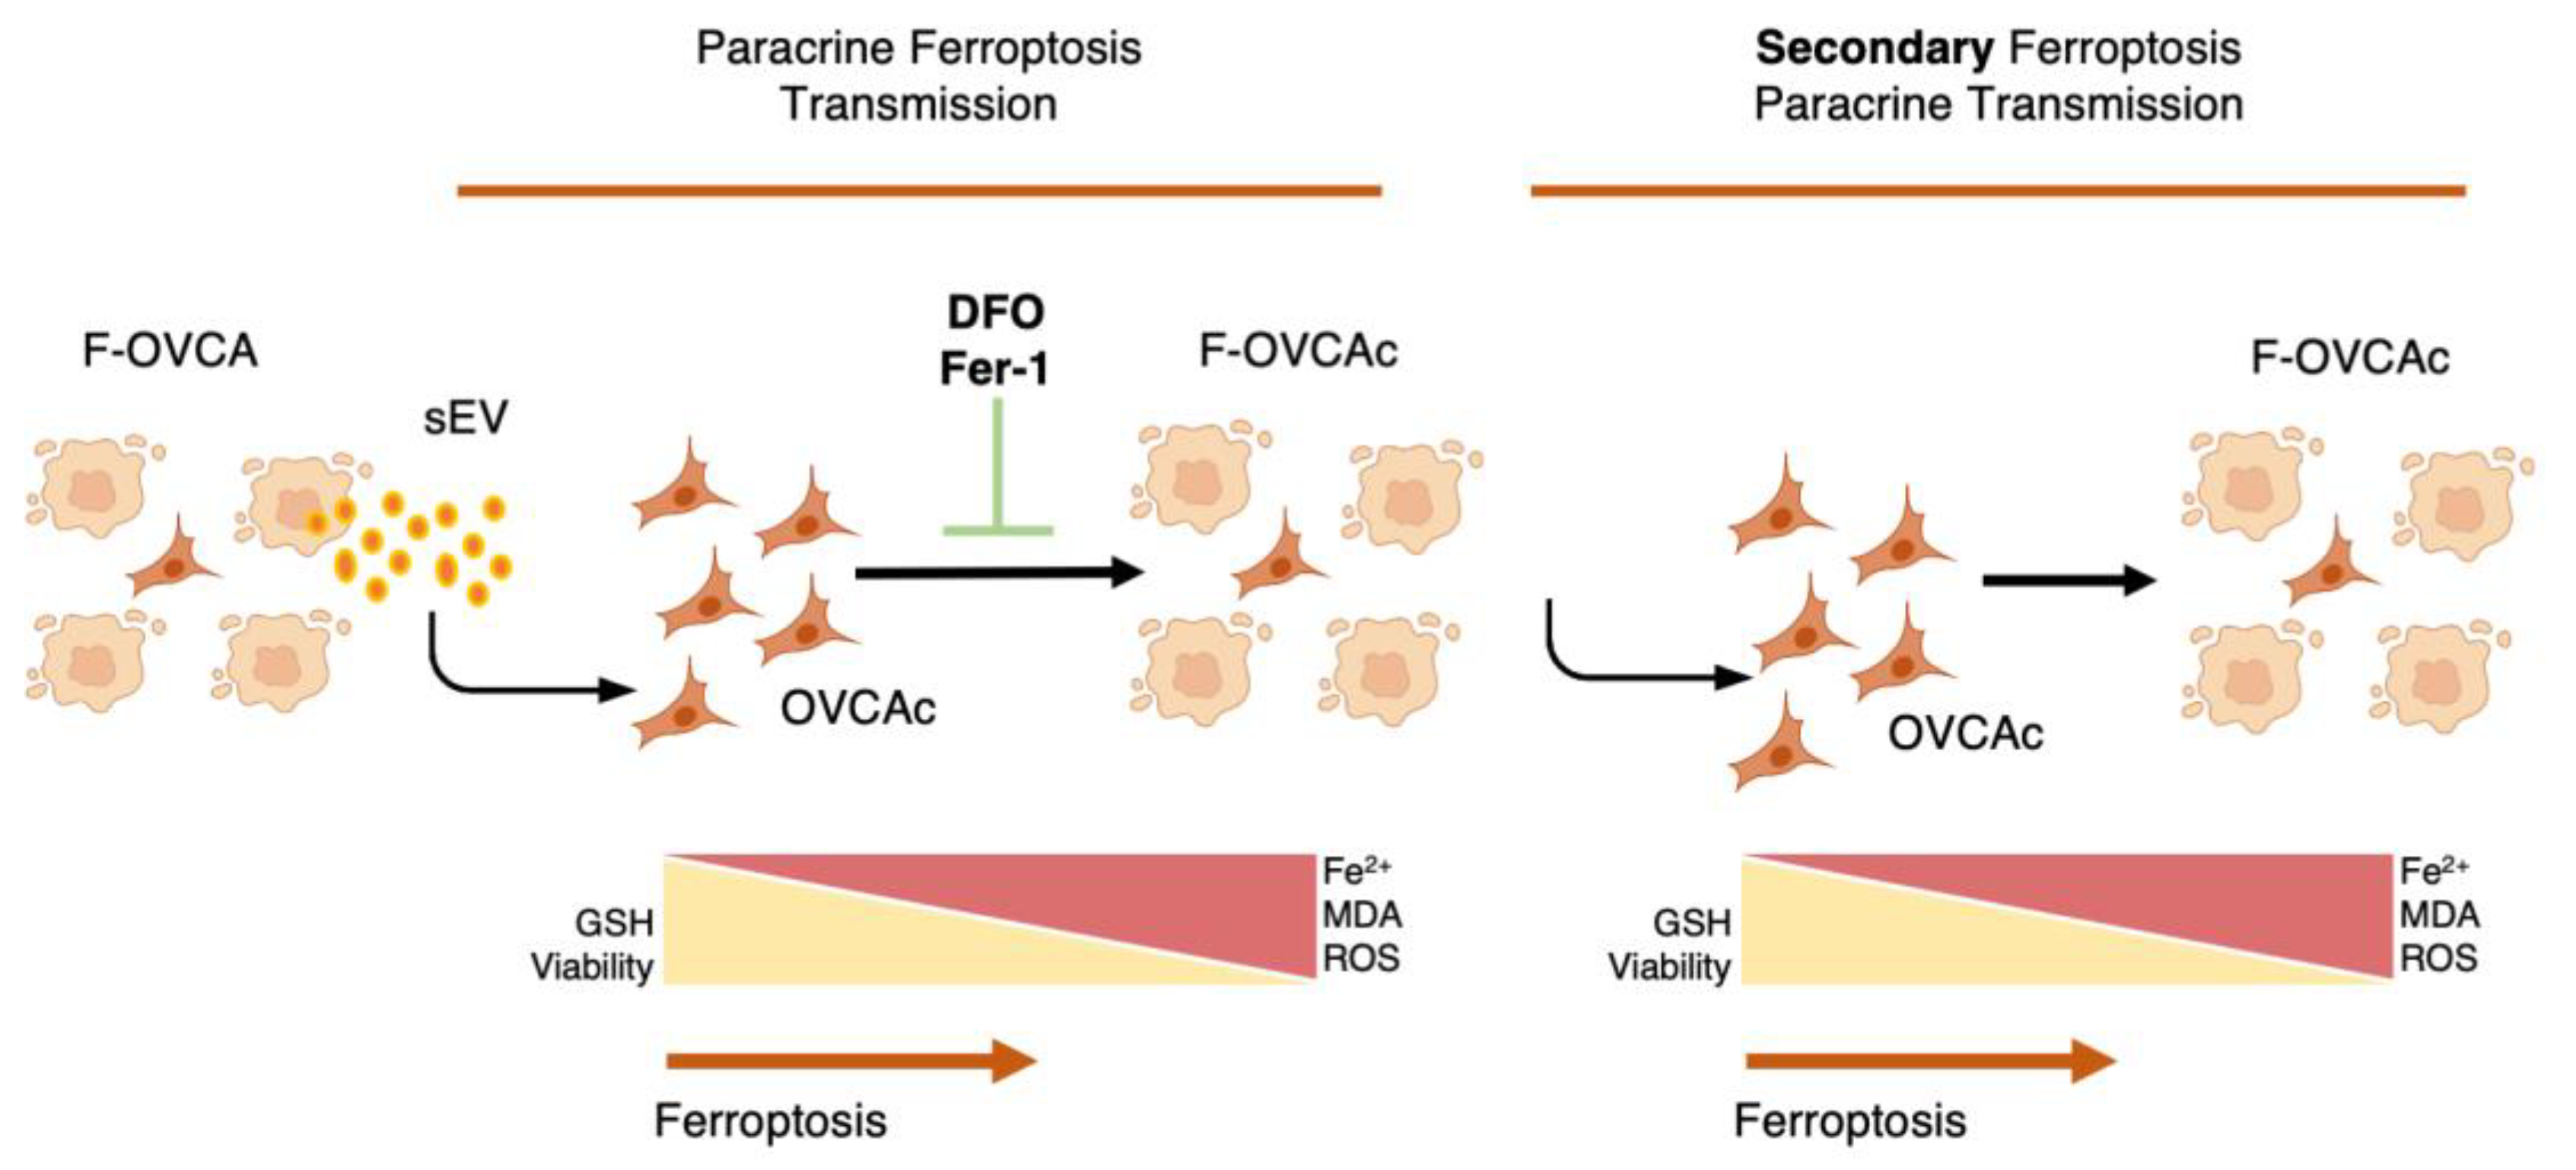
Graphical abstract.
Figure 17.
Graphical abstract.
Figure 18.
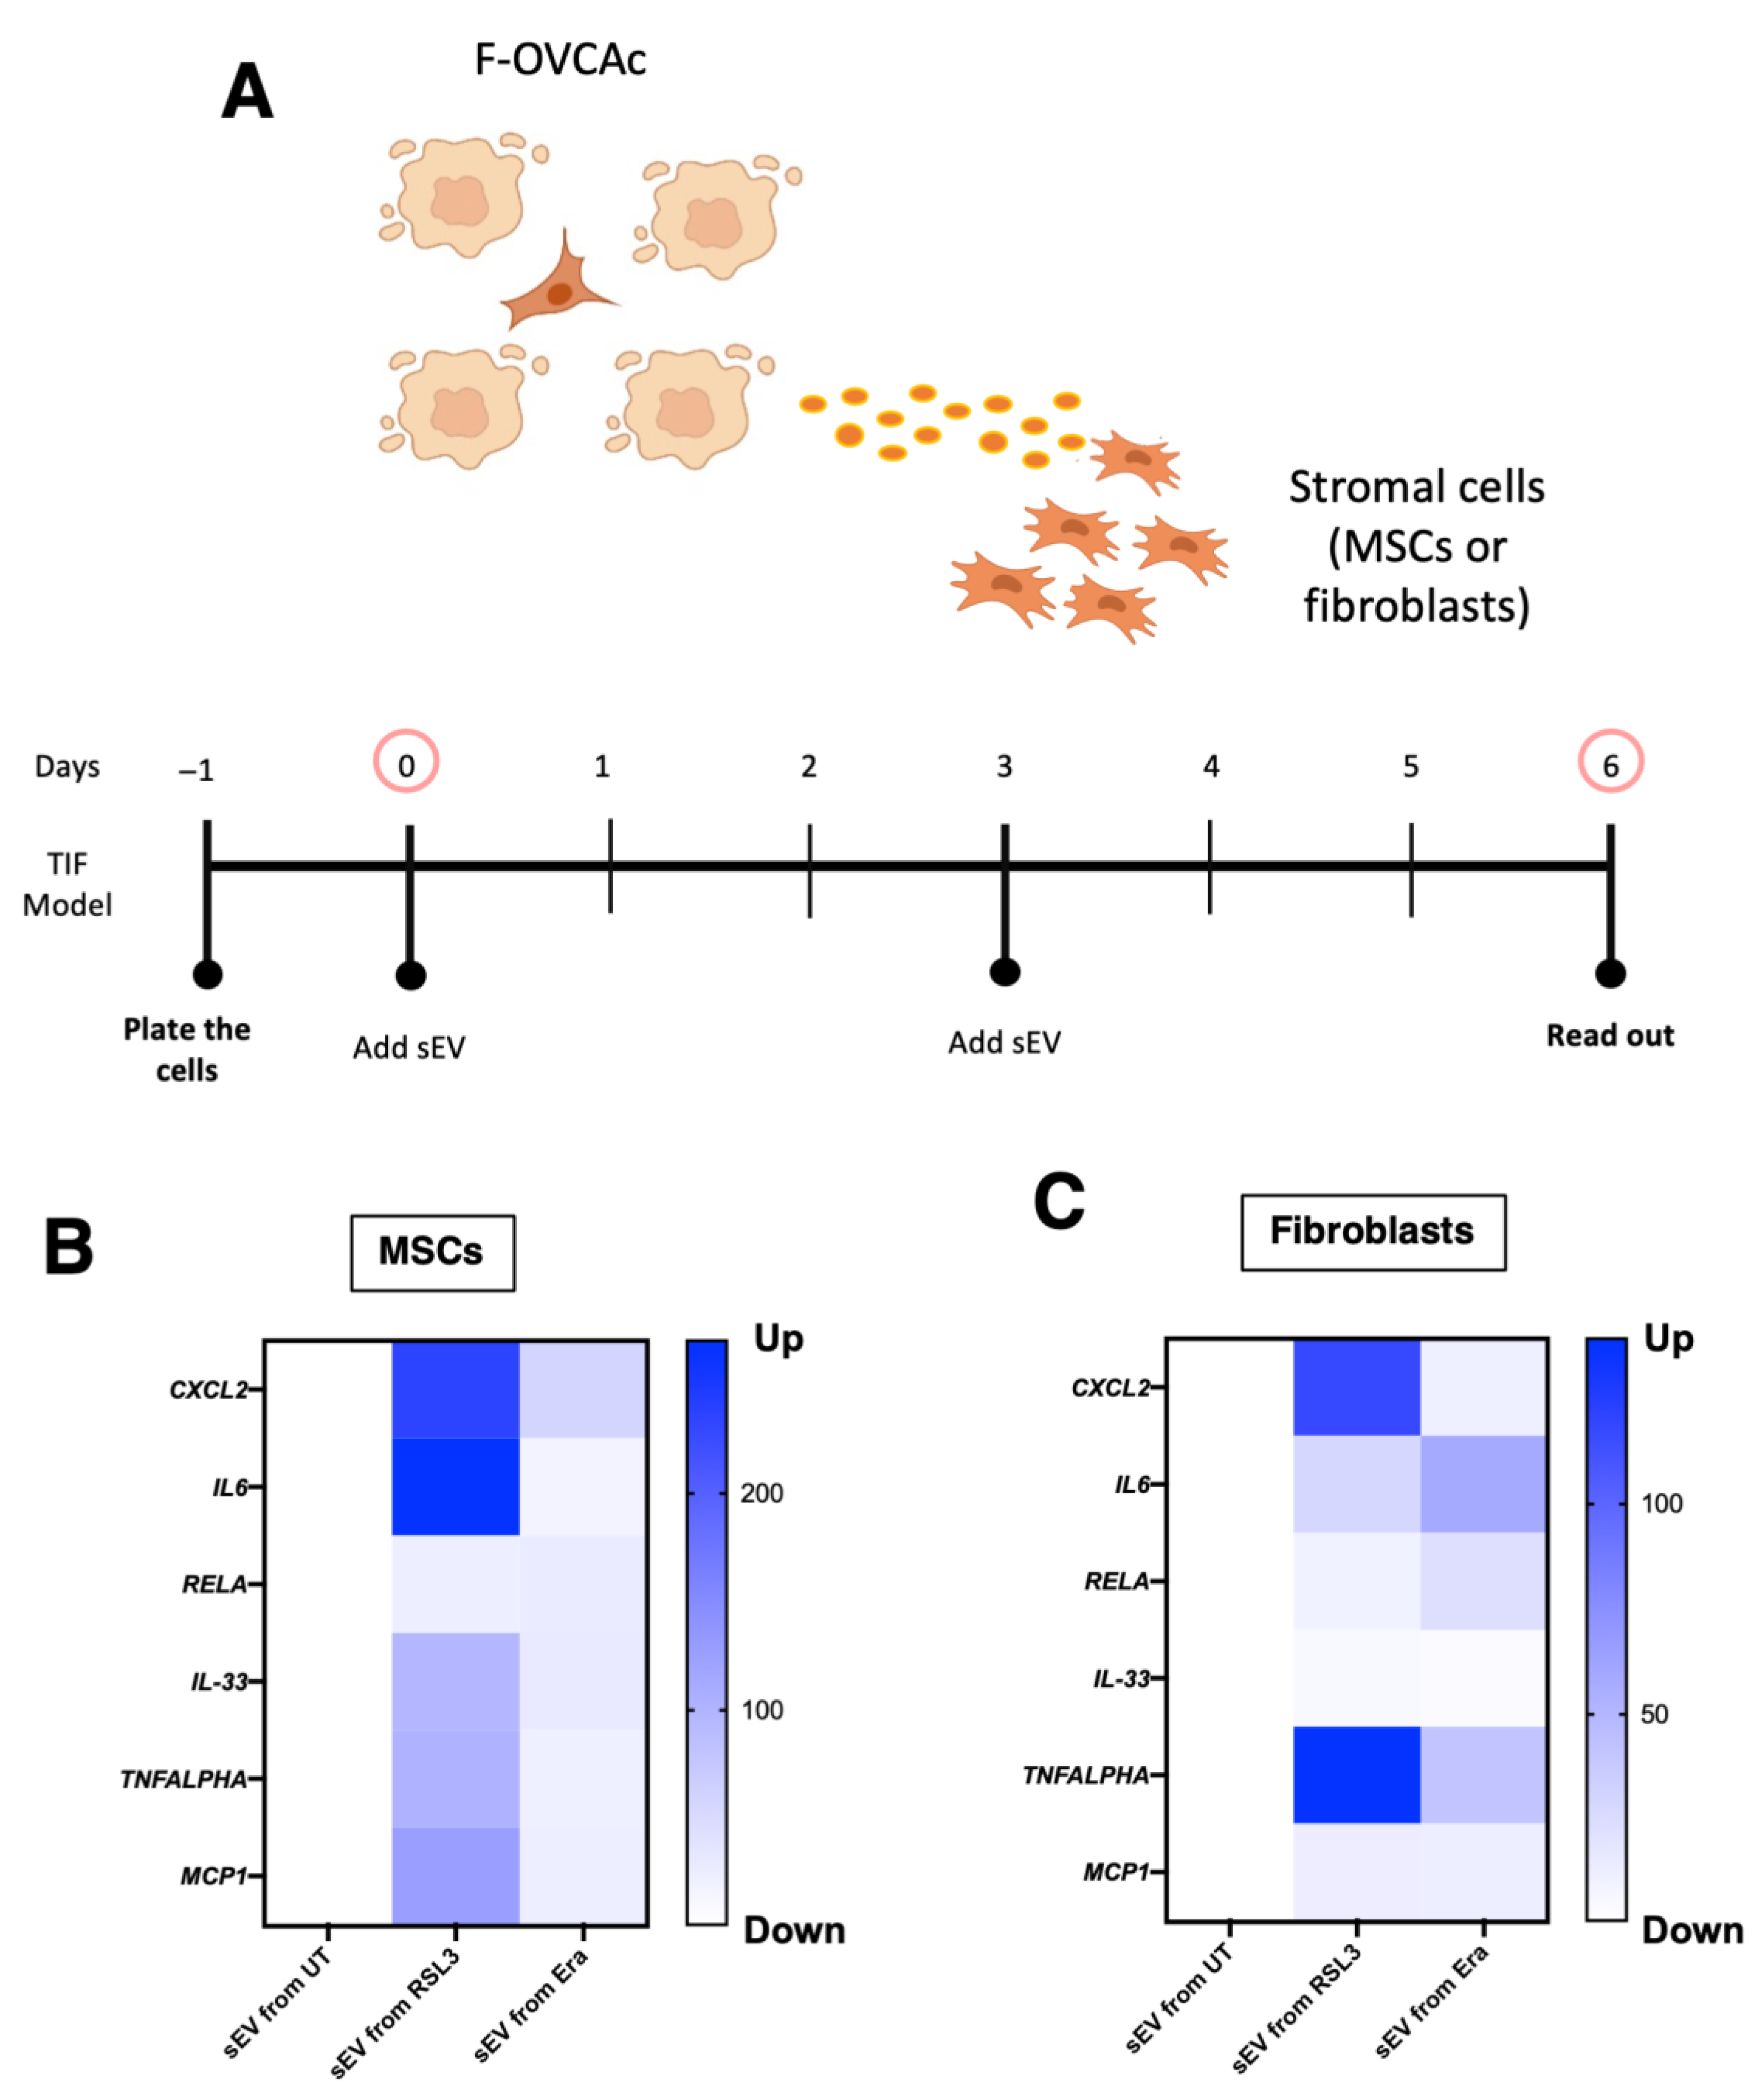
Inflammation activation through ferroptotic sEV in tumor microenvironment. (A) Schematic representation of Mesenchymal Stem Cells (MSCs) and fibroblasts treated with ferroptotic sEV. Heatmap of mRNA levels of CXCL2, IL6, RELA, IL33, TNFALPHA and MCP1 in (B) MSCs and (C) fibroblasts treated with sEV from ferroptotic sEV from F-OVCA (OVCA1) for 6 days. Data show the mean of three independent experiments.
Figure 18.
Inflammation activation through ferroptotic sEV in tumor microenvironment. (A) Schematic representation of Mesenchymal Stem Cells (MSCs) and fibroblasts treated with ferroptotic sEV. Heatmap of mRNA levels of CXCL2, IL6, RELA, IL33, TNFALPHA and MCP1 in (B) MSCs and (C) fibroblasts treated with sEV from ferroptotic sEV from F-OVCA (OVCA1) for 6 days. Data show the mean of three independent experiments.
Table 1.
List of ferroptotic modulators.
Table 1.
List of ferroptotic modulators.
| Drug | Concentration | Source/Cat No |
|---|
| RSL3 | 250 nM, 500 nM and 1 µM | MedChemExpress/HY-100218A |
| Erastin | 250 nM, 500 nM and 1 µM | MedChemExpres/HY-15763 |
| Ferrostatin-1 | 500 nM | MedChemExpres/HY-100579 |
| DFO | 500 nM | MedChemExpres/HY-B0988 |
Table 2.
List of antibodies.
Table 2.
List of antibodies.
| Antibody | Dilution | Source/Cat No |
|---|
| CD63 | 1:5000 | Abcam/ab231975 |
| Calnexin | 1:1000 | Abcam/ab133615 |
Table 3.
List of primers used in qPCR-RT.
Table 3.
List of primers used in qPCR-RT.
| Target | Species | Forward Primer
(5′-3′) | Reverse Primer
(3′-5′) |
|---|
| CXCL2 | Human | CTCAAGAATGGGCAGAAAGC | AAACACATTAGGCGCAATCC |
| IL6 | Human | CCAGGAGCCCAGCTATGAAC | CCCAGGGAGAAGGCAACTG |
| RELA | Human | TTCCCGATCTGAGTCCAGGT | GCTTGTCTCGGGTTTCTGGA |
| IL33 | Human | TCCTTGCTTGGCAGTATCCA | TGCTCAATGTGTCAACAGACG |
| TNFALPHA | Human | AGCCCATGTTGTAGCAAACC | GAGGTACAGGCCCTCTGATG |
| MCP1 | Human | TCAGCCAGATGCAATCAATG | ATGGTCTTGAAGATCACAGC |
| ACTB | Human | AGAGCTACGAGCTGCCTGAC | GGATGCCACAGGACTCCA |


 ,
, 


