
Suppression of NRF2 Activity by HIF-1α Promotes Fibrosis after Ischemic Acute Kidney Injury

 and
and 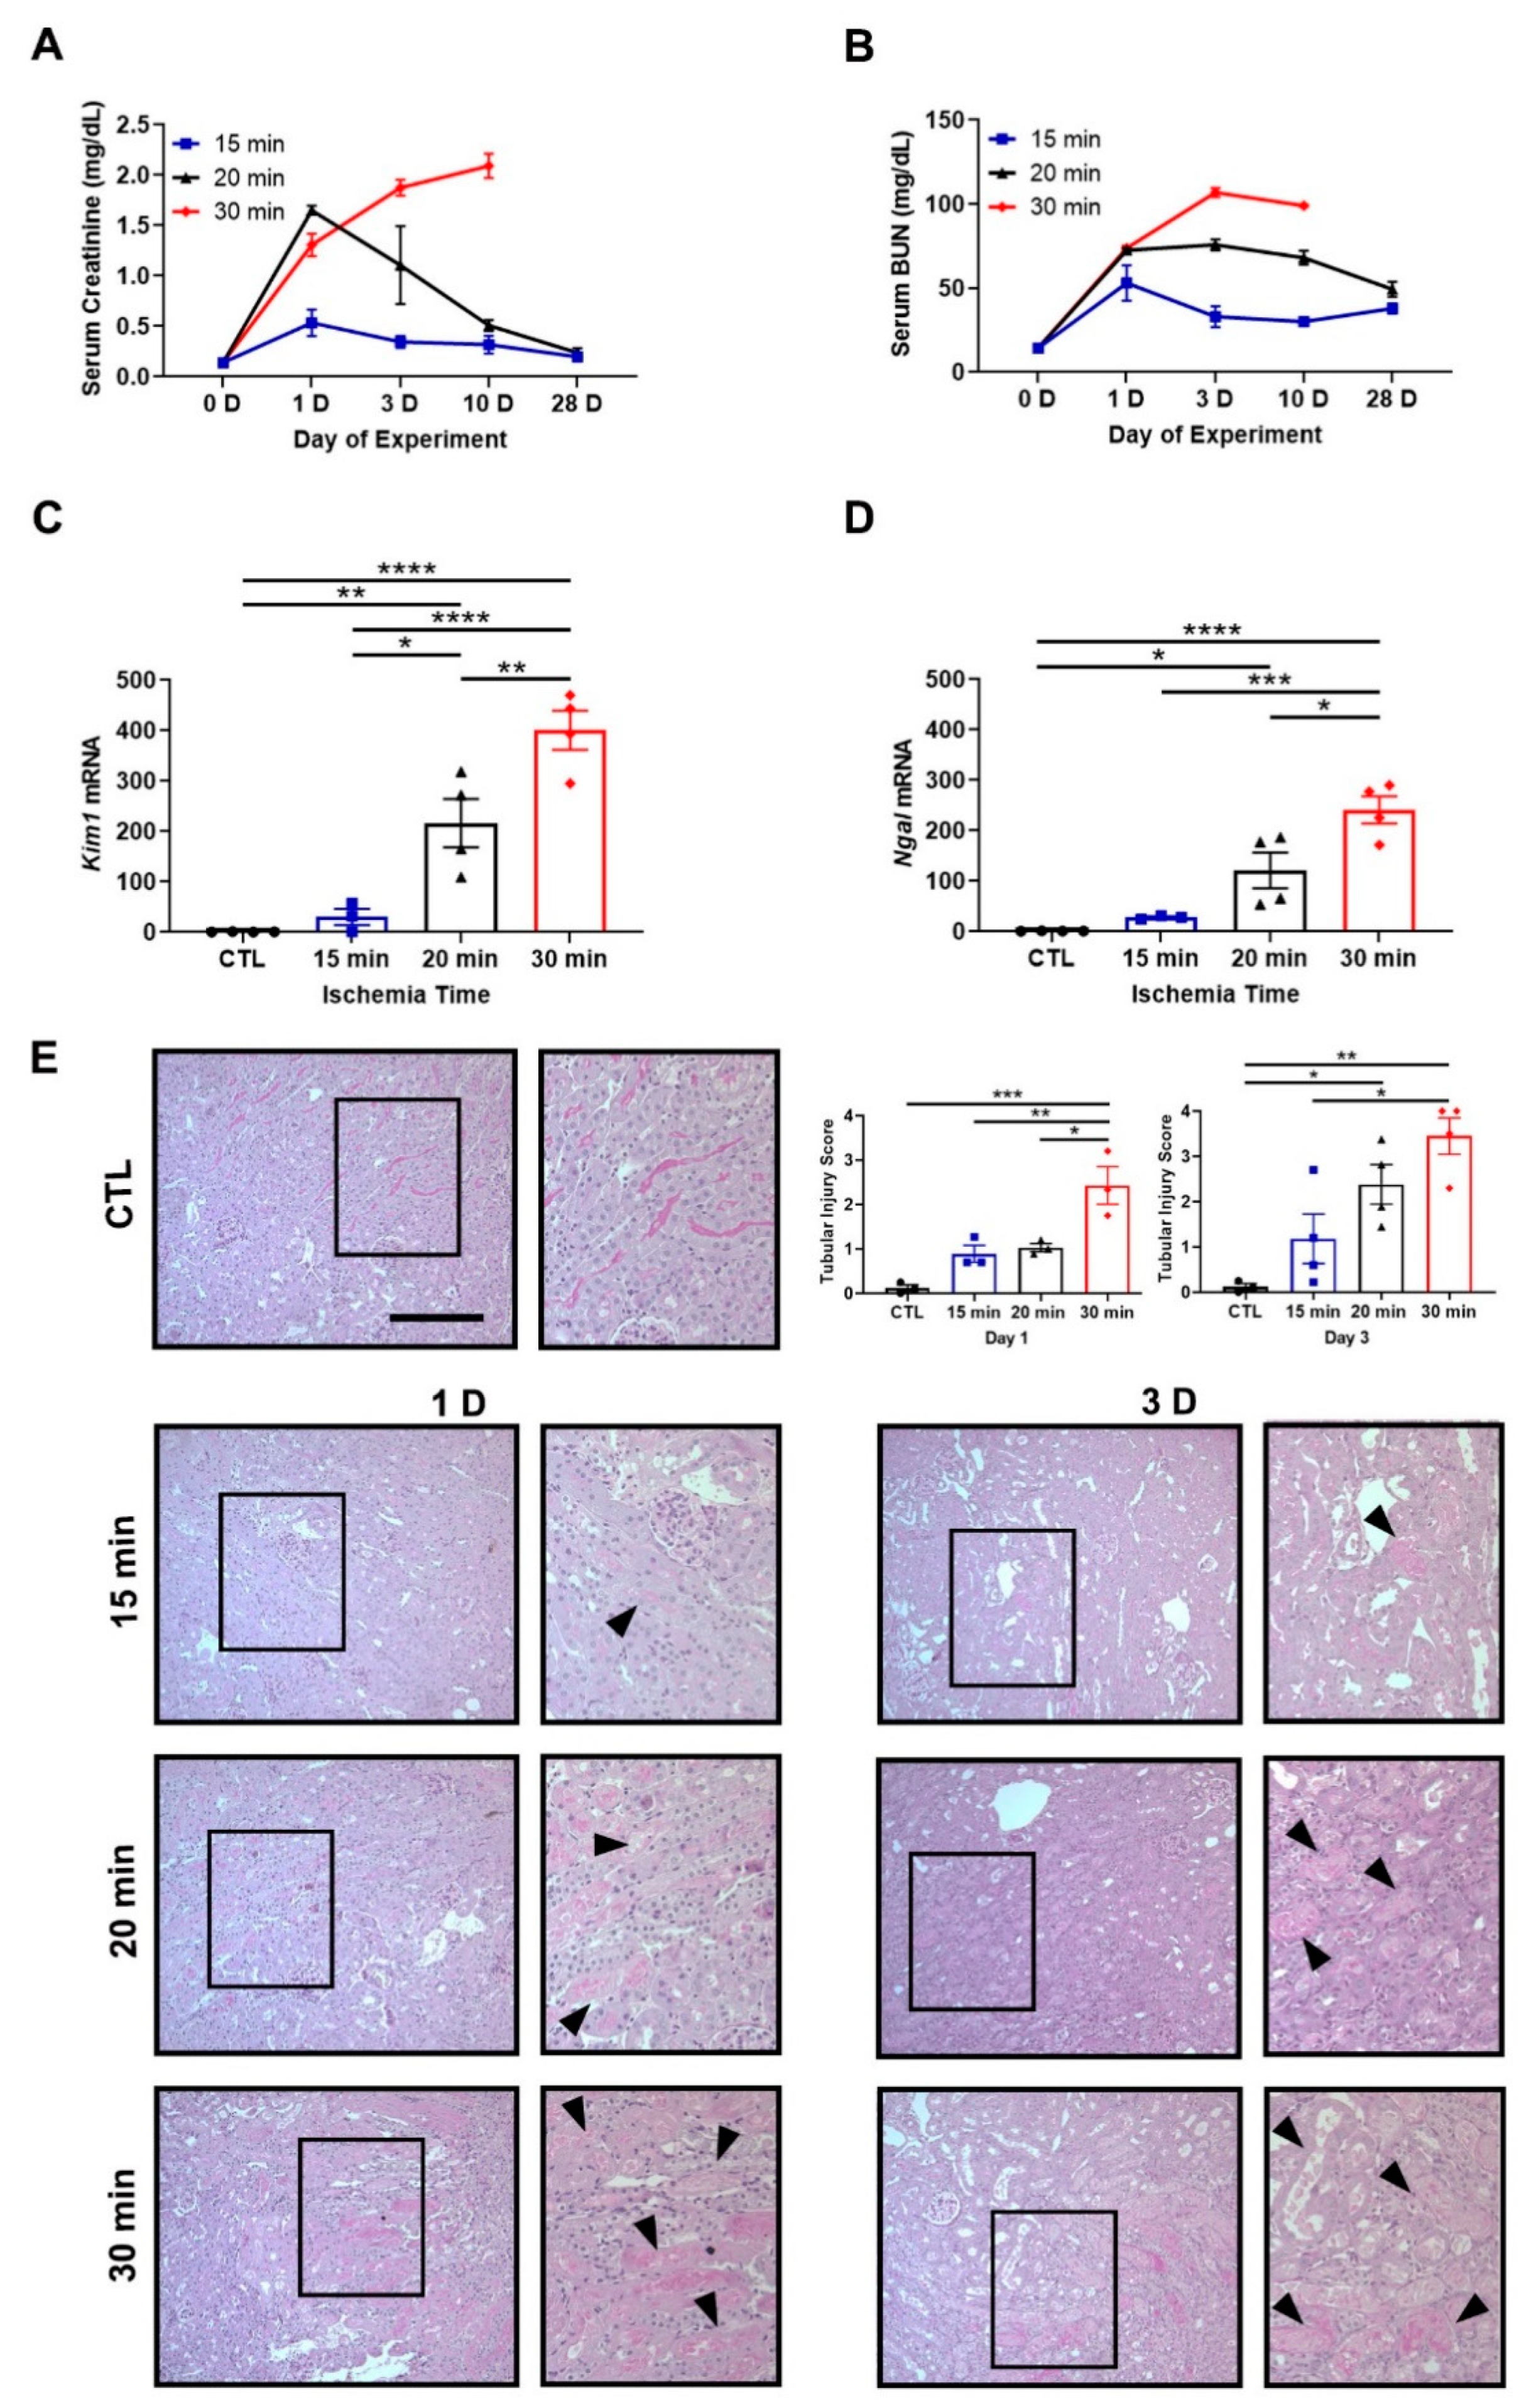
Abstract
1. Introduction
2. Materials and Methods
2.1. Animals
2.2. Antibodies
2.3. Ischemia/Reperfusion Injury
2.4. In Vivo HIF-1α Induction
2.5. Serum Creatinine and Blood Urea Nitrogen
2.6. Histology
2.7. Immunohistochemistry
2.8. Cell Culture
2.9. Immunofluorescence
2.10. Immunoblot
2.11. Co-Immunoprecipitation
2.12. Quantitative, Real-Time Reverse Transcriptase Polymerase Chain Reaction
2.13. Statistical Analysis
3. Results
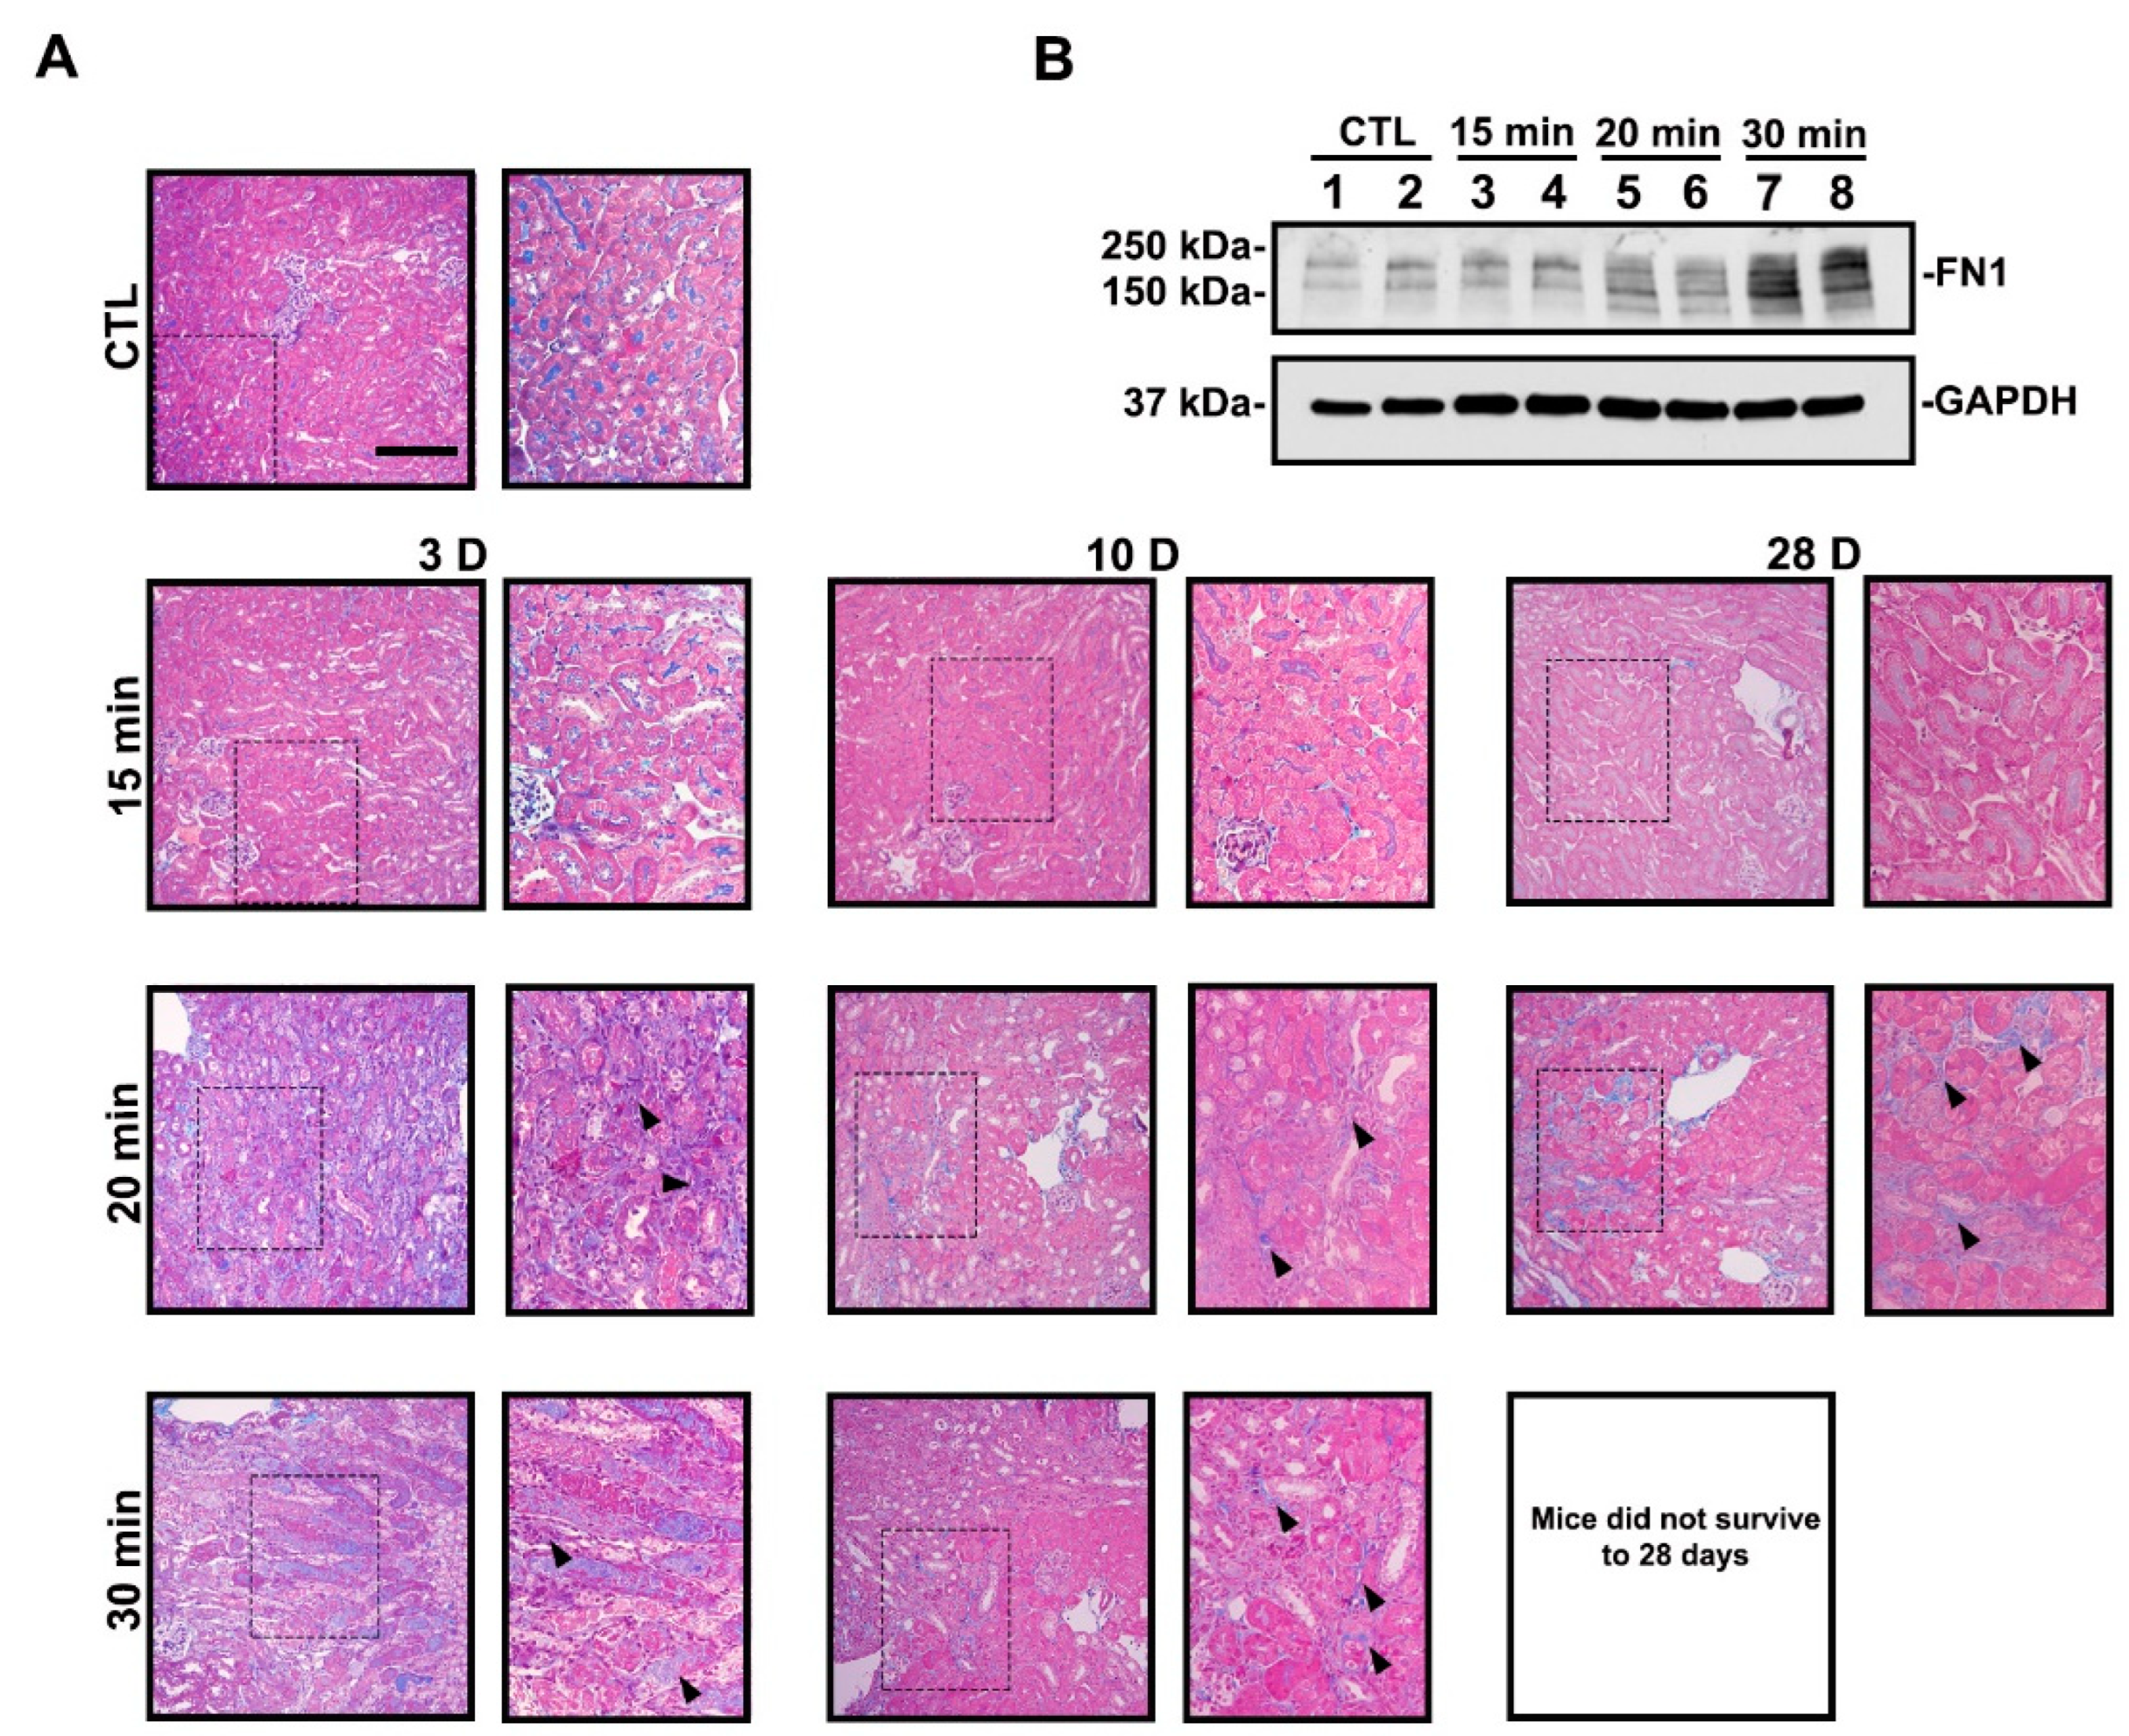
3.1. Severe Ischemia Promotes AKI-to-CKD Progression
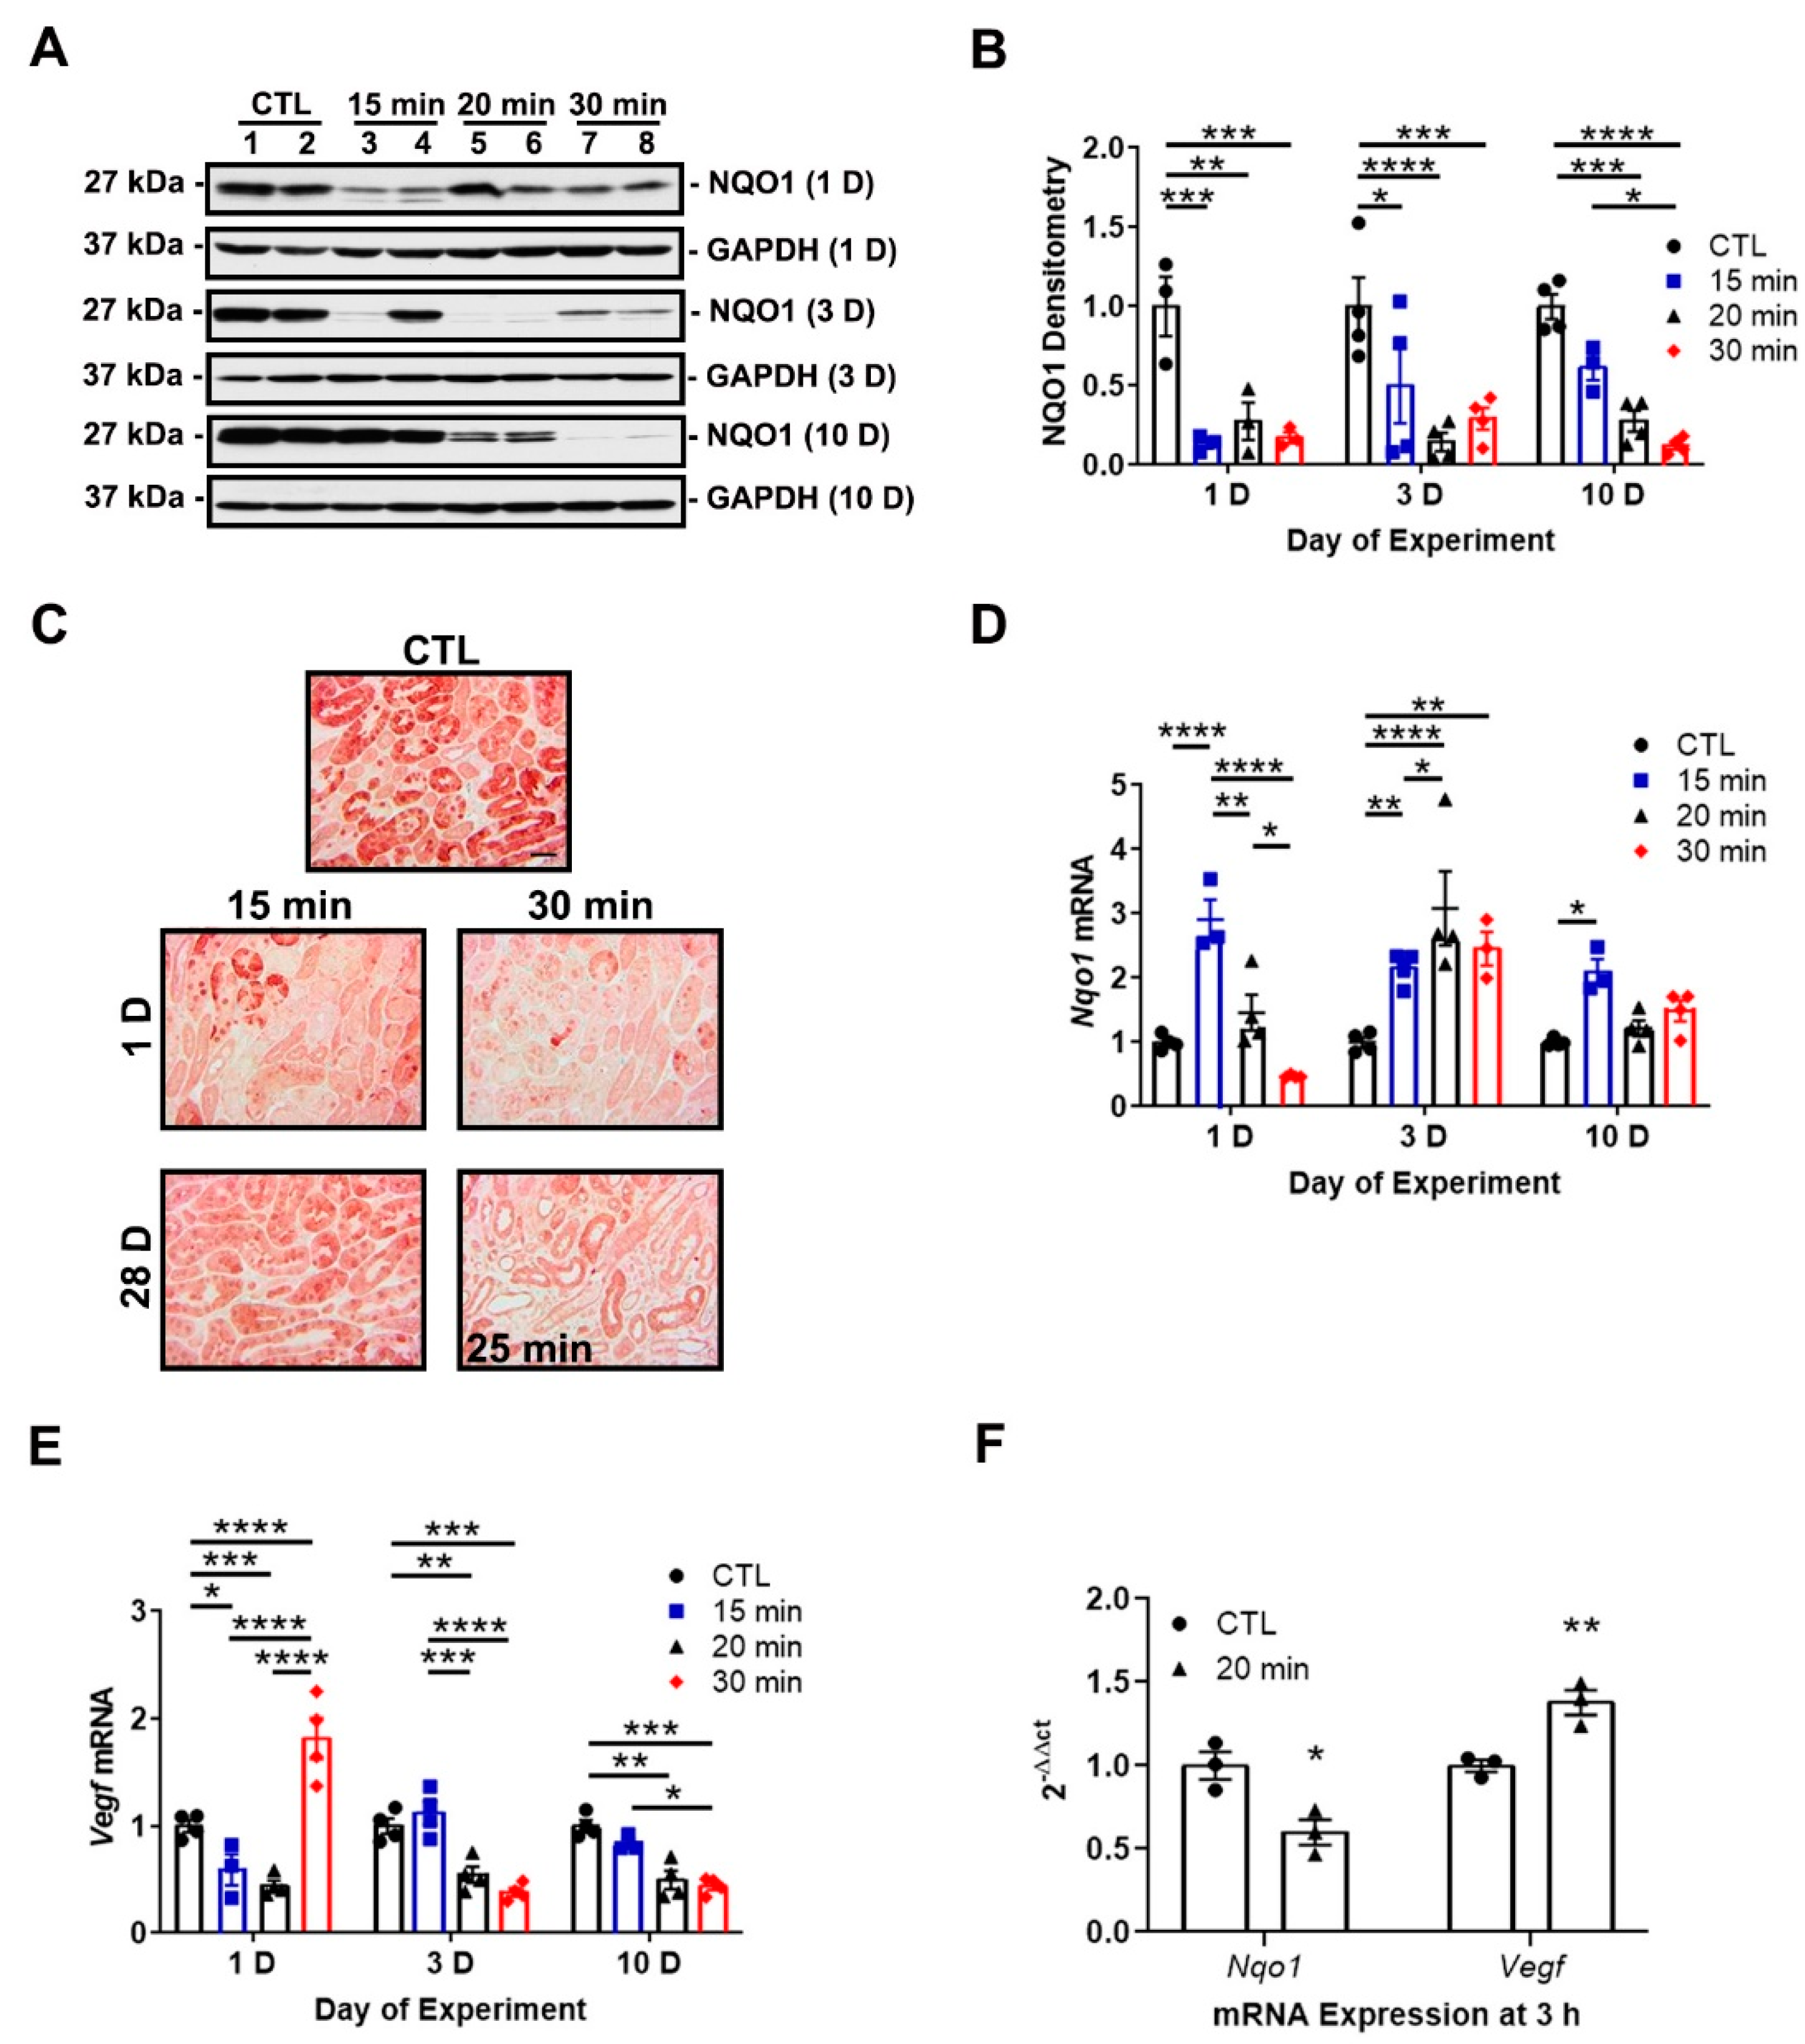
3.2. IRI Severity Determines NRF2 and HIF-1α Activity
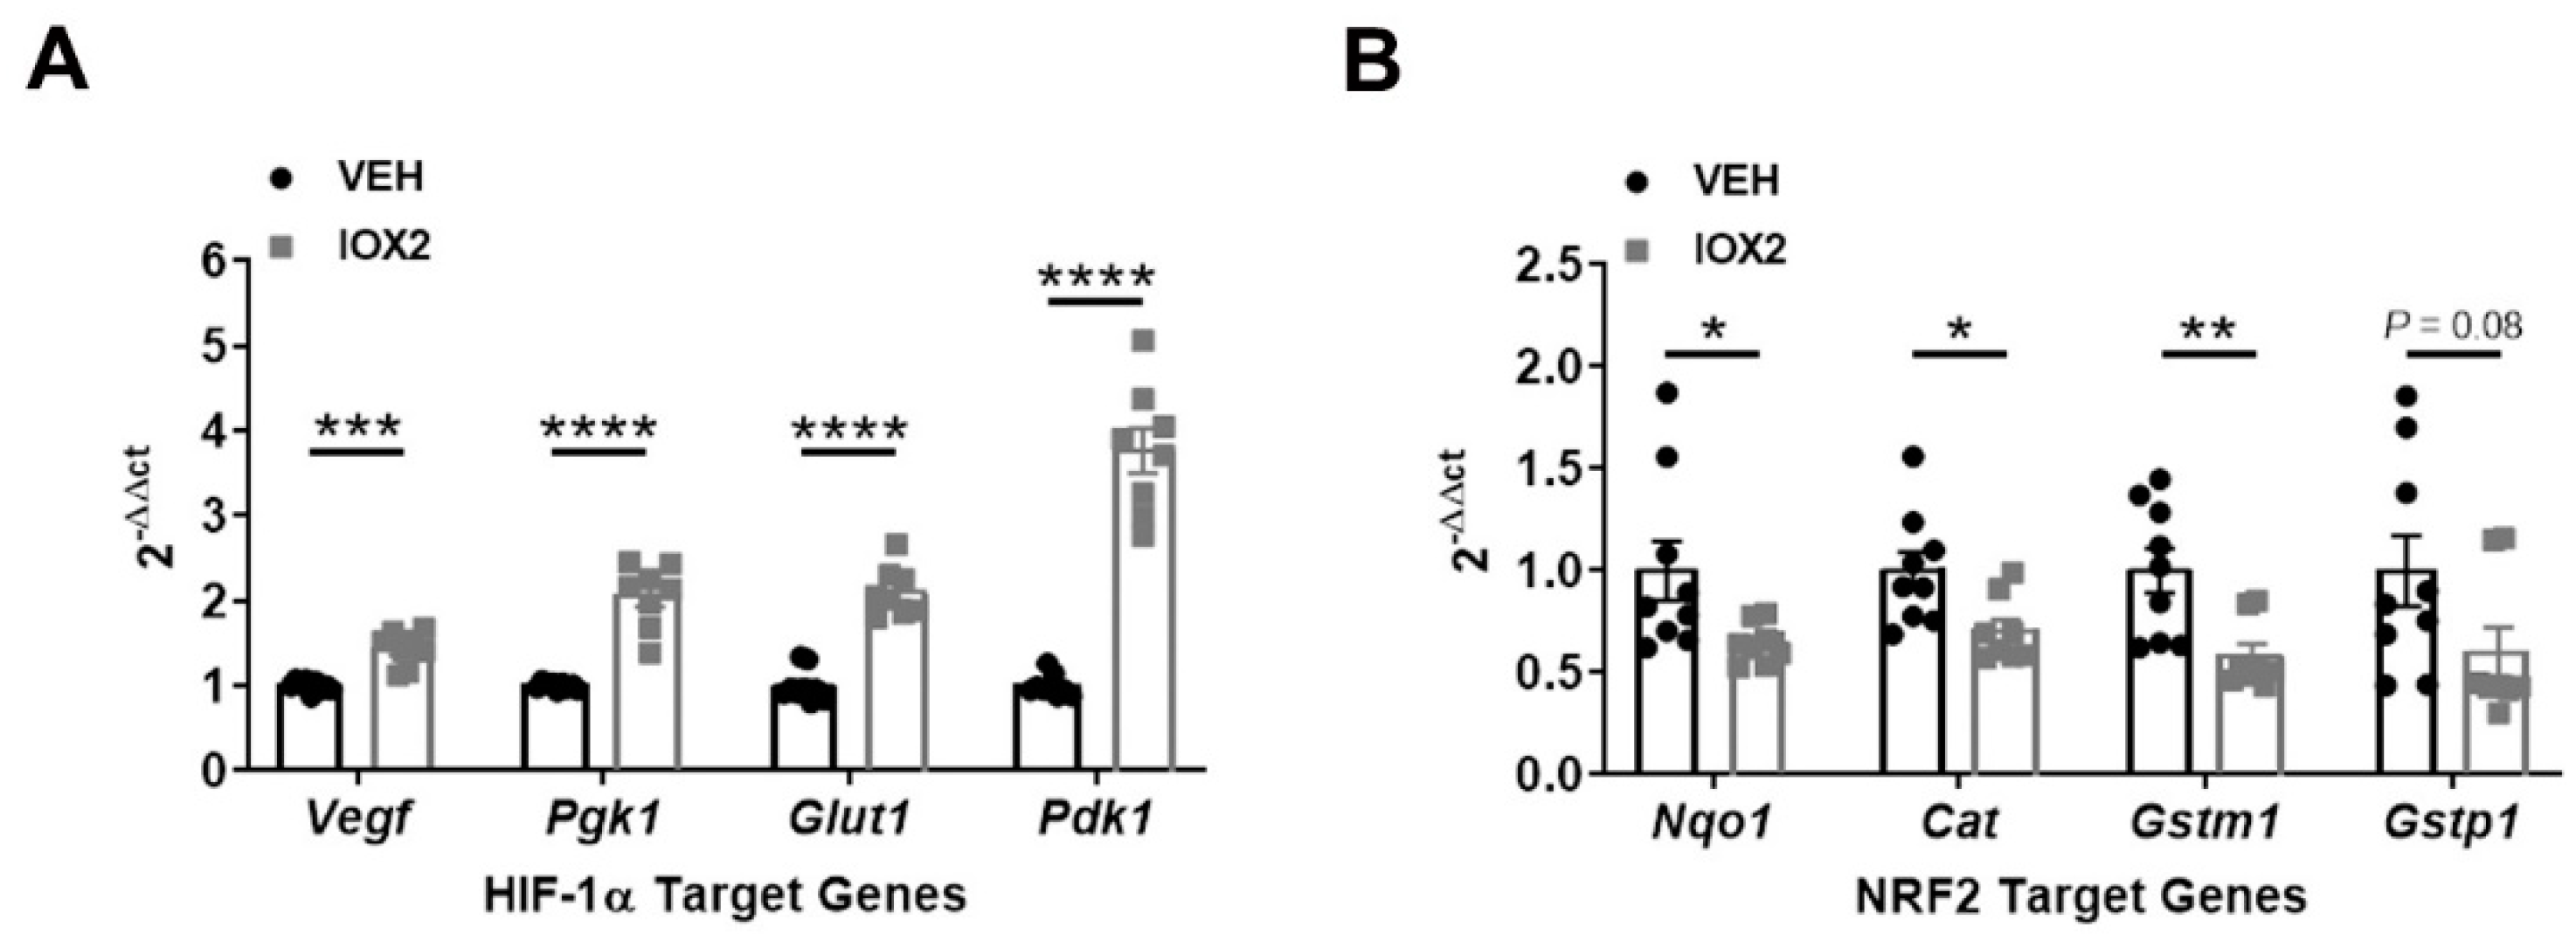
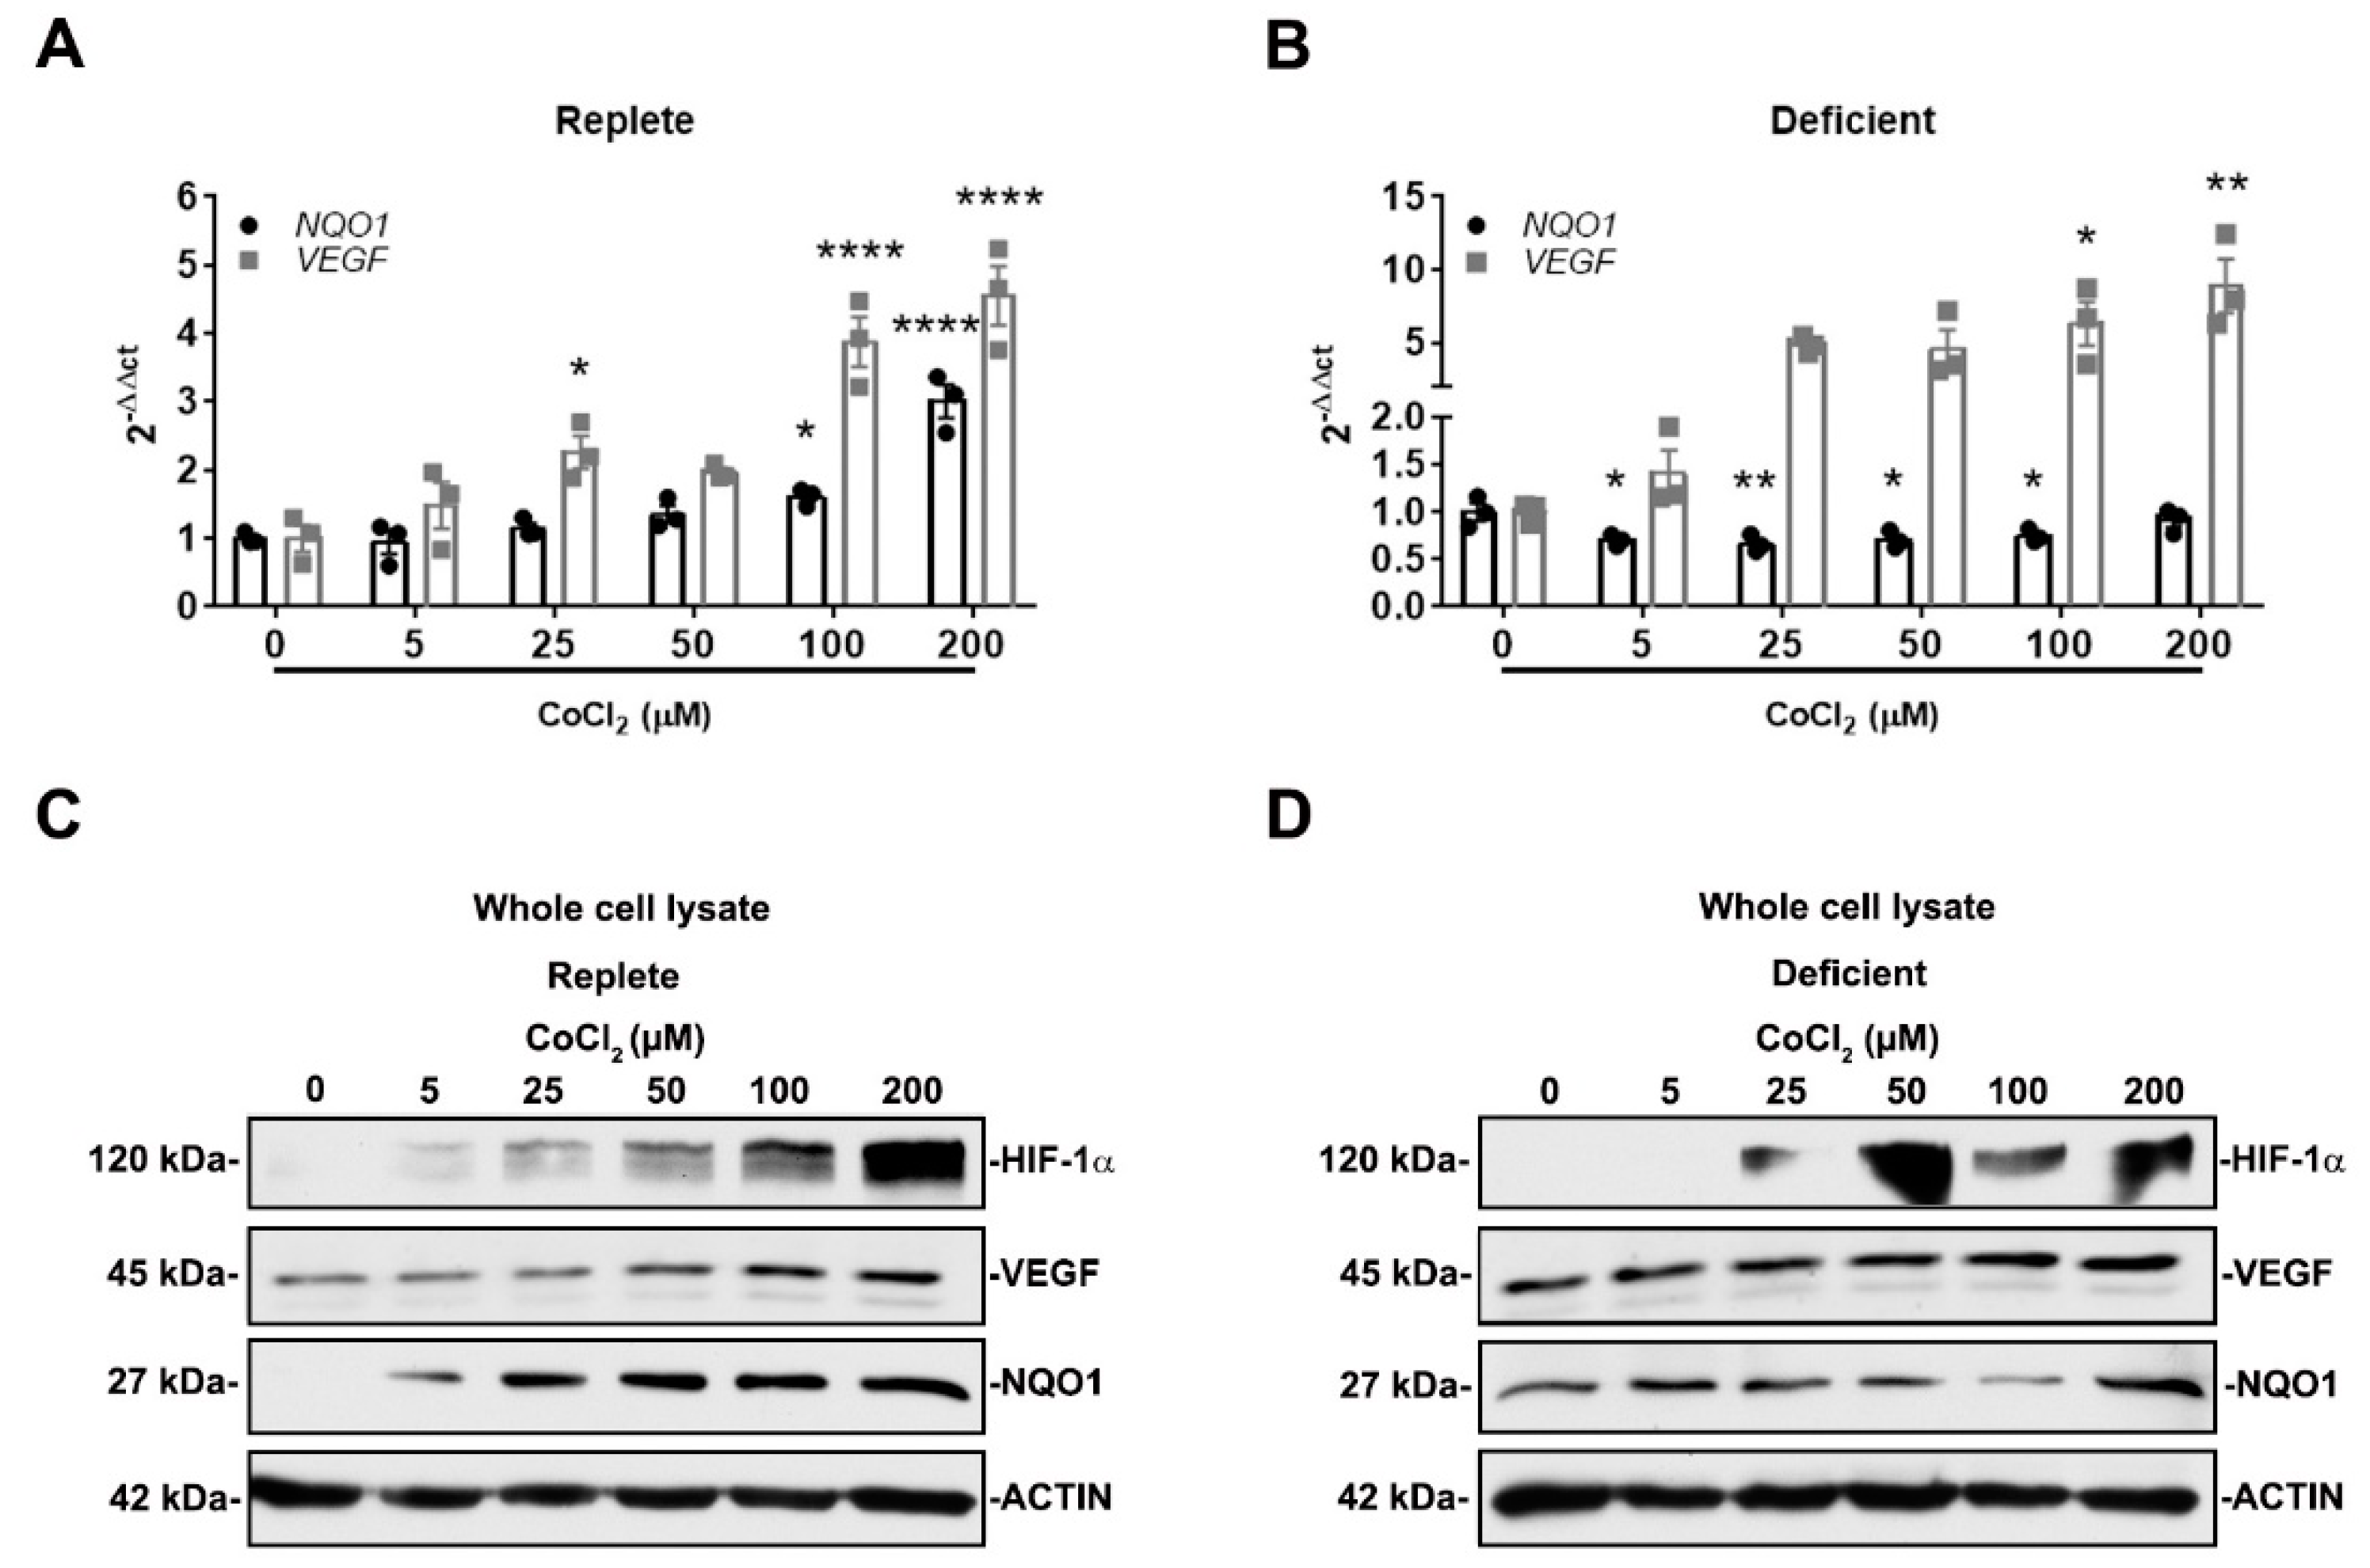
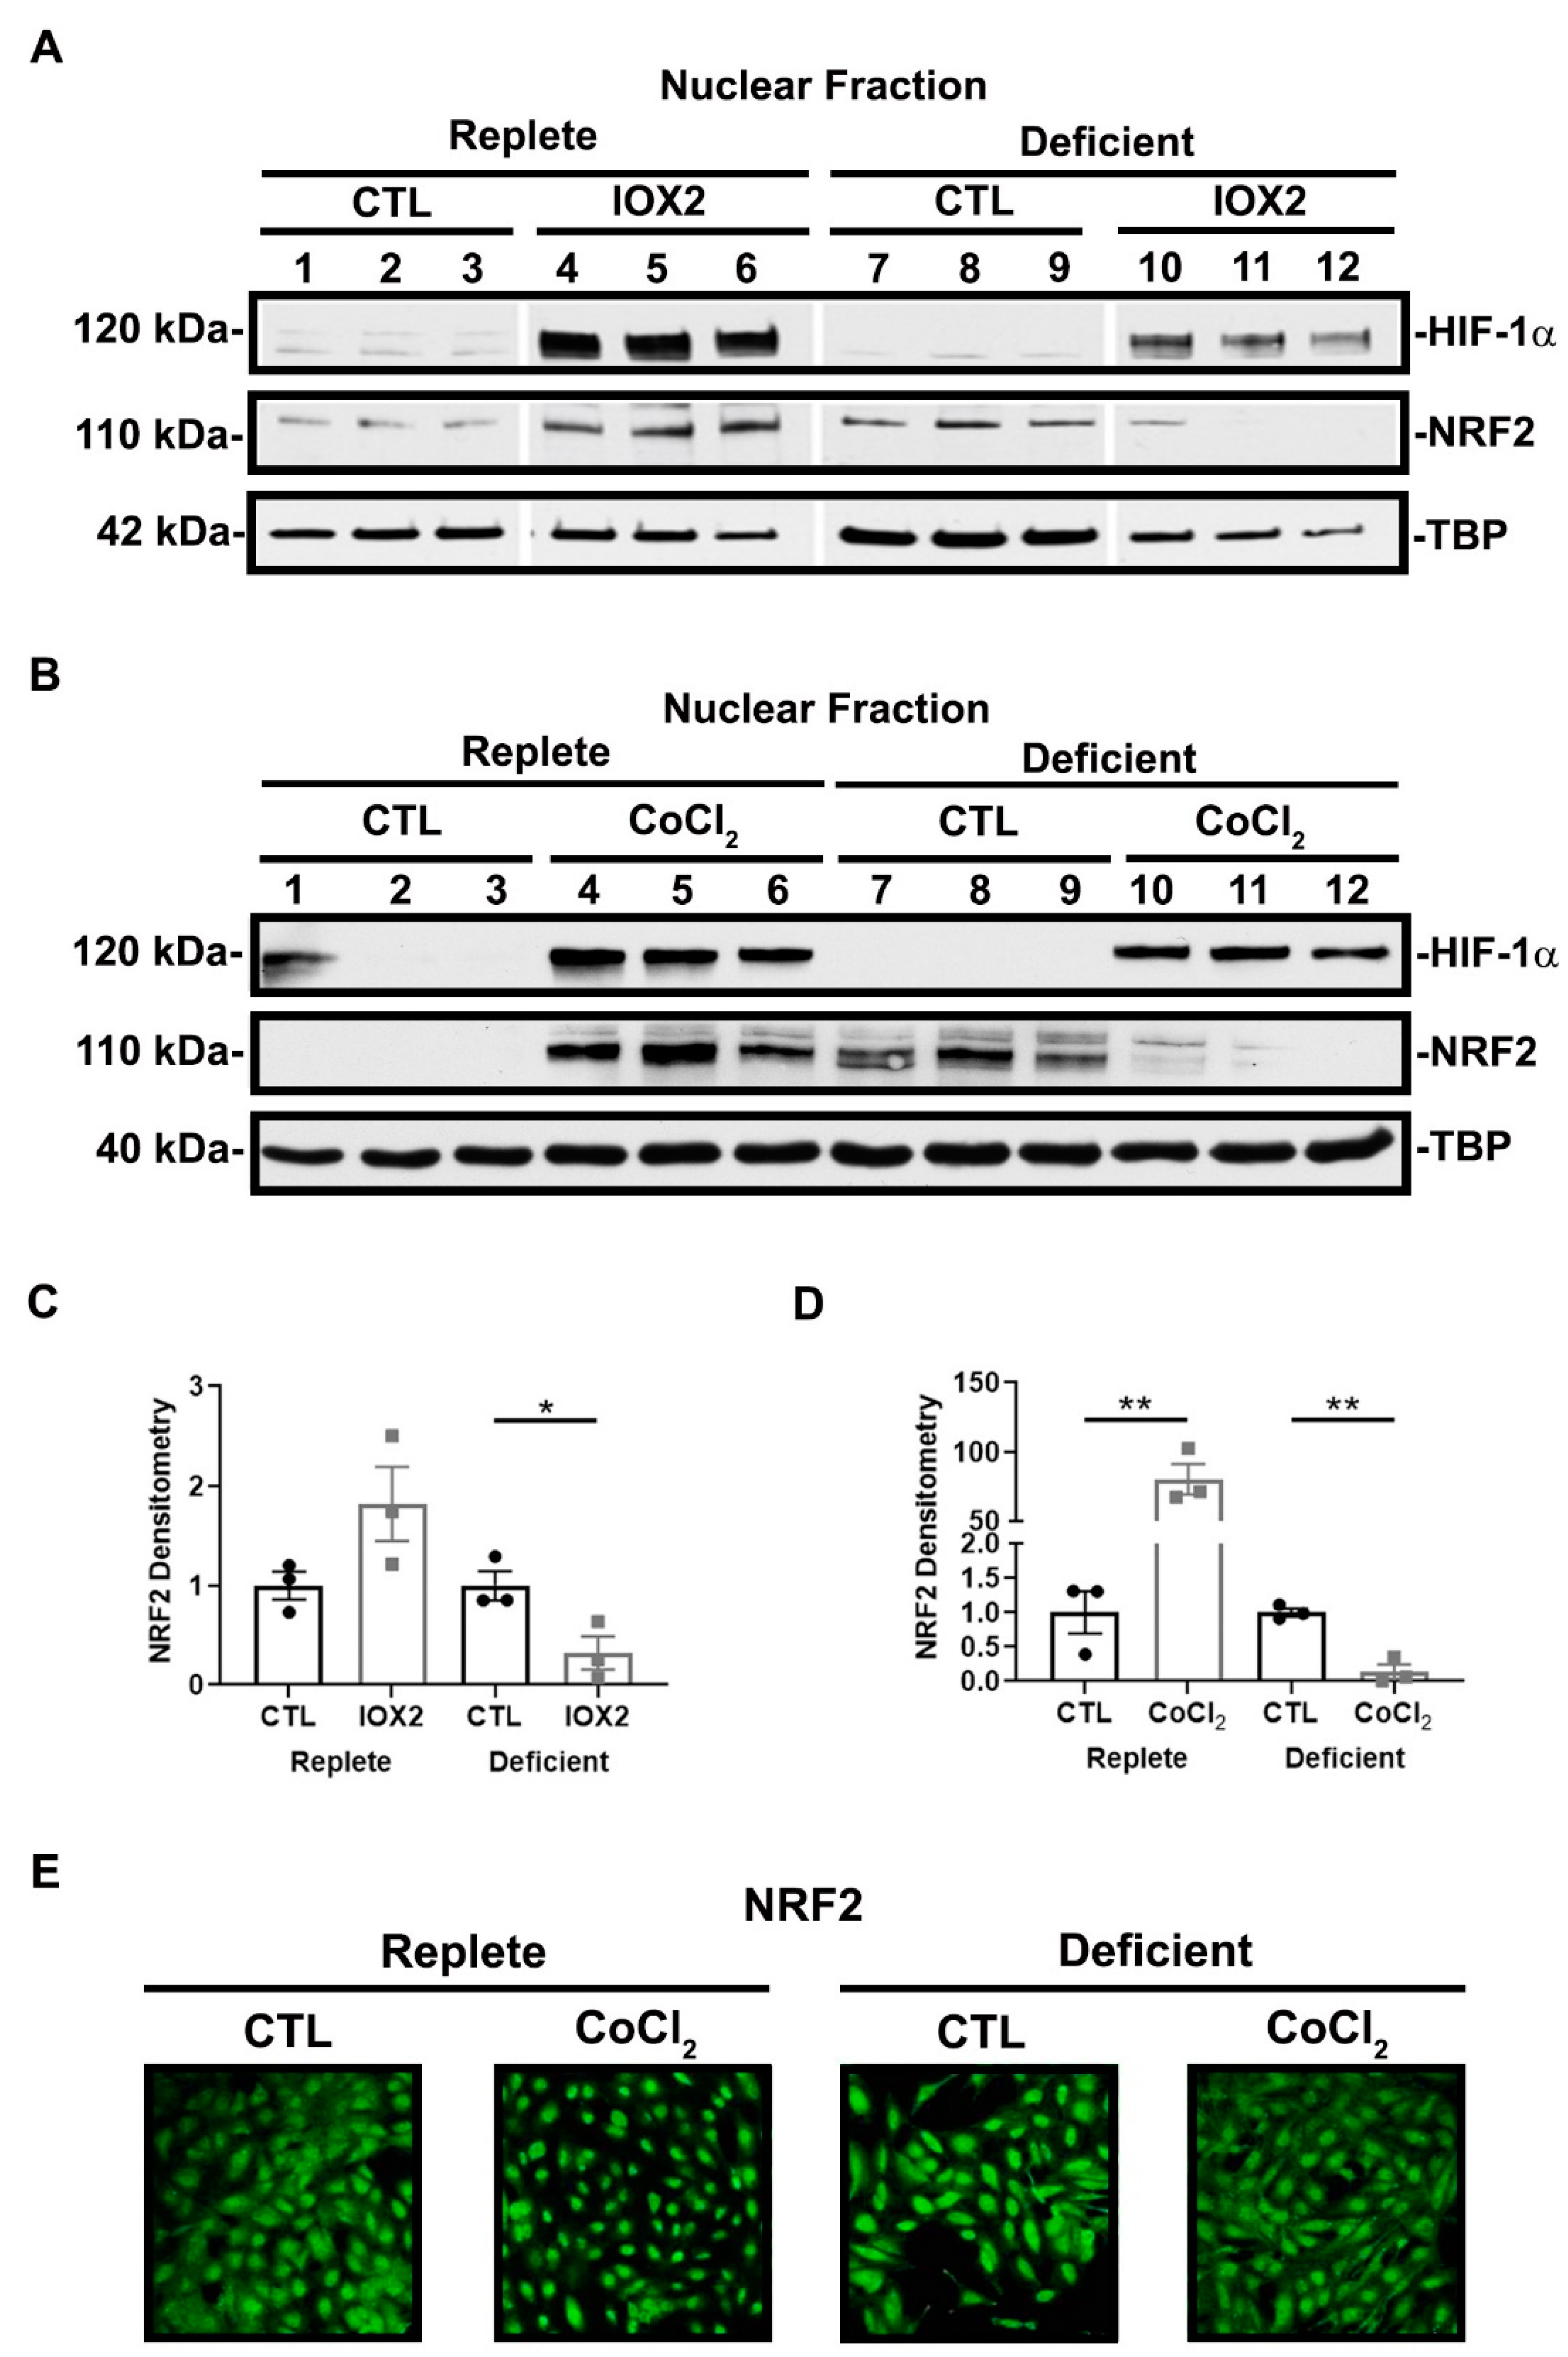
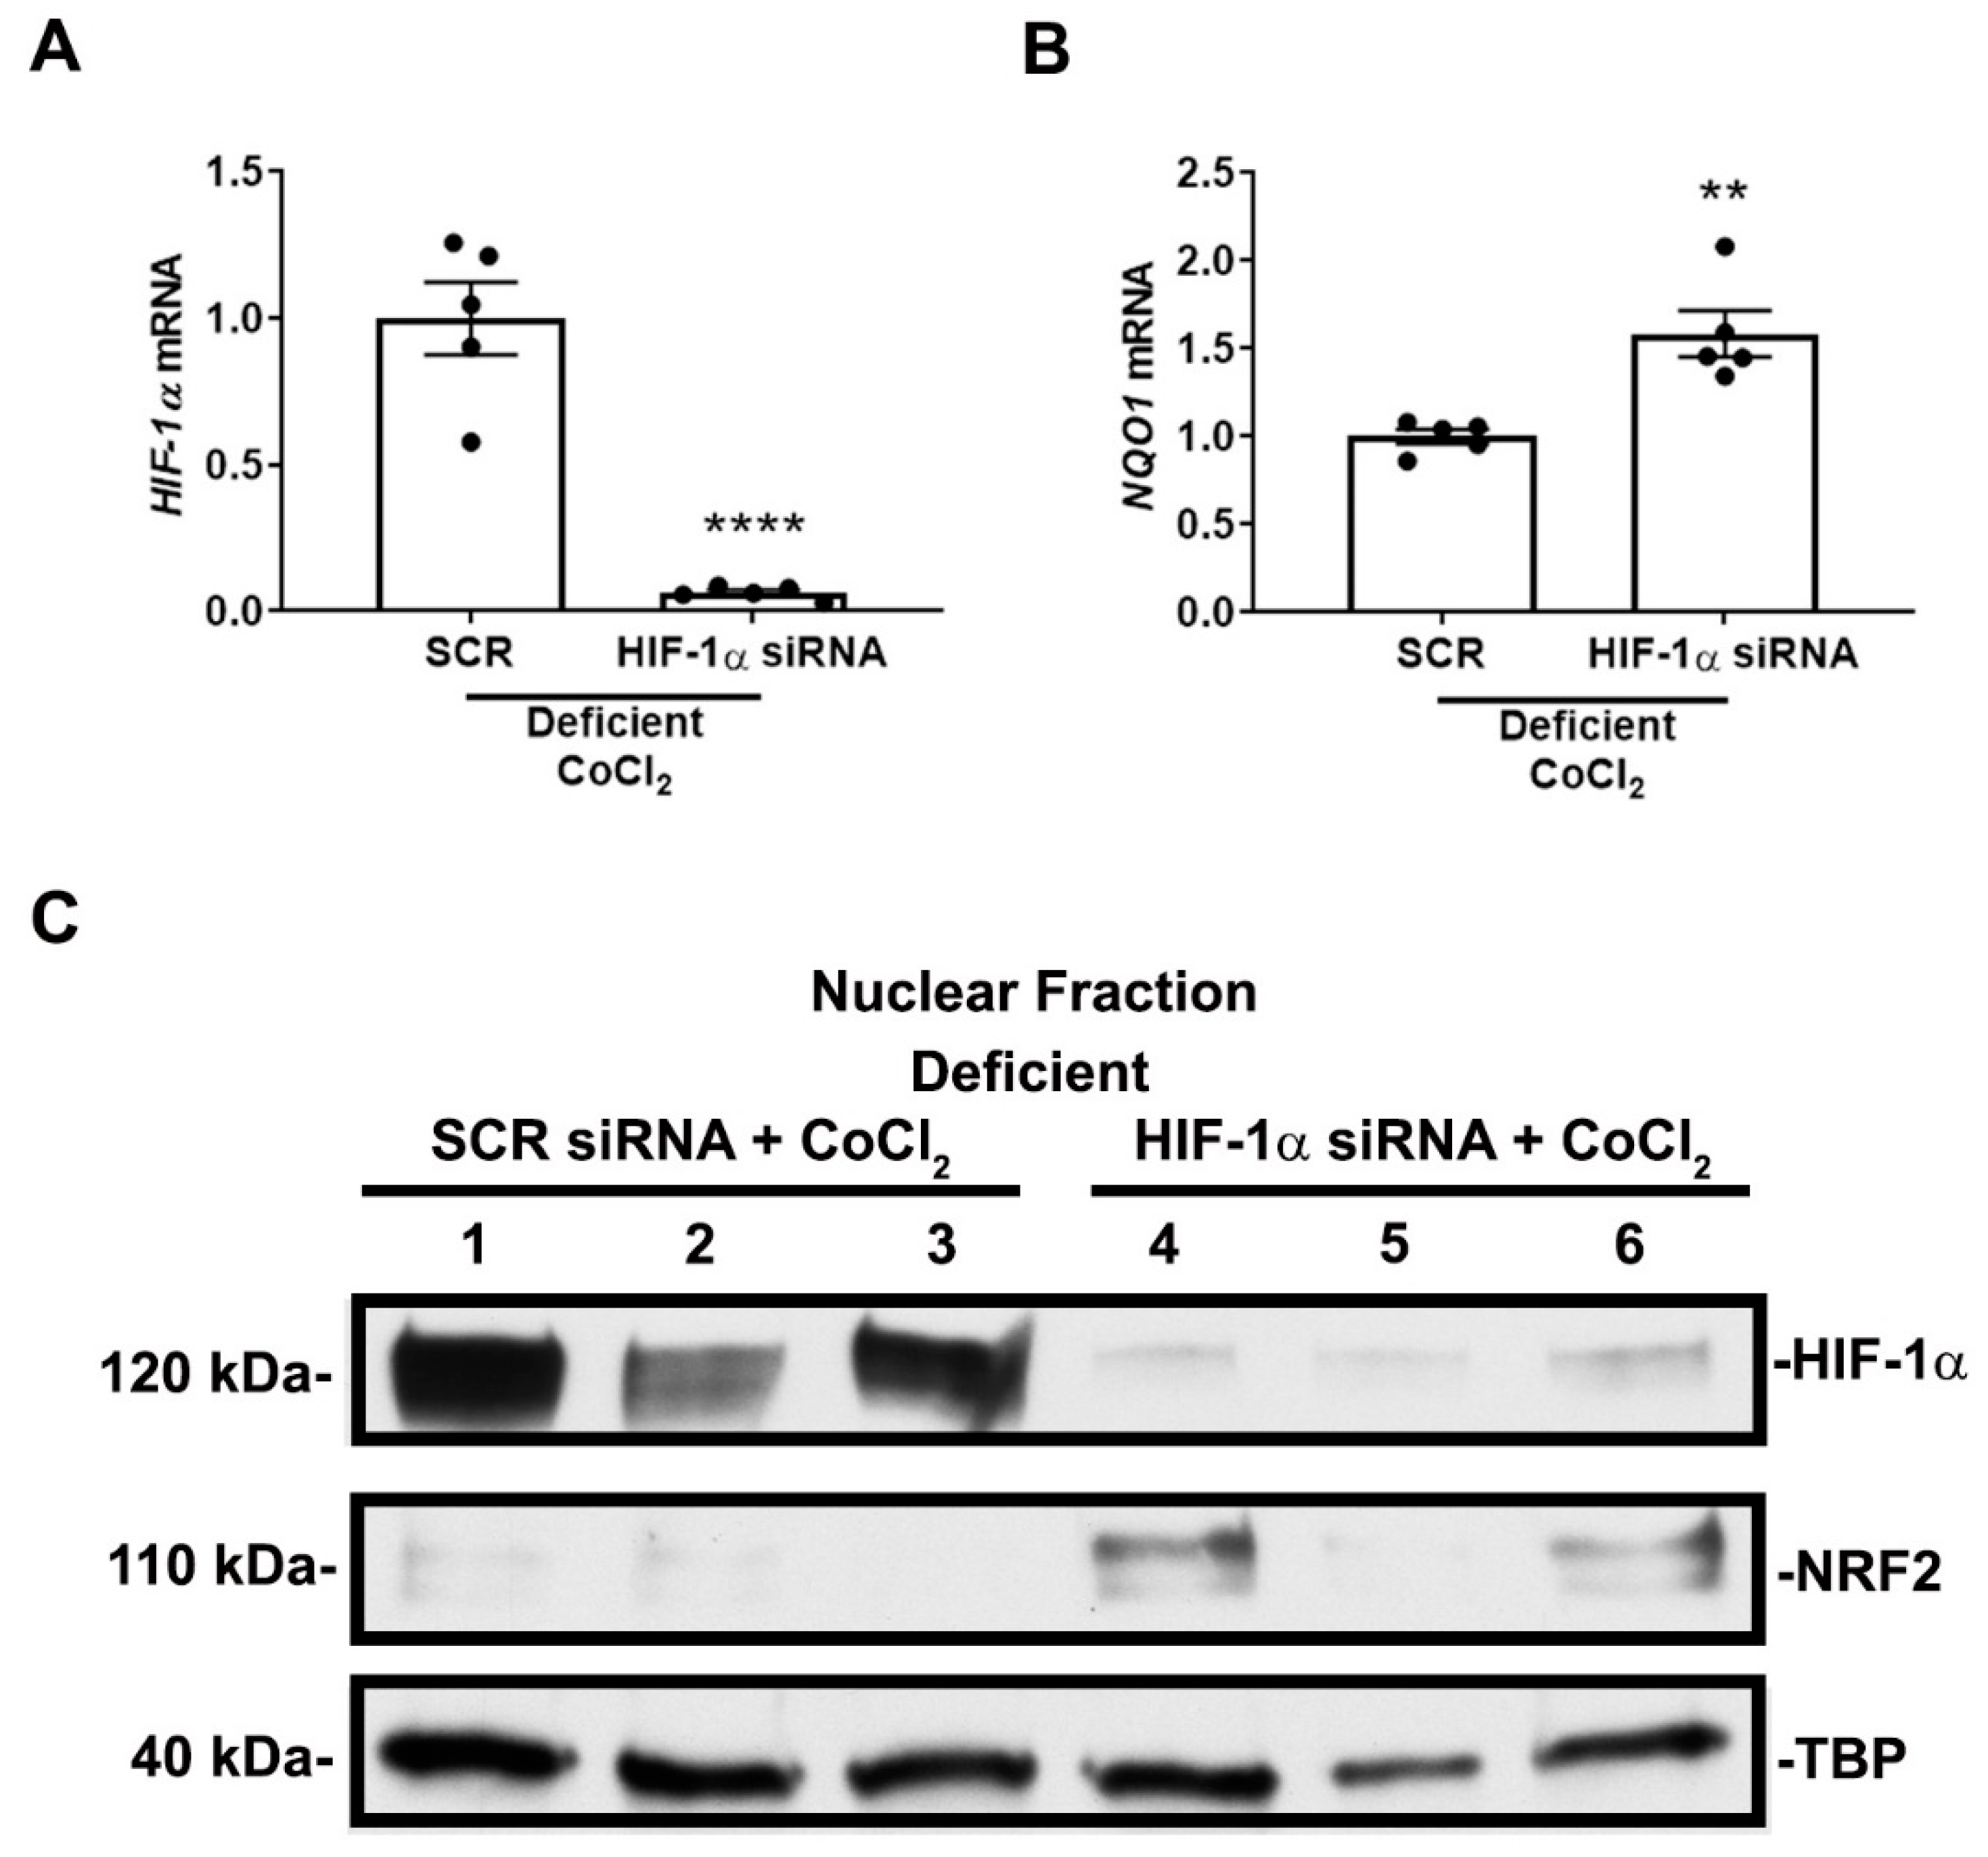
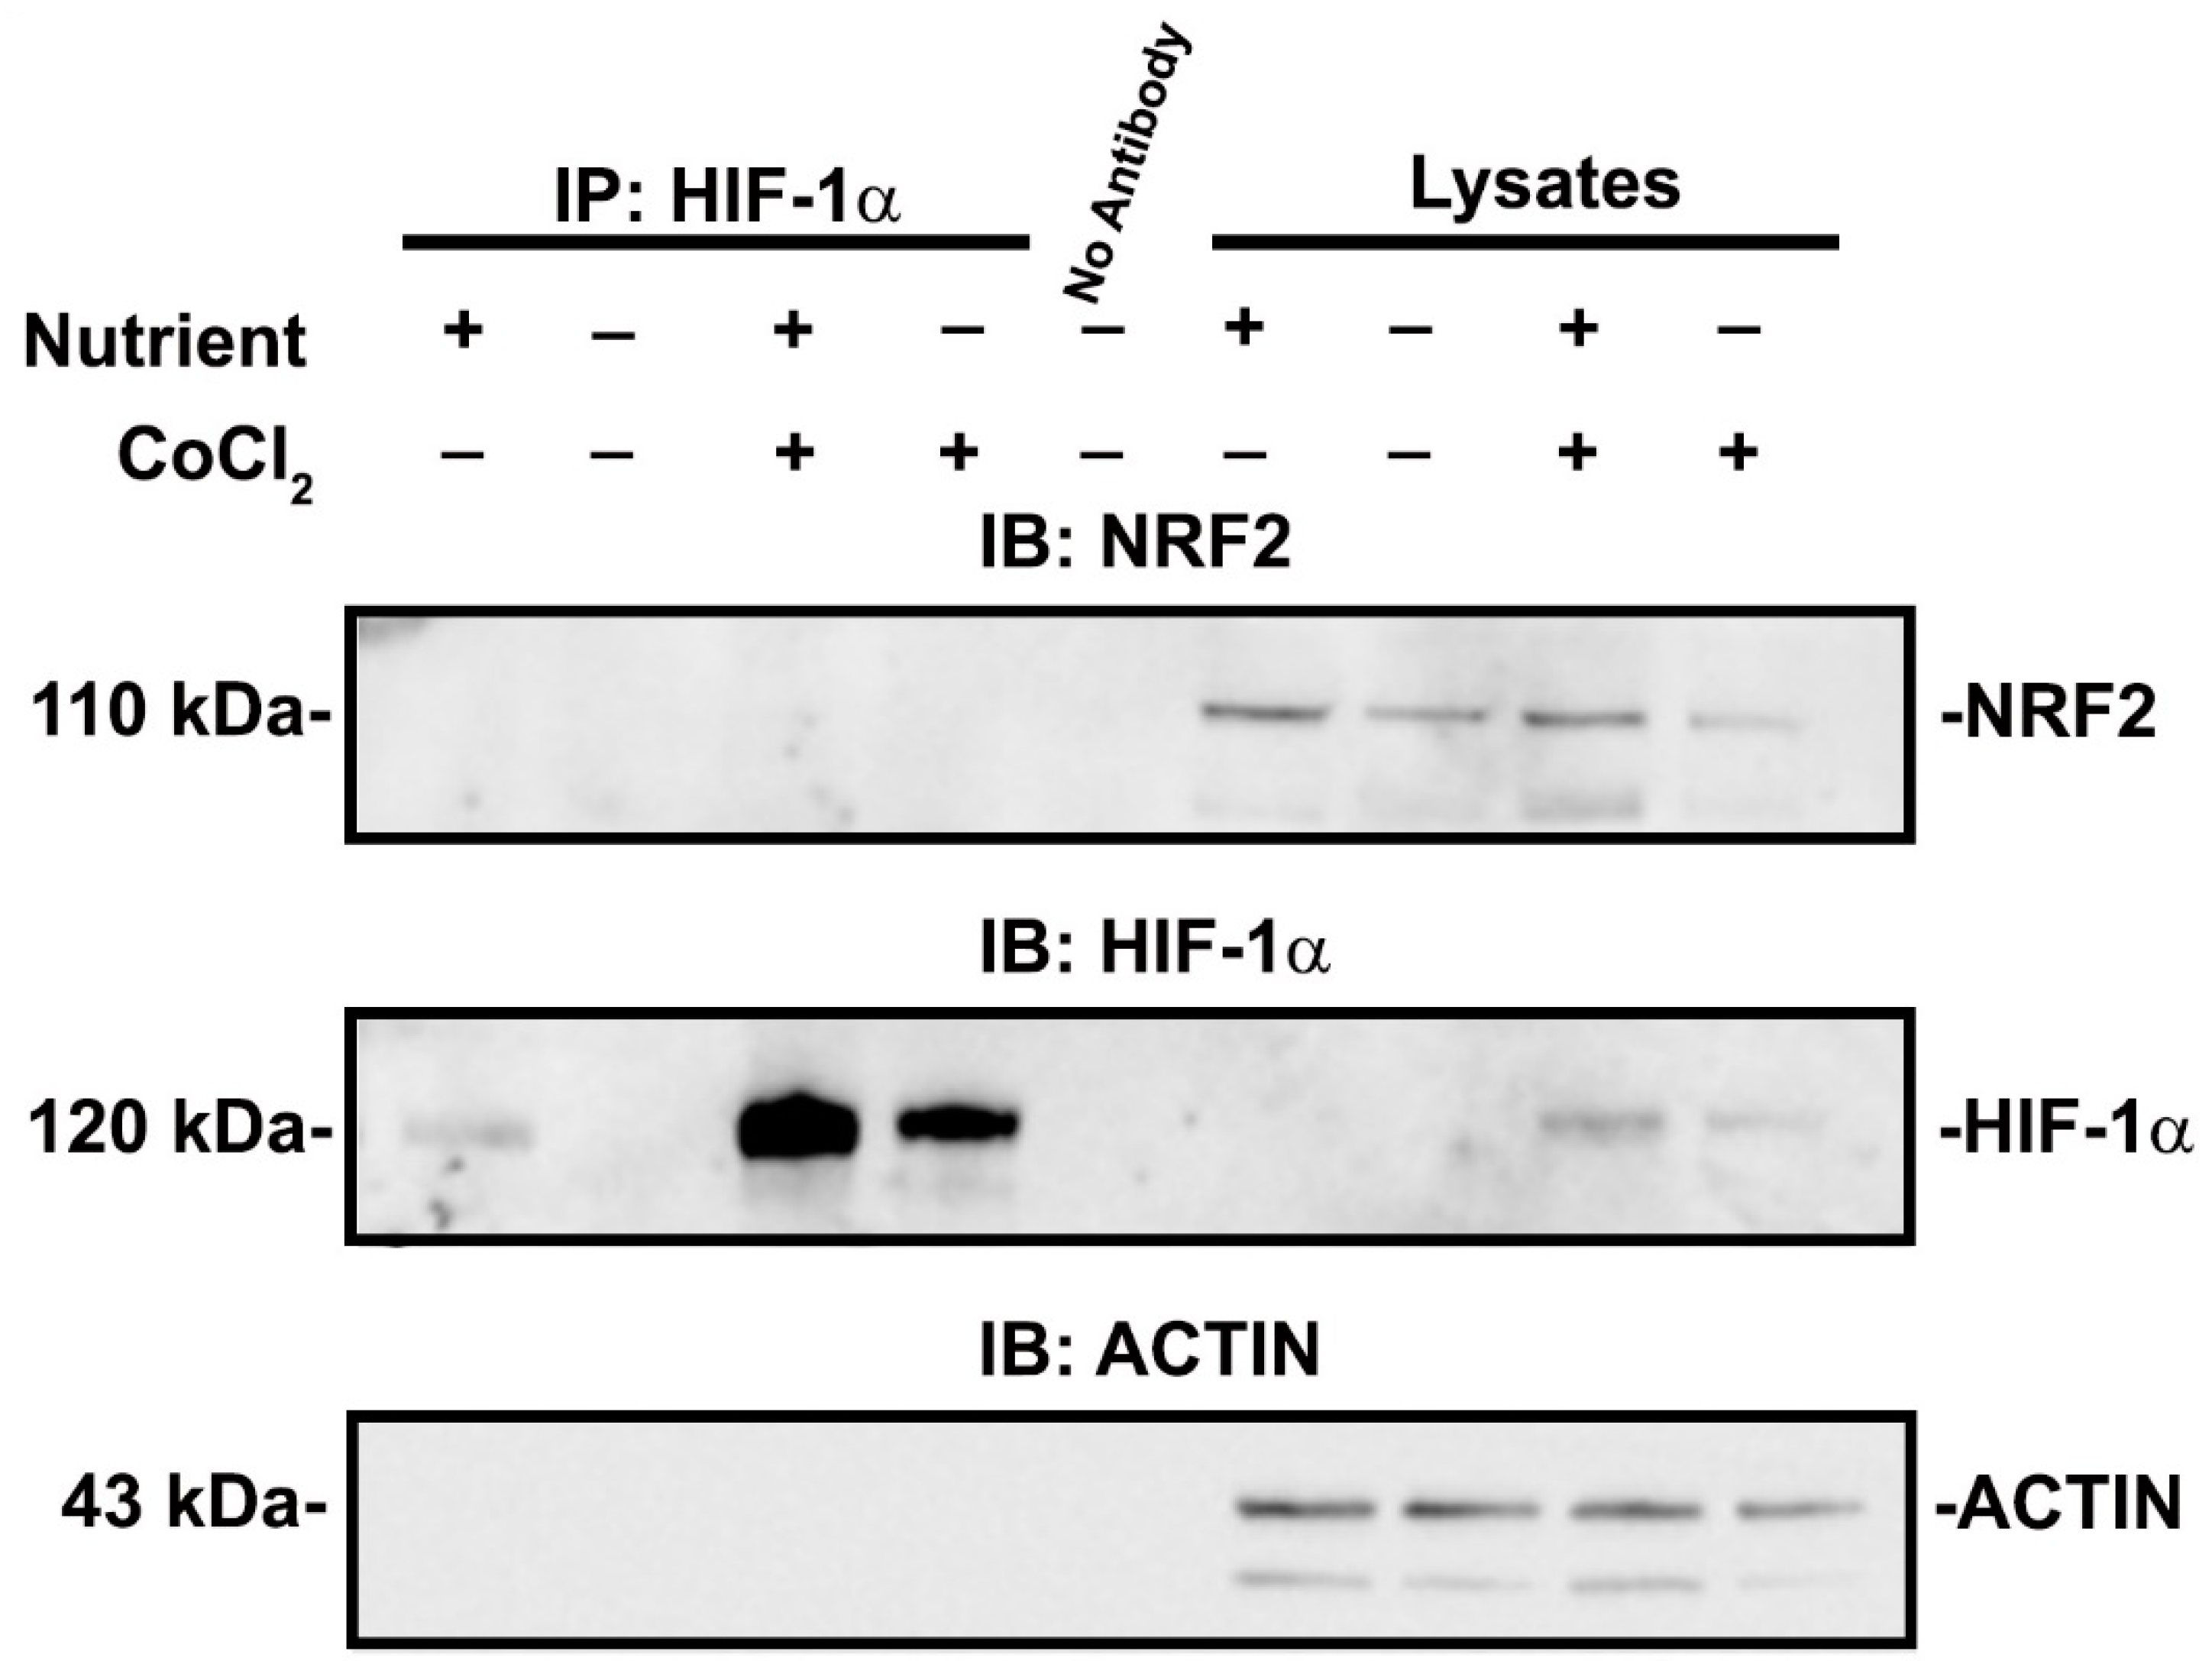
3.3. NRF2 Activity Is Responsive to HIF-1α Activation and Nutrient Availability
4. Discussion
5. Conclusions
Supplementary Materials
Author Contributions
Funding
Institutional Review Board Statement
Informed Consent Statement
Data Availability Statement
Acknowledgments
Conflicts of Interest
References
- Bellomo, R.; Kellum, J.A.; Ronco, C. Acute kidney injury. Lancet 2012, 380, 756–766. [Google Scholar] [CrossRef]
- Chertow, G.M.; Burdick, E.; Honour, M.; Bonventre, J.V.; Bates, D.W. Acute kidney injury, mortality, length of stay, and costs in hospitalized patients. J. Am. Soc. Nephrol. 2005, 16, 3365–3370. [Google Scholar] [CrossRef]
- Mehta, R.L.; Kellum, J.A.; Shah, S.V.; Molitoris, B.A.; Ronco, C.; Warnock, D.G.; Levin, A.; Acute Kidney Injury Network. Acute Kidney Injury Network: Report of an initiative to improve outcomes in acute kidney injury. Crit. Care 2007, 11, R31. [Google Scholar] [CrossRef] [PubMed]
- Rewa, O.; Bagshaw, S.M. Acute kidney injury-epidemiology, outcomes and economics. Nat. Rev. Nephrol. 2014, 10, 193–207. [Google Scholar] [CrossRef] [PubMed]
- Villeneuve, P.M.; Clark, E.G.; Sikora, L.; Sood, M.M.; Bagshaw, S.M. Health-related quality-of-life among survivors of acute kidney injury in the intensive care unit: A systematic review. Intensive Care Med. 2016, 42, 137–146. [Google Scholar] [CrossRef] [PubMed]
- Coca, S.G.; Singanamala, S.; Parikh, C.R. Chronic kidney disease after acute kidney injury: A systematic review and meta-analysis. Kidney Int. 2012, 81, 442–448. [Google Scholar] [CrossRef]
- Schrier, R.W.; Wang, W.; Poole, B.; Mitra, A. Acute renal failure: Definitions, diagnosis, pathogenesis, and therapy. J. Clin. Investig. 2004, 114, 5–14. [Google Scholar] [CrossRef]
- Mimura, I.; Nangaku, M. The suffocating kidney: Tubulointerstitial hypoxia in end-stage renal disease. Nat. Rev. Nephrol. 2010, 6, 667–678. [Google Scholar] [CrossRef] [PubMed]
- Miao, W.; Hu, L.; Scrivens, P.J.; Batist, G. Transcriptional regulation of NF-E2 p45-related factor (NRF2) expression by the aryl hydrocarbon receptor-xenobiotic response element signaling pathway: Direct cross-talk between phase I and II drug-metabolizing enzymes. J. Biol. Chem. 2005, 280, 20340–20348. [Google Scholar] [CrossRef]
- Itoh, K.; Wakabayashi, N.; Katoh, Y.; Ishii, T.; Igarashi, K.; Engel, J.D.; Yamamoto, M. Keap1 represses nuclear activation of antioxidant responsive elements by Nrf2 through binding to the amino-terminal Neh2 domain. Genes Dev. 1999, 13, 76–86. [Google Scholar] [CrossRef]
- Itoh, K.; Wakabayashi, N.; Katoh, Y.; Ishii, T.; O’Connor, T.; Yamamoto, M. Keap1 regulates both cytoplasmic-nuclear shuttling and degradation of Nrf2 in response to electrophiles. Genes Cells 2003, 8, 379–391. [Google Scholar] [CrossRef] [PubMed]
- Kobayashi, A.; Kang, M.I.; Okawa, H.; Ohtsuji, M.; Zenke, Y.; Chiba, T.; Igarashi, K.; Yamamoto, M. Oxidative stress sensor Keap1 functions as an adaptor for Cul3-based E3 ligase to regulate proteasomal degradation of Nrf2. Mol. Cell. Biol. 2004, 24, 7130–7139. [Google Scholar] [CrossRef] [PubMed]
- Mutter, F.E.; Park, B.K.; Copple, I.M. Value of monitoring Nrf2 activity for the detection of chemical and oxidative stress. Biochem. Soc. Trans. 2015, 43, 657–662. [Google Scholar] [CrossRef] [PubMed]
- Yamamoto, M.; Kensler, T.W.; Motohashi, H. The KEAP1-NRF2 System: A Thiol-Based Sensor-Effector Apparatus for Maintaining Redox Homeostasis. Physiol. Rev. 2018, 98, 1169–1203. [Google Scholar] [CrossRef] [PubMed]
- Liu, M.; Grigoryev, D.N.; Crow, M.T.; Haas, M.; Yamamoto, M.; Reddy, S.P.; Rabb, H. Transcription factor Nrf2 is protective during ischemic and nephrotoxic acute kidney injury in mice. Kidney Int. 2009, 76, 277–285. [Google Scholar] [CrossRef]
- Liu, M.; Reddy, N.M.; Higbee, E.M.; Potteti, H.R.; Noel, S.; Racusen, L.; Kensler, T.W.; Sporn, M.B.; Reddy, S.P.; Rabb, H. The Nrf2 triterpenoid activator, CDDO-imidazolide, protects kidneys from ischemia-reperfusion injury in mice. Kidney Int. 2014, 85, 134–141. [Google Scholar] [CrossRef]
- Tan, R.J.; Chartoumpekis, D.V.; Rush, B.M.; Zhou, D.; Fu, H.; Kensler, T.W.; Liu, Y. Keap1 hypomorphism protects against ischemic and obstructive kidney disease. Sci. Rep. 2016, 6, 36185. [Google Scholar] [CrossRef]
- Nezu, M.; Souma, T.; Yu, L.; Suzuki, T.; Saigusa, D.; Ito, S.; Suzuki, N.; Yamamoto, M. Transcription factor Nrf2 hyperactivation in early-phase renal ischemia-reperfusion injury prevents tubular damage progression. Kidney Int. 2017, 91, 387–401. [Google Scholar] [CrossRef]
- Lu, M.; Wang, P.; Qiao, Y.; Jiang, C.; Ge, Y.; Flickinger, B.; Malhotra, D.K.; Dworkin, L.D.; Liu, Z.; Gong, R. GSK3β-mediated Keap1-independent regulation of Nrf2 antioxidant response: A molecular rheostat of acute kidney injury to chronic kidney disease transition. Redox Biol. 2019, 26, 101275. [Google Scholar] [CrossRef] [PubMed]
- Bernhardt, W.M.; Schmitt, R.; Rosenberger, C.; Munchenhagen, P.M.; Grone, H.J.; Frei, U.; Warnecke, C.; Bachmann, S.; Wiesener, M.S.; Willam, C.; et al. Expression of hypoxia-inducible transcription factors in developing human and rat kidneys. Kidney Int. 2006, 69, 114–122. [Google Scholar] [CrossRef]
- Rosenberger, C.; Mandriota, S.; Jurgensen, J.S.; Wiesener, M.S.; Horstrup, J.H.; Frei, U.; Ratcliffe, P.J.; Maxwell, P.H.; Bachmann, S.; Eckardt, K.U. Expression of hypoxia-inducible factor-1α and -2α in hypoxic and ischemic rat kidneys. J. Am. Soc. Nephrol. 2002, 13, 1721–1732. [Google Scholar] [CrossRef] [PubMed]
- Appelhoff, R.J.; Tian, Y.M.; Raval, R.R.; Turley, H.; Harris, A.L.; Pugh, C.W.; Ratcliffe, P.J.; Gleadle, J.M. Differential function of the prolyl hydroxylases PHD1, PHD2, and PHD3 in the regulation of hypoxia-inducible factor. J. Biol. Chem. 2004, 279, 38458–38465. [Google Scholar] [CrossRef]
- Berra, E.; Benizri, E.; Ginouves, A.; Volmat, V.; Roux, D.; Pouyssegur, J. HIF prolyl-hydroxylase 2 is the key oxygen sensor setting low steady-state levels of HIF-1alpha in normoxia. EMBO J. 2003, 22, 4082–4090. [Google Scholar] [CrossRef] [PubMed]
- Ke, Q.; Costa, M. Hypoxia-inducible factor-1 (HIF-1). Mol. Pharmacol. 2006, 70, 1469–1480. [Google Scholar] [CrossRef]
- Mole, D.R.; Blancher, C.; Copley, R.R.; Pollard, P.J.; Gleadle, J.M.; Ragoussis, J.; Ratcliffe, P.J. Genome-wide association of hypoxia-inducible factor (HIF)-1α and HIF-2α DNA binding with expression profiling of hypoxia-inducible transcripts. J. Biol. Chem. 2009, 284, 16767–16775. [Google Scholar] [CrossRef] [PubMed]
- Conde, E.; Alegre, L.; Blanco-Sanchez, I.; Saenz-Morales, D.; Aguado-Fraile, E.; Ponte, B.; Ramos, E.; Saiz, A.; Jimenez, C.; Ordonez, A.; et al. Hypoxia inducible factor 1-alpha (HIF-1 alpha) is induced during reperfusion after renal ischemia and is critical for proximal tubule cell survival. PLoS ONE 2012, 7, e33258. [Google Scholar] [CrossRef]
- Hill, P.; Shukla, D.; Tran, M.G.; Aragones, J.; Cook, H.T.; Carmeliet, P.; Maxwell, P.H. Inhibition of hypoxia inducible factor hydroxylases protects against renal ischemia-reperfusion injury. J. Am. Soc. Nephrol. 2008, 19, 39–46. [Google Scholar] [CrossRef]
- Guan, S.P.; Tee, W.; Ng, D.S.; Chan, T.K.; Peh, H.Y.; Ho, W.E.; Cheng, C.; Mak, J.C.; Wong, W.S. Andrographolide protects against cigarette smoke-induced oxidative lung injury via augmentation of Nrf2 activity. Br. J. Pharmacol. 2013, 168, 1707–1718. [Google Scholar] [CrossRef]
- Hawkins, K.E.; Joy, S.; Delhove, J.M.; Kotiadis, V.N.; Fernandez, E.; Fitzpatrick, L.M.; Whiteford, J.R.; King, P.J.; Bolanos, J.P.; Duchen, M.R.; et al. NRF2 Orchestrates the Metabolic Shift during Induced Pluripotent Stem Cell Reprogramming. Cell Rep. 2016, 14, 1883–1891. [Google Scholar] [CrossRef]
- Ji, X.; Wang, H.; Zhu, J.; Zhu, L.; Pan, H.; Li, W.; Zhou, Y.; Cong, Z.; Yan, F.; Chen, S. Knockdown of Nrf2 suppresses glioblastoma angiogenesis by inhibiting hypoxia-induced activation of HIF-1α. Int. J. Cancer 2014, 135, 574–584. [Google Scholar] [CrossRef]
- Johansson, K.; Cebula, M.; Rengby, O.; Dreij, K.; Carlstrom, K.E.; Sigmundsson, K.; Piehl, F.; Arner, E.S. Cross Talk in HEK293 Cells between Nrf2, HIF, and NF-κB Activities upon Challenges with Redox Therapeutics Characterized with Single-Cell Resolution. Antioxid. Redox Signal. 2017, 26, 229–246. [Google Scholar] [CrossRef] [PubMed]
- Kim, T.-H.; Hur, E.-G.; Kang, S.-J.; Kim, J.-A.; Thapa, D.; Lee, Y.M.; Ku, S.K.; Jung, Y.; Kwak, M.-K. NRF2 blockade suppresses colon tumor angiogenesis by inhibiting hypoxia-induced activation of HIF-1α. Cancer Res. 2011, 71, 2260–2275. [Google Scholar] [CrossRef] [PubMed]
- Loboda, A.; Stachurska, A.; Florczyk, U.; Rudnicka, D.; Jazwa, A.; Wegrzyn, J.; Kozakowska, M.; Stalinska, K.; Poellinger, L.; Levonen, A.L.; et al. HIF-1 induction attenuates Nrf2-dependent IL-8 expression in human endothelial cells. Antioxid. Redox Signal. 2009, 11, 1501–1517. [Google Scholar] [CrossRef] [PubMed]
- Malec, V.; Gottschald, O.R.; Li, S.; Rose, F.; Seeger, W.; Hanze, J. HIF-1α signaling is augmented during intermittent hypoxia by induction of the Nrf2 pathway in NOX1-expressing adenocarcinoma A549 cells. Free. Radic. Biol. Med. 2010, 48, 1626–1635. [Google Scholar] [CrossRef]
- Potteti, H.R.; Noone, P.M.; Tamatam, C.R.; Ankireddy, A.; Noel, S.; Rabb, H.; Reddy, S.P. Nrf2 mediates hypoxia-inducible HIF1α activation in kidney tubular epithelial cells. Am. J. Physiol. Ren. Physiol. 2021, 320, F464–F474. [Google Scholar] [CrossRef]
- Kilkenny, C.; Browne, W.J.; Cuthill, I.C.; Emerson, M.; Altman, D.G. Improving bioscience research reporting: The ARRIVE guidelines for reporting animal research. PLoS Biol. 2010, 8, e1000412. [Google Scholar] [CrossRef]
- Chan, M.C.; Atasoylu, O.; Hodson, E.; Tumber, A.; Leung, I.K.; Chowdhury, R.; Gomez-Perez, V.; Demetriades, M.; Rydzik, A.M.; Holt-Martyn, J.; et al. Potent and Selective Triazole-Based Inhibitors of the Hypoxia-Inducible Factor Prolyl-Hydroxylases with Activity in the Murine Brain. PLoS ONE 2015, 10, e0132004. [Google Scholar] [CrossRef]
- Chowdhury, R.; Candela-Lena, J.I.; Chan, M.C.; Greenald, D.J.; Yeoh, K.K.; Tian, Y.M.; McDonough, M.A.; Tumber, A.; Rose, N.R.; Conejo-Garcia, A.; et al. Selective small molecule probes for the hypoxia inducible factor (HIF) prolyl hydroxylases. ACS Chem. Biol. 2013, 8, 1488–1496. [Google Scholar] [CrossRef]
- Fan, L.; Li, J.; Yu, Z.; Dang, X.; Wang, K. The hypoxia-inducible factor pathway, prolyl hydroxylase domain protein inhibitors, and their roles in bone repair and regeneration. Biomed. Res. Int. 2014, 2014, 239356. [Google Scholar] [CrossRef]
- Piret, J.P.; Mottet, D.; Raes, M.; Michiels, C. CoCl2, a chemical inducer of hypoxia-inducible factor-1, and hypoxia reduce apoptotic cell death in hepatoma cell line HepG2. Ann. N. Y. Acad. Sci. 2002, 973, 443–447. [Google Scholar] [CrossRef]
- Lee, H.-K.; Myers, R.A.; Marzella, L. Stimulation of autophagic protein degradation by nutrient deprivation in a differentiated murine teratocarcinoma (F9 12-1a) cell line. Exp. Mol. Pathol. 1989, 50, 139–146. [Google Scholar] [CrossRef]
- Wu, C.-A.; Chao, Y.; Shiah, S.-G.; Lin, W.-W. Nutrient deprivation induces the Warburg effect through ROS/AMPK-dependent activation of pyruvate dehydrogenase kinase. Biochim. Biophys. Acta 2013, 1833, 1147–1156. [Google Scholar] [CrossRef] [PubMed]
- Sethi, S.; Radio, N.M.; Kotlarczyk, M.P.; Chen, C.-T.; Wei, Y.-H.; Jockers, R.; Witt-Enderby, P.A. Determination of the minimal melatonin exposure required to induce osteoblast differentiation from human mesenchymal stem cells and these effects on downstream signaling pathways. J. Pineal Res. 2010, 49, 222–238. [Google Scholar] [CrossRef]
- Wang, X.; Seed, B. A PCR primer bank for quantitative gene expression analysis. Nucleic Acids Res. 2003, 31, e154. [Google Scholar] [CrossRef]
- Rankin, E.B.; Higgins, D.F.; Walisser, J.A.; Johnson, R.S.; Bradfield, C.A.; Haase, V.H. Inactivation of the arylhydrocarbon receptor nuclear translocator (Arnt) suppresses von Hippel-Lindau disease-associated vascular tumors in mice. Mol. Cell. Biol. 2005, 25, 3163–3172. [Google Scholar] [CrossRef] [PubMed]
- Shin, J.; Nunomiya, A.; Kitajima, Y.; Dan, T.; Miyata, T.; Nagatomi, R. Prolyl hydroxylase domain 2 deficiency promotes skeletal muscle fiber-type transition via a calcineurin/NFATc1-dependent pathway. Skelet. Muscle 2016, 6, 5. [Google Scholar] [CrossRef]
- Schmittgen, T.D.; Livak, K.J. Analyzing real-time PCR data by the comparative CT method. Nat. Protoc. 2008, 3, 1101–1108. [Google Scholar] [CrossRef] [PubMed]
- Skrypnyk, N.I.; Harris, R.C.; de Caestecker, M.P. Ischemia-reperfusion model of acute kidney injury and post injury fibrosis in mice. J. Vis. Exp. 2013, 78, 50495. [Google Scholar] [CrossRef]
- Waikar, S.S.; Liu, K.D.; Chertow, G.M. Diagnosis, epidemiology and outcomes of acute kidney injury. Clin. J. Am. Soc. Nephrol. 2008, 3, 844–861. [Google Scholar] [CrossRef]
- Zeng, X.; McMahon, G.M.; Brunelli, S.M.; Bates, D.W.; Waikar, S.S. Incidence, outcomes, and comparisons across definitions of AKI in hospitalized individuals. Clin. J. Am. Soc. Nephrol. 2014, 9, 12–20. [Google Scholar] [CrossRef]
- Chawla, L.S.; Amdur, R.L.; Amodeo, S.; Kimmel, P.L.; Palant, C.E. The severity of acute kidney injury predicts progression to chronic kidney disease. Kidney Int. 2011, 79, 1361–1369. [Google Scholar] [CrossRef] [PubMed]
- Basile, D.P.; Donohoe, D.; Roethe, K.; Osborn, J.L. Renal ischemic injury results in permanent damage to peritubular capillaries and influences long-term function. Am. J. Physiol. Ren. Physiol. 2001, 281, F887–F899. [Google Scholar] [CrossRef]
- Chen, Q.; Yu, J.; Rush, B.M.; Stocker, S.D.; Tan, R.J.; Kim, K. Ultrasound super-resolution imaging provides a noninvasive assessment of renal microvasculature changes during mouse acute kidney injury. Kidney Int. 2020, 98, 355–365. [Google Scholar] [CrossRef]
- Geng, H.; Lan, R.; Wang, G.; Siddiqi, A.R.; Naski, M.C.; Brooks, A.I.; Barnes, J.L.; Saikumar, P.; Weinberg, J.M.; Venkatachalam, M.A. Inhibition of autoregulated TGFβ signaling simultaneously enhances proliferation and differentiation of kidney epithelium and promotes repair following renal ischemia. Am. J. Pathol. 2009, 174, 1291–1308. [Google Scholar] [CrossRef]
- Koesters, R.; Kaissling, B.; Lehir, M.; Picard, N.; Theilig, F.; Gebhardt, R.; Glick, A.B.; Hahnel, B.; Hosser, H.; Grone, H.J.; et al. Tubular overexpression of transforming growth factor-β1 induces autophagy and fibrosis but not mesenchymal transition of renal epithelial cells. Am. J. Pathol. 2010, 177, 632–643. [Google Scholar] [CrossRef] [PubMed]
- Yang, L.; Besschetnova, T.Y.; Brooks, C.R.; Shah, J.V.; Bonventre, J.V. Epithelial cell cycle arrest in G2/M mediates kidney fibrosis after injury. Nat. Med. 2010, 16, 535–543, 531p following 143. [Google Scholar] [CrossRef]
- Fahling, M.; Mathia, S.; Paliege, A.; Koesters, R.; Mrowka, R.; Peters, H.; Persson, P.B.; Neumayer, H.H.; Bachmann, S.; Rosenberger, C. Tubular von Hippel-Lindau knockout protects against rhabdomyolysis-induced AKI. J. Am. Soc. Nephrol. 2013, 24, 1806–1819. [Google Scholar] [CrossRef]
- Rosenberger, C.; Pratschke, J.; Rudolph, B.; Heyman, S.N.; Schindler, R.; Babel, N.; Eckardt, K.U.; Frei, U.; Rosen, S.; Reinke, P. Immunohistochemical detection of hypoxia-inducible factor-1α in human renal allograft biopsies. J. Am. Soc. Nephrol. 2007, 18, 343–351. [Google Scholar] [CrossRef]
- Jobbagy, S.; Vitturi, D.A.; Salvatore, S.R.; Pires, M.F.; Rowart, P.; Emlet, D.R.; Ross, M.; Hahn, S.; St. Croix, C.; Wendell, S.G.; et al. Nrf2 activation protects against lithium-induced nephrogenic diabetes insipidus. JCI Insight 2020, 5, e128578. [Google Scholar] [CrossRef]
- Higgins, D.F.; Kimura, K.; Bernhardt, W.M.; Shrimanker, N.; Akai, Y.; Hohenstein, B.; Saito, Y.; Johnson, R.S.; Kretzler, M.; Cohen, C.D.; et al. Hypoxia promotes fibrogenesis in vivo via HIF-1 stimulation of epithelial-to-mesenchymal transition. J. Clin. Investig. 2007, 117, 3810–3820. [Google Scholar] [CrossRef]
- Kapitsinou, P.P.; Haase, V.H. Molecular mechanisms of ischemic preconditioning in the kidney. Am. J. Physiol. Ren. Physiol. 2015, 309, F821–F834. [Google Scholar] [CrossRef] [PubMed]
- Kapitsinou, P.P.; Jaffe, J.; Michael, M.; Swan, C.E.; Duffy, K.J.; Erickson-Miller, C.L.; Haase, V.H. Preischemic targeting of HIF prolyl hydroxylation inhibits fibrosis associated with acute kidney injury. Am. J. Physiol. Ren. Physiol. 2012, 302, F1172–F1179. [Google Scholar] [CrossRef] [PubMed]
- Kimura, K.; Iwano, M.; Higgins, D.F.; Yamaguchi, Y.; Nakatani, K.; Harada, K.; Kubo, A.; Akai, Y.; Rankin, E.B.; Neilson, E.G.; et al. Stable expression of HIF-1α in tubular epithelial cells promotes interstitial fibrosis. Am. J. Physiol. Ren. Physiol. 2008, 295, F1023–F1029. [Google Scholar] [CrossRef]
- Leonard, M.O.; Kieran, N.E.; Howell, K.; Burne, M.J.; Varadarajan, R.; Dhakshinamoorthy, S.; Porter, A.G.; O’Farrelly, C.; Rabb, H.; Taylor, C.T. Reoxygenation-specific activation of the antioxidant transcription factor Nrf2 mediates cytoprotective gene expression in ischemia-reperfusion injury. FASEB J. 2006, 20, 2624–2626. [Google Scholar] [CrossRef]
- Wu, Q.Q.; Wang, Y.; Senitko, M.; Meyer, C.; Wigley, W.C.; Ferguson, D.A.; Grossman, E.; Chen, J.; Zhou, X.J.; Hartono, J.; et al. Bardoxolone methyl (BARD) ameliorates ischemic AKI and increases expression of protective genes Nrf2, PPARγ, and HO-1. Am. J. Physiol. Ren. Physiol. 2011, 300, F1180–F1192. [Google Scholar] [CrossRef]
- Wu, J.; Liu, X.; Fan, J.; Chen, W.; Wang, J.; Zeng, Y.; Feng, X.; Yu, X.; Yang, X. Bardoxolone methyl (BARD) ameliorates aristolochic acid (AA)-induced acute kidney injury through Nrf2 pathway. Toxicology 2014, 318, 22–31. [Google Scholar] [CrossRef]
- Schley, G.; Klanke, B.; Schodel, J.; Forstreuter, F.; Shukla, D.; Kurtz, A.; Amann, K.; Wiesener, M.S.; Rosen, S.; Eckardt, K.U.; et al. Hypoxia-inducible transcription factors stabilization in the thick ascending limb protects against ischemic acute kidney injury. J. Am. Soc. Nephrol. 2011, 22, 2004–2015. [Google Scholar] [CrossRef] [PubMed]
- Potteti, H.R.; Tamatam, C.R.; Marreddy, R.; Reddy, N.M.; Noel, S.; Rabb, H.; Reddy, S.P. Nrf2-AKT interactions regulate heme oxygenase 1 expression in kidney epithelia during hypoxia and hypoxia-reoxygenation. Am. J. Physiol. Ren. Physiol. 2016, 311, F1025–F1034. [Google Scholar] [CrossRef][Green Version]
- Apopa, P.L.; He, X.; Ma, Q. Phosphorylation of Nrf2 in the transcription activation domain by casein kinase 2 (CK2) is critical for the nuclear translocation and transcription activation function of Nrf2 in IMR-32 neuroblastoma cells. J. Biochem. Mol. Toxicol. 2008, 22, 63–76. [Google Scholar] [CrossRef]
- Huang, H.-C.; Nguyen, T.; Pickett, C.B. Phosphorylation of Nrf2 at Ser-40 by protein kinase C regulates antioxidant response element-mediated transcription. J. Biol. Chem. 2002, 277, 42769–42774. [Google Scholar] [CrossRef]
- Numazawa, S.; Ishikawa, M.; Yoshida, A.; Tanaka, S.; Yoshida, T. Atypical protein kinase C mediates activation of NF-E2-related factor 2 in response to oxidative stress. Am. J. Physiol. Cell Physiol. 2003, 285, C334–C342. [Google Scholar] [CrossRef] [PubMed]
- Yuan, X.; Xu, C.; Pan, Z.; Keum, Y.S.; Kim, J.-H.; Shen, G.; Yu, S.; Oo, K.T.; Ma, J.; Kong, A.-N. Butylated hydroxyanisole regulates ARE-mediated gene expression via Nrf2 coupled with ERK and JNK signaling pathway in HepG2 cells. Mol. Carcinog. 2006, 45, 841–850. [Google Scholar] [CrossRef] [PubMed]
- Joo, M.S.; Kim, W.D.; Lee, K.Y.; Kim, J.H.; Koo, J.H.; Kim, S.G. AMPK Facilitates Nuclear Accumulation of Nrf2 by Phosphorylating at Serine 550. Mol. Cell. Biol. 2016, 36, 1931–1942. [Google Scholar] [CrossRef] [PubMed]
- Theodore, M.; Kawai, Y.; Yang, J.; Kleshchenko, Y.; Reddy, S.P.; Villalta, F.; Arinze, I.J. Multiple nuclear localization signals function in the nuclear import of the transcription factor Nrf2. J. Biol. Chem. 2008, 283, 8984–8994. [Google Scholar] [CrossRef] [PubMed]


Publisher’s Note: MDPI stays neutral with regard to jurisdictional claims in published maps and institutional affiliations. |
© 2022 by the authors. Licensee MDPI, Basel, Switzerland. This article is an open access article distributed under the terms and conditions of the Creative Commons Attribution (CC BY) license (https://creativecommons.org/licenses/by/4.0/).
Share and Cite
Bondi, C.D.; Rush, B.M.; Hartman, H.L.; Wang, J.; Al-Bataineh, M.M.; Hughey, R.P.; Tan, R.J. Suppression of NRF2 Activity by HIF-1α Promotes Fibrosis after Ischemic Acute Kidney Injury. Antioxidants 2022, 11, 1810. https://doi.org/10.3390/antiox11091810
Bondi CD, Rush BM, Hartman HL, Wang J, Al-Bataineh MM, Hughey RP, Tan RJ. Suppression of NRF2 Activity by HIF-1α Promotes Fibrosis after Ischemic Acute Kidney Injury. Antioxidants. 2022; 11(9):1810. https://doi.org/10.3390/antiox11091810
Chicago/Turabian StyleBondi, Corry D., Brittney M. Rush, Hannah L. Hartman, Jiaxuan Wang, Mohammad M. Al-Bataineh, Rebecca P. Hughey, and Roderick J. Tan. 2022. "Suppression of NRF2 Activity by HIF-1α Promotes Fibrosis after Ischemic Acute Kidney Injury" Antioxidants 11, no. 9: 1810. https://doi.org/10.3390/antiox11091810
APA StyleBondi, C. D., Rush, B. M., Hartman, H. L., Wang, J., Al-Bataineh, M. M., Hughey, R. P., & Tan, R. J. (2022). Suppression of NRF2 Activity by HIF-1α Promotes Fibrosis after Ischemic Acute Kidney Injury. Antioxidants, 11(9), 1810. https://doi.org/10.3390/antiox11091810