Abstract
Despite the excellent beneficial properties that anthocyanins and total phenolic compounds give to the red onion bulbs, few articles have investigated modern extraction techniques or experimental designs in this field. For this reason, the present study proposes the development and optimization of alternative methods for the extraction of these compounds based on microwave-assisted extraction and the Box-Behnken experiment design. The optimal values for the extraction of total anthocyanins have been established at 62% methanol composition as a solvent, pH 2, 56 °C temperature, and 0.2:13 g:mL sample-solvent ratio. Regarding the extraction of total phenolic compounds, the optimal conditions have been established at 100% pure methanol as a solvent with pH 2, 57 °C temperature, and 0.2:8.8 g:mL sample-solvent ratio. Short extraction times (min), good recoveries (mg of bioactive compound g−1 of dry onion), and high repeatability and intermediate precision (coefficient of variation (%)) have been confirmed for both methods. Regarding total anthocyanins, the following results have been obtained: 2 min, 2.64 ± 0.093 mg of total anthocyanins g−1 of dry onion, and 2.51% and 3.12% for precision. Regarding phenolic compounds, the following results have been obtained: 15 min, 7.95 ± 0.084 mg of total phenolic compound g−1 of dry onion, and 3.62% and 4.56% for precision. Comparing these results with those of other authors and with those obtained in a previous study of ultrasound-assisted extraction, it can be confirmed that microwave-assisted extraction is a quantitative, repeatable, and very promising method for the extraction of phenolic compounds and anthocyanins, which offers similar and even superior results with little solvent expense, time, and costs.
1. Introduction
Phenolic compounds include a wide range of compounds with an important capacity to avoid the oxidation of free radicals and, therefore, to avoid some of the various diseases that are caused by these radicals [1,2]. Anthocyanins are a specific type of phenolic compound that is broadly found in nature [3]. They are quite easy to identify thanks to the red, purple, or blue color that they confer to certain parts of plants (leaves, fruits, flowers, etc.) [4]. From the chemical point of view, they generally appear as glycosides or acylglycosides of anthocyanidins, the aglycones, and vary according to different hydroxyl or methoxyl substitutions of their basic flavylium (2-phenylbenzopyrilium) structure [5]. These compounds have multiple functions in plants, as they may act as a protective substance against UV radiation or as a luring element for pollinating insects [6]. With regard to human health, the beneficial effect of anthocyanins as natural antioxidants has attracted considerable interest [7]. Anthocyanins are efficacious, for example, as natural antioxidants, anti-inflammatory, anticancer, anti-Alzheimer, or anti-Parkinson [8].
Although anthocyanins have always been found in fruits and berries in large amounts [9,10], they can also be found in certain vegetables. In fact, some vegetables have proven to have a high content of conjugated anthocyanins, which are believed to be of greater interest to the food industry because of their increased stability [11]. Red onion, which owns its color mainly to the anthocyanins that can be found in the epidermal cells of the bulb’s scale leaves, is one of the vegetables that stands out for its anthocyanins content [12]. Specifically, the most common anthocyanins that are present in red onions are cyanidin derivatives, with a superior content of cyanidin 3-O-(6″-malonylglucoside), although peonidin and delphinidin derivatives have also been identified to a lesser extent [13,14,15].
Even though many articles have studied the anthocyanins in onion for their beneficial properties regarding consumers’ health, they seem to have exclusively focused on their identification and analysis, while not enough attention has been paid to the amount of bioactive compounds extracted [16,17,18]. After revising the bibliography on the subject from 1994 until now, most of the studies have employed traditional techniques such as maceration or stirring for extraction purposes [19,20,21,22]. The use of more modern, more efficient, greener, and faster techniques has hardly been exploited even at the laboratory level. Techniques such as ultrasound-assisted extraction (UAE) or microwave-assisted extraction (MAE) are excellent alternatives that can achieve better results in shorter times and, consequently, with lesser solvent consumption and lower costs [23,24]. In a previous study published by our research group [25], the main anthocyanins and the total phenolic compounds present in red onion were determined by employing UAE. In the present study, however, MAE is presented as the alternative to more traditional extraction methods since this technique may achieve extractions that are comparable or even greater than those obtained by UAE.
MAE is a novel extraction technique based on the use of microwave energy to extract substances that are soluble in a fluid. Microwaves energy is generated by electromagnetic fields within a frequency range that goes from 300 MHz to 300 GHz [26]. This energy penetrates materials and causes temperature increments through polar components, rotation of dipoles, and the conductive migration of dissolved ions. This localized rise in temperature generates, in turn, a rise of pressure that can induce the selective migration at a rapid rate of the target compounds from the material to the extraction solvent [27]. So, MAE presents some advantages, such as shorter extraction times and lesser solvent consumption, on top of the possibility of simultaneously extracting multiple samples [28].
In the revision of the bibliography on this subject, one study where MAE was used as the extraction technique to obtain anthocyanins from onions has been found just [29]. This article investigated how the concentration of the solvents, the acids, the different temperatures, and an array of extraction times had an influence on the extraction of the anthocyanins. However, an experimental design methodology was not used, and the variables were studied individually (one factor at a time) instead. For that reason, this study was intended to highlight the importance of employing a Design of Experiments (DOE) together with a Response Surface Methodology (RSM) to optimize the variables involved in the extraction of the compounds of interest [30]. In this case, the extractions of the anthocyanins and the total phenolic compounds present in onion matrices have been evaluated. The results from the DOE are subjected to RSM to generate the mathematical model that best fits the data obtained and to establish the optimal values of the factors that have an influence on the response variable [31]. For this study, a three-level fractional factorial Box-Behnken design has been selected, and the most relevant variables in MAE have been established as follows: methanol percentage in the solvent, solvent pH, sample:solvent volume ratio, and temperature.
Therefore, the present study intends to develop and optimize two Microwave-Assisted Extraction (MAE) methods to obtain anthocyanins and total phenolic compounds from red onions. The importance of the combined use of an experimental design with such a microwave-assisted extraction technique for optimization purposes has been particularly emphasized. By combining these modern techniques, more efficient and productive extractions should be obtained so that larger amounts and more quality products are offered to consumers.
2. Materials and Methods
2.1. Chemicals and Standards
In the present study, different chemicals for the MAE as well as for the quantification of anthocyanins, total phenolic compounds, and antioxidant activity have been employed as follows: methanol of HPLC purity (Fischer Chemical, Loughborough, UK), Milli-Q water from a Milli-Q water purification system (Millipore, Bedford, MA, USA), hydrochloric acid (Panreac, Barcelona, Spain), sodium hydroxide (Panreac, Barcelona, Spain), formic acid (Scharlau, Barcelona, Spain), anhydrous sodium carbonate (Panreac Química, Castellar del Valles, Barcelona, Spain), Folin–Ciocalteu reagent (Merck KGaA, EMD Millipore Corporation, Darmstadt, Germany), and 2,2-diphenyl-1-picrylhydrazyl (DPPH) (Sigma-Aldrich, San Luis, MO, USA). Furthermore, for the quantification of anthocyanins, total phenolic compounds, and antioxidant activity, three standards were employed respectively: cyanidin chloride, gallic acid, and 6-hydroxy-2,5,7,8-tetramethylchroman-2-carboxylic acid (Trolox), all of them supplied by Sigma-Aldrich Chemical Co. (St. Louis, MO, USA).
2.2. Biological Material Preparation
Homogeneous lyophilized red onion was the biological material used for the optimization of the extraction methods. The characteristics of the onions were the following: red color, caliber 50/90 mm, origin Austria (Cebollas Tara, S.L., Requena, Spain). After purchasing red onions from a local market in the province of Cadiz (Spain), they were subjected to a specific pretreatment. The outer layers of the onion bulbs were removed, and their cores were cut into small pieces. Then, they were lyophilized by means of an LYOALFA freeze dryer (Azbil Telstar Technologies, Terrasa, Spain) and crushed employing a ZM200 knife mill (fineness <300 μm, Retsch GmbH, Haan, Germany). The homogeneous lyophilized red onion samples were kept in a freezer (−20 °C) prior to analysis.
2.3. Microwave-Assisted Extraction Procedure
The extraction equipment used was a MARS 6 One TouchTM Technology system (1800 W) (CEM Corporation, Matthews, NC, USA), specifically designed for routine sample preparation. For the extraction processes, approximately 0.2 g of homogenized red onion samples were weighed in 75 mL MARSXpress vessels (CEM Corporation), and the corresponding volume of solvent (formed by different proportions of methanol:water mixtures with varying pH) was added according to the experimental design. Nine vessels containing the same solvent and volume were securely closed and placed into the microwave oven. As mentioned above, the solvent volume was selected according to the experiment to be carried out; similarly, the rest of the factors to be considered (temperature, percentage of methanol in the solvent, and pH) were set according to the corresponding experimental conditions as follows: 50% methanol in water to 100% pure methanol as solvent, 2 to 7 pH, 50 to 100 °C temperature, and 0.2:10 to 0.2:20 g:mL as the sample:solvent ratio. Five minutes was set as the initial time (followed by the subsequent cooling time) for MARS application. The liquid obtained from each extraction was transferred to centrifuge tubes and centrifuged at 1702 g for 5 min. The supernatant was added to a 25 mL volumetric flask, and the precipitates were subsequently redissolved in 5 mL of the same extraction solvent and centrifuged again. The second supernatant was poured into the same volumetric flasks and made up to the mark using the same solvent. The extracts were stored in a freezer (−20 °C) prior to analysis.
2.4. Total-Phenolic Compounds
The Total Phenolic Compounds (TPC) in the red onion extracts were determined by Folin–Ciocalteu assay as described by Singleton and Rossi with some modifications [32]. The calibration curve was constructed using gallic acid at different concentrations: 0.5, 1.0, 5.0, 10.0, 25.0, and 50.0 mg L−1 in distilled water. Water (1.25 mL), Folin–Ciocalteu reagent (12.5 mL), and an aqueous solution of sodium carbonate at 20% p/v (5 mL) were added to 0.25 mL of each gallic acid concentration and, after 30 min at room temperature, the absorbances of the standard curve were read at 765 nm by means of a Cary 4000 UV-Vis (Agilent, Santa Clara, CA, USA). The plot of absorbance vs. concentration using Microsoft Office Excel 2013 resulted in the following regression equation (y = 0.0014x + 0.0022) and linear relationship (R2 = 0.9995). Then, the same method was applied to the MAE samples after filtering the extracts through a 0.45 µm nylon filter (Membrane Solutions, Dallas, TX, USA) before spectrophotometric analysis. Finally, their absorbances were expressed as mg of gallic acid equivalents per gram of dried red onion (mg GAE g−1) according to the calibration curve.
2.5. Antioxidant Activity
The antioxidant activity of the red onion extracts was determined by employing the DPPH assay and following the method described by Miliauskas et al. with some modifications [33]. The DPPH assay is one of the most used when studying antioxidant capacity [34] since it also has short analysis times as an advantage [35,36]. The calibration curve was constructed using a Trolox standard at different concentrations: 0.0, 0.3, 0.6, 0.9, 1.1, and 4.4 mmol L−1 in methanol. 2 mL of the DPPH solution (6 × 10⁻⁵ mol L−1 prepared in methanol) were added to 100 µL of each Trolox concentration and, after 40 min at room temperature and in the absence of light, the absorbances of the standards were read at 515 nm using a Cary 4000 UV-Vis (Agilent, Santa Clara, CA, USA). The absorbance vs. concentration curve was represented using Microsoft Office Excel 2013, which resulted in the following regression equation (y = 883941x + 0.7478) and linear relationship (R2 = 0.9959). Then, the same method was applied to the MAE samples after filtering the extracts through a 0.45 µm nylon filter (Membrane Solutions, Dallas, TX, USA) before spectrophotometric analysis. Finally, the absorbance data were expressed as mg of Trolox equivalents (TE) per gram of dried red onion (mg TE g−1 dry onion) according to the calibration curve.
2.6. UHPLC-MS-QToF Conditions
The anthocyanins extracted from the red onion samples were identified using Ultra-High-Performance Liquid Chromatography (UHPLC) coupled to a quadrupole time-of-flight mass spectrometer (Q-ToF-MS) (Xevo G2 QToF, Waters Corp., Milford, MA, USA). Specifically, the identification was carried out following the method previously published by our research group [17]. By applying this method, 9 different anthocyanins were identified based on their retention time and molecular weight: cyanidin 3-O-glucoside (3.517 min, m/z 449.1087), cyanidin 3-O-laminaribioside (4.132 min, m/z 611.1641), cyanidin 3-O-(3″-malonylglucoside) (4.875 min, m/z 535.1069), peonidin 3-O-glucoside (5.384 min, m/z 463.1251), delphinidin 3,5-O-diglucoside (5.721 min, m/z 649.1392), cyanidin 3-O-(6″-malonylglucoside) (5.850 min, m/z 535.1104), cyanidin 3-O-(6”-malonyl-laminaribioside) (6.052 min, m/z 697.1613), and peonidin 3-O-(6″-malonylglucoside) (6.323 min, m/z 549.1255), and delphinidin 3-O-glucoside (6.536 min, m/z 487.0863).
2.7. HPLC Conditions
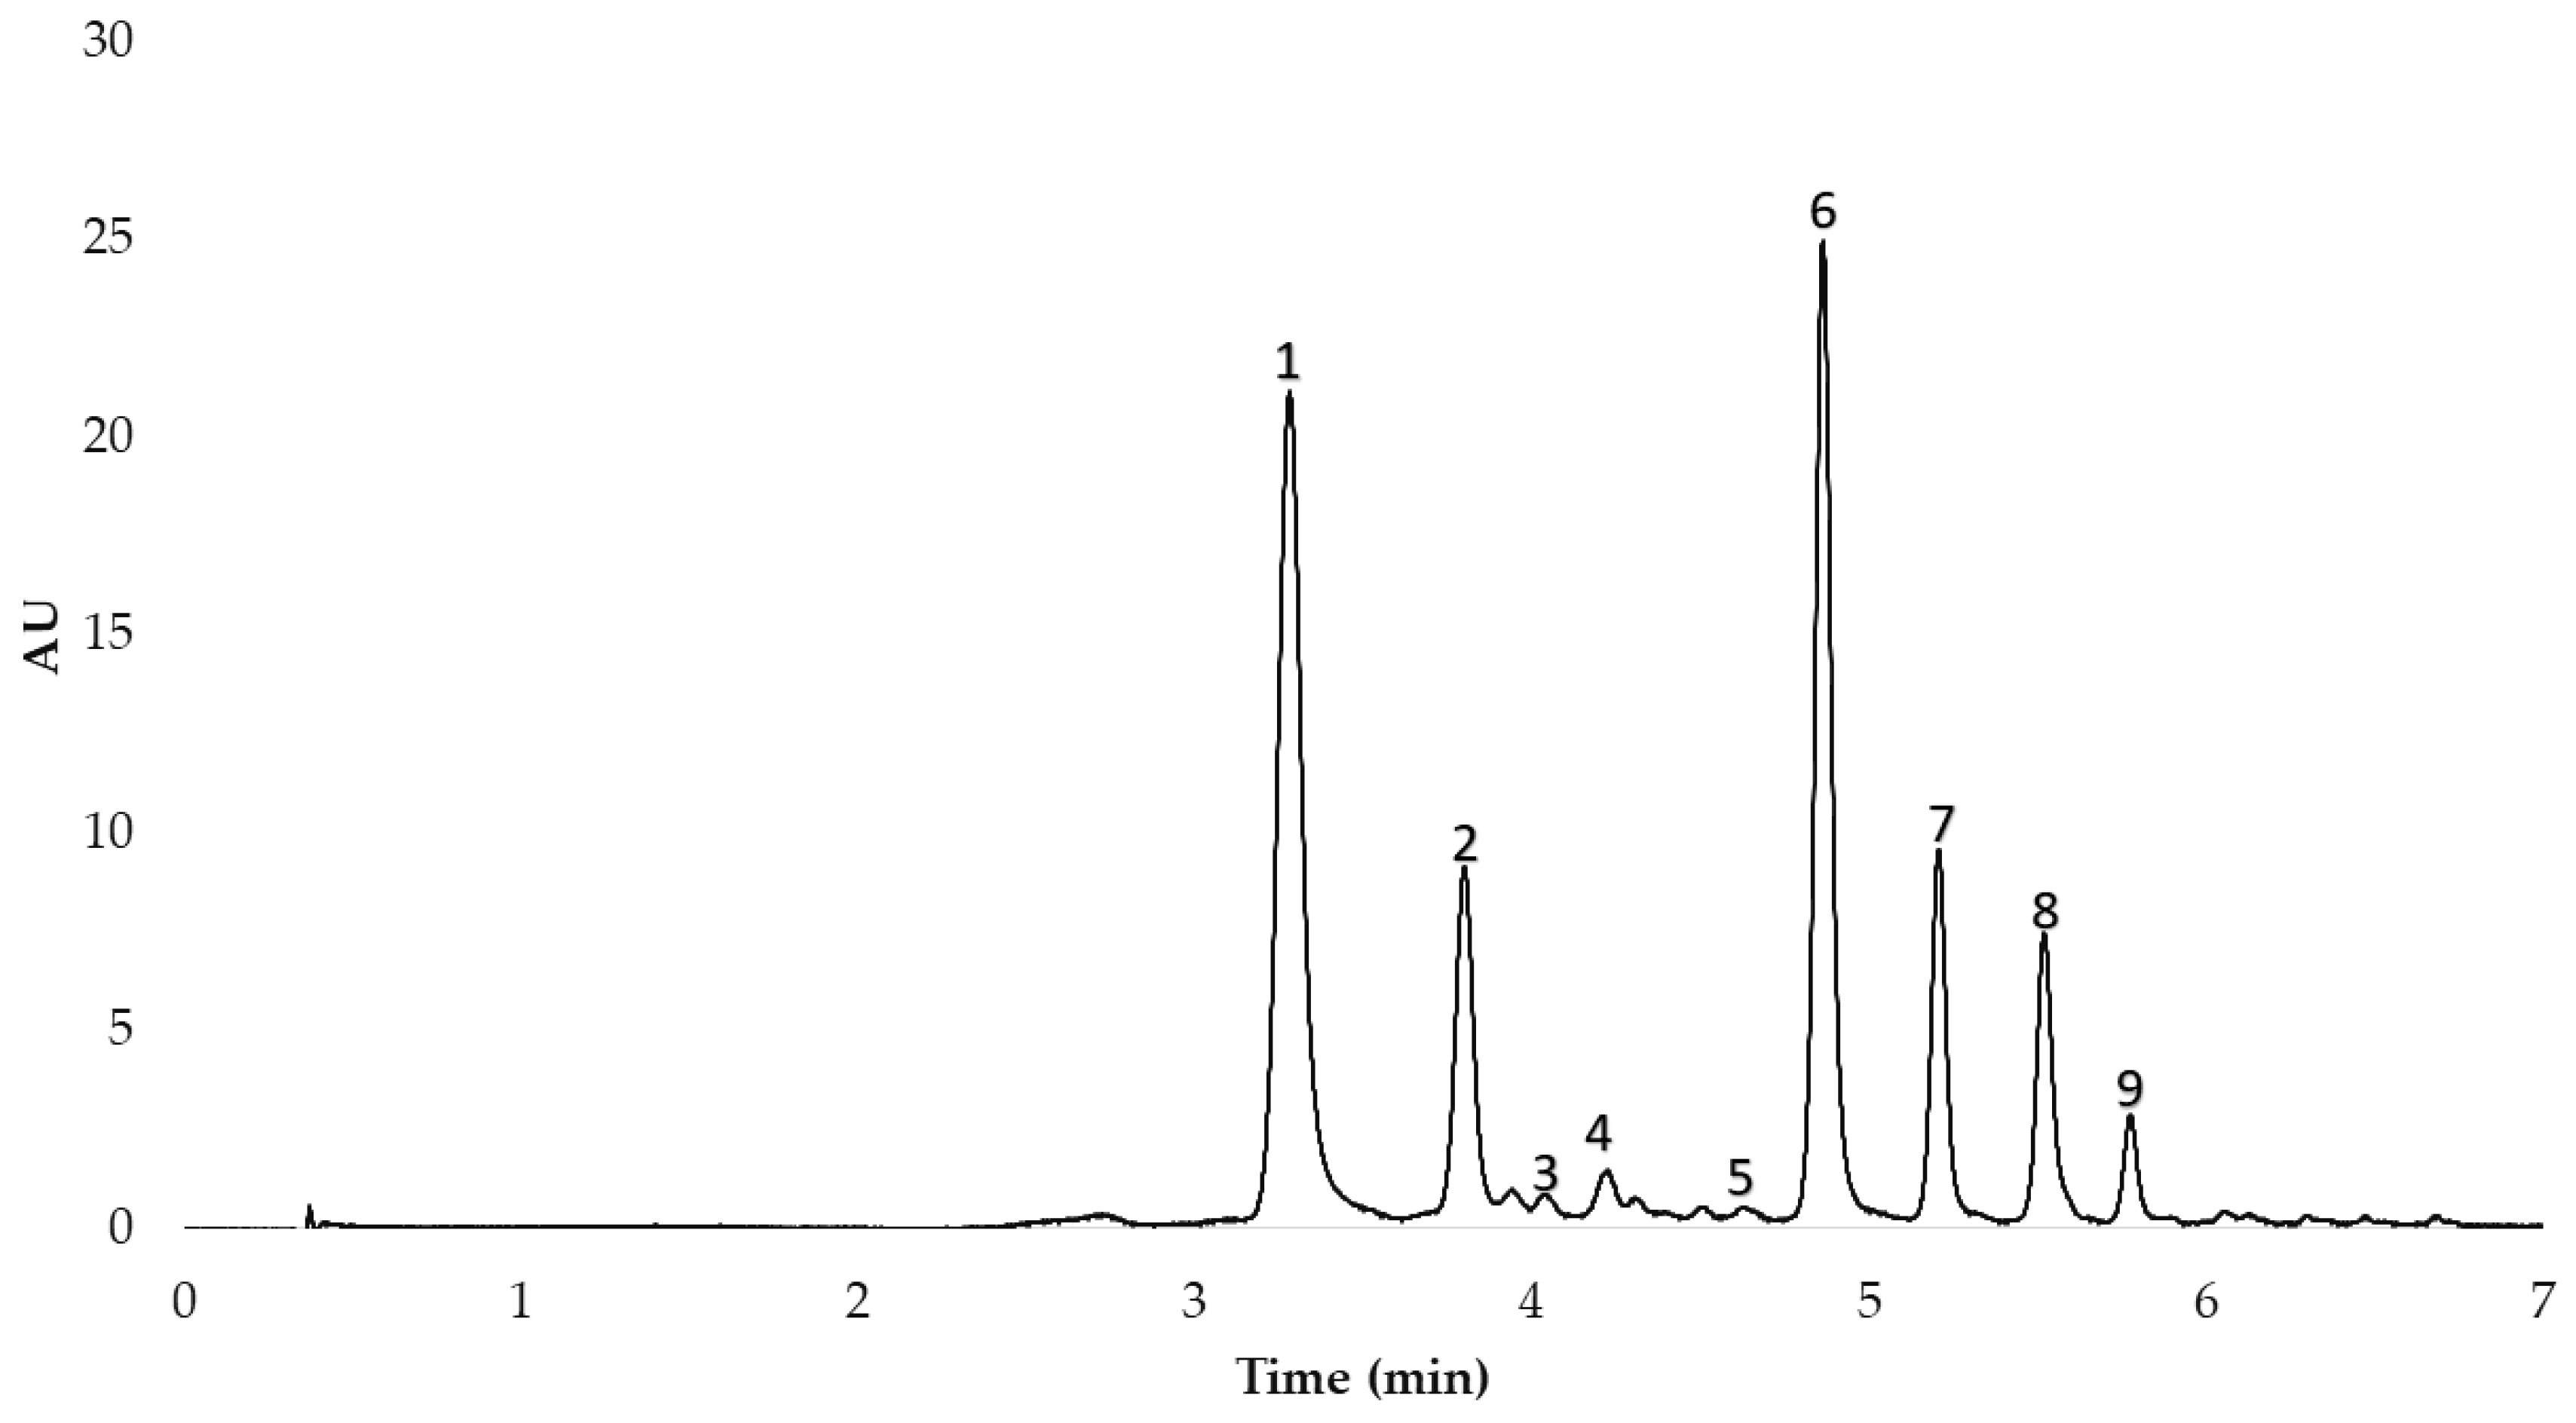
After the anthocyanins in the red onion extracts had been identified, they were separated and quantified by means of High-Performance Liquid Chromatography (HPLC) with the equipment available in our research group (Elite HPLC LaChrom Ultra System, Hitachi, Tokyo, Japan) coupled to an L-2420U UV-Vis detector, an L-2200U autosampler, an L-2300 column oven, and two L-2160 U pumps. Specifically, the analysis was carried out following the method previously published by our research group [17]. The column employed was a reverse-phase C18 analytical column (2.6 µm, 2.1 mm × 100 mm, Phenomenex, Torrance, CA, USA). The gradient allowed the optimum separation of the 9 peaks in less than 6 min. The HPLC chromatogram obtained is shown in Figure 1.

Figure 1.
HPLC chromatogram of the nine anthocyanins identified in the MAE extracts from red onion. 1. cyanidin 3-O-glucoside; 2. cyanidin 3-O-laminaribioside; 3. cyanidin 3-O-(3″-malonylglucoside); 4. peonidin 3-O-glucoside; 5. delphinidin 3,5-O-diglucoside; 6. cyanidin 3-O-(6″-malonylglucoside); 7. cyanidin 3-O-(6″-malonyl-laminaribioside); 8. peonidin 3-O-(6″-malonylglucoside); 9. delphinidin 3-O-glucoside.
Cyanidin chloride was used as the standard for quantification purposes. A plot of area vs. concentration (0.06–35 mg L−1) was generated by means of Microsoft Office Excel 2013, and the following regression equation (y = 260596.88x − 4292.66) and linear relationship (R2 = 0.9999) were obtained. A calibration curve was plotted for each one of the remaining anthocyanins detected on the basis that all the anthocyanins have similar absorbance and by taking into account their molecular weights. So, the area corresponding to each anthocyanin as quantified by HPLC was expressed as mg of the corresponding anthocyanin per gram of dried red onion (mg g−1) according to the calibration curve.
2.8. Optimization Procedure and Data Analysis
A Box-Behnken design (BBD) together with RSM was used for the optimization of several experimental parameters involved in the extraction of bioactive compounds from red onion. BBD is a class of rotatable or nearly rotatable second-order designs based on three-level incomplete factorial designs [37]. In this work, the effect of 4 independent variables, namely the percentage of methanol in the solvent, the solvent pH, the extraction temperature, and the ratio between sample mass and solvent volume on the response (Total Phenolic Compounds (TPC), and Total Anthocyanins (TA)) have been investigated. As these independent variables have different units and ranges, they were normalized and coded between −1 and +1 (three levels) to obtain a more uniform response. The range of the independent variables and their levels were the following: 50(−1)-75(0)-100(1) percentage of methanol in the solvent (%); 2(−1)-4.5(0)-7(1) solvent pH, 50(−1)-75(0)-100(1) extraction temperature (ºC); and 0.2:10(−1)-0.2:15(0)-0.2:20(1) ratio between the sample mass and solvent volume (g:mL). The number of experiments (N) required was determined by applying the following BBD equation (Equation (1)):
where k is the number of factors and C0 is the number of central points. In this work, with 4 factors and 3 central points, a BBD design comprising 27 experimental points was carried out at random. These experiments and their results can be seen in Table 1.
N = 2k(k − 1) + C0,

Table 1.
Box-Behnken design for total anthocyanins (TA) and total phenolic compounds (TPC). The results correspond to the experimental and the predicted values.
Based on the BBD results, the RSM can be employed to produce a regression model for each response. This mathematical model can be used to generate a predictive equation (Equation (2)) for each response (total phenolic compounds and total anthocyanins) based on the experimental conditions employed. Furthermore, an analysis of variance (ANOVA) was conducted to verify by means of the application Statgraphics Centurion version XVI (Warrenton, VA, USA) the suitability of the model obtained.
where Y represents the responses; β0 the model constant; βi the coefficient for each main effect; βij the coefficient corresponding to the interactions between factor i and factor j; βii the coefficient of the quadratic factors that represent the curvature of the surface; X each one of the factors studied; and r the residual value (random error).
Once the individual response surfaces had been determined for each response, a multi-response optimization for both responses was performed following the desirability function. The predicted values obtained from each response surface were transformed into a dimensionless scale di. The geometric means of each individual desirability value were combined to obtain the overall desirability D, and an algorithm was applied to the D function to determine the set of variable values that maximize it [38]. All of these calculations were also carried out by means of the application Statgraphics Centurion version XVI (Warrenton, VA, USA). The t-test was used to compare the results obtained from the independent and from the multi-response methods.
3. Results and Discussion
3.1. Temperature Stability Study
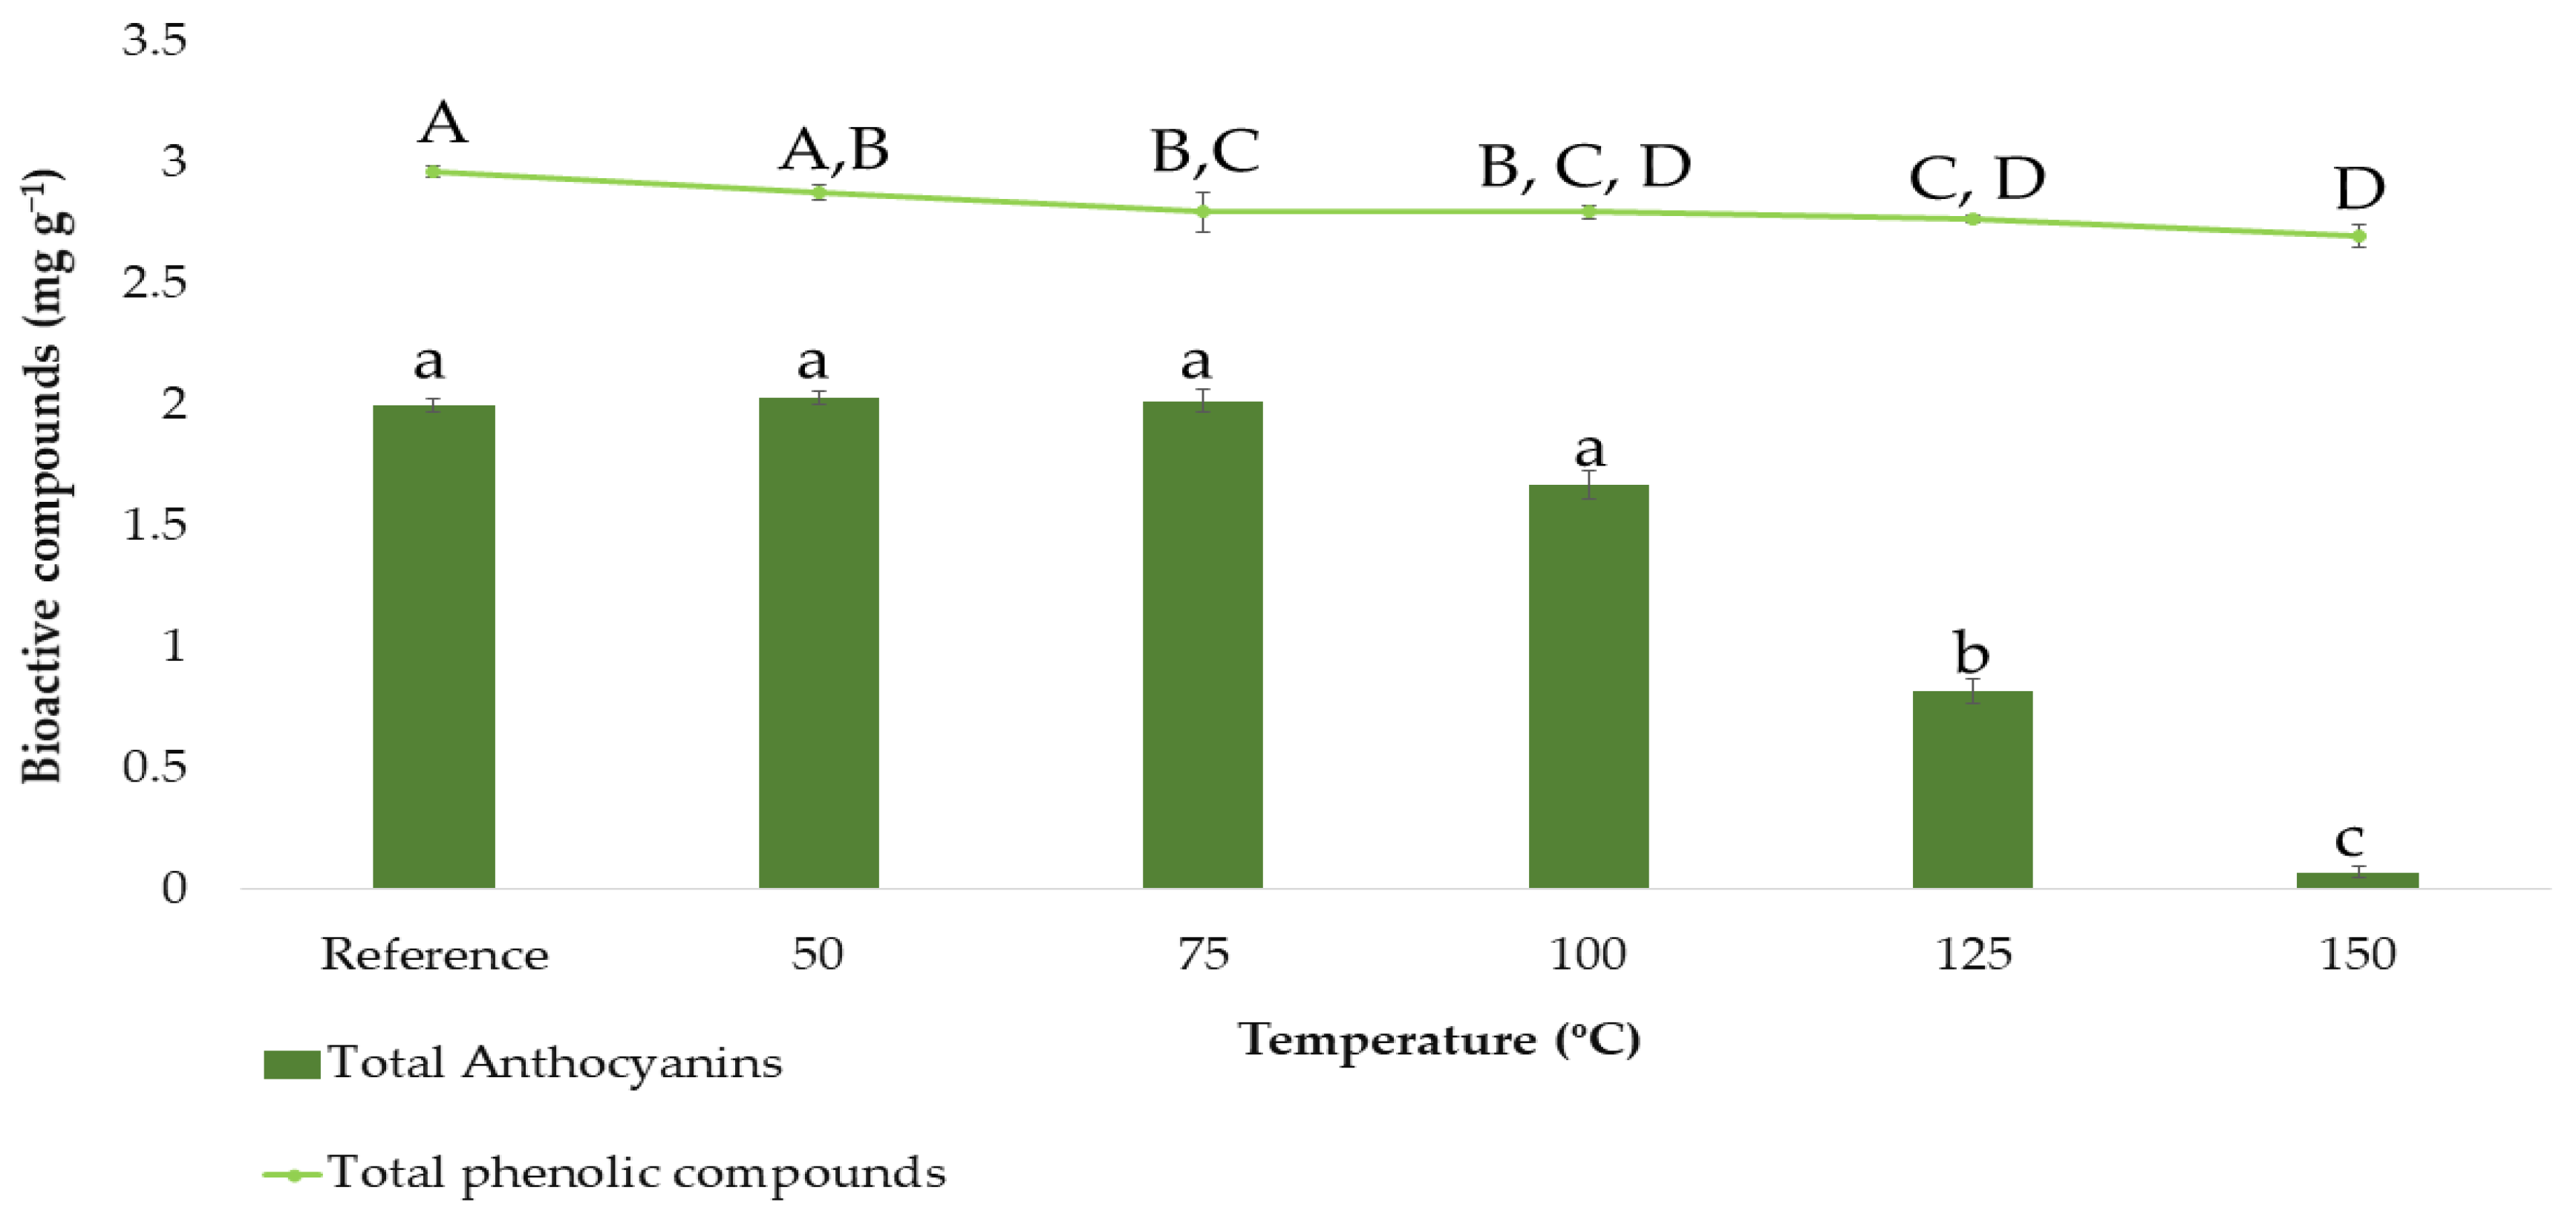
In order to determine the total phenolic compounds and the total anthocyanins based on the BBD design, the ranges corresponding to each factor had to be previously established. Except for that corresponding to the temperature, the rest of the ranges were set according to the group’s previous experience with onion matrices [25]. Since temperatures are higher in microwave-assisted extraction processes than in ultrasound-assisted extraction ones, this variable was studied separately by carrying out a stability study of the extracted bioactive compounds. For that purpose, the following extraction temperatures were studied in triplicate: 50, 75, 100, 125, and 150 °C, while the rest of the factors were set at intermediate constant values (50% methanol:water, 0.2:15 g:mL ratio and 5 min extraction time). The results obtained can be seen in Figure 2.
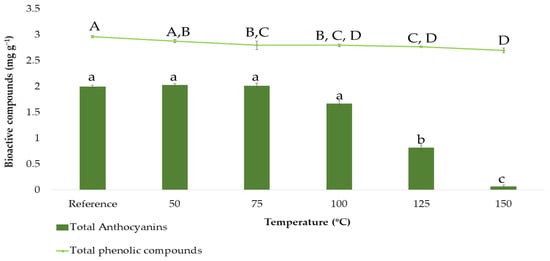
Figure 2.
Stability study on total anthocyanins and total phenolic compounds content (means ± SD). Different letters mean statistically significant differences according to Tukey’s test at the 95% level of significance.
Figure 2 shows how the anthocyanins content varies as a function of the temperature. The reference sample and the samples subjected to 50, 75, and 100 °C showed similar total anthocyanins contents according to Tukey’s test (group a). Above 100 °C, a clear decrease in total anthocyanins content was observed, which fell as low as 1 mg g−1 or less when the temperature reached its maximum level at 150 °C. This reduction is clearly due to the degradation experienced by the anthocyanins, as these compounds are characterized by their thermolability, and they had been exposed for 5 min to microwave extractions at high temperatures [39,40]. Consequently, 50–75–100 °C were the values to be incorporated into the BBD. On the other hand, Figure 2 also shows how the content of total phenolic compounds varies as a function of the temperature, even if these compounds were not so drastically degraded as can be concluded from Tukey’s test. This is so because total phenolic compounds include, in addition to anthocyanins, other compounds such as flavanols, which are less thermolabile. Even though the degradation of total phenolic compounds was not that notable, 50–75–100 °C were also selected as the temperature levels to be incorporated into the BBD since the amount of total phenolic compounds extracted at higher temperatures was also lower.
3.2. Box-Behken Designs and RSM
Once the ranges to be considered for each one of the experimental factors had been established, RSM and ANOVA were applied to the experimental matrix of the BBD (Table 1). The data corresponding to both response variables are shown in Table 2 and Table 3. Based on the results obtained, it could be confirmed that both analyses explain 95.28% (for total anthocyanins) and 78.12% (for total phenolic compounds) of the total variability. Furthermore, no significant lack of fit (0.38 for total anthocyanins, and 3.99 for total phenolic compounds) was revealed in either model, which corroborates their good fit.
Table 2.
ANOVA of the total anthocyanins in the MAE extracts.
Table 3.
ANOVA of the total phenolic compounds in the MAE extracts.
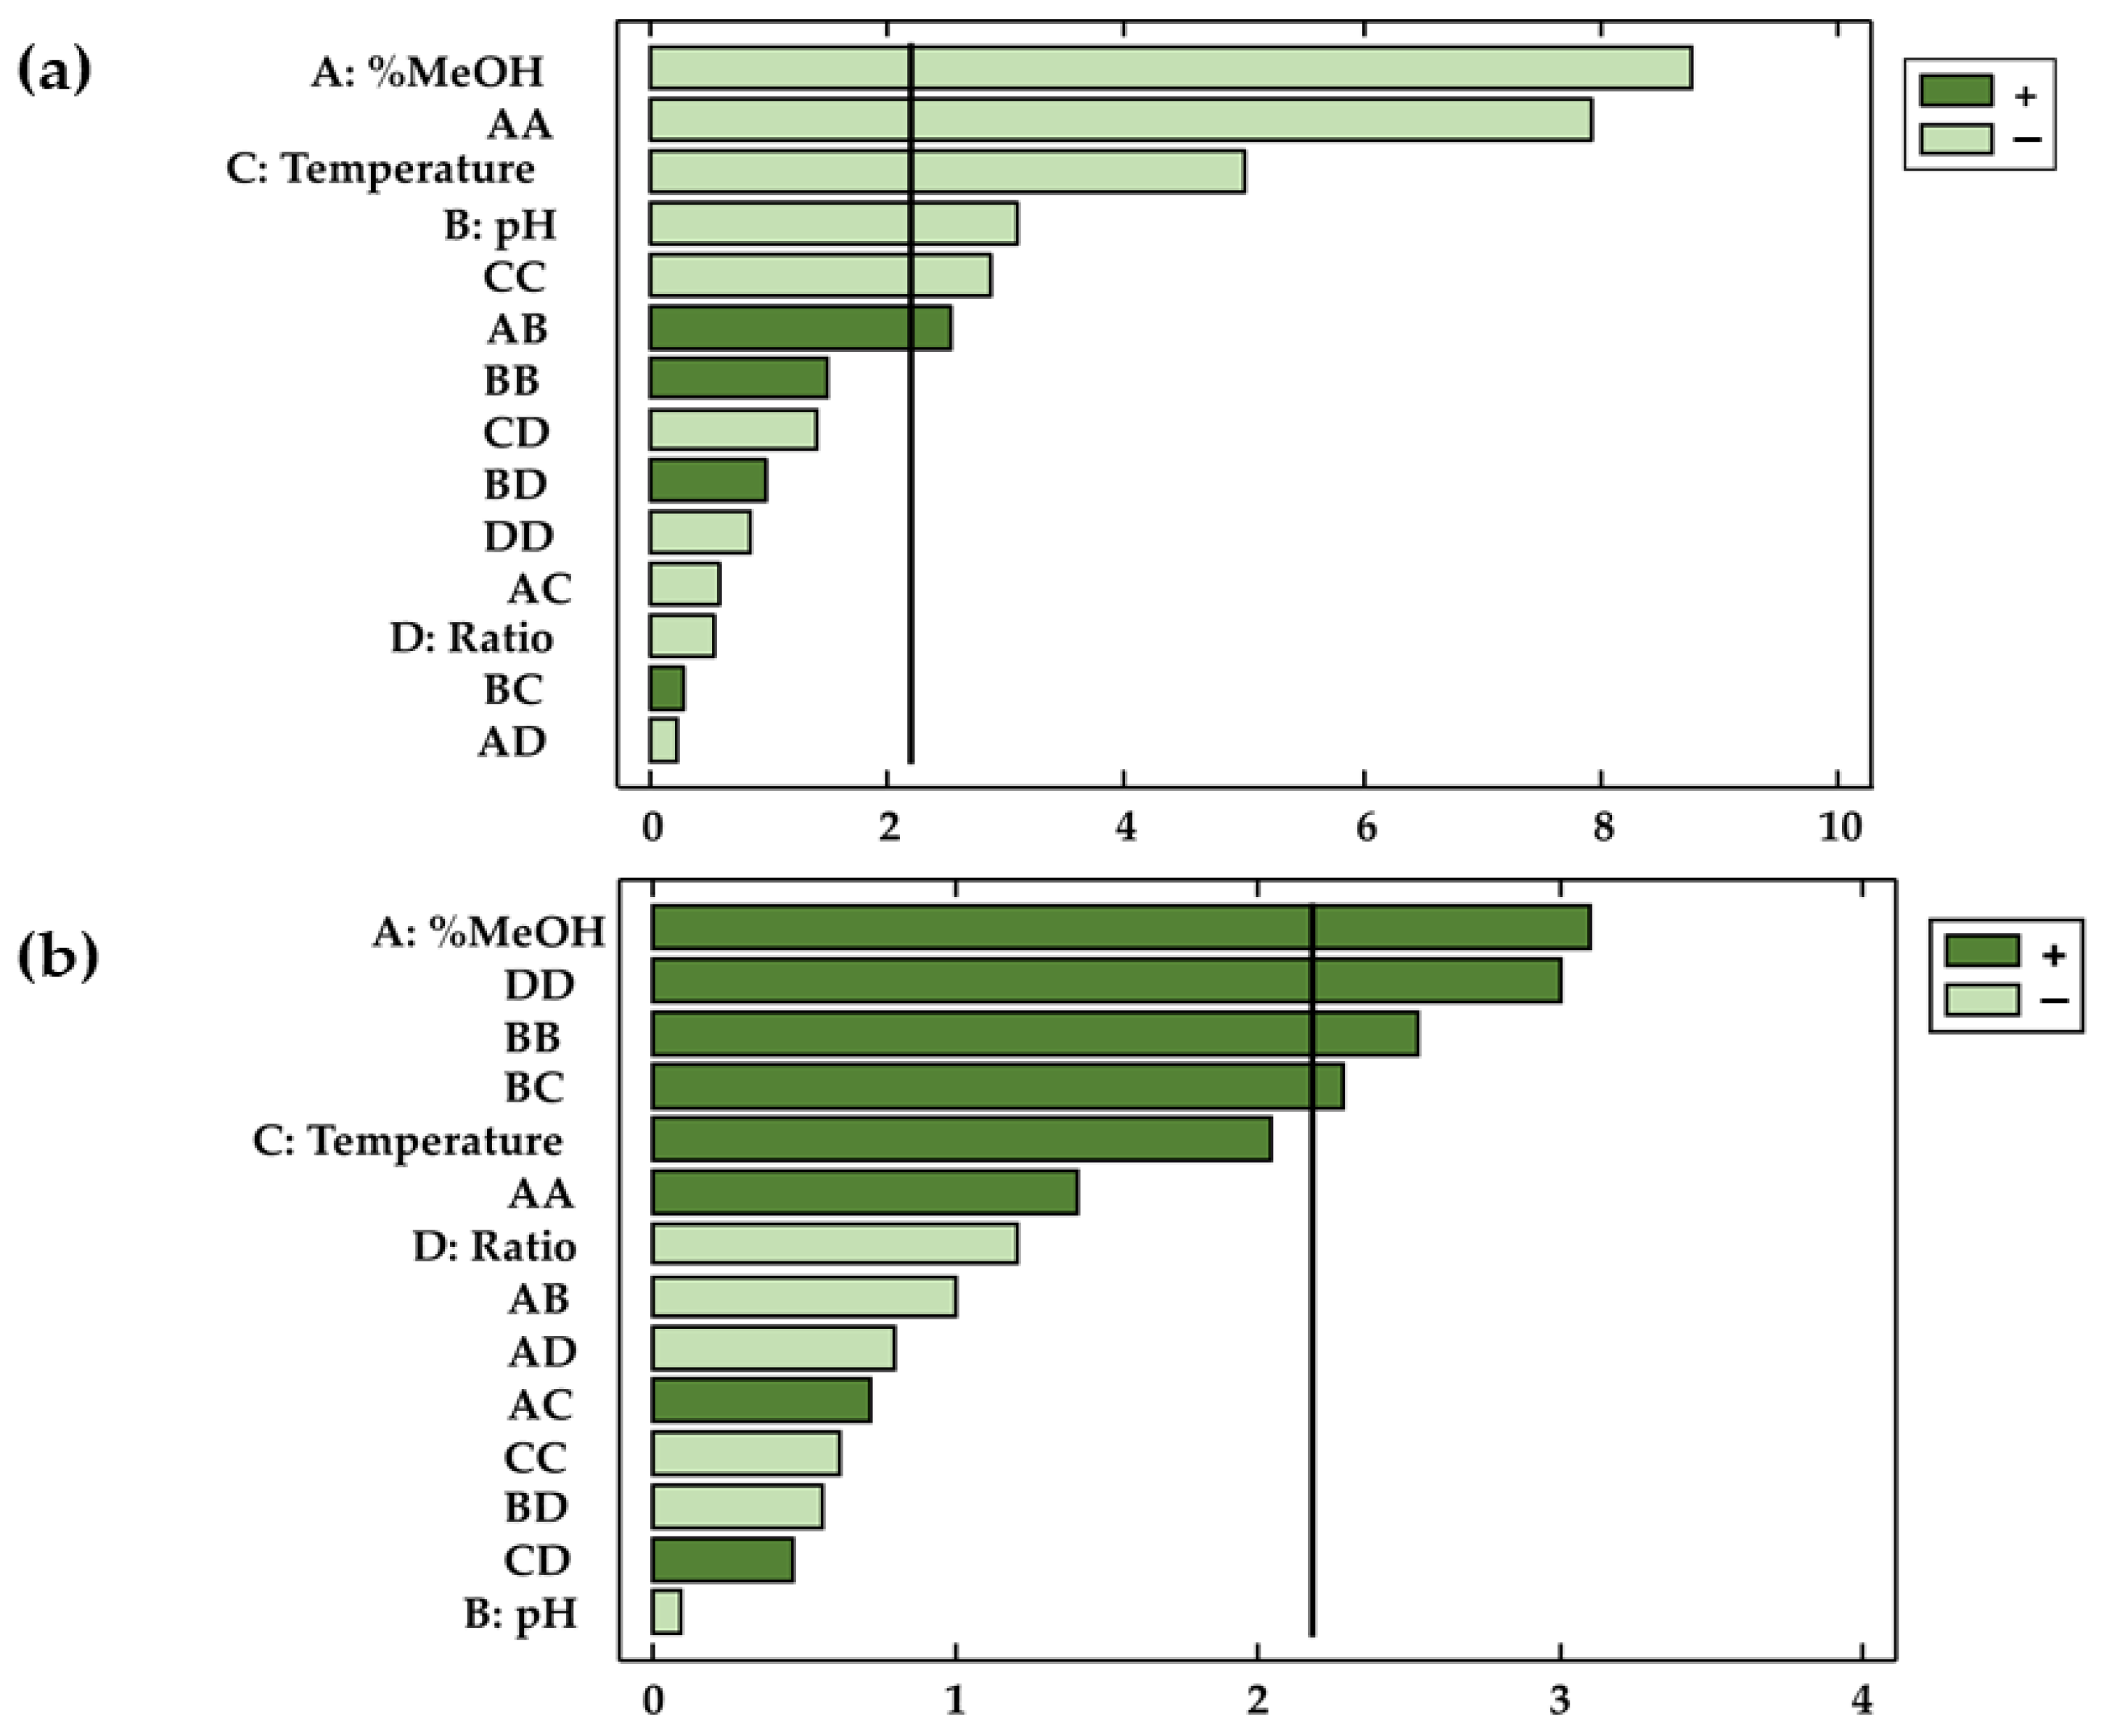
Not only the validity of the models has been confirmed, but this study has also determined the coefficients of the different parameters in the polynomial equation as well as their significance on the dependent variable. The factors and/or interactions that showed p-values < 0.05 were considered relevant (with statistical significance) for the response at a given significance level of 95%. This information was complemented by Pareto diagrams (Figure 3a,b), where the influence of the factors or their interactions can be conveniently visualized.

Figure 3.
Pareto diagrams for the two responses: (a) total anthocyanins and (b) total phenolic compounds.
The results obtained showed that the characteristics of the solvent (X1), the temperature (X3), and the pH (X2) had a significant effect on the extracted amounts of anthocyanins (p-values < 0.05). On the other hand, with regard to phenolic compounds, only methanol (X1) represented a significant factor with respect to the extractions obtained. The results agree with those found in the bibliography, according to which the relation between the percentages of methanol and water in the solvent is a highly influential variable regarding the extraction of phenolic compounds and anthocyanins from natural matrices [41,42,43]. In the case of the bioactive compounds studied in this work, methanol had opposite effects on the extraction of anthocyanins and total phenolic compounds. Thus, while in the case of anthocyanins extraction, methanol had a negative effect on the response variable (b1 = −0.51), higher percentages of methanol produced larger extractions of phenolic compounds (b1 = 0.63). In the case of the solvent range studied, it was concluded that the extraction of anthocyanins was favored by solvents formed by similar percentages of methanol and water. In regards to total phenolic compounds, larger amounts were obtained when the percentage of methanol in the solvent was higher than that of water. Due to the importance of the similar polarity between the bioactive compounds to be extracted and the solvent, it can be concluded that in addition to anthocyanins, other bioactive compounds are extracted (flavonoids and phenolic acids, among others) when total phenolic compounds are studied. Such compounds, which are also present in onion matrices, are less polar than anthocyanins and are therefore better extracted when using less polar solvents (with more content of methanol than water). The extraction is favored with this similarity of polarities, which intensifies the molecular forces and improves the solubility of the targeted compounds in the solvent [44,45]. With respect to anthocyanins, their solubility depends largely on their chemical structure. Anthocyanins are glycosylated derivatives of anthocyanidins [46], so on the one hand, the flavylium cation is responsible for the water solubility of these compounds [47], while on the other hand, the polyphenolic structure of the anthocyanin adds a hydrophobic characteristic, and makes them soluble in organic solvents, such as ethanol and methanol [48]. Specifically, among the anthocyanins present in onions, delphinidin has the highest polarity, followed by cyanidin [49]. Peonidin has the lowest polarity, probably due to the presence of a methoxy group in the 3′ position of ring B [50]. All these characteristics make the studied anthocyanins soluble both in water and in organic solvents such as methanol in this case. Specifically, a binary mixture of both would be the optimal extraction solvent because it would favor the diffusion of all the anthocyanins from the onion matrix to the solvent during extraction. Furthermore, it is important to note that in MAE, methanol improves the relative permittivity (the dielectric constant) [50], which in turn can improve the rate of internal diffusion and help the solvent to penetrate the solid phase. With respect to total phenolic compounds, due to the mixture of compounds extracted, with more complex and disparate structures and therefore with greater resistance to mass transfer, pure solvents such as methanol offer better results [51,52].
Apart from the extraction solvent, pH also exhibited an inverse relationship with the amount of anthocyanins extracted (b2 = −0.17). According to the bibliography, the extraction of anthocyanins is favored at acid pH because they play an important role in the rupture of cell membranes by acid hydrolysis, releasing the anthocyanins bound in the onion matrix and thus enhancing mass transfer [53,54,55]. It should also be kept in mind that the chemical structure of anthocyanins is influenced by the pH range, reaching unstable structures at basic pH. Specifically, anthocyanins are more stable in media with a pH between 1 and 3 [53,56] with the formation of flavylium cation with a red color [57].
Furthermore, temperature has also been reported as an influential extraction factor because of the previously mentioned thermolability of these compounds. Thus, since the temperature has an inverse effect on the response (b3 = −0.25), an increase in the extraction temperature has a negative effect on the amounts obtained of the said compounds in the extracts. Although, in many cases, high temperatures facilitate the extraction of the target compounds by softening the tissues, increasing the solubility and the diffusion coefficient [58], in the case of anthocyanins, due to their thermolabile nature, the effect of temperature on the extraction is negative [59]. Temperature can cause degradation of anthocyanins either by hydrolysis of the glycoside, generating unstable forms of aglycone, or by the hydrolytic opening of the heterocyclic ring [60]. Furthermore, if the medium is acidic, as has just been reported, high temperatures promote the hydrolysis of acid components and sugar residues, inactivating the chemical structure of anthocyanins [61].
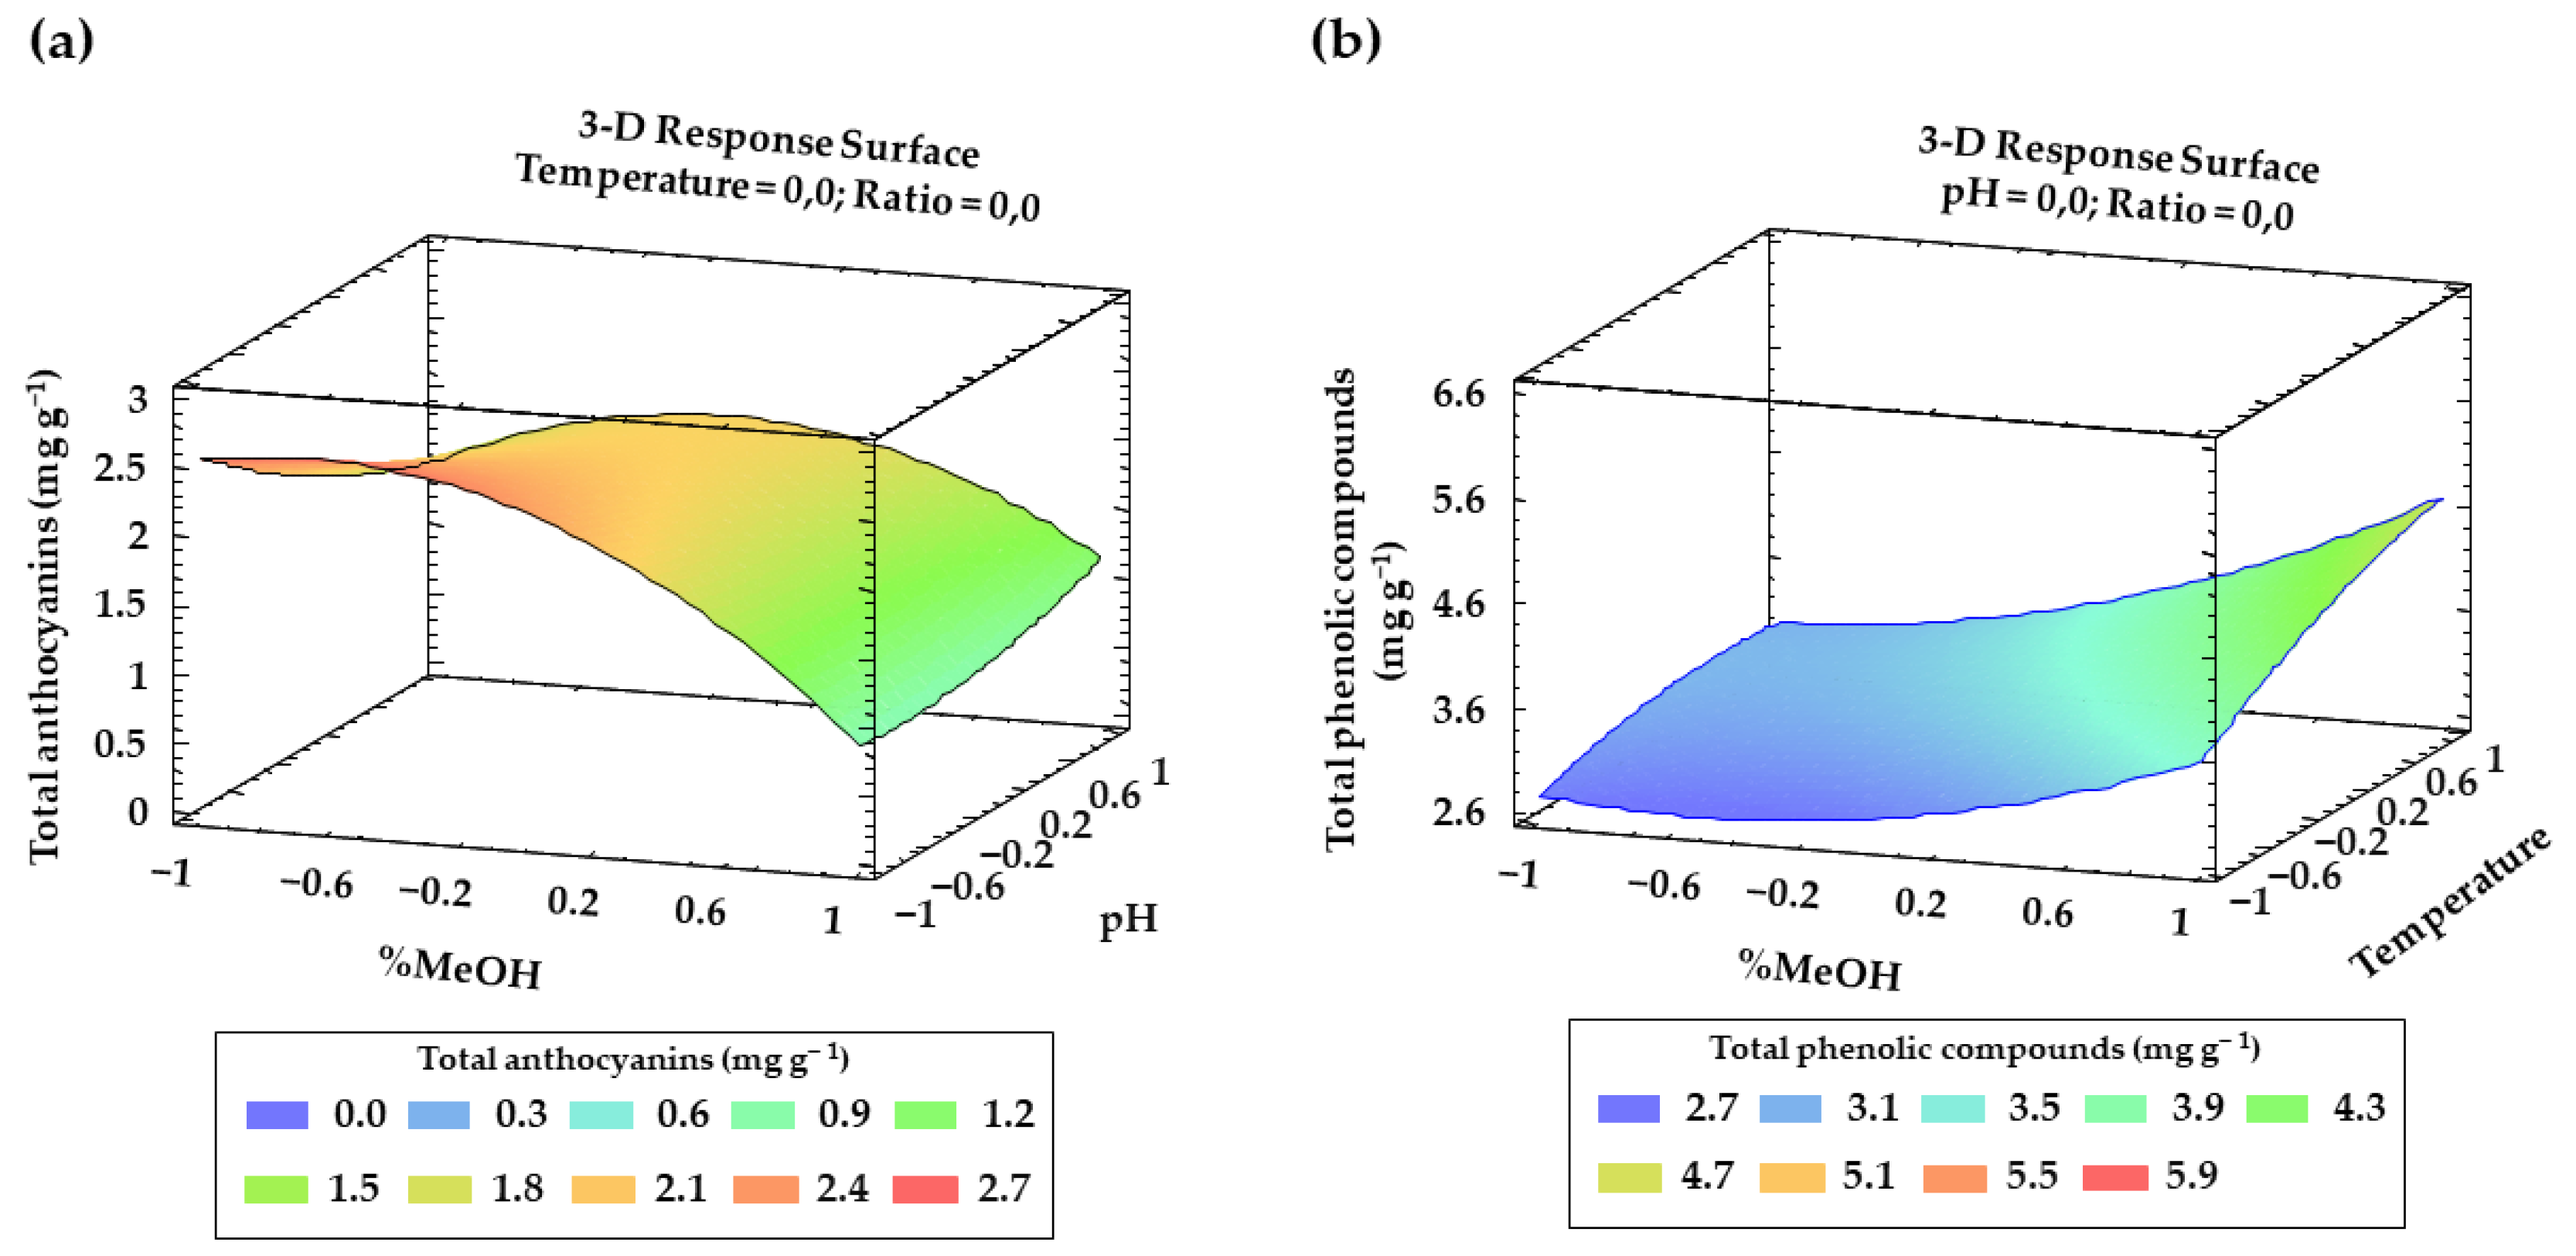
Finally, for both anthocyanins and total phenolic compounds, from Table 2 and Table 3 and the Pareto charts, a number of interactions between factors and their quadratic interactions with a significant influence on the response can be inferred. These trends have been recorded in three-dimensional (3D) surface plots (Figure 4a,b) using the fitted model for a better understanding.
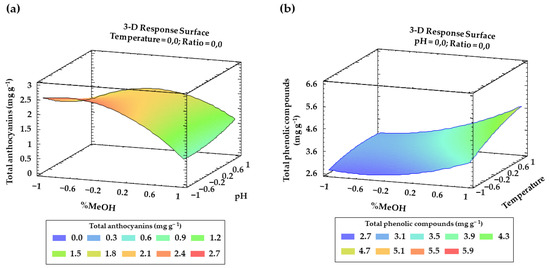
Figure 4.
Graphical representation using 3D surfaces of the most significant interactions according to BBD: (a) effect of solvent composition and pH on total anthocyanins recoveries (mg g−1); (b) effect of solvent composition and temperature on the total phenolic compounds recoveries (mg g−1).
Based on all the coefficients and effects that have been reported, the polynomial equations that should allow predicting the content of total anthocyanins (Equation (3)) and that of total phenolic compounds (Equation (4)) according to the experimental variables can be determined.
YTA (mg g−1) = 2.03 − 0.51·X1 − 0.17·X2 − 0.25·X3 − 0.03·X4 − 0.63·X12 + 0.34·X1X2 −
0.05·X1X3 − 0.02·X1X4 + 0.12·X2 2 + 0.03·X2X3 + 0.09·X2X4 − 0.21·X32 − 0.12·X3X4 − 0.06·X42,
0.05·X1X3 − 0.02·X1X4 + 0.12·X2 2 + 0.03·X2X3 + 0.09·X2X4 − 0.21·X32 − 0.12·X3X4 − 0.06·X42,
YTA (mg g−1) = 3.28 + 0.63·X1 − 0.02·X2 + 0.36·X3 − 0.21·X4 + 0.40·X12 + 0.47·X1X2 +
0.22·X1X3 − 0.24·X1X4 + 0.70 X22 + 0.70·X2X3 − 0.17·X2X4 − 0.16·X32 + 0.14·X3X4 + 0.77·X42,
0.22·X1X3 − 0.24·X1X4 + 0.70 X22 + 0.70·X2X3 − 0.17·X2X4 − 0.16·X32 + 0.14·X3X4 + 0.77·X42,
3.3. Optimal Conditions
The ANOVA also provided information regarding the values that each factor should take to obtain a maximum response, that is, a maximum anthocyanin extraction on the one hand and maximum total phenolic compounds extraction on the other. Specifically, the following values were established for the optimal extraction of total anthocyanins: 62% methanol in water as a solvent with pH 2, 56 °C extraction temperature, and 0.2:13 g:mL sample-solvent ratio. For total phenolic compounds, the following optimal values were established: 100% pure methanol as a solvent with pH 2, 57 °C extraction temperature, and 0.2:8.8 g:mL sample-solvent ratio. It can be observed, as mentioned above, that the extraction of total phenolic compounds improves as the percentage of methanol is also higher, while the extraction of anthocyanins is better achieved when intermediate percentages of methanol are employed. Regarding pH and temperature, an acidic pH combined with a mild temperature (near the lower value according to the range selected) favor the extraction of both types of compounds.
3.4. Extraction Time and Precision
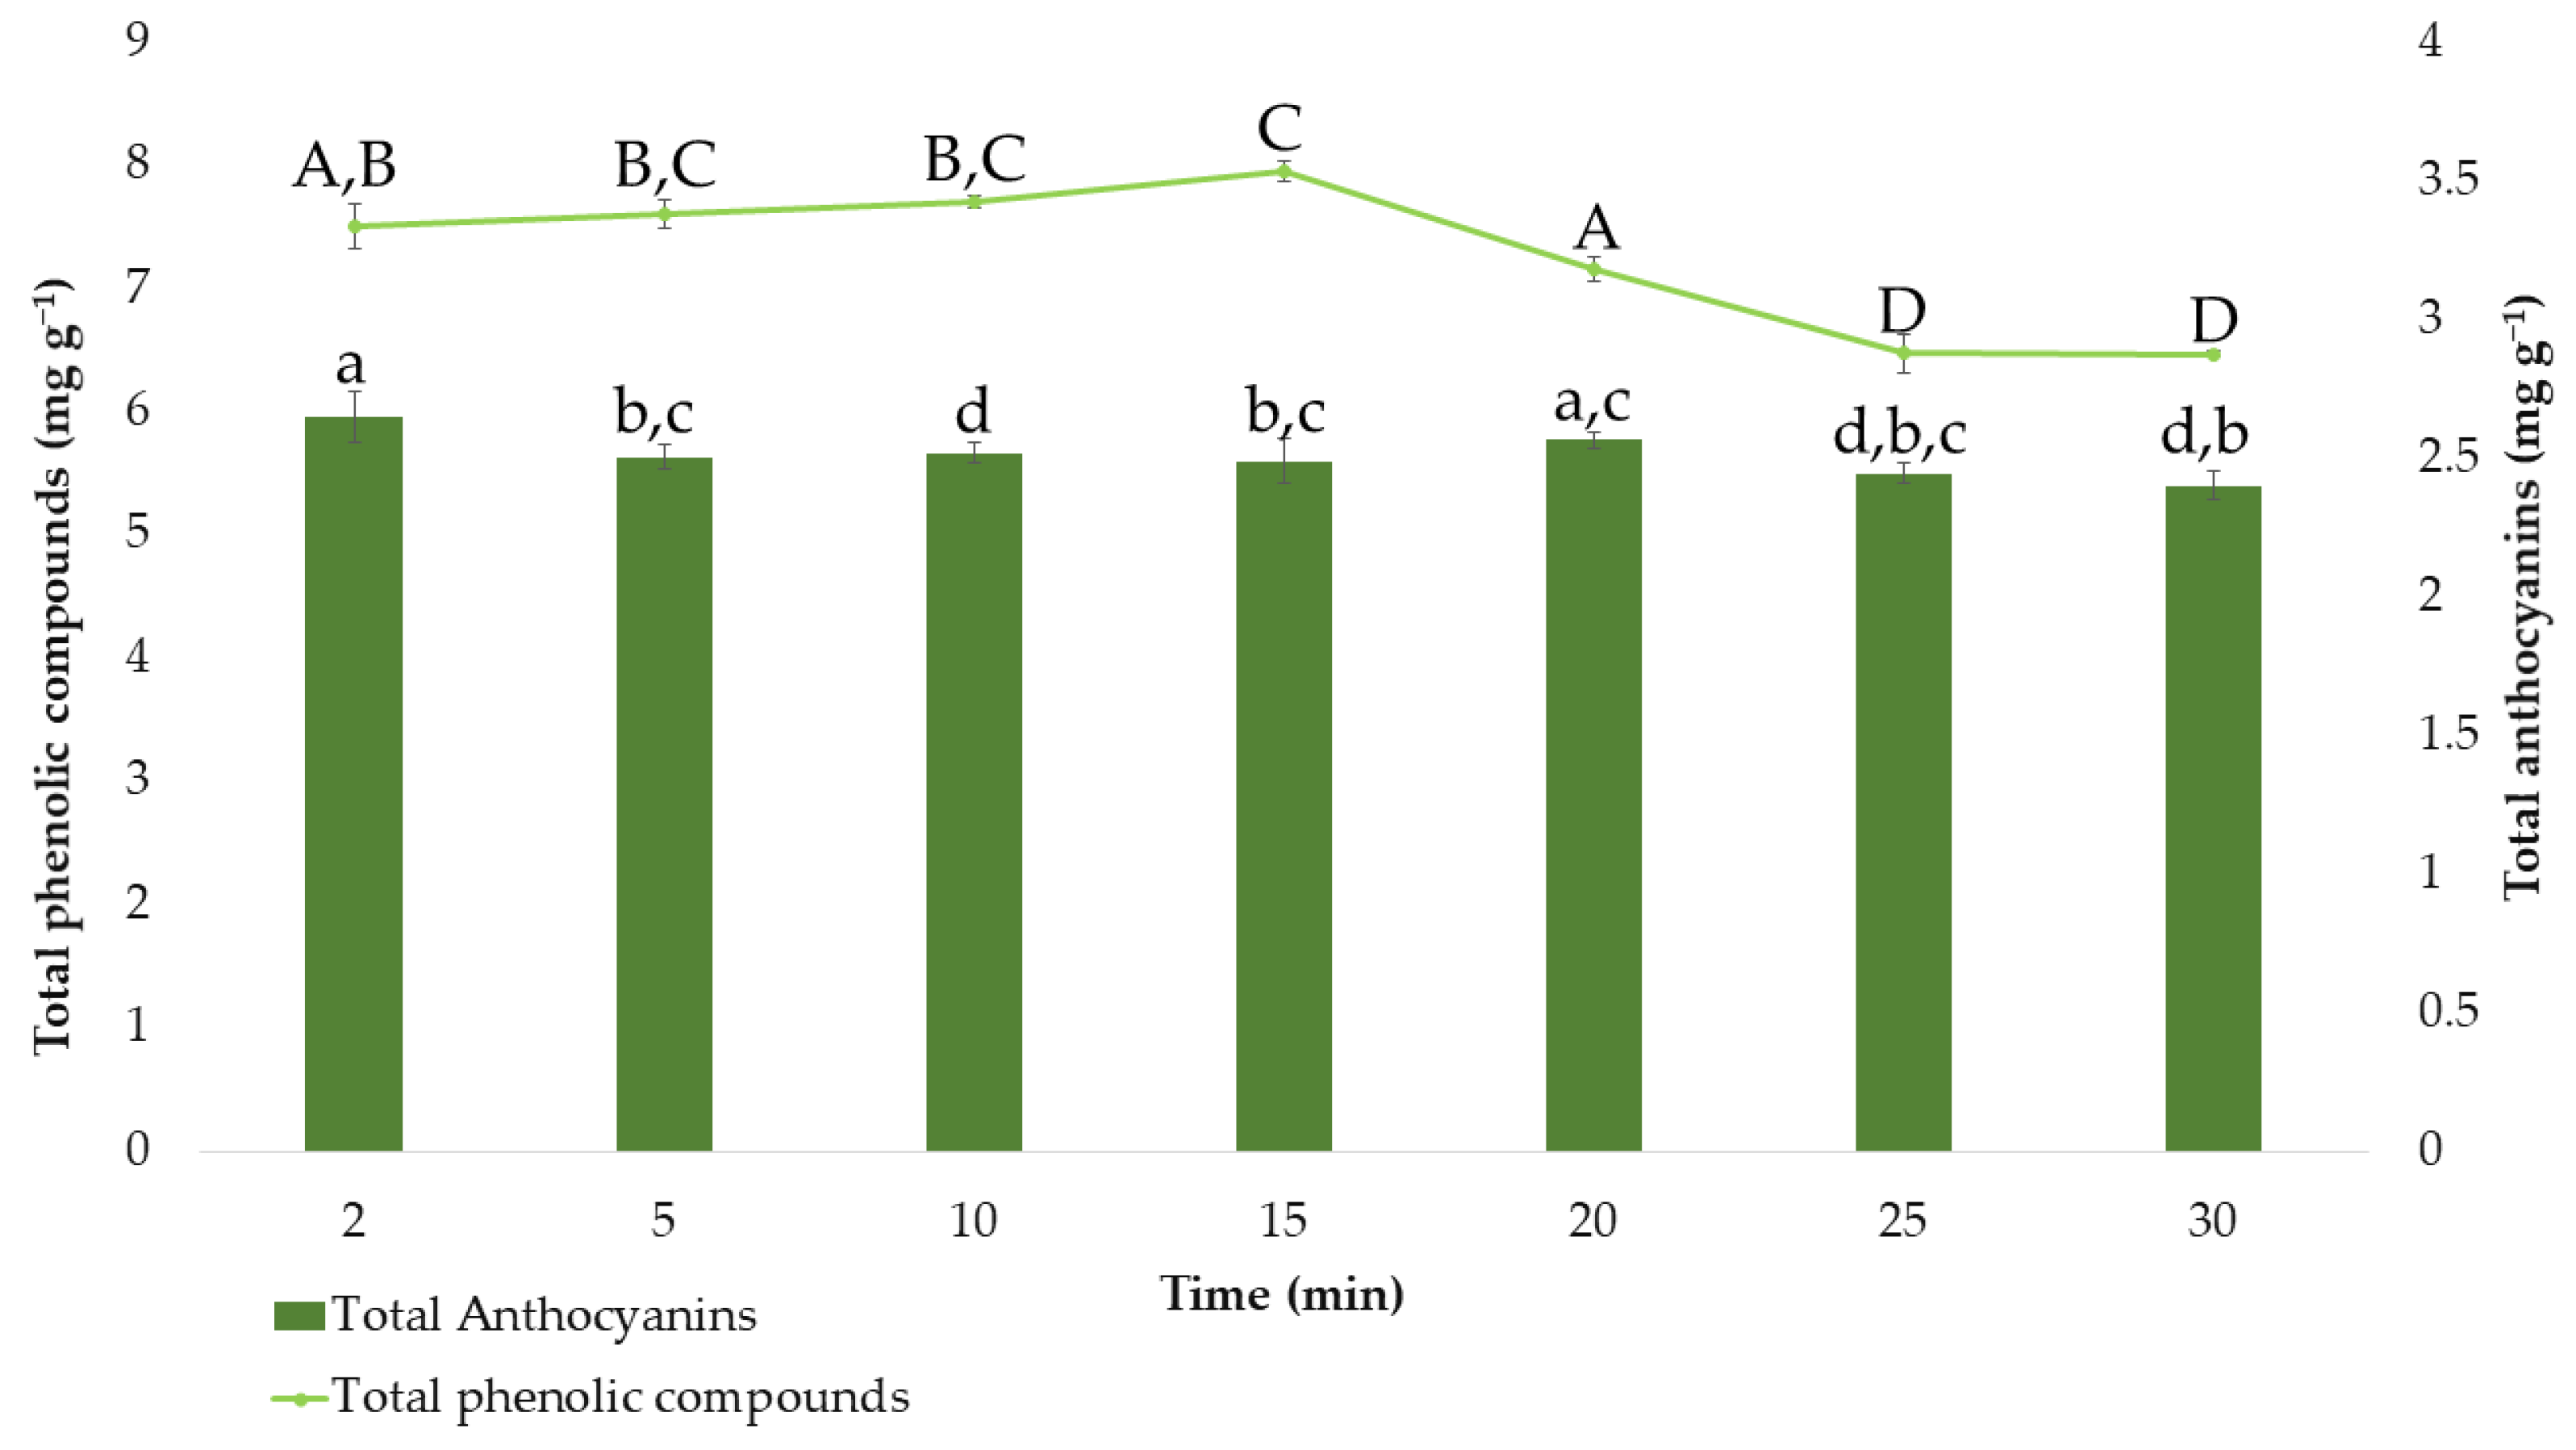
After determining the effects of the extraction factors on the response variables and the optimal values, the optimum extraction time was also evaluated. Different extractions were carried out under the optimal MAE conditions that had been established so far, while the extraction time varied between 2, 5, 10, 15, 20, 25, and 30 min. The average results obtained (n = 3) for total anthocyanins and total phenolic compounds are represented in Figure 5.

Figure 5.
Amount of total phenolic compounds and total anthocyanins (means ± SD) extracted at different times. Different letters mean statistically significant differences according to Tukey’s test at the 95% level of significance.
Regarding the extraction of total phenolic compounds, it can be observed that in times greater than 20 min, a degradation of the total phenolic compounds occurs. According to Tukey’s test, at 25 and 30 min of extraction (group D), extracts with significant differences and lower amounts of total phenolic compounds are obtained. This is probably because of the degradation experienced by phenolic compounds when the time of extraction is too long [59,62]. Furthermore, the amount of phenolic compounds extracted at 15 min is significantly different from that obtained at any other time (group C). Therefore, 15 min (7.95 ± 0.084 mg g−1) was determined as the optimal time since the amount of these bioactive compounds was maximum at this extraction time. Concerning anthocyanins and considering the results of the Tuckey test, there are no significant differences between most of the times studied. Only at a time of 2 min, could it be observed that the amount of extracted anthocyanins differs significantly from the others, only keeping similarity with the amount extracted at 20 min (group a). Consequently, the shortest time, 2 min, which allows time and cost savings with extractions at around 2.64 ± 0.093 mg g−1, was established as the optimal extraction time.
Finally, the precision of the two methods when operating under the optimal conditions that had been established has been investigated. For this purpose, a total of 60 experiments were conducted: 30 experiments used the optimal conditions for the extraction of total phenolic compounds, and another 30 experiments used the optimal conditions for the extraction of total anthocyanins. Each set of 30 experiments was carried out on 3 consecutive days by performing 10 experiments each day. In this way, the repeatability of the extraction method could be evaluated as the coefficient of variation (CV) of the experiments carried out on the same day, while its intermediate precision would be determined as the CV of the 30 experiments. Both methods presented good intermediate precision and repeatability, as their CVs were less than 5%, and this is the value generally accepted for this type of assessment [63]. The percentages obtained from the repeatability tests were 2.51% and 3.12%, and the intermediate precision percentages were 3.62% and 4.56% for total anthocyanins and total phenolic compounds, respectively.
3.5. Multiresponse-Optimization
In addition to the individual optimization of each of the response variables (total anthocyanins and total phenolic compounds), a multi-response optimization of both extraction processes was carried out. Multi-response optimization is a widely used statistical tool to determine the most optimal conditions to obtain in a single common extraction the greatest possible amount of both total phenolic compounds and total anthocyanins. This is of great interest from the economic point of view since it represents a considerable time and solvent saving. The optimal conditions to equally maximize both responses, total phenolic compounds and total anthocyanins, were the following: 78% MeOH with pH 2, 56 °C, and 0.2:10 g:mL as a ratio. Using these combined conditions and an intermediate extraction time of 5 min, the results obtained were the following: 2.33 ± 0.017 mg g−1 for total anthocyanins and 7.05 ± 0.14 mg g−1 for total phenolic compounds. These results differ from those obtained from each individual extraction process under their own specific optimal conditions (a p-value of the F-test less than 0.05). Establishing multi-response optimal extraction conditions seems to be difficult because of the different polarity of the two types of compounds to be extracted. Such polarity differences were evident in view of the dissimilarity between the optimal percentages of methanol in the extraction solvents for the extraction of total phenolic compounds (at 100%) and for total anthocyanins (at 62%). Furthermore, it should also be noted that each specific extraction process has a rather disparate optimal extraction time, with 15 min for the extraction of total phenolic compounds and 2 min for anthocyanins, which poses an additional difficulty when it comes to establishing a single extraction time for both types of compounds. Nevertheless, a combined method would be an interesting alternative for those cases where cutting down time and expenses are essential, such as in quality control laboratories [64]. Furthermore, despite the poorer results, the multi-response method that has been developed in this study achieves greater anthocyanins recoveries than the only other method that has been reported in the literature for the extraction of bioactive compounds from onion using MAE (1.75 ± 0.04 mg C3G/g DW) [29].
3.6. Microwave-Assisted Extraction vs. Other Assisted Extraction
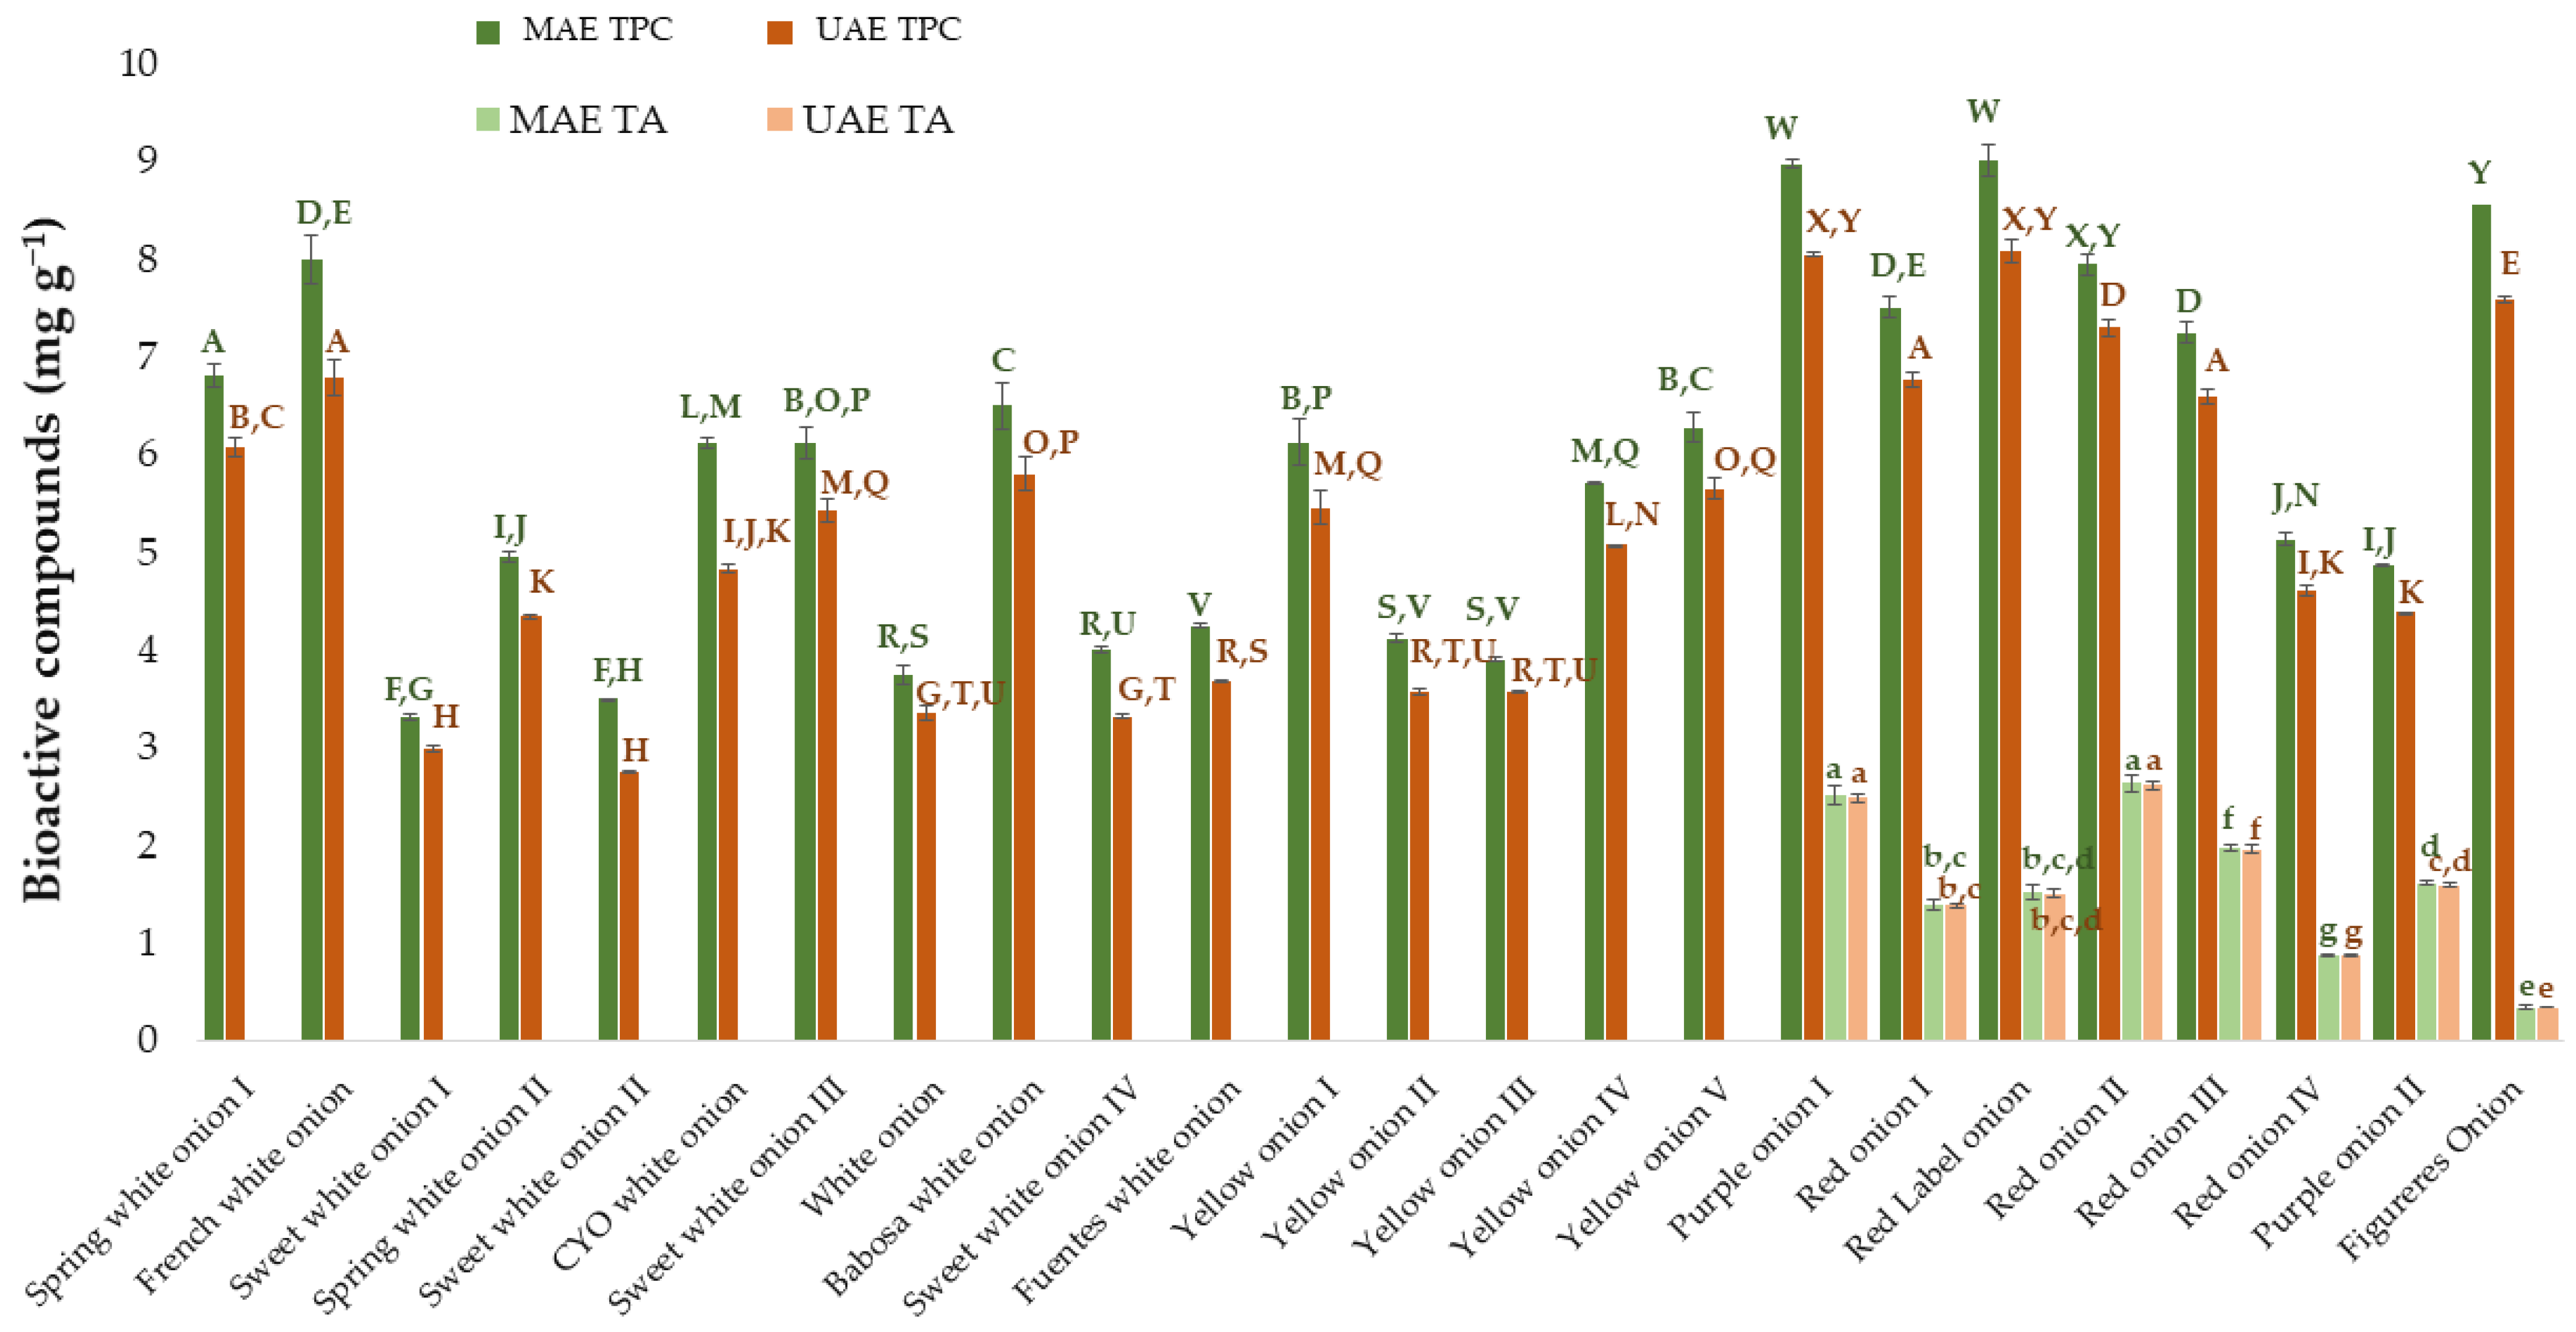
Finally, to complete this research, the results obtained from MAE were compared against those obtained in a previous work where UAE had been used [25]. For this purpose, the same number and varieties of onion samples subjected to the respective optimal conditions developed for each of the extraction methods were investigated. The results obtained by UAE have been extracted from the previously mentioned work [25]. The TPC and TA obtained from the different onion varieties using UAE and MAE have been included in Figure 6. The ANOVA has been done on the one hand for the results of total phenolic compounds and on the other hand for the results of total anthocyanins. Specifically, the Tuckey test has been applied to evaluate if there are significant differences between varieties and between the two applied extraction techniques (UAE and MAE).
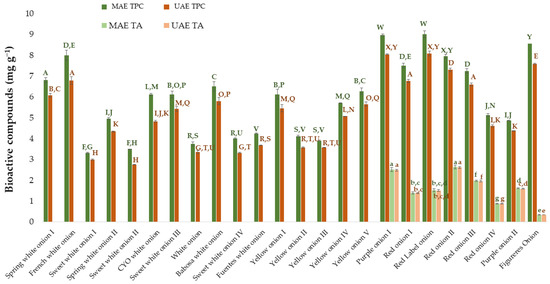
Figure 6.
Amount of total phenolic compounds and total anthocyanins extracted by MAE and UAE from different onion varieties. MAE TPC: total phenolic compounds extracted by the optimized MAE method. MAE TA: total anthocyanins extracted by the optimized MAE method. UAE TPC: total phenolic compounds extracted by the optimized UAE method. UAE TA: total anthocyanins extracted by the optimized UAE method. The data in the graph are the mean of 3 replicates ± the standard deviation (expressed as error bars). Different letters mean statistically significant differences according to Tukey’s test at the 95% level of significance.
As a result of the Tukey test, it can be observed that there are significant differences (p-value < 0.05) between the two techniques for the total phenolic compounds in all the varieties studied. Specifically, it can be concluded that microwave-assisted extraction provides greater amounts of TPC than ultrasound-assisted extraction. Regarding total anthocyanins, although numerically more amount of anthocyanins is extracted using MAE than UAE, statistically and according to the Tukey test, there were no significant differences between the means obtained with both techniques. Regarding the extraction time, as one of the key parameters to be compared and taken into account when it comes to extraction methods, it was equally short for both methods regarding the optimal extraction of anthocyanins, with just 2 min being enough to obtain the best possible results. With regard to the optimal time to extract the total phenolic compounds, MAE took slightly longer than UAE, with 15 min and 10 min, respectively. However, when the same extraction times were compared (5 min for example), MAE provided better results than UAE, with 7.60 ± 0.084 mg g−1 extracted by MAE and 6.9 ± 0.14 mg g−1 by UAE in the case of the “Red onion II” employed to optimize the processes.
Finally, it is interesting to also analyze the solvent that has been established as optimal for each of the methods since it provides information on the nature of the compounds that were being extracted. The optimal percentages of methanol for MAE were much higher than those for UAE (100% for phenolic compounds and 62% for anthocyanins in MAE versus 53% for phenolic compounds and 57% for anthocyanins in UAE). This indicates that MAE is more appropriate for extracting minor polar compounds, which is why it is more efficient when solvents with a higher percentage of methanol than that of water are used. Considering the “Red onion II” samples used for the process optimization and an intermediate extraction time of 5 min, it can be observed that the main difference concerning the individual anthocyanins lies with anthocyanin 8 (peonidin 3-O-(6″-malonylglucoside)), and anthocyanin 9 (delphinidin 3-O-glucoside). Thus, greater amounts of both these anthocyanins were extracted by MAE (0.23 ± 0.01 mg g−1 of anthocyanin 8 and 0.07 ± 0.01 mg g−1 of anthocyanin 9) than by UAE (0.02 ± 0.00 mg g−1 for anthocyanin 8 and 0.047 ± 0.00 mg g−1 for anthocyanin 9), while the rest of the individual anthocyanins were extracted in similar amounts by both methods. The reverse-phase liquid chromatography that has been applied in this study evidence that anthocyanins 8 and anthocyanins 9 are the less polar compounds present in onion (the last ones to leave the chromatography column, with the longer retention times). So, they are the best compounds to be extracted with a method such as MAE, which has a less polar solvent as previously mentioned.
The developed method has also been compared with other extraction techniques. In regards to assisted extraction techniques, few articles were found: Aguiar et al. [1] reported the use of QuEChERS assisted by ultrasound for the extraction of polyphenols, Stoica et al. [29] and Krithika et al. [65] employed the microwave-assisted extraction, and Hendrawan et al. [66] used ultrasound-assisted extraction. The method of QuEChERS UAE recovered 1.33 mg GAE g−1 of total phenolic compounds and 5.13 ± 0.36 µg g−1 of total anthocyanins with an extraction time of 5 min and a ratio sample:solvent of 10:10 g:mL, employing pure methanol as solvent. The methods of Stoica et al. and Krithika et al. recovered 1.60 ± 0.05 mg C3G g−1 DW of total phenolic compounds and a yield of total anthocyanin content of 21.99, respectively. Regarding the conditions, Stoica et al. used 50% ethanol acidified with 99.5% citric acid at 735 W microwave power for 15 s, and Krithika et al. used 2 g of onion peel with 75 mL of ethanol pure at 700 W microwave power for 5 min. Finally, Hendrawan et al. recovered 1.68 mg GAE g−1 of total phenolic compounds employing 20 g of onion with 300 mL of water at 35% of ultrasound amplitude for 5 min. It can be concluded that the times of all the assisted extraction methods are short and of the order of those developed in this work. However, the ratio, and therefore the consumption of samples and solvents, is higher in most cases. Regarding the results obtained, although these vary according to the variety of onions studied in each case, they seem to be of the same order or even lower than those obtained in this work.
Therefore, it can be concluded that MAE is a useful technique for obtaining onion extracts that will allow, among other things, to characterize onion varieties according to their profile of total phenolic compounds and anthocyanins. These extracts with a high content of bioactive compounds will also naturally exhibit a high antioxidant activity that can be of particular interest to consumers. Traditional techniques, such as maceration or sonication, are not really efficient methods to obtain extracts with a high content of bioactive compounds, and, consequently, it is not easy to determine the antioxidant activity of such extracts. In this study, the antioxidant activity of the extracts from all the onion varieties that have been mentioned above has been determined using the DPPH method. The onion extracts were obtained employing the multi-response method which allows obtaining in a single common extraction the greatest possible amount of both total phenolic compounds and total anthocyanins. The results obtained are reported in Table 4.
Table 4.
Antioxidant activity (n = 3) of the different onion varieties extracts obtained by the multi-response extraction method optimized in this study. Different letters mean statistically significant differences according to Tukey’s test at the 95% level of significance.
Based on the results obtained, it can be concluded that the antioxidant capacity of the extracts obtained by MAE is somewhat higher than that of the extracts obtained using UAE [25]. This is in agreement with expectations since, as previously mentioned, MAE is an extraction technique that achieves a greater recovery of bioactive compounds with antioxidant activity, namely total phenolic compounds and anthocyanins. In addition, and based on the onion varieties that have been analyzed in this article, the red varieties generally exhibited a higher antioxidant capacity than the white or yellow ones. This is explained by the fact that only the red varieties contain the anthocyanins that are largely responsible for their red/purple color in their matrix, as can be seen in Figure 6. These coloring compounds contribute to an increased amount of bioactive compounds with antioxidant activity in these onion varieties, and consequently, they exhibit a greater antioxidant capacity [67]. Nevertheless, it should be noted that this reasoning cannot be applied to all the onion varieties studied. According to Tukey’s test, some red varieties do not differ significantly from white or yellow ones. This may be because not only is the color responsible for their antioxidant capacity, but the characteristics of each specific variety also still play a significant role. For example, onion 24, Figueres onion, shows an antioxidant activity that does not differ significantly from a white variety such as onion 10 (group h). The Figueres onion exhibits a purple outer skin, but its inside is rather pale, which would explain its lower antioxidant capacity among the red varieties studied.
4. Conclusions
In the present study, two specific microwave-assisted extraction methods have been developed and optimized for the extraction of total anthocyanins and total phenolic compounds from red onions. A Box-Behnken design, together with response surface methodology, was employed to optimize the variables which affect the extraction of the compounds of interest. The variables that have been optimized are as follows: methanol: H2O percentages in the extraction solvent, pH of the extraction solvent, extraction temperature, and ratio between the sample weight and the volume of solvent employed. The optimal values for the extraction of total anthocyanins were established as follows: 62% methanol in water as a solvent with pH 2, 56 °C extraction temperature, and 0.2:13 g:mL sample-solvent ratio. Regarding total phenolic compounds, the following optimal values were established: 100% pure methanol as a solvent with pH 2, 57 °C extraction temperature, and 0.2:8.8 g:mL sample-solvent ratio. Both methods exhibited short extraction times (2 and 15 min, for total anthocyanins and total phenolic compounds, respectively), high repeatability, and intermediate precision levels (2.51% and 3.12%, for total anthocyanins, and 3.62% and 4.56%, for total phenolic compounds) and they were able to extract quantitative amounts of the compounds of interest (2.64 ± 0.093 mg g−1 for total anthocyanins and 7.95 ± 0.084 mg g−1 for total phenolic compounds). Furthermore, a multi-response method was optimized for the extraction of both types of compounds at the same time, which resulted in somewhat lower but with attractive cost and time reductions. Finally, the two optimized MAE methods were successfully applied to different onion varieties, and the extracts obtained exhibited large contents of total phenolic compounds and total anthocyanins, as well as a good antioxidant activity. These results have been compared against those obtained in a previous research work using ultrasound-assisted extraction and with those of other authors. The results confirmed that microwave-assisted extraction is a quantitative, repeatable, and very promising method for the extraction of phenolic compounds and anthocyanins, which offers similar and even superior results with little solvent expense, time, and costs. So, in future works, these methods could be used for the selection of those onion varieties richer in bioactive compounds with antioxidant activity and, therefore, with better biofunctional characteristics regarding health benefits for consumers.
Author Contributions
Conceptualization, M.F.-G. and G.F.B.; methodology, A.V.G.-d.-P., M.V.-E. and C.C.; software, M.F.-G.; validation, A.V.G.-d.-P. and M.V.-E.; formal analysis, A.V.G.-d.-P., M.V.-E. and C.C.; investigation, A.V.G.-d.-P. and M.V.-E.; resources, M.P. and G.F.B.; data curation, E.E.-B., M.F.-G. and G.F.B.; writing—original draft preparation, A.V.G.-d.-P. and M.V.-E.; writing—review and editing, G.F.B. and E.E.-B.; visualization, G.F.B.; supervision, M.F.-G. and G.F.B.; project administration, G.F.B.; funding acquisition, G.F.B. and M.P. All authors have read and agreed to the published version of the manuscript.
Funding
This work has been supported by the project “EQC2018-005135-P” (Equipment for liquid chromatography using mass spectrometry and ion chromatography) of the State Subprogram of Research Infrastructures and Technical Scientific Equipment. This research was funded by the INIA (National Institute for Agronomic Research) and FEDER (European Regional Development Fund, within the framework of the Operational Program under the Investment for Growth 2014–2020), that provided financial support (RTA2015-00042-C02-01), and by the Ministry of Science and Innovation of Spain (FPU grant AP-2018-03811 to Ana Velasco González de Peredo).
Institutional Review Board Statement
No applicable.
Informed Consent Statement
No applicable.
Data Availability Statement
The data presented in this study are contained within the article.
Acknowledgments
The authors express their acknowledgments to the Instituto de InvestigaciónVitivinícola y Agroalimentaria (IVAGRO) for providing the necessary facilities to carry out the research. A special remark goes to Carmelo García Barroso (in memoriam) for his contribution to the scientific community in phenolic compounds and oenology and his important input to this research.
Conflicts of Interest
The authors declare no conflict of interest.
Abbreviations and Nomenclatures
| ANOVA | Analysis of Variance |
| BBD | Box-Behnken Design |
| CV | Coefficient of variation |
| DOE | Design of Experiments |
| HPLC | High-Performance Liquid Chromatography |
| MAE | Microwave-Assisted Extraction |
| n | Number of replicates |
| RSM | Response Surface Methodology |
| SD | Standard Deviation |
| TA | Total Anthocyanins |
| TE | Trolox Equivalents |
| TPC | Total Phenolic Compounds |
| UAE | Ultrasound-Assisted Extraction |
| UHPLC | Ultra-High-Performance Liquid Chromatography |
| 3D | Three-dimensional |
| X1 | Percentage of methanol of the solvent |
| X2 | pH of the solvent |
| X3 | Extraction temperature |
| X4 | Ratio between sample weight and volume of solvent |
| k | Represents the number of factors |
| C0 | Represents the number of central points |
| Y | Represents the responses |
| β0 | Represents the model constant |
| βi | Represents the coefficient for each main effect |
| βij | Represents the coefficient corresponding to the interactions between factor i and factor j |
| βii | Represents the coefficient of the quadratic factors that represent the curvature of the surface |
| X | Represents each one of the factors studied |
| r | Represents the residual value (random error) |
References
- Aguiar, J.; Goncalves, J.L.; Alves, V.L.; Camara, J.S. Chemical fingerprint of free polyphenols and antioxidant activity in dietary fruits and vegetables using a non-targeted approach based on quechers ultrasound-assisted extraction combined with UHPLC-PDA. Antioxidants 2020, 9, 305. [Google Scholar] [CrossRef] [PubMed] [Green Version]
- Michiu, D.; Socaciu, M.-I.; Fogarasi, M.; Jimborean, A.M.; Ranga, F.; Muresan, V.; Semeniuc, C.A. Implementation of an Analytical Method for Spectrophotometric Evaluation of Total Phenolic Content in Essential Oils. Molecules 2022, 27, 1345. [Google Scholar] [CrossRef] [PubMed]
- Routray, W.; Orsat, V. Microwave-Assisted Extraction of Flavonoids: A Review. Food Bioproc. Tech. 2012, 5, 409–424. [Google Scholar] [CrossRef]
- Giusti, M.M.; Wrolstad, R.E. Acylated anthocyanins from edible sources and their applications in food systems. Biochem. Eng. J. 2003, 14, 217–225. [Google Scholar] [CrossRef]
- Castañeda-Ovando, A.; Pacheco-Hernández, M.D.L.; Páez-Hernández, M.E.; Rodríguez, J.A.; Galán-Vidal, C.A. Chemical studies of anthocyanins: A review. Food Chem. 2009, 113, 859–871. [Google Scholar] [CrossRef]
- Özcan, M.M.; Doğu, S.; Uslu, N. Effect of species on total phenol, antioxidant activity and phenolic compounds of different wild onion bulbs. Food Meas. Charact. 2018, 12, 902–905. [Google Scholar] [CrossRef]
- Hossain, M.B.; Lebelle, J.; Birsan, R.; Kai, D.K. Enrichment and assessment of the contributions of the major polyphenols to the total antioxidant activity of onion extracts: A fractionation by flash chromatography approach. Antioxidants 2018, 7, 175. [Google Scholar] [CrossRef] [Green Version]
- Saptarini, N.M.; Herawati, I.E. Extraction methods and varieties affect total anthocyanins content in acidified extract of papery skin of onion (Allium cepa L.). Drug Invent. 2018, 10, 471–474. [Google Scholar]
- Barros, L.; Carvalho, J.; Morais, J.S.; Ferreira, I.C.F.R. Strawberry-tree, blackthorn and rose fruits: Detailed characterisation in nutrients and phytochemicals with antioxidant. Food Chem. 2010, 120, 247–254. [Google Scholar] [CrossRef]
- Gironés-Vilaplana, A.; Calín-Sanchez, A.; Moreno, D.A.; Carbonell-Barrachina, A.A.; García-Viguera, C. Novel maqui liquor using traditional pacharán processing. Food Chem. 2015, 173, 1228–1235. [Google Scholar] [CrossRef]
- Wu, X.; Prior, R.L. Identification and characterization of anthocyanins by high-performance liquid chromatography-electrospray ionization-tandem mass spectrometry in common foods in the United States: Vegetables, nuts, and grains. J. Agric. Food Chem. 2005, 53, 3101–3113. [Google Scholar] [CrossRef] [PubMed]
- Oancea, S.; Drǎghici, O. pH and thermal stability of anthocyanin-based optimised extracts of romanian red onion cultivars. Czech J. Food Sci. 2013, 31, 283–291. [Google Scholar] [CrossRef] [Green Version]
- Pérez-Gregorio, M.R.R.; García-Falcón, M.S.S.; Simal-Gándara, J. Flavonoids changes in fresh-cut onions during storage in different packaging systems. Food Chem. 2011, 124, 652–658. [Google Scholar] [CrossRef]
- Zhang, C.; Li, X.; Zhan, Z.; Cao, L.; Zeng, A.; Chang, G.; Liang, Y. Transcriptome Sequencing and Metabolism Analysis Reveals the role of Cyanidin Metabolism in Dark-red Onion (Allium cepa L.). Bulbs. Sci. Rep. 2018, 8, 14109. [Google Scholar] [CrossRef] [PubMed]
- Tedesco, I.; Carbone, V.; Spagnuolo, C.; Minasi, P.; Russo, G.L. Identification and quantification of flavonoids from two southern italian cultivars of Allium cepa L., Tropea (Red Onion) and Montoro (Copper Onion), and their capacity to protect human erythrocytes from oxidative stress. J. Agric. Food Chem. 2015, 63, 5229–5238. [Google Scholar] [CrossRef]
- Stoica, F.; Aprodu, L.; Enachi, E.; Stănciuc, N.; Condurache, N.N.; Duță, D.E.; Bahrim, G.E.; Râpeanu, G. Bioactive’s characterization, biological activities, and in silico studies of red onion (Allium cepa L.) skin extracts. Plants 2021, 10, 2330. [Google Scholar] [CrossRef]
- Moreno-Rojas, J.M.; Moreno-Ortega, A.; Ordóñez, J.J.; Moreno-Rojas, R.; Pérez-Aparicio, J.; Pereira-Caro, G. Development and validation of UHPLC-HRMS methodology for the determination of flavonoids, amino acids and organosulfur compounds in black onion, a novel derived product from fresh shallot onions (Allium cepa var. Aggregatum). LWT 2018, 97, 376–383. [Google Scholar] [CrossRef]
- Terahara, N.; Yamaguchi, M.-A.; Honda, T. Malonylated Anthocyanins from Bulbs of Red Onion, Allium cepa L. Biosci. Biotechnol. Biochem. 2009, 58, 1324–1325. [Google Scholar] [CrossRef]
- Rodrigues, A.S.; Pérez-Gregorio, M.R.; García-Falcón, M.S.; Simal-Gándara, J.; Almeida, D.P.F. Effect of meteorological conditions on antioxidant flavonoids in Portuguese cultivars of white and red onions. Food Chem. 2011, 124, 303–308. [Google Scholar] [CrossRef]
- Pérez-Gregorio, M.R.; González-Barreiro, C.; Rial-Otero, R.; Simal-Gándara, J. Comparison of sanitizing technologies on the quality appearance and antioxidant levels in onion slices. Food Control 2011, 22, 2052–2058. [Google Scholar] [CrossRef]
- Li, H.; Deng, Z.; Zhu, D.; Hu, C.; Liu, R.; Young, J.C.; Tsao, R. Highly pigmented vegetables: Anthocyanin compositions and their role in antioxidant activities. Food Res. Int. 2012, 46, 250–259. [Google Scholar] [CrossRef]
- Pérez-Gregorio, R.M.; García-Falcón, M.S.; Simal-Gándara, J.; Rodrigues, A.S.; Almeida, D.P.F. Identification and quantification of flavonoids in traditional cultivars of red and white onions at harvest. J. Food Compos. Anal. 2010, 23, 592–598. [Google Scholar] [CrossRef]
- Rosa, R.; Ferrari, E.; Veronesi, P. From Field to Shelf: How Microwave-Assisted Extraction Techniques Foster an Integrated Green Approach. In Emerging Microwave Technologies in Industrial, Agricultural, Medical and Food Processing; Kok, Y.Y., Ed.; IntechOpen: London, UK, 2018; p. 179. [Google Scholar]
- Chaves, J.O.; de Souza, M.C.; da Silva, C.L.; Lachos-Perez, D.; Torres-Mayanga, P.C.; Machado, A.P.D.F.; Forster-Carneiro, T.; Vázquez-Espinosa, M.; González-de-Peredo, A.V.; Barbero, G.F.; et al. Extraction of Flavonoids From Natural Sources Using Modern Techniques. Front. Chem. 2020, 8, 507887. [Google Scholar] [CrossRef] [PubMed]
- González-de-Peredo, A.V.; Vázquez-Espinosa, M.; Espada-Bellido, E.; Ferreiro-González, M.; Carrera, C.; Barbero, G.F.; Palma, M. Development of Optimized Ultrasound-Assisted Extraction Methods for the Recovery of Total Phenolic Compounds and Anthocyanins from Onion Bulbs. Antioxidants 2021, 10, 1755. [Google Scholar] [CrossRef]
- Rehman, M.U.; AbdullahKhan, F.; Niaz, K. Introduction to natural products analysis. In Recent Advances in Natural Products Analysis, 1st ed.; Silva, A.S., Nabavi, S.F., Saeedi, M., Nabavi, S.M., Eds.; Elsevier Inc.: Amsterdam, The Netherlands, 2020; pp. 3–15. [Google Scholar]
- Zhou, H.-Y.; Liu, C.-Z. Microwave-assisted extraction of solanesol from tobacco leaves. J. Chromatogr. A 2006, 1129, 135–139. [Google Scholar] [CrossRef]
- Lopez-Avila, V.; Luque de Castro, M.D. Microwave-Assisted Extraction. In Reference Module in Chemistry, Molecular Sciences and Chemical Engineering; Elsevier: Amsterdam, The Netherlands, 2014; pp. 1389–1398. [Google Scholar]
- Stoica, F.; Râpeanu, G.; Nistor, O.V.; Enachi, E.; Stănciuc, N.; Mureșan, C.; Bahrim, G.E. Recovery of bioactive compounds from red onion skins using conventional solvent extraction and microwave assisted extraction. Ann. Univ. Dunarea Jos Galati Fascicle VI-Food Technol. 2020, 44, 104–126. [Google Scholar] [CrossRef]
- Razali, M.A.A.; Sanusi, N.; Ismail, H.; Othman, N.; Ariffin, A. Application of response surface methodology (RSM) for optimization of cassava starch grafted polyDADMAC synthesis for cationic properties. Starch/Staerke 2012, 64, 935–943. [Google Scholar] [CrossRef]
- Aydar, A.Y. Utilization of Response Surface Methodology in Optimization of Extraction of Plant Materials. In Statistical Approaches with Emphasis on Design of Experiments Applied to Chemical Processes; Silva, V., Ed.; InTech: London, UK, 2018; pp. 157–169. [Google Scholar]
- Singleton, V.L.; Orthofer, R.; Lamuela-Raventós, R.M. Analysis of total phenols and other oxidation substrates and antioxidants by means of folin-ciocalteu reagent. Methods Enzymol. 1999, 299, 152–178. [Google Scholar] [CrossRef]
- Miliauskas, G.; Venskutonis, P.R.; Van Beek, T.A. Screening of radical scavenging activity of some medicinal and aromatic plant extracts. Food Chem. 2004, 85, 231–237. [Google Scholar] [CrossRef]
- Škrovánková, S.; Mišurcová, L.; Machů, L. Antioxidant Activity and Protecting Health Effects of Common Medicinal Plants. Adv. Food Nutr. Res. 2012, 67, 75–139. [Google Scholar] [CrossRef]
- Dini, I.; Tenore, G.C.; Dini, A. S-alkenyl cysteine sulfoxide and its antioxidant properties from Allium cepa var. tropeana (red onion) seeds. J. Nat. Prod. 2008, 71, 2036–2037. [Google Scholar] [CrossRef]
- Majid, I.; Nanda, V. Instrumental texture and flavonoid profile of paste developed from sprouted onion varieties of Indian origin. Int. J. Food Prop. 2017, 20, 2511–2526. [Google Scholar] [CrossRef] [Green Version]
- Ferreira, S.L.C.; Bruns, R.E.; Ferreira, H.S.; Matos, G.D.; David, J.M.; Brandao, G.C.; da Silva, E.G.P.; Portugal, L.A.; dos Reis, P.S.; Souza, A.S.; et al. Box-Behnken design: An alternative for the optimization of analytical methods. Anal. Chim. Acta 2007, 597, 179–186. [Google Scholar] [CrossRef]
- Maran, J.; Manikandan, S.; Thirugnanasambandham, K.; Vigna Nivetha, C.; Dinesh, R. Box-Behnken design based statistical modeling for ultrasound-assisted extraction of corn silk polysaccharide. Carbohydr. Polym. 2013, 92, 604–611. [Google Scholar] [CrossRef] [PubMed]
- Galanakis, C.M.; Goulas, V.; Tsakona, S.; Manganaris, G.A.; Gekas, V. A Knowledge Base for The Recovery of Natural Phenols with Different Solvents. Int. J. Food Prop. 2012, 16, 382–396. [Google Scholar] [CrossRef] [Green Version]
- Jiménez, N.; Bohuon, P.; Dornier, M.; Bonazzi, C.; Pérez, A.M.; Vaillant, F. Effect of water activity on anthocyanin degradation and browning kinetics at high temperatures (100–140 °C). Food Res. Int. 2012, 47, 106–115. [Google Scholar] [CrossRef]
- González-de-Peredo, A.V.; Vázquez-Espinosa, M.; Espada-Bellido, E.; Jiménez-Cantizano, A.; Ferreiro-González, M.; Amores-Arrocha, A.; Palma, M.; Barroso, C.G.; Barbero, G.F. Development of New Analytical Microwave-Assisted Extraction Methods for Bioactive Compounds from Myrtle (Myrtus communis L.). Molecules 2018, 23, 2992. [Google Scholar] [CrossRef] [Green Version]
- Vázquez-Espinosa, M.; Espada-Bellido, E.; González-de-Peredo, A.V.; Ferreiro-González, M.; Carrera, C.; Palma, M.; Barroso, C.G.; Barbero, G.F. Optimization of Microwave-Assisted Extraction for the Recovery of Bioactive Compounds from the Chilean Superfruit (Aristotelia chilensis (Mol.) Stuntz). Agronomy 2018, 8, 240. [Google Scholar] [CrossRef] [Green Version]
- Xiang, Z.; Wu, X. Ultrasonic-Microwave Assisted Extraction of Total Flavonoids from Scutellaria baicalensis Using Response Surface Methodology. Pharm. Chem. J. 2017, 51, 318–324. [Google Scholar] [CrossRef]
- Machado, A.P.D.F.; Pasquel-Reátegui, J.L.; Barbero, G.F.; Martínez, J. Pressurized liquid extraction of bioactive compounds from blackberry (Rubus fruticosus L.) residues: A comparison with conventional methods. Food Res. Int. 2015, 77, 675–683. [Google Scholar] [CrossRef]
- Mustafa, A.; Turner, C. Pressurized liquid extraction as a green approach in food and herbal plants extraction: A review. Anal. Chim. Acta 2011, 703, 8–18. [Google Scholar] [CrossRef] [PubMed]
- Cheng, J.; Wei, G.; Zhou, H.; Gu, C.; Vimolmangkang, S.; Liao, L.; Han, Y. Unraveling the Mechanism Underlying the Glycosylation and Methylation of Anthocyanins in Peach. Plant Physiol. 2014, 166, 1044–1058. [Google Scholar] [CrossRef] [PubMed] [Green Version]
- Moreno, J.; Peinado, R. Chapter 5-Polyphenols. Enol. Chem. 2012, 1, 53–76. [Google Scholar] [CrossRef]
- Khoo, H.E.; Azlan, A.; Tang, S.T.; Lim, S.M. Anthocyanidins and anthocyanins: Colored pigments as food, pharmaceutical ingredients, and the potential health benefits. Food Nutr. Res. 2017, 61, 1361779. [Google Scholar] [CrossRef] [Green Version]
- Amić, D.; Davidović-Amić, D.; Trinajstić, N. Application of topological indices to chromatographic data: Calculation of the retention indices of anthocyanins. J. Chromatogr. A 1993, 653, 115–121. [Google Scholar] [CrossRef]
- Setford, P.C.; Jeffery, D.W.; Grbin, P.R.; Muhlack, R. Mass Transfer of Anthocyanins during Extraction from Pre-Fermentative Grape Solids under Simulated Fermentation Conditions: Effect of Convective Conditions. Molecules 2019, 24, 73. [Google Scholar] [CrossRef] [Green Version]
- Ambigaipalan, P.; de Camargo, A.C.; Shahidi, F. Identification of phenolic antioxidants and bioactives of pomegranate seeds following juice extraction using HPLC-DAD-ESI-MSn. Food Chem. 2017, 221, 1883–1894. [Google Scholar] [CrossRef]
- Sang, J.; Sang, J.; Ma, Q.; Hou, X.-F.; Li, C.-Q. Extraction optimization and identification of anthocyanins from Nitraria tangutorun Bobr. seed meal and establishment of a green analytical method of anthocyanins. Food Chem. 2017, 218, 386–395. [Google Scholar] [CrossRef]
- Santos, D.T.; Veggi, P.C.; Meireles, M.A.A. Optimization and economic evaluation of pressurized liquid extraction of phenolic compounds from jabuticaba skins. J. Food Eng. 2012, 108, 444–452. [Google Scholar] [CrossRef] [Green Version]
- Türker, N.; Erdogdu, F. Effects of pH and temperature of extraction medium on effective diffusion coefficient of anthocynanin pigments of black carrot (Daucus carota var. L.). J. Food Eng. 2006, 76, 579–583. [Google Scholar] [CrossRef]
- Peron, D.V.; Fraga, S.; Antelo, F. Thermal degradation kinetics of anthocyanins extracted from juçara (Euterpe edulis Martius) and ‘Italia’ grapes (Vitis vinifera L.), and the effect of heating on the antioxidant capacity. Food Chem. 2017, 232, 836–840. [Google Scholar] [CrossRef] [PubMed]
- Frond, A.D.; Iuhas, C.I.; Stirnu, I.; Leopold, L.; Soacaci, S.; Andreea, S.; Ayvaz, H.; Mihai, S.; Diaconeasa, Z.; Carmen, S. Phytochemical characterization of five edible purple-reddish vegetables: Anthocyanins, flavonoids, and phenolic acid derivatives. Molecules 2019, 24, 1536. [Google Scholar] [CrossRef] [PubMed] [Green Version]
- Khoo, H.E.; Chew, L.Y.; Ismail, A. Azlan, A. Anthocyanins in purple colored fruits. In Polyphenols: Chemistry, Dietary Sources and Health Benefits; Sun, J., Prasad, K.N., Ismail, A., Eds.; Nova Science Publisher: New York, NY, USA, 2012; pp. 133–152. [Google Scholar]
- Carrera, C.; Ruiz-Rodríguez, A.; Barroso, C.G. Ultrasound assisted extraction of phenolic compounds from grapes. Anal. Chim. Acta 2012, 732, 100–104. [Google Scholar] [CrossRef] [PubMed]
- Pereira, D.T.V.; Tarone, A.G.; Cazarin, C.B.B.; Barbero, G.F.; Martínez, J. Pressurized liquid extraction of bioactive compounds from grape marc. J. Food Eng. 2018, 240, 105–113. [Google Scholar] [CrossRef]
- Ju, Z.Y.; Howard, L.R. Effects of solvent and temperature on pressurized liquid extraction of anthocyanins and total phenolics from dried red grape skin. J. Agric. Food Chem. 2003, 51, 5207–5213. [Google Scholar] [CrossRef] [PubMed]
- Simpson, K.L. Chemical changes in natural food pigments. In Chemical Changes in Food During Processing. Ift Basic Symposium Series; Richardson, T., Finley, J.W., Eds.; Springer: Dordrecht, The Netherlands, 1985; pp. 409–411. [Google Scholar] [CrossRef]
- Espada-Bellido, E.; Ferreiro-González, M.; Carrera, C.; Palma, M.; Barroso, C.G.; Barbero, G.F. Optimization of the ultrasound-assisted extraction of anthocyanins and total phenolic compounds in mulberry (Morus nigra) pulp. Food Chem. 2017, 219, 23–32. [Google Scholar] [CrossRef]
- Association of Official Agricultural Chemists. Peer Verified Methods Advisory Committee. In AOAC Peer Verified Methods Program; AOAC International: Gaithersburg, MD, USA, 1998; pp. 1–35. [Google Scholar]
- Aksezer, C.S. On the sensitivity of desirability functions for multiresponse optimization. J. Ind. Manag. Optim. 2008, 4, 685–696. [Google Scholar] [CrossRef]
- Jeya, K.S.; Sathiyasree, B.; Beniz, T.E.; Ramarajan, C.; Gurushankar, K. Optimization of extraction parameters and stabilization of anthocyanin from onion peel. Crit. Rev. Food Sci. Nutr. 2022, 62, 2560–2567. [Google Scholar] [CrossRef]
- Hendrawan, Y.; Maharani, D.M.; Hawa, L.C. Effect of ultrasonic assisted extraction on Dayak onion powder extraction (Eleutherine palmifolia). In IOP Conference Series: Earth and Environmental Science; IOP Publishing Ltd.: Bristol, UK, 2020; Volume 475, p. 012015. [Google Scholar]
- Ko, E.Y.; Nile, S.H.; Jung, Y.S.; Keum, Y.S. Antioxidant and antiplatelet potential of different methanol fractions and flavonols extracted from onion (Allium cepa L.). 3 Biotech 2018, 8, 155. [Google Scholar] [CrossRef]
Publisher’s Note: MDPI stays neutral with regard to jurisdictional claims in published maps and institutional affiliations. |
© 2022 by the authors. Licensee MDPI, Basel, Switzerland. This article is an open access article distributed under the terms and conditions of the Creative Commons Attribution (CC BY) license (https://creativecommons.org/licenses/by/4.0/).