Article

An Assessment of Cataract Severity Based on Antioxidant Status and Ascorbic Acid Levels in Aqueous Humor

1
Department of Ophthalmology, Chang Gung Memorial Hospital, Linkou 333423, Taiwan
2
Department of Medicine, Chang Gung University College of Medicine, Taoyuan 33302, Taiwan
3
Department of Ophthalmology, Chang Gung Memorial Hospital, Keelung 20401, Taiwan
4
Program in Molecular Medicine, National Yang Ming Chiao Tung University, Taipei 112304, Taiwan
5
Center for Tissue Engineering, Chang Gung Memorial Hospital, Linkou 33305, Taiwan
6
Institute of Biomedical Engineering and Frontier Research Center on Fundamental and Applied Sciences of Matters, National Tsing Hua University, Hsinchu 30013, Taiwan
*
Authors to whom correspondence should be addressed.
Antioxidants 2022, 11(2), 397; https://doi.org/10.3390/antiox11020397
Submission received: 28 December 2021 / Revised: 4 February 2022 / Accepted: 14 February 2022 / Published: 16 February 2022
(This article belongs to the Special Issue Advances in Oxidative Stress and Eye Diseases)

Abstract

:
Cataract is the leading cause of blindness throughout the world. Currently, the cataract severity evaluation is based on the subjective LOCS III guideline. To ameliorate the evaluation system and develop an objective and quantitative analysis, we investigated the relationships among aqueous humor total antioxidant capacity (AqTAC), ascorbic acid (AqAA) concentration, and cataract severity. In this study, we enrolled 130 cataract patients who underwent phacoemulsification between April 2019 and March 2020. The AqTAC and AqAA were measured by our own developed TAC assay and commercially available kit. Cataract severity was recorded by nuclear opalescence (NO) and cortical cataract (CC) degree according to LOCS III. Cumulative dissipated energy (CDE) during phacoemulsification was recorded to verify the severity of the cataract. As a result, we found a moderate correlation between AqTAC and CDE (p < 0.001). In addition, we found AqTAC independently associated with the CDE when analyzed by multivariate linear regression (p < 0.001). AqTAC also negatively correlated to cataract severity when measured by NO and CC (p = 0.012 in NO grade 3 vs. grade 1; p = 0.012 in CC grade 2 vs. grade 1; p < 0.001 in CC grade 3 vs. grade 1). We further found AqAA provided 71.9 ± 13.5% of AqTAC, and showed a high correlation (rho = 0.79, p < 0.001). In conclusion, we found a significant correlation between AqTAC/AqAA and cataract severity measured by CDE. The correlation was superior to the correlation between LOCS III and CDE. Aqueous humor TAC owns the potential to assess cataracts in an objective and quantitative way.

1. Introduction

Cataract is the leading cause of blindness and afflicts millions of people annually, with a worldwide prevalence rate of 17.2% [1]. Surgical intervention remains the primary means of treatment to restore vision; however, despite the presence of novel techniques and advanced instruments for phacoemulsification treatment, complications exist [2]. Therefore, a comprehensive preoperative evaluation is important to determine treatment choices. In addition to the subjective symptom inquiry, an objective evaluation of cataract severity, which may directly affect surgical outcomes, is also necessary to provide a suitably complete investigation.
The Lens Opacities Classification System III (LOCS III) based on slit-lamp and retro-illumination photography analysis is one of the most well-known cataract severity of grading systems [3]. However, accumulative state-of-the-art evidence has emphasized the importance of ultrasonic energy expenditure during the phacoemulsification process [4,5,6,7,8]. Ultrasonic energy expenditure, which is usually recorded as cumulative dissipated energy (CDE) during the phacoemulsification process, may be used as a measure of cataract severity, and it has several advantages including the following: (1) it directly reflects lens density [9]; (2) it is an objective and quantitative value, compared with the LOCS III cataract grade classification system; (3) it is directly associated with surgical applicability and outcomes [4,5,6]. The only drawback of using CDE to measure cataract severity is that it cannot be tested before surgery. Providing a preoperative parameter that is highly correlated to CDE is highly desirable, as it may be used to guide treatment.
Oxidative stress, which is believed to be implicated in the overall process leading to the formation of cataracts, could be a potential indicator of cataract severity [10]. As the ocular lens is continually exposed to sunlight and ambient stimuli, the production of toxic free radicals is inevitable. As a result, rather than measuring oxidative status, research has focused on total antioxidant capacity (TAC) as an indicator of the capacity to confront the pathogenesis of ocular diseases [11,12,13]. Previous studies have demonstrated the protective effect of antioxidants on cataractogenesis [14,15,16]. However, most of these studies were epidemiologic or serum-based studies, and some of the results are inconsistent. The inconsistency of the results might be due to the fact that neither the epidemiologic factors nor serum factors contact with the crystalline lens directly, and therefore, they may easily be affected by methodology variations. In this regard, aqueous humor, which is in direct contact with the lens and is its primary nutritional source, may offer a better resource for exploring the correlation between aqueous humor antioxidant status and cataract formation.
Among the elements of the antioxidant defense system in aqueous humor, ascorbic acid (AA) is a small-molecule antioxidant. AA is actively transported from serum to the aqueous humor, where it is 20–40 times more highly concentrated [17,18]. Given this, AA was believed to play a particularly noteworthy antioxidative role in aqueous humor. We hypothesized that the antioxidants in aqueous humor, especially AA, could be measured to diagnose cataract presence and severity and may also be leveraged for preventative and treatment strategies. Most of the aqueous humor-based studies to date have been hampered by insufficient sample sizes and invasive sampling techniques. Therefore, the aim of this study was to overcome these limitations and examine the associations between aqueous humor antioxidant status, AA level, and cataract severity. The primary aim of this study was to identify the correlation between TAC, AA, and CDE, and additionally to investigate the correlation between TAC, AA, and the most important cataract surgical outcomes such as best-corrected visual acuity (BCVA) improvement and intraocular pressure (IOP) change. The secondary aim was to evaluate the proportion of AA’s contribution to TAC in cataract patients and provide insight into the pathophysiological mechanisms of cataract formation. Our hypothesis is illustrated in Figure 1.

2. Materials and Methods

2.1. Study Population

All patients were recruited from the Department of Ophthalmology at Chang Gung Memorial Hospital, Linkou, Taiwan, between 1 April 2019 and 31 March 2020. The study complied strictly with the tenets of the Declaration of Helsinki and received approval from the institutional review board of Chang Gung Medical Foundation in 2019 (IRB number: 201900017B0). This was a retrospective case–control study registered in ClinicalTrials.gov (Identifiers: NCT04101591; Unique Protocol ID: 201900017B0), and written informed consents were obtained from all enrolled participants.
For sample size estimation, a pilot study with 44 subjects was conducted, and the result showed a Pearson’s correlation coefficient of 0.3 between aqueous TAC and ultrasonic energy expenditure during the phacoemulsification process. Therefore, a sample size of at least 84 samples was required in this study, to reach the statistical power of 0.8 with an α value of 0.05. As the experience and annual case volume of the surgeon have been significantly associated with cataract surgical outcomes, all patients recruited in this study received cataract surgery, preoperative evaluations, and follow-up examinations by the same experienced ophthalmologist in order to reduce technical bias [19]. The subject recruitment flow diagram for this study is presented in Figure S1. In brief, among the 240 cataract patients who received phacoemulsification and intraocular lens implantation (PHACO IOL) by one ophthalmic surgeon (Chen, H.C.), 130 were included in this study, and 103 had their IOP or BCVA checked one month later.

2.2. Sample Collection and Data Acquisition

Aqueous humor samples were collected from each patient at the beginning of PHACO IOL surgery. In brief, a 27-gauge needle connected to an insulin syringe was carefully inserted into the anterior chamber at the temporal limbus, and 0.1 mL of aqueous humor was aspirated. The undiluted aqueous samples were then stored immediately in a −80 °C freezer until analysis.
Patient demographics were recorded by the medical chart. Initial cataract severity assessment was graded according to the LOCS III cataract grade classification system as part of routine preoperative evaluations [3]. The degree of nuclear opalescence (NO) and cortical cataract (CC) were evaluated and recorded using a slit lamp (BQ 900, Haag-Streit, Bern, Switzerland). The final cataract severity measurement was calculated using CDE (mJ) as determined by the Infiniti Vision System (Alcon Laboratories, Inc., Fort Worth, TX, USA) following the phacoemulsification process. To evaluate surgical efficacy, the BCVA of each patient was measured using the Snellen chart, and the results were converted to the logarithm of the minimum angle of resolution (LogMAR) for analysis. For BCVA values worse than 0.01 and recorded in a semiquantitative scale, LogMAR of 1.85 was recorded for counting fingers vision, LogMAR of 2.3 was recorded for hand movement vision, LogMAR of 2.8 was recorded for light perception, and LogMAR of 3.0 was recorded for no light perception [19,20]. To evaluate surgical safety, the IOP was measured using a pneumatonometer (Canon, TX-10, Canon Corporation, Tokyo, Japan). Both BCVA and IOP were examined preoperatively and at least 1 month after cataract surgery. We then calculated the differences between preoperative and follow-up BCVA and IOP values to determine surgical efficacy and safety.

2.3. Aqueous Humor Antioxidant Capacity

We have developed a TAC assay based on copper (II) redox reactions [21,22]. The bicinchoninic acid (BCA) and CuSO4 were purchased from ThermoFisher Scientific (contained in the PierceTM BCA Protein Assay Kit, Catalog number: 23225, Waltham, MA, USA). The AA, which is a widely used antioxidant, was purchased from Fisher Scientific (B581-05, JT Baker, Phillipsburg, NJ, USA) to establish the standard curve. We established the standard curve using serial diluted 0.02–2.5 mM AA solutions. Briefly, 10 μL of the undiluted aqueous sample was applied into wells of a 96-well microplate, and 200 μL of 0.08% CuSO4 solution diluted by BCA was then added and incubated for 20 min away from light. The Cu2+ could be reduced to Cu1+ by various antioxidant compounds, and Cu1+ further formed a violet chelate complex via the interaction with BCA. The colorimetric results were measured at 570 nm by an absorbance microplate reader (Sunrise™ Tecan, Männedorf, Switzerland). The accuracy and stability of the TAC assay were verified in our previous study. The calculated limit of detection (LOD) of the TAC assay was 0.016 mM, and the limit of quantitation (LOQ) of the TAC assay was 0.053 mM. In addition, the intraassay and interassay coefficients of variability (CV) were 4.25% (n = 8) and 4.13% (n = 19), respectively. The TAC assay was stable under a wide range of pH levels (pH 4–10) [11]. We also used the colorimetric OxiSelect™ Ascorbic Acid Assay Kit (FRASC, Cell Biolabs Inc., San Diego, CA, USA) to measure aqueous humor AA concentration [23].

2.4. Statistical Analysis

Descriptive statistics were used for patient characterizations, which were presented as means with standard deviations or proportions as appropriate. The normality of distribution was tested for all continuous data using the Kolmogorov–Smirnov test. The proportional correlation of aqueous humor AA in TAC was presented as a pie chart and analyzed using the Spearman correlation analysis. Univariate and multivariate ordinal logistic regression analysis was used to calculate the effects of TAC on cataract severity parameters—NO and CC. The correlation between aqueous humor TAC with CDE, surgical efficacy (improvement in BCVA), and surgical safety (change in IOP) were first analyzed by Spearman’s correlation coefficient and further examined by univariate and multivariate linear regression analyses. Parameters including patient age, sampling eye site, gender, body mass index (BMI), ocular diseases, and systemic diseases were considered as confounding factors and adjusted in all the multivariate regression models. The sample size requirement and statistical power analysis of this study were calculated using the statistical program, G*Power 3.1 [24]. All other statistical analyses were conducted using Stata software version 14 (StataCorp LP, College Station, TX, USA). A p value of less than 0.05 was considered statistically significant.

3. Results

3.1. Study Population

A total of 130 cataract subjects were enrolled during the study period. All patients underwent examinations and sampling procedures without any adverse events. The demographics and characteristics of the 130 subjects are listed in Table 1. The mean age was 67.6 ± 8.9 years; the male patients slightly outnumbered female patients (51.5% vs. 48.5%); the mean BMI was 24.95 ± 3.49 Kg/m2. Additionally, 116 (89.2%) of them were diagnosed with age-related cataracts (ARCs) while the other 14 (10.8%) were diagnosed with juvenile cataracts. Age-related cataract was defined as patients who developed cataract over 55 years old, and juvenile cataract was defined as patients who developed cataract younger than 55 years old. Traumatic cataract patients were excluded, and no patient with pseudoexfoliation syndrome was enrolled.

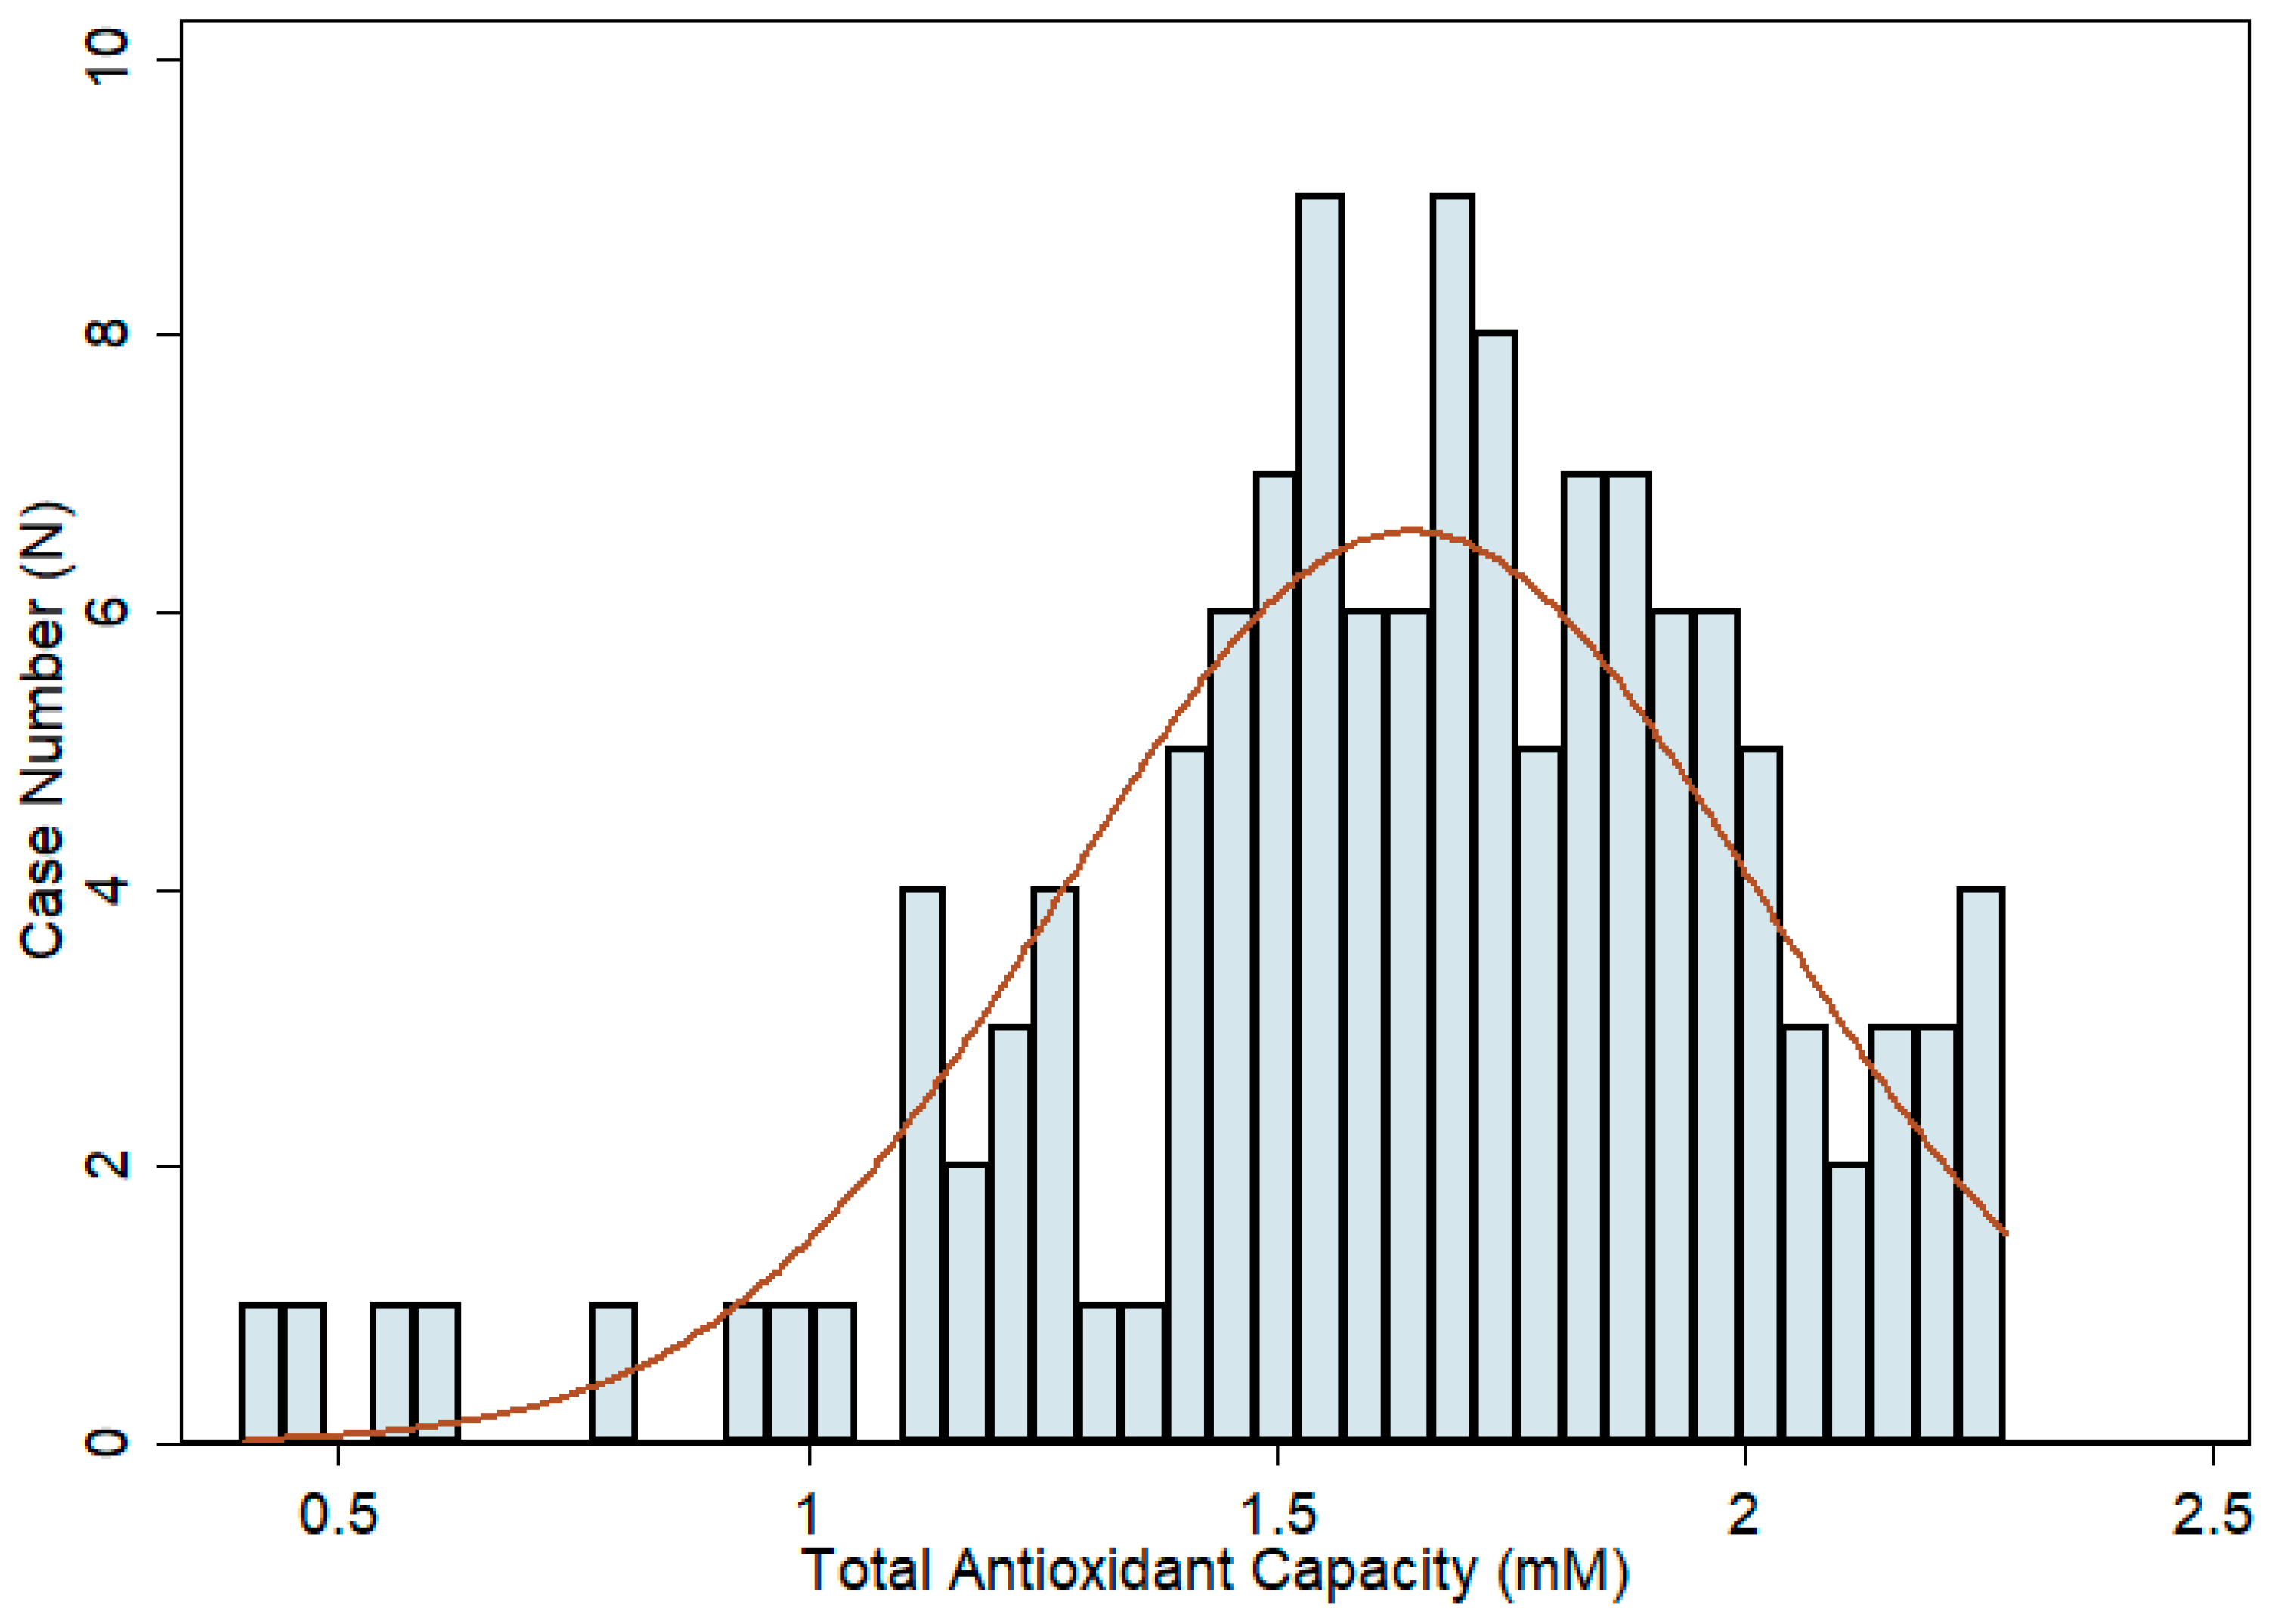
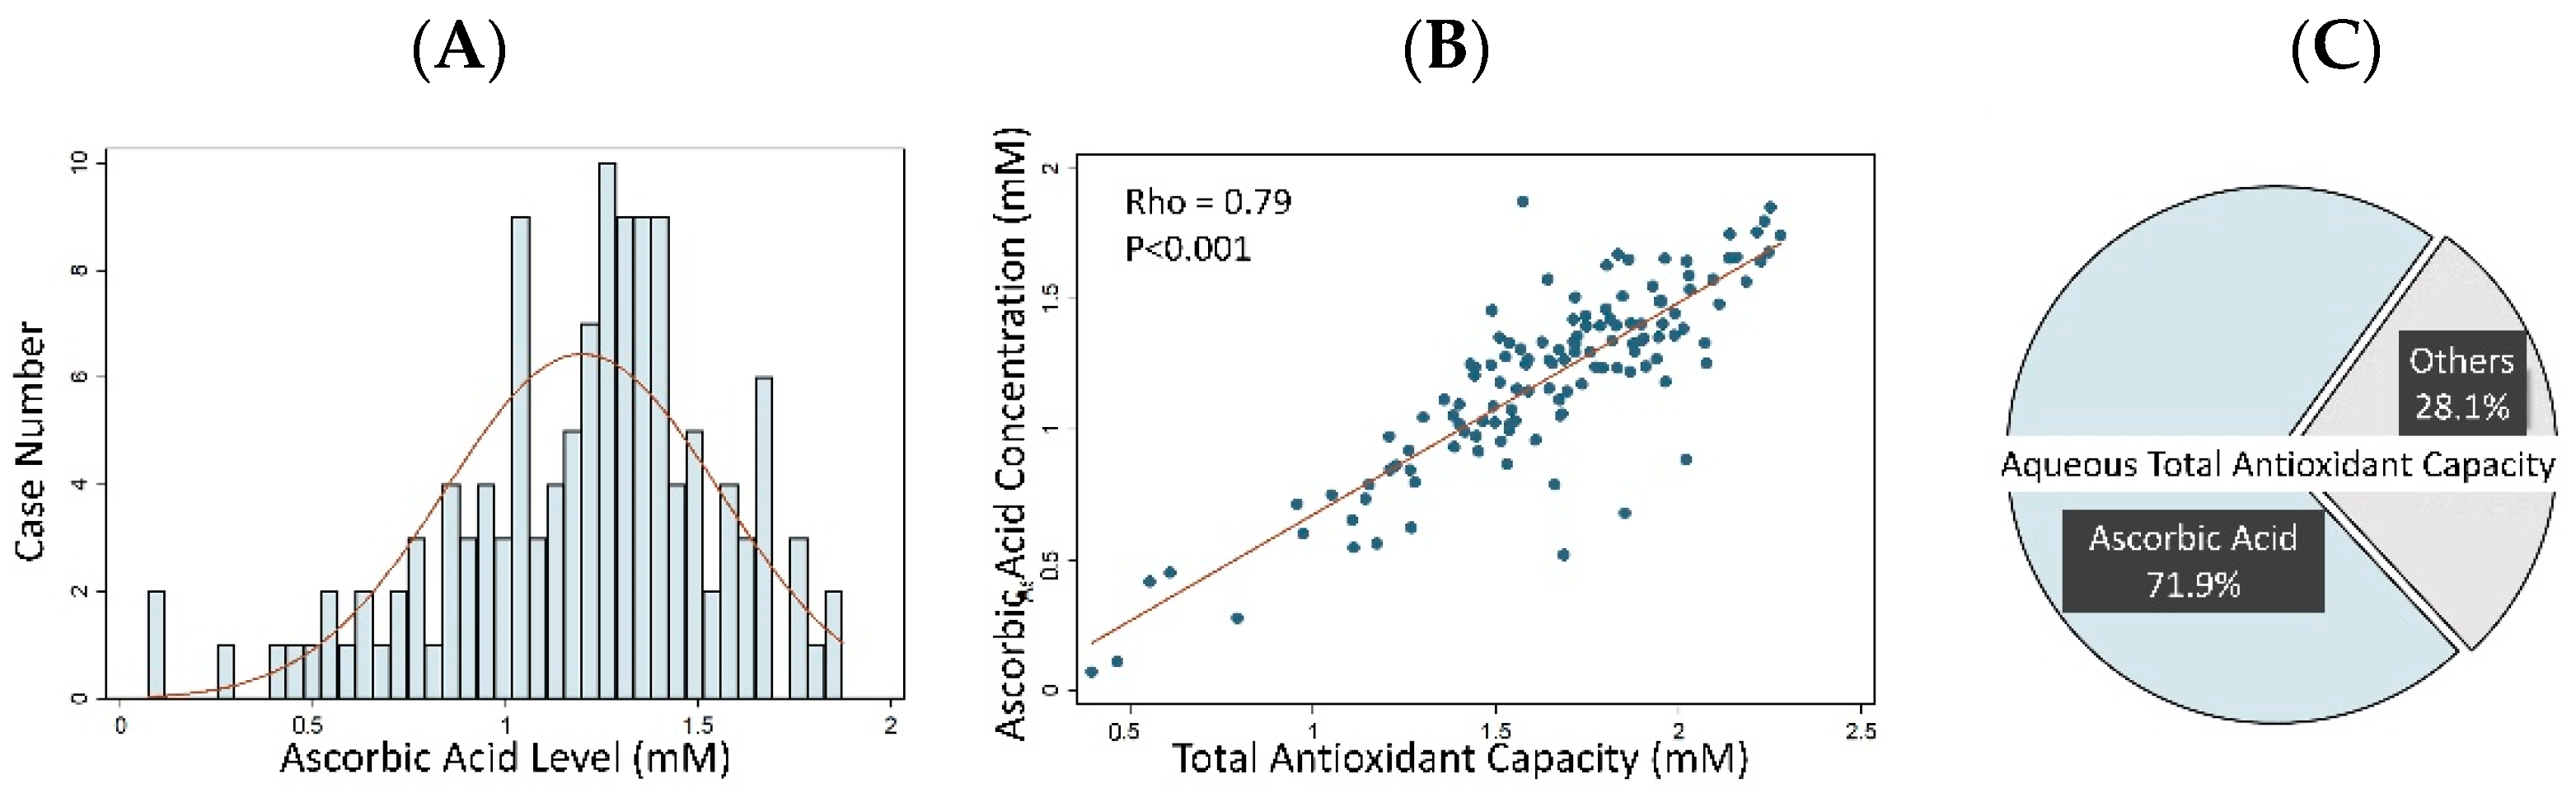
3.2. Aqueous Humor Antioxidant Capacity and Ascorbic Acid Concentration

Aqueous humor TAC was measured in all 130 cataract patients. All the samples showed measurable TAC results by using the TAC assay. The measured TAC values were normally distributed with a mean of 1.643 ± 0.370 mM AA equivalent antioxidant capacity (Figure 2). The concentration of aqueous humor AA was also tested in 127 patients (3 samples were not tested because of insufficient sample volumes), and the results showed non-normally distributed data, with a mean of 1.198 ± 0.355 mM (Figure 3A). There was a high positive correlation between aqueous humor TAC and AA concentrations, with a Spearman correlation coefficient value of 0.79 (p value < 0.001) (Figure 3B), and AA was found to be the chief antioxidant component of aqueous humor (71.9 ± 13.5%) (Figure 3C).

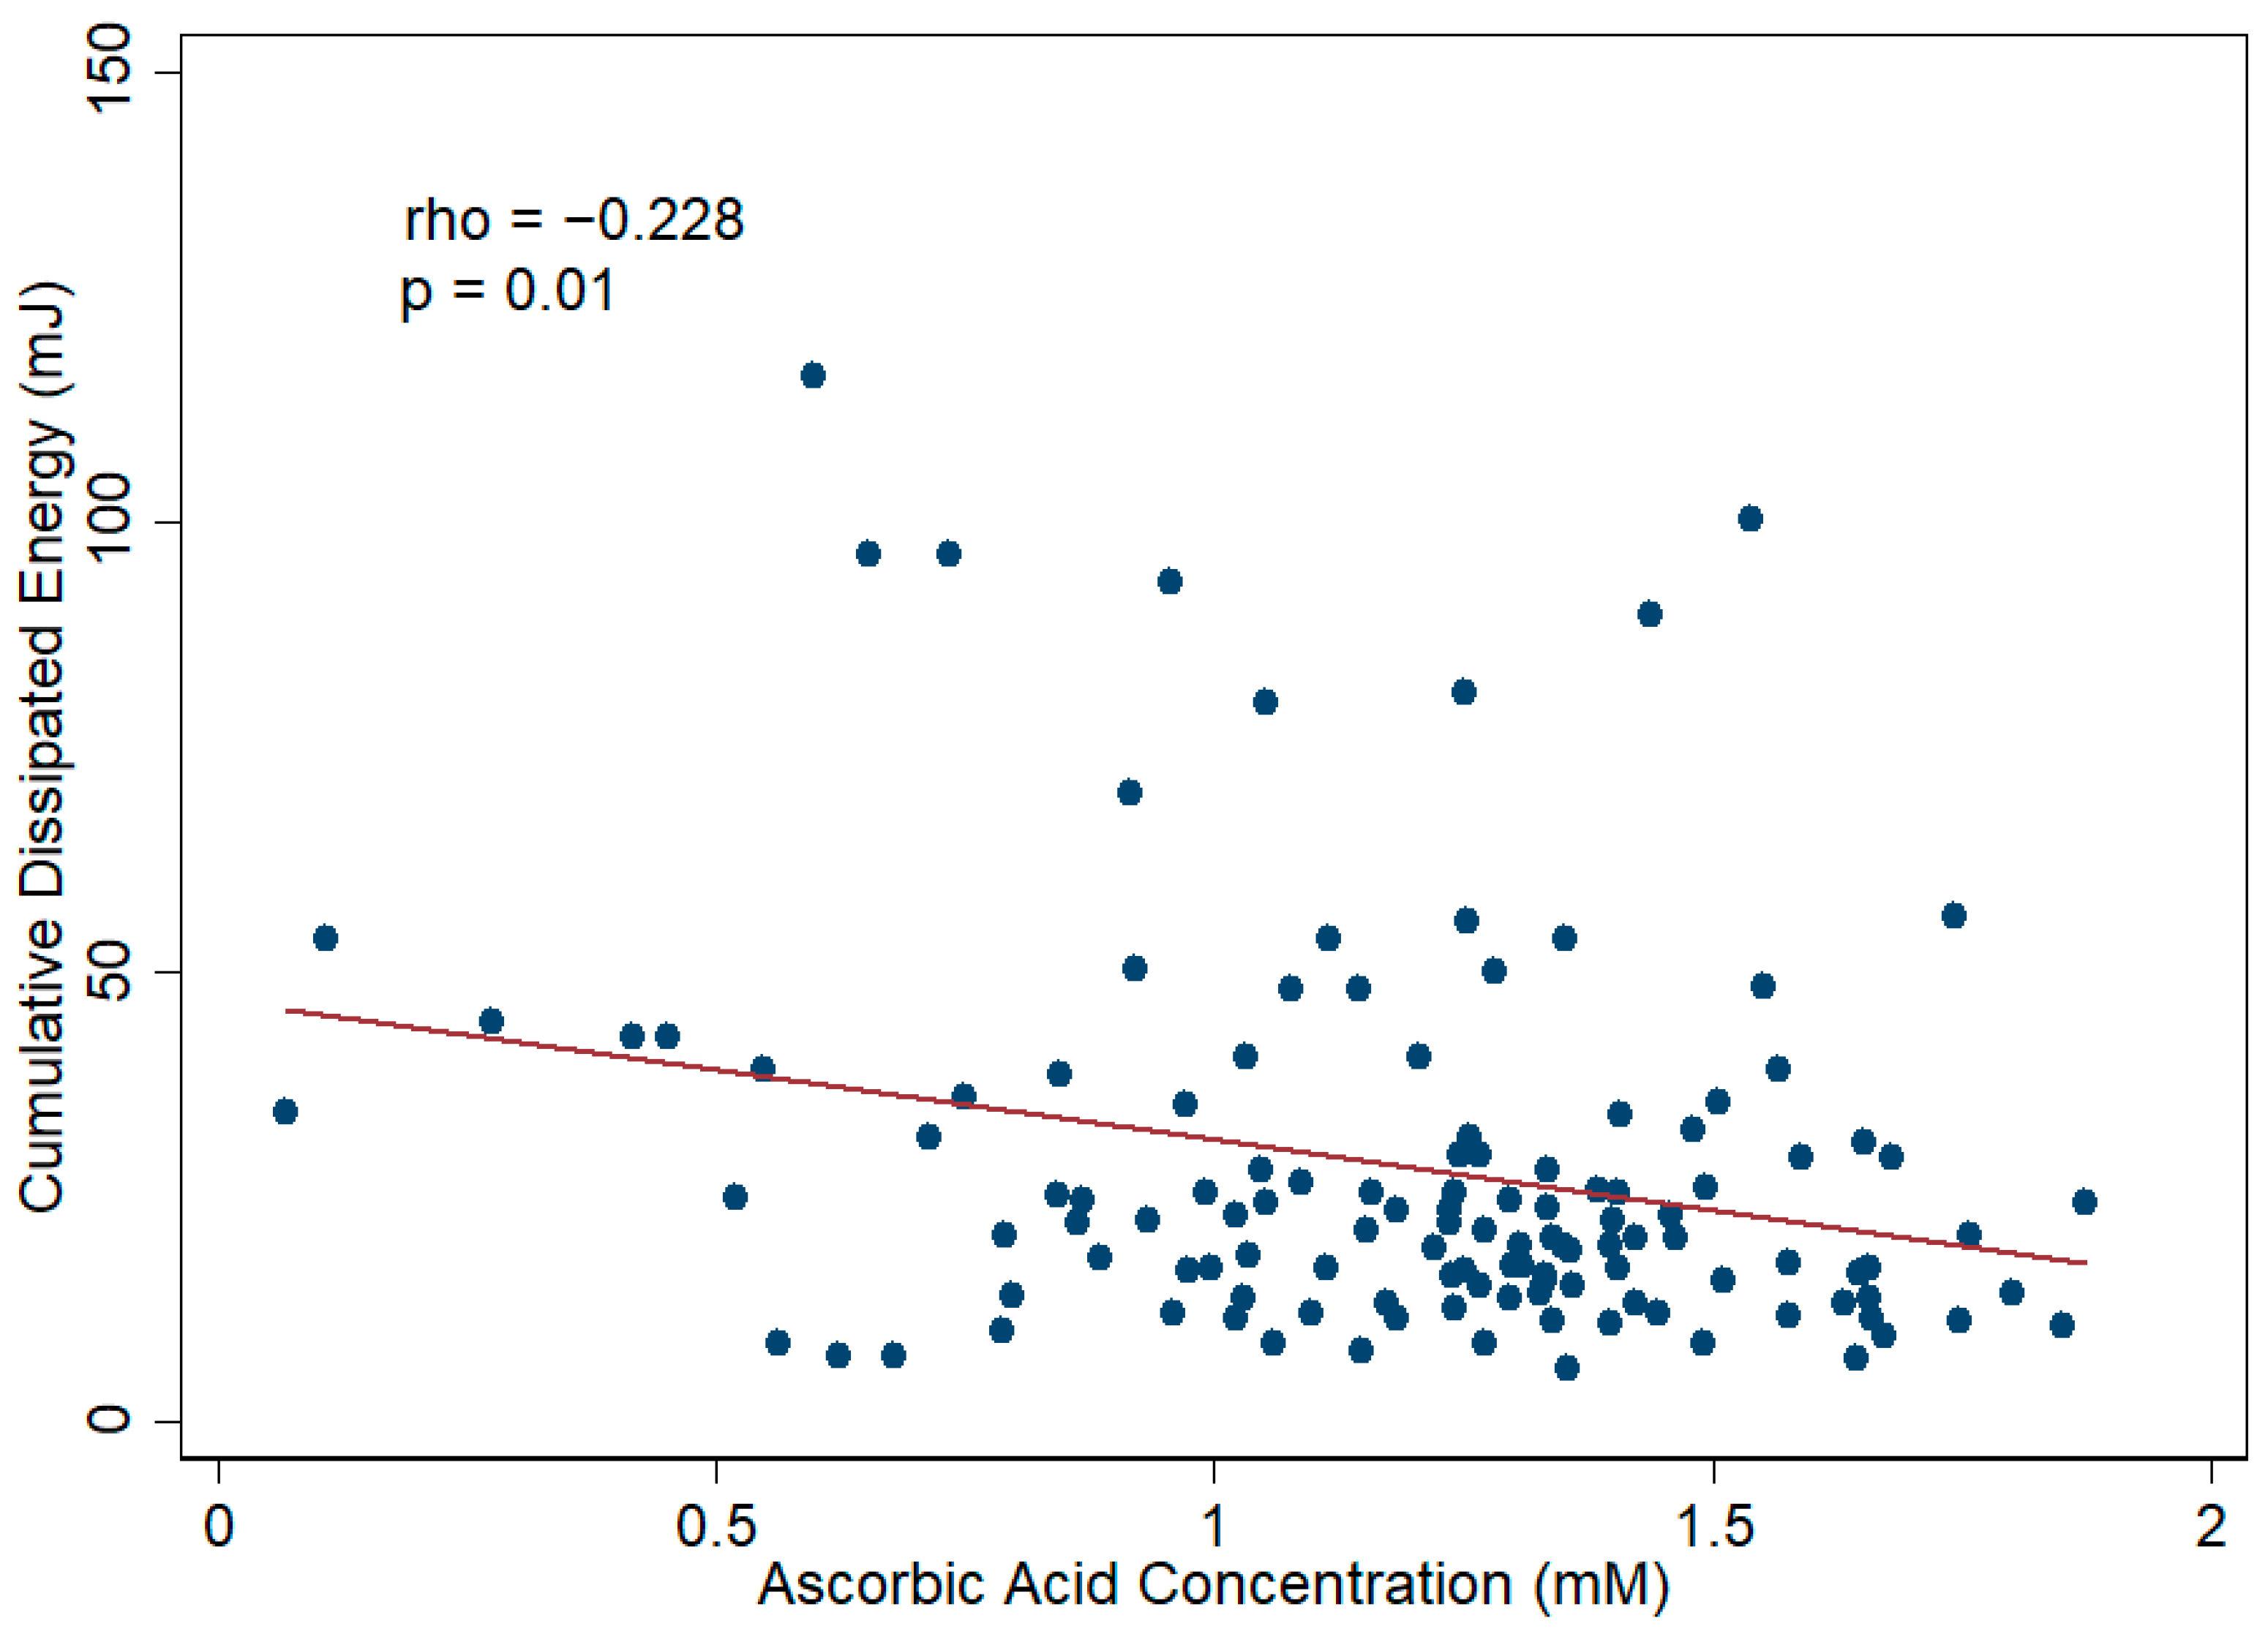
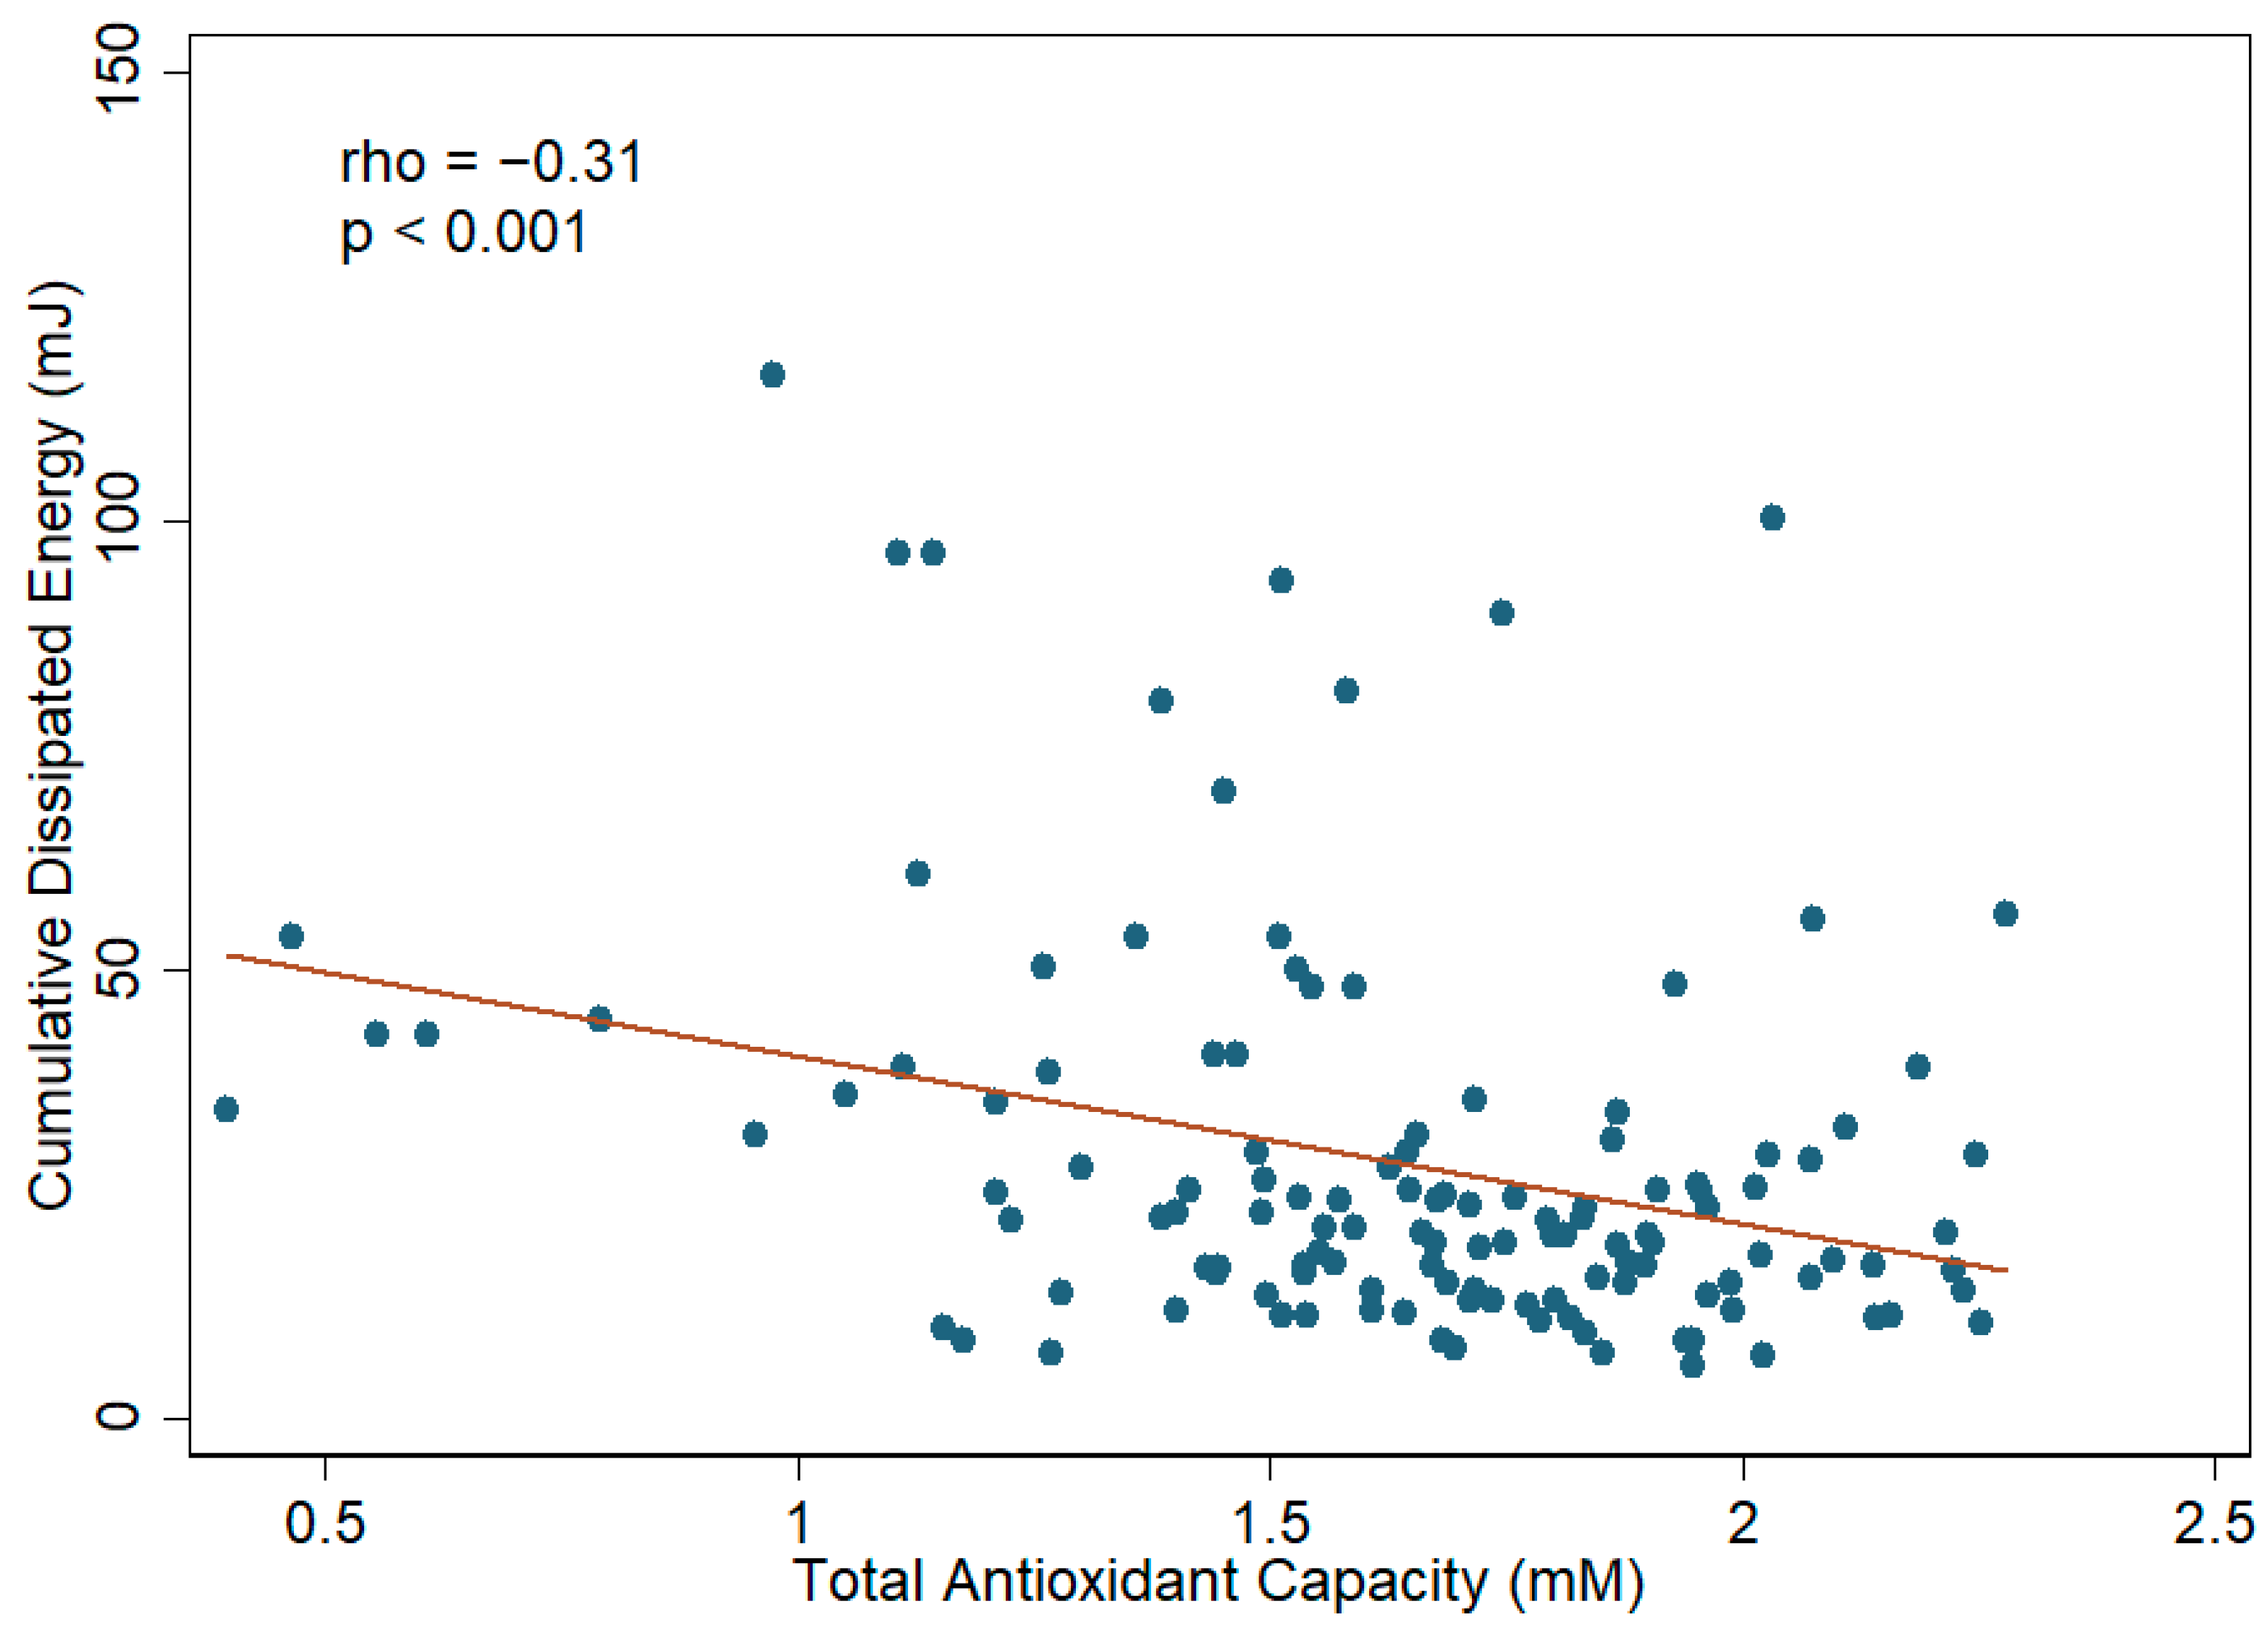
3.3. Aqueous Humor TAC, Ascorbic Acid, and Cataract Severity

Spearman’s correlation analysis revealed a statistically significant but moderate degree of negative correlation (rho = −0.31) between aqueous humor TAC and CDE (p value < 0.001). A scatter plot of these data is provided in Figure 4. The ascorbic acid level in aqueous humor also showed a negative correlation (rho = −0.228) with CDE (p value = 0.01). A scatter plot of these data is provided in Figure 5. In the subsequent linear regression analyses, the aqueous humor TAC and ascorbic acid level also revealed a statistically significant association with CDE in both univariate and multivariate models. In the multivariate linear regression analysis, the β of TAC was −18.47 with an SE of 4.89 (p value < 0.001), and the β of ascorbic acid was −16.27 with an SE of 5.30 (p value = 0.003), after adjusting all of the parameters mentioned in Table 1 including the sampling eye site, age, gender, BMI, disease diagnosis, hypertension, diabetes mellitus, and other systemic diseases. These results indicate a negative correlation between aqueous humor TAC/ascorbic acid level and CDE. The details of the linear regression models are illustrated in Table 2 and Table S1.
The correlation between TAC/ascorbic acid and CDE is superior to that of the LOCS III cataract severity, for both NO and CC, which show no significant association (p value > 0.05) with CDE in both the univariate and multivariate linear regression analyses (Table S2). Moreover, the associations between aqueous humor TAC and LOCS III cataract severity for NO and CC were analyzed by univariate and further multivariate ordinal logistic regression analyses. After adjusting all the confounding factors, the aqueous humor TAC was found to be negatively correlated to cataract severity. For NO grade 2 vs. grade 1, the adjusted odds ratio (OR) of aqueous humor TAC was 0.348, with confidence intervals (CI) between 0.028 and 4.301 (p value = 0.411); for NO grade 3 vs. grade 1, the adjusted OR was 0.078, with CI between 0.011 and 0.571 (p value = 0.012); for CC grade 2 vs. grade 1, the adjusted OR was 0.001, with CI between 0 and 0.355 (p value = 0.02); for CC grade 3 vs. grade 1, the adjusted OR was less than 0.001, with CI between 0 and 0.051 (p value < 0.001). More detailed data are provided in Table 3. The detailed bar chart of the aqueous humor TAC and AA in different LOCS III cataract severity is also illustrated in Figure S2.

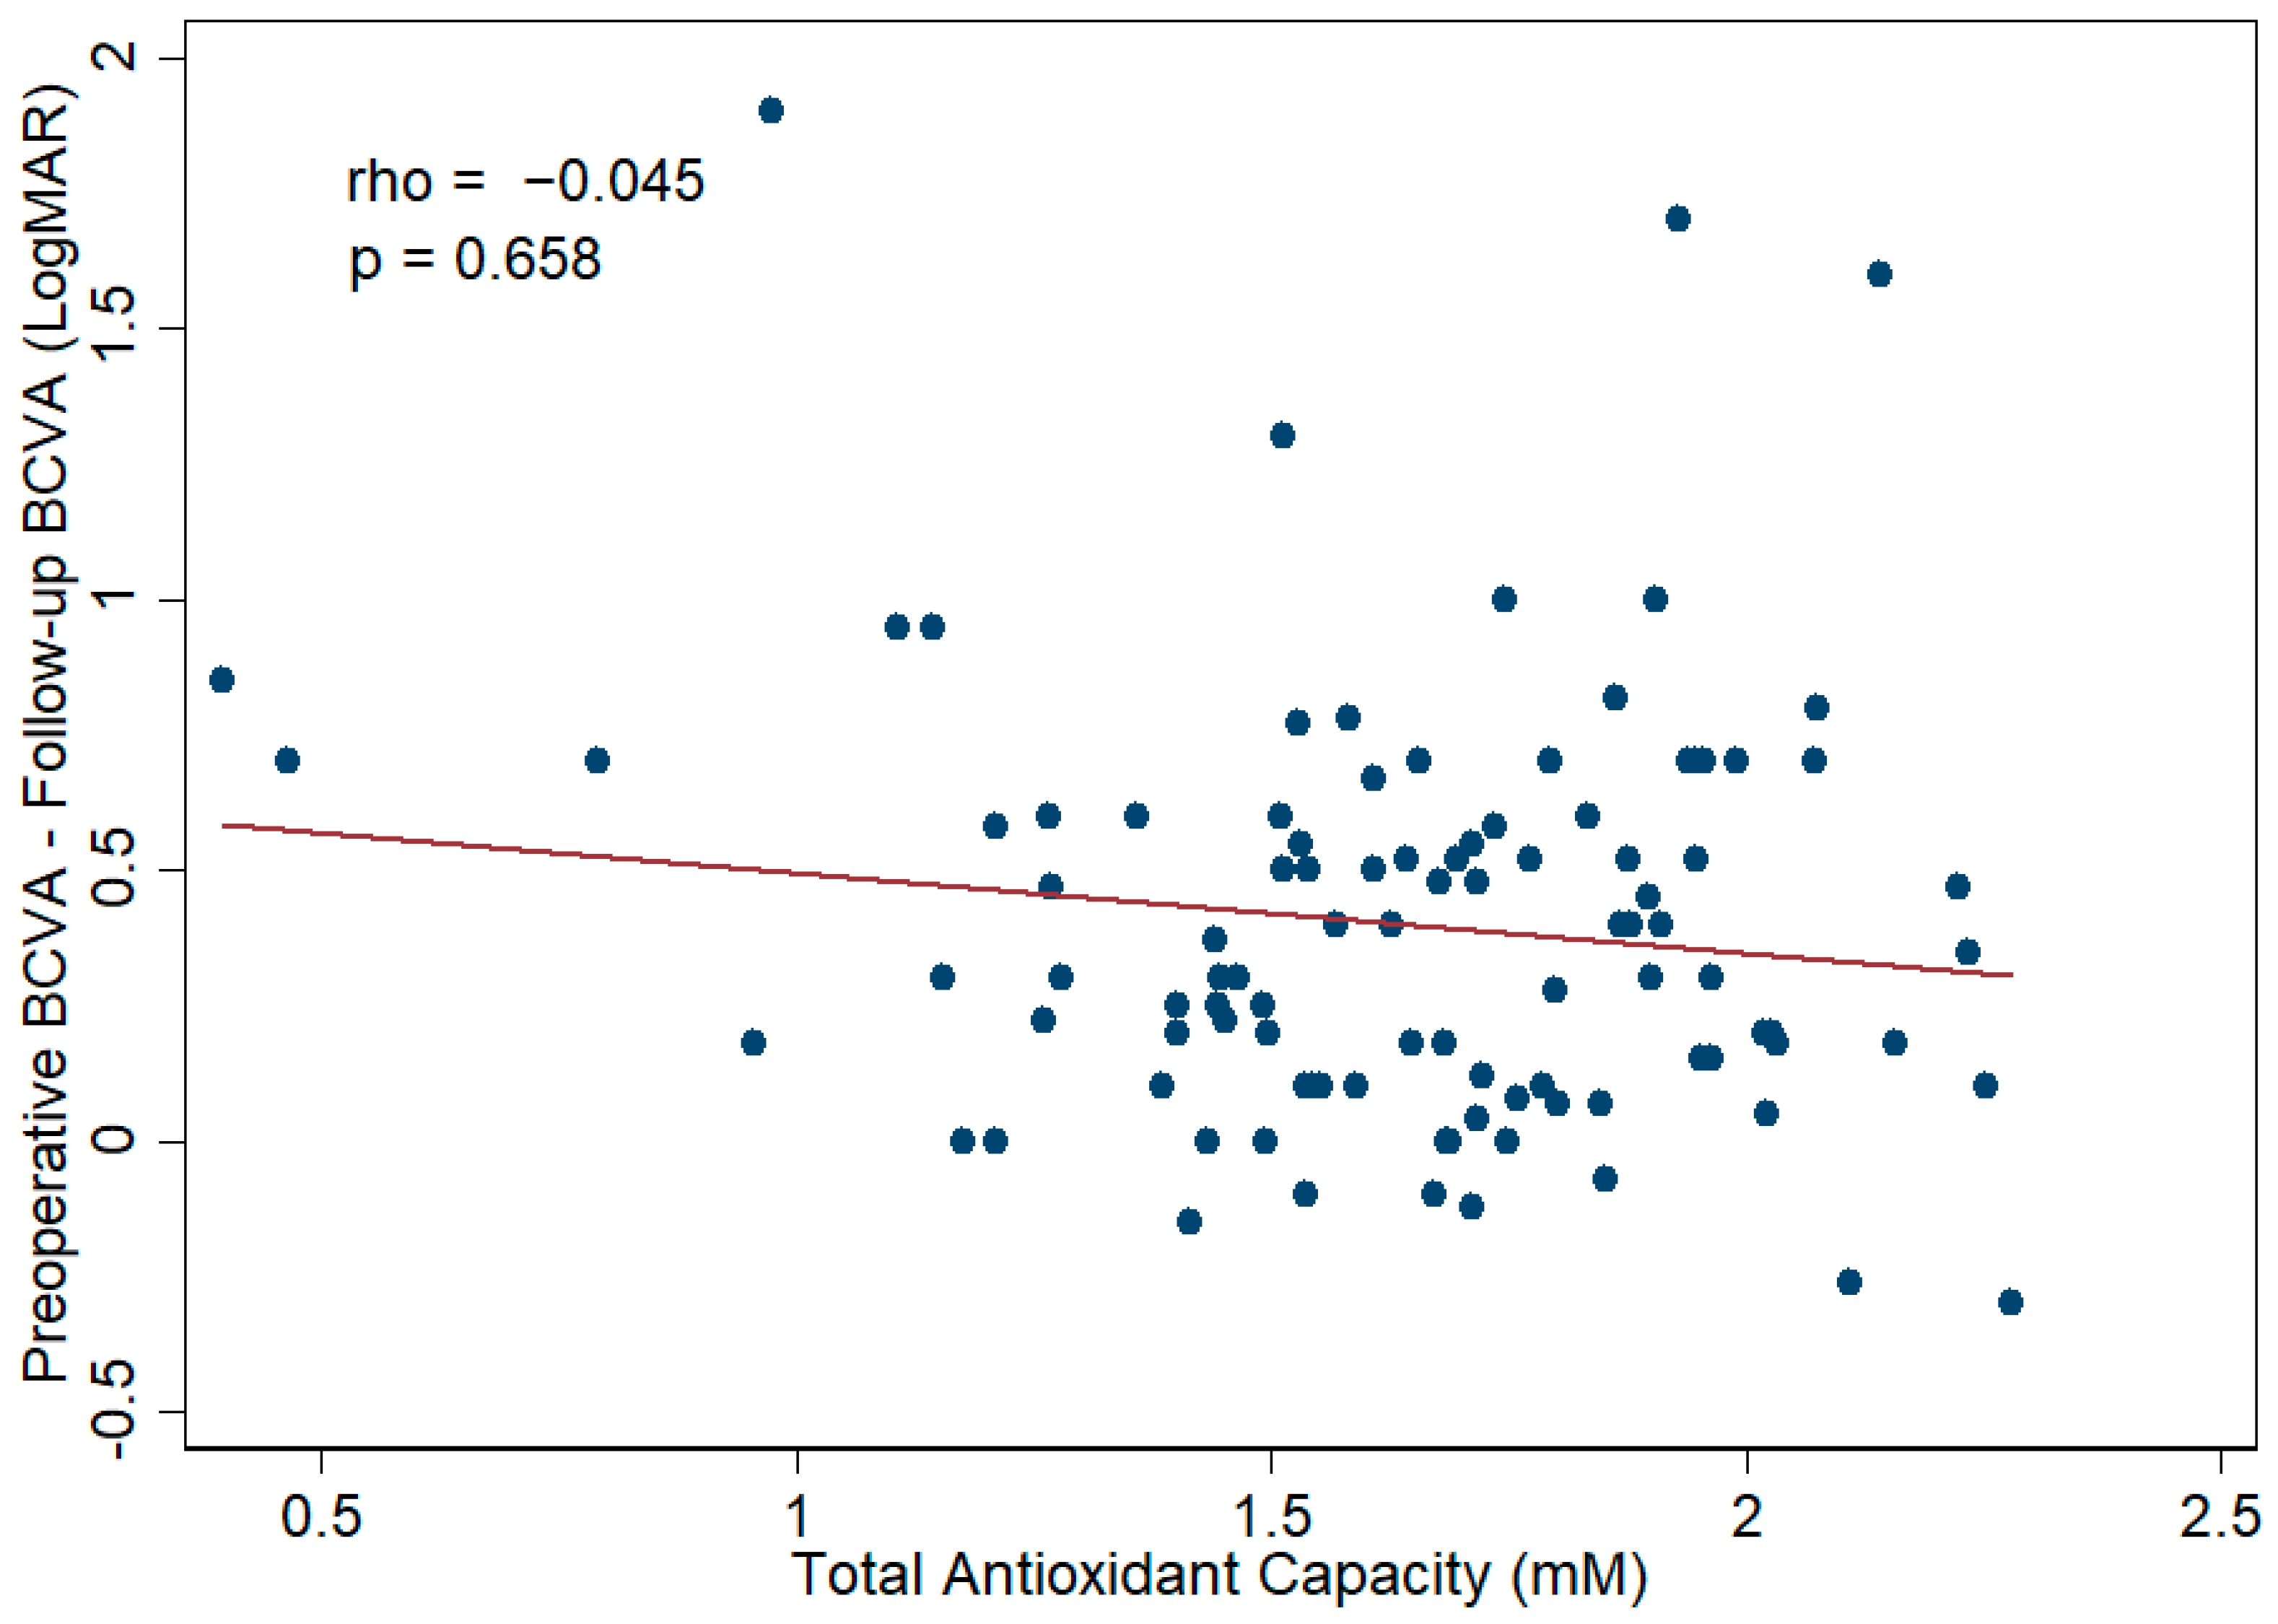
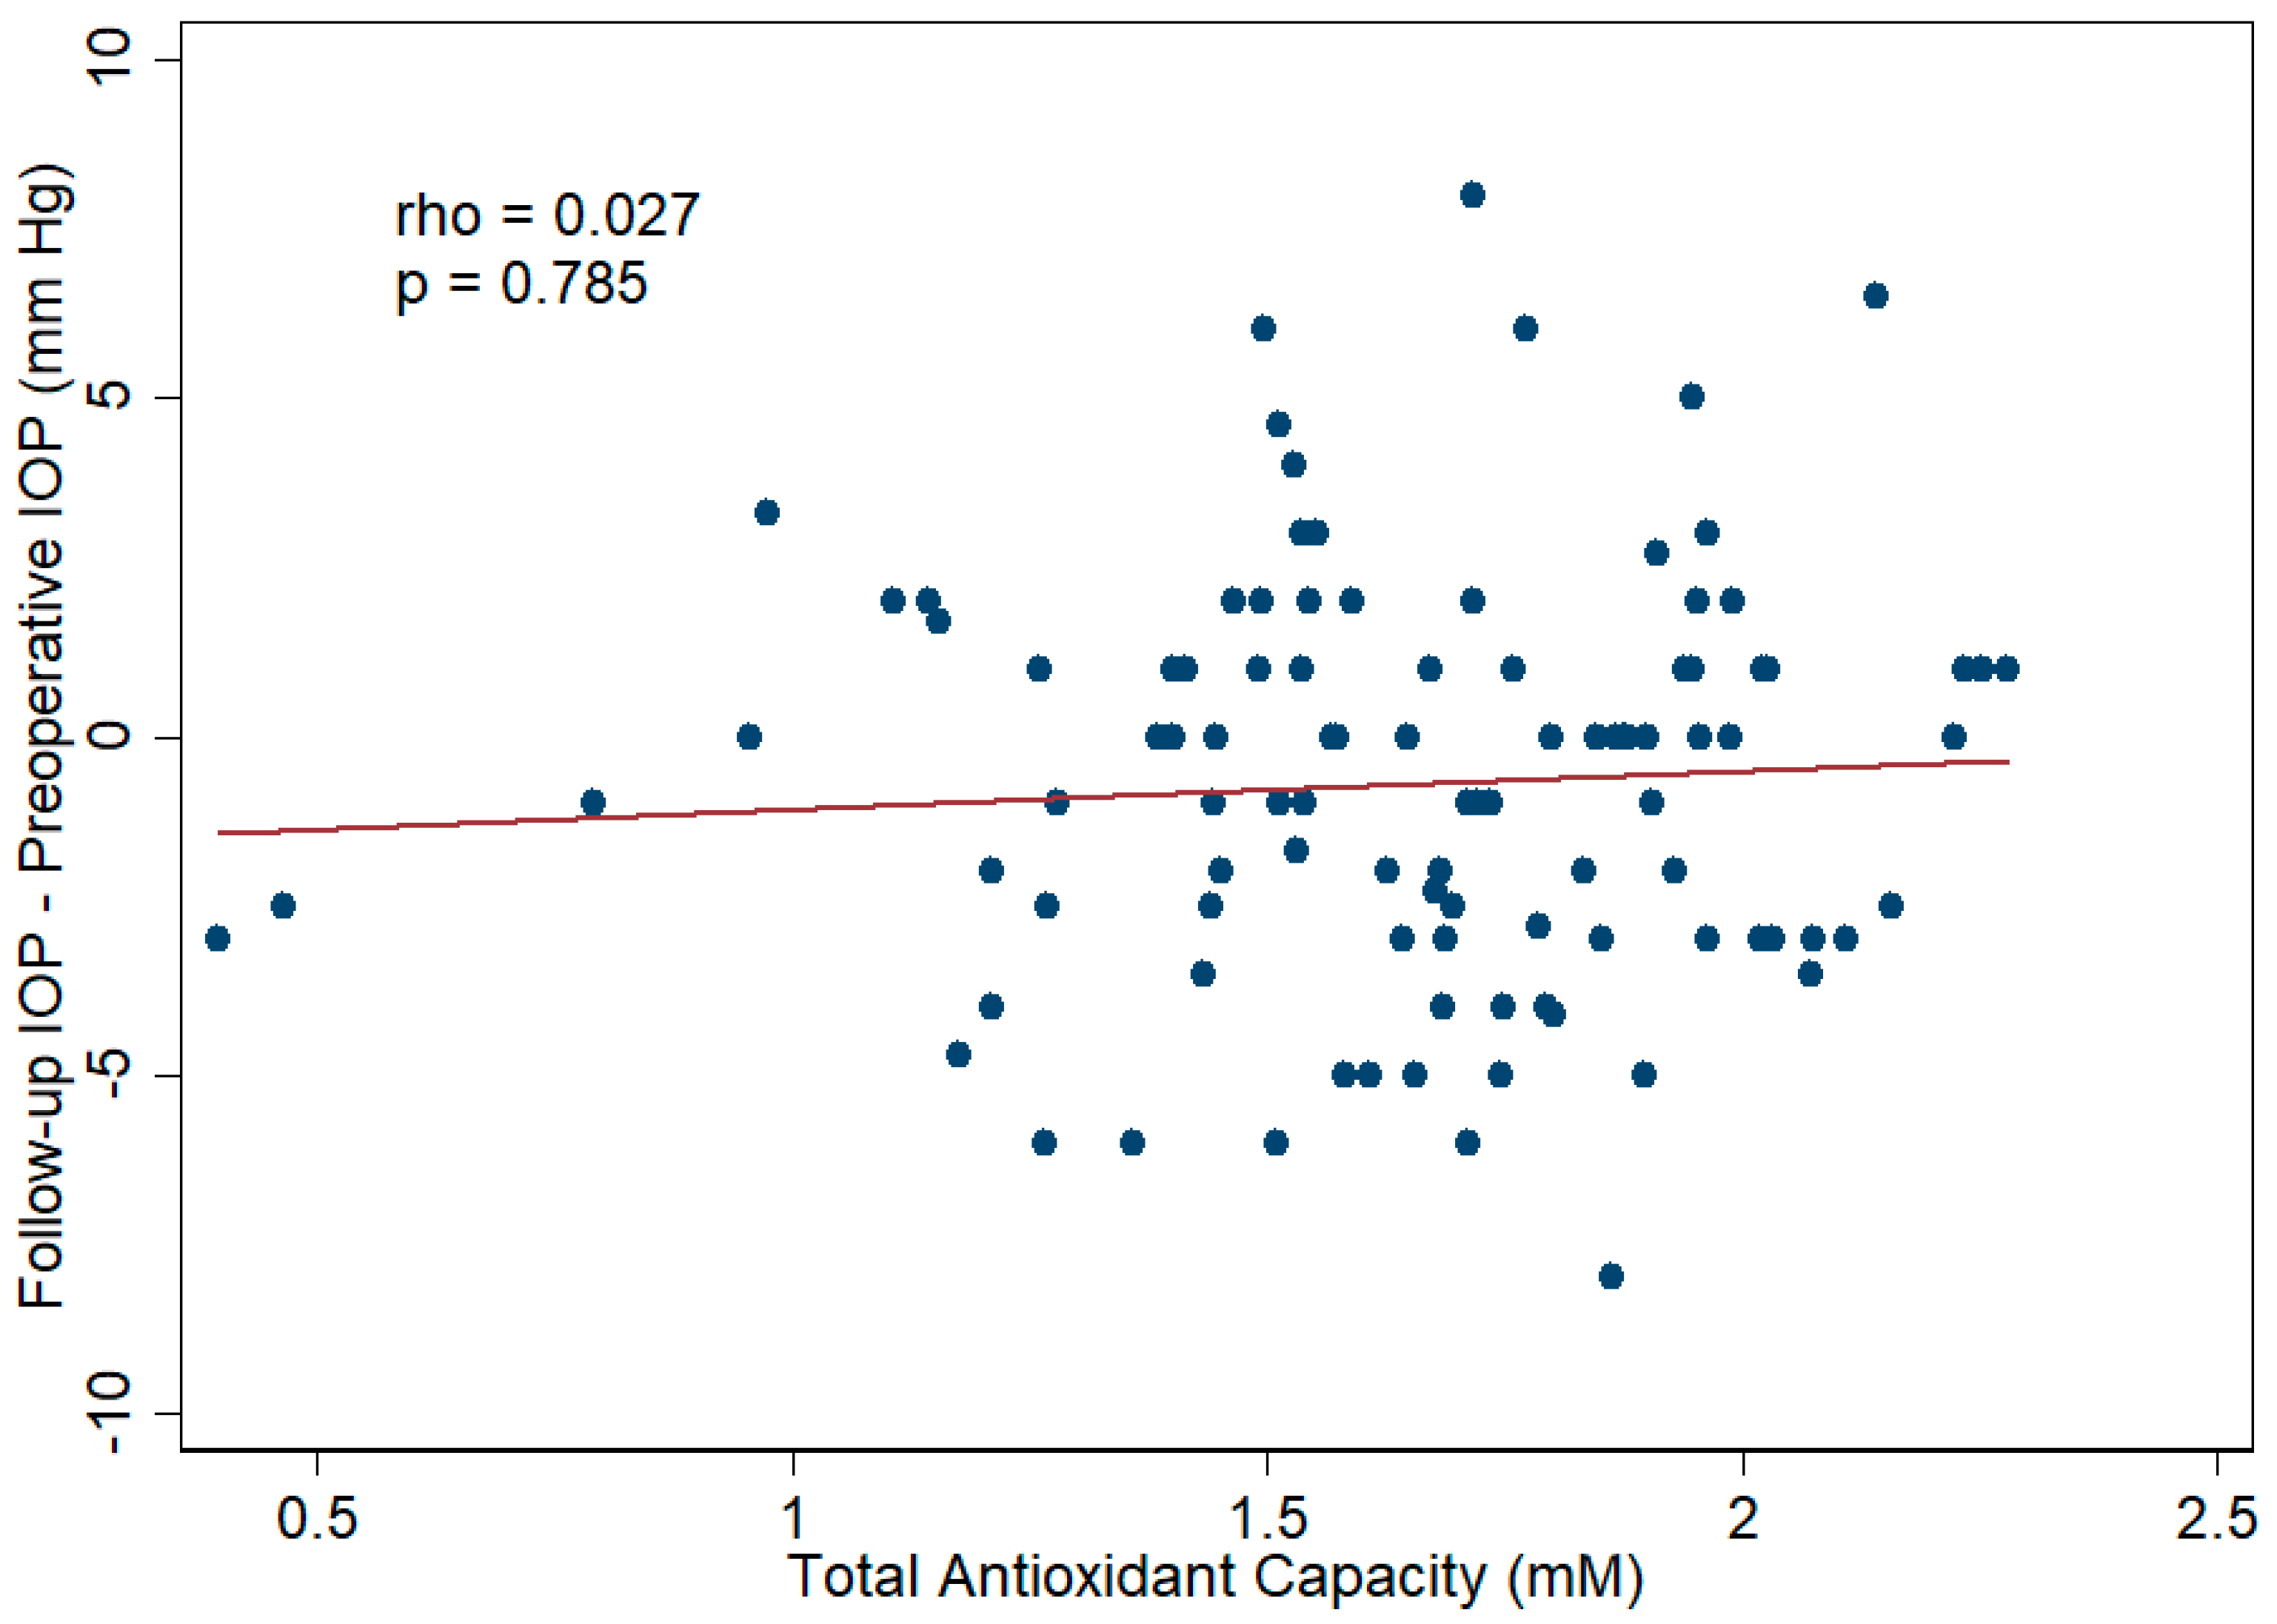
3.4. Aqueous Humor TAC and Cataract Surgical Outcomes

To evaluate the correlation between aqueous humor TAC and surgical efficacy, Spearman’s correlation analysis and linear regression analysis were applied; the results reveal no statistically significant association between aqueous humor TAC and BCVA improvement, with a p value of 0.658 according to Spearman’s correlation analysis (Figure 6), 0.188 according to the univariate linear regression analysis, and 0.335 according to the multivariate linear regression analysis. The detailed data are displayed in Table S3. Regarding the correlation between aqueous humor TAC and surgical safety, aqueous humor TAC was not significantly associated with the change in IOP according to Spearman’s correlation analysis (p value = 0.785, Figure 7), univariate linear regression analysis (p value = 0.562), and multivariate linear regression analysis (p value = 0.327). The detailed data are displayed in Table S4.

4. Discussion

This is a preliminary study to examine the proportional contribution of AA to aqueous humor TAC in cataract patients. Using the TAC assay we developed, we further investigated the correlation between aqueous humor TAC and cataract severity, surgical efficacy, and surgical safety. Most importantly, we found that aqueous humor TAC level provided a significant correlation to cataract severity, which is presented in the relation between aqueous humor TAC/AA and CDE/LOCS III cataract severity of NO and CC. Although previous studies have reported that antioxidants are associated with reduced risk of cataract development, most of them were epidemiological studies, nutrition studies, or serum-based studies, none of which involves direct contact with the lens because of the blood–ocular barrier [25,26]. To provide insight into the correlation between TAC and cataractogenesis, we chose to directly analyze aqueous humor, the primary circulatory system of the lens.
There are several ways to evaluate the TAC, including the oxygen radical absorbance capacity (ORAC) assay [27], the DPPH assay [28], the Trolox equivalent antioxidant capacity (TEAC) assay [29], the ferric reducing antioxidant power (FRAP) assay [30], the cupric reducing antioxidant capacity (CUPRAC) assay [31], etc. However, because of the complexity of TAC, which includes enzymes, proteins, and small molecules, none of the assays could completely evaluate the antioxidant capacity of all these antioxidants. Furthermore, because of the different mechanisms and targets of each assay, the assays may show incoherent results between each other [32,33]. Therefore, choosing an appropriate TAC assay that could represent the majority of the TAC in the sample is important. Table 4 demonstrates the published measuring methods to evaluate TAC in aqueous humor. Although there were obvious differences in the TAC results measured by different assays, we could find that most researchers choose to use colorimetric change based on Fe2+ to evaluate the TAC in aqueous humor, and their results showed much more TAC in aqueous humor than the rest. This result may be because small molecules are major components of TAC in aqueous humor, and colorimetric change based on metal ions is an appropriate method to evaluate small-molecular-type antioxidants. However, there are still several drawbacks of the current, commercially available FRAP assay. First, the relatively large sample volume requirement, and second, the requirement of low pH level to maintain the stability of Fe3+-TPTZ compound. Therefore, we have developed our own assay based on copper (II) redox reactions to measure the TAC in aqueous humor [11]. In our previously published paper, we developed our TAC assay to measure TAC in aqueous humor, which requires only 10 μL sample per test. In addition, it could produce results with high accuracy, insistence, and good stability among a wide range of pH levels and experimental times. We also compared the results with commercially available FRAP assay, which showed high consistency. Furthermore, we built up the standard curve by ascorbic acid, which is the most abundant antioxidant in aqueous humor. This increased the similarity between standard solution and clinical samples. Therefore, although our TAC assay still could not measure all the antioxidants in aqueous humor, we believe that our own developed TAC assay may be the most appropriate TAC assay to evaluate TAC in aqueous humor.
Our finding that aqueous humor TAC is negatively correlated with cataract severity is consistent with that of other researchers that examined cataract risk factors and possible pathological mechanisms. Existing evidence has ranked age, ultraviolet exposure, use of tobacco, and hyperglycemia as the top risk factors for cataract formation; each of these have an obvious correlation to oxidative stress [45,46,47]. In addition, Garner B et al. reported a correlation between hydroxyl radical formation in the lens and cataract severity [48]. There is also evidence that antioxidant compounds could prevent the lens from opacification and cataract formation [49,50]. An interesting findings in our study showed that there is no significant correlation between TAC/ascorbic acid and age (Figure S3). Therefore, the real correlation between TAC/ascorbic acid and cataract formation is worthy of further investigation. Our study extended previous research and found that aqueous humor TAC is significantly associated with both cataract hardness (according to CDE) and LOCS III cataract severity of NO and CC. Moreover, we found that aqueous humor TAC and ascorbic acid demonstrated a better correlation to CDE than the LOCS III cataract severity grading system. Although the LOCS III cataract severity grading system is one of the standard preoperative assessments of cataracts, the exact correlation between the grading system and the ultrasonic energy expenditure is doubtful. In a previous study, only low degrees of correlations were found between LOCS III cataract severity and CDE (R2 = 0.15 for NO and R2 = 0.18 for nuclear color, and no correlation between CC and CDE) [51], whereas in our study, no significant association was found between the two parameters. Thus, it is plausible that measuring aqueous humor TAC, which displays a medium degree of correlation with CDE, might be a better method for providing an accurate preoperative estimation, and choosing the appropriate cataract extraction strategy. For example, some aqueous humor can be aspirated when making the side pore in cataract surgery. Then, we can use our TAC assay to analyze the TAC of the aqueous humor before starting the phacoemulsification process. Then, based on the results, surgeon could tailor the cataract surgery for the patient by adjusting the parameters of phacoemulsification, choosing between the phacoemulsification process or traditional extracapsular cataract extraction, determining the use of tension ring, etc. A complete surgical plan may improve the surgical outcome and minimize the complication rate. However, the applicability of this scenario requires further clinical validation.
The superior correlation between aqueous humor TAC and cataract severity might be attributable to the objective and quantitative recording system, and the close relationship between oxidative stress and cataract formation. On the other hand, our findings revealed no significant associations between aqueous humor TAC and the surgical efficacy or surgical safety evaluated by BCVA and IOP. These results are reasonable according to previous studies showing that CDE was not associated with postoperative IOP changes [52]. However, previous studies have delineated the correlation between CDE and postoperative dry eye incidence, intraocular mechanical trauma, macular edema incidence, retinal vasculature, and perfusion density [53,54,55,56]. Moreover, there is a more significant correlation between CDE and corneal endothelial cell loss during the phacoemulsification process [6,57,58]. Although there is no evidence directly explaining the correlation between aqueous humor TAC and cataract surgical outcomes, aqueous humor TAC has the potential to be influential. As we have revealed the moderate correlation between aqueous humor TAC and CDE, the correlations between aqueous humor TAC and more aspects of clinical cataract surgical outcomes are worthy of further research.
There are several limitations of this study. As an invasive procedure was necessary to obtain the aqueous humor sample, the recruitment of healthy subjects was prohibited, and a control group was not possible. Examining aqueous humor TAC levels repeatedly in a longitudinal follow-up setting was also not possible. To overcome these limitations and provide a trustworthy result, we designed the study in a rigorous way. First, we conducted a pilot study to calculate the sample size requirement of this study to reach a satisfactory statistical power. Second, all the patients who participated in this study received preoperative cataract severity evaluations and cataract surgery by the same ophthalmologist to reduce technical bias. Third, we measured the correlation between aqueous humor TAC and cataract severity in many ways including the LOCS III cataract severity grading system for NO and CC; CDE determined during cataract surgery was used to confirm results. Last, we adjusted the potential confounding factors in all of our regression models and found age and diabetes mellitus to be significant confounders in our multivariate regression analysis. The other limitation of this study is that we did not enroll and discuss the systemic and topical medication use of the patients, and the current findings are not sufficient enough to conclude that antioxidant therapy can prevent cataract formation or progression. Further clinical trials are warranted to verify the applicability of antioxidant therapy in slowing cataract development.

5. Conclusions

In summary, ascorbic acid contributed to the majority of aqueous humor TAC, and both the aqueous humor TAC and ascorbic acid demonstrated negative correlations to CDE use during cataract surgery. Moreover, aqueous humor TAC and ascorbic acid show a better correlation to cataract severity measured by CDE than the current LOCS III cataract severity grading system. However, there was no significant correlation between aqueous humor TAC and postoperative BCVA and IOP changes. According to these findings, measuring the TAC levels in aqueous humor owns the potential to provide clinicians with a useful cataract severity scoring system for the determination of cataract extraction strategy; measuring the TAC levels could also provide the cornerstone and guidance for examining potential antioxidant-based cataract therapies. Future advancements in optic devices for noninvasive assessments of aqueous humor TAC would be significantly advantageous to this prescribed process and additional processes that may be developed as a result of this guidance.

Supplementary Materials

The following supporting information can be downloaded at: https://www.mdpi.com/article/10.3390/antiox11020397/s1, Figure S1: Flow diagram presenting the recruitment process of the study subjects, Figure S2: Bar chart showing the total antioxidant capacity (TAC) and ascorbic acid concentration (AA) in each LOCS severity score, Figure S3: Scatter plot showing the correlation between aqueous humor total antioxidant capacity (TAC)/ascorbic acid concentration (AA) and Patient Age, Table S1: Univariate and Multivariate Linear Regression Analyses of ascorbic acid for cumulative dissipated energy during the phacoemulsification process, Table S2: Univariate and multivariate linear regression analyses for cumulative dissipated energy during the phacoemulsification process based on nuclear opalescence and cortical cataract, Table S3: Univariate and multivariate linear regression analyses for the improvement of best-corrected visual acuity after cataract surgery, Table S4: Univariate and multivariate linear regression analyses for the changes of intraocular pressure after cataract surgery.

Author Contributions

Conceptualization, Y.-T.T., W.-C.W., K.-J.C., H.-C.C. and C.-M.C.; methodology, Y.-T.T., H.-C.C. and C.-M.C.; software, Y.-T.T.; validation, Y.-T.T.; formal analysis, C.-F.L. and Y.-J.H.; investigation, Y.-T.T.; resources, W.-C.W., K.-J.C. and H.-C.C.; data curation, Y.-T.T., C.-F.L. and Y.-J.H.; writing—original draft preparation, Y.-T.T.; writing—review and editing, C.-M.C. and H.-C.C.; visualization, C.-F.L. and Y.-J.H.; supervision, C.-M.C. and H.-C.C.; project administration, Y.-T.T.; funding acquisition, H.-C.C. All authors have read and agreed to the published version of the manuscript.

Funding

This study was funded by research grants from the Ministry of Science and Technology, Taiwan (MOST 110-2221-E-182A-006- to Chen HC), and Chang Gung Memorial Hospital, Linkou, Taiwan (CMRPG3L0601 to Chen HC). The sponsor or funding organization had no role in the design or conduct of this research.

Institutional Review Board Statement

This study was conducted in accordance with the Declaration of Helsinki and approved by the Institutional Review Board of Chang Gung Medical Foundation in 2019 (IRB number: 201900017B0).

Informed Consent Statement

Informed consent was obtained from all subjects involved in the study.

Data Availability Statement

Data is contained within the article and supplementary material.

Acknowledgments

The authors thank Hui-Ju Tsai, the Principal Investigator of the Institute of Population Health Sciences, National Health Research Institutes, and the Maintenance Project of the Center for Big Data Analytics and Statistics at Chang Gung Memorial Hospital, for statistical consultation.

Conflicts of Interest

The authors declare no conflict of interest.

References

  1. Hashemi, H.; Pakzad, R.; Yekta, A.; Aghamirsalim, M.; Pakbin, M.; Ramin, S.; Khabazkhoob, M. Global and regional prevalence of age-related cataract: A comprehensive systematic review and meta-analysis. Eye 2020, 34, 1357–1370. [Google Scholar] [CrossRef]
  2. Pershing, S.; Morrison, D.E.; Hernandez-Boussard, T. Cataract surgery complications and revisit rates among three states. Am. J. Ophthalmol. 2016, 171, 130–138. [Google Scholar] [CrossRef] [PubMed]
  3. Chylack, L.T., Jr.; Wolfe, J.K.; Singer, D.M.; Leske, M.C.; Bullimore, M.A.; Bailey, I.L.; Friend, J.; McCarthy, D.; Wu, S.-Y. The Lens Opacities Classification System III. Arch. Ophthalmol. 1993, 111, 831–836. [Google Scholar] [CrossRef] [PubMed]
  4. Schafer, M.E.; Arbisser, B. Quantification of acoustic exposure during cataract surgery. In Proceedings of the IEEE Ultrasonics Symposium, Montreal, QC, Canada, 23–27 August 2004; pp. 1828–1831. [Google Scholar]
  5. Liu, C.; Liu, Y.; Ye, S.; Liu, L.; Zhang, W.; Wu, M. Effect of topical nonsteroidal anti-inflammatory drugs and nuclear hardness on maintenance of mydriasis during phacoemulsification surgery. J. Ocul. Pharmacol. Ther. 2014, 30, 831–836. [Google Scholar] [CrossRef]
  6. Sorrentino, F.S.; Matteini, S.; Imburgia, A.; Bonifazzi, C.; Sebastiani, A.; Parmeggiani, F. Torsional phacoemulsification: A pilot study to revise the “harm scale” evaluating the endothelial damage and the visual acuity after cataract surgery. PLoS ONE 2017, 12, e0186975. [Google Scholar] [CrossRef] [PubMed] [Green Version]
  7. Coco, G.; Cremonesi, P.; Menassa, N.; Pagano, L.; Gadhvi, K.A.; Semeraro, F.; Kaye, S.B.; Romano, V. Changes in pupillometry associated with dissipated energy during phacoemulsification. Eur. J. Ophthalmol. 2020, 31, 2962–2968. [Google Scholar] [CrossRef] [PubMed]
  8. Shajari, M.; Rusev, V.; Mayer, W.; Diakonis, V.; Petermann, K.; Kohnen, T. Impact of lens density and lens thickness on cumulative dissipated energy in femtosecond laser–assisted cataract surgery. Lasers Med. Sci. 2019, 34, 1229–1234. [Google Scholar] [CrossRef]
  9. Al-Osaily, A.M.; Al-Jindan, M.Y. Intra-correlations between cataract density based on Scheimpflug image, phacodynamics, surgery duration, and endothelial cell loss after phacoemulsification. Saudi J. Ophthalmol. 2018, 32, 188–193. [Google Scholar] [CrossRef]
  10. Kaur, J.; Kukreja, S.; Kaur, A.; Malhotra, N.; Kaur, R. The oxidative stress in cataract patients. J. Clin. Diagn. Res. 2012, 6, 1629–1632. [Google Scholar] [CrossRef]
  11. Tsao, Y.T.; Wu, W.C.; Chen, K.J.; Yeh, L.K.; Hwang, Y.S.; Hsueh, Y.J.; Chen, H.C.; Cheng, C.M. Analysis of aqueous humor total antioxidant capacity and its correlation with corneal endothelial health. Bioeng. Transl. Med. 2020, 6, e10199. [Google Scholar] [CrossRef]
  12. Sorkhabi, R.; Ghorbanihaghjo, A.; Javadzadeh, A.; Rashtchizadeh, N.; Moharrery, M. Oxidative DNA damage and total antioxidant status in glaucoma patients. Mol. Vis. 2011, 17, 41–46. [Google Scholar] [PubMed]
  13. Gawali, K.S.; Patil, N.B. Catalase activity and total antioxidant capacity in lens epithelial cells of different morphological types of senile cataract patients. Int. J. Res. Med. 2016, 5, 92–96. [Google Scholar]
  14. Mathew, M.C.; Ervin, A.M.; Tao, J.; Davis, R.M. Antioxidant vitamin supplementation for preventing and slowing the progression of age-related cataract. Cochrane Database Syst. Rev. 2012, 6, CD004567. [Google Scholar] [CrossRef] [PubMed] [Green Version]
  15. Jacques, P.F.; Chylack, L.T., Jr. Epidemiologic evidence of a role for the antioxidant vitamins and carotenoids in cataract prevention. Am. J. Clin. Nutr. 1991, 53, 352S–355S. [Google Scholar] [CrossRef]
  16. Mares, J. Food antioxidants to prevent cataract. JAMA 2015, 313, 1048–1049. [Google Scholar] [CrossRef]
  17. Taylor, A.; Jacques, P.F.; Nadler, D.; Morrow, F.; Sulsky, S.I.; Shepard, D. Relationship in humans between ascorbic acid consumption and levels of total and reduced ascorbic acid in lens, aqueous humor, and plasma. Curr. Eye Res. 1991, 10, 751–759. [Google Scholar] [CrossRef]
  18. Huang, W.; Koralewska-Makár, A.; Bauer, B.; Åkesson, B. Extracellular glutathione peroxidase and ascorbic acid in aqueous humor and serum of patients operated on for cataract. Clin. Chim. Acta 1997, 261, 117–130. [Google Scholar] [CrossRef]
  19. Cox, J.T.; Subburaman, G.-B.B.; Munoz, B.; Friedman, D.S.; Ravindran, R.D. Visual acuity outcomes after cataract surgery: High-volume versus low-volume surgeons. Ophthalmology 2019, 126, 1480–1489. [Google Scholar] [CrossRef] [Green Version]
  20. Schulze-Bonsel, K.; Feltgen, N.; Burau, H.; Hansen, L.; Bach, M. Visual Acuities “Hand Motion” and “Counting Fingers” Can Be Quantified with the Freiburg Visual Acuity Test. Investig. Ophthalmol. Vis. Sci. 2006, 47, 1236–1240. [Google Scholar] [CrossRef]
  21. Shichi, H.; Page, T.; Sahouri, M.J.; Shin, D.H. Microplate assay of ascorbic acid in aqueous humor with bicinchoninic acid. J. Ocul. Pharmacol. Ther. 1997, 13, 201–206. [Google Scholar] [CrossRef]
  22. Rubio, C.P.; Hernández-Ruiz, J.; Martinez-Subiela, S.; Tvarijonaviciute, A.; Ceron, J.J. Spectrophotometric assays for total antioxidant capacity (TAC) in dog serum: An update. BMC Vet. Res. 2016, 12, 166. [Google Scholar] [CrossRef] [PubMed] [Green Version]
  23. Choy, C.K.M.; Benzie, I.F.F.; Cho, P. Ascorbic acid concentration and total antioxidant activity of human tear fluid measured using the FRASC assay. Investig. Ophthalmol. Vis. Sci. 2000, 41, 3293–3298. [Google Scholar]
  24. Faul, F.; Erdfelder, E.; Lang, A.-G.; Buchner, A. G* Power 3: A flexible statistical power analysis program for the social, behavioral, and biomedical sciences. Behav. Res. Methods 2007, 39, 175–191. [Google Scholar] [CrossRef] [PubMed]
  25. Gale, C.R.; Hall, N.F.; Phillips, D.I.; Martyn, C.N. Plasma antioxidant vitamins and carotenoids and age-related cataract. Ophthalmology 2001, 108, 1992–1998. [Google Scholar] [CrossRef]
  26. Li, L.; Duker, J.S.; Yoshida, Y.; Niki, E.; Rasmussen, H.; Russell, R.M.; Yeum, K.-J. Oxidative stress and antioxidant status in older adults with early cataract. Eye 2009, 23, 1464–1468. [Google Scholar] [CrossRef] [Green Version]
  27. Cao, G.; Alessio, H.M.; Cutler, R.G. Oxygen-radical absorbance capacity assay for antioxidants. Free Radic. Biol. Med. 1993, 14, 303–311. [Google Scholar] [CrossRef] [Green Version]
  28. Blois, M.S. Antioxidant determinations by the use of a stable free radical. Nature 1958, 181, 1199–1200. [Google Scholar] [CrossRef]
  29. Miller, N.J.; Rice-Evans, C.; Davies, M.J.; Gopinathan, V.; Milner, A. A novel method for measuring antioxidant capacity and its application to monitoring the antioxidant status in premature neonates. Clin. Sci. 1993, 84, 407–412. [Google Scholar] [CrossRef] [Green Version]
  30. Benzie, I.F.; Strain, J.J. The ferric reducing ability of plasma (FRAP) as a measure of “antioxidant power”: The FRAP assay. Anal. Biochem. 1996, 239, 70–76. [Google Scholar] [CrossRef] [Green Version]
  31. Apak, R.; Güçlü, K.; Özyürek, M.; Karademir, S.E. Novel total antioxidant capacity index for dietary polyphenols and vitamins C and E, using their cupric ion reducing capability in the presence of neocuproine: CUPRAC method. J. Agric. Food Chem. 2004, 52, 7970–7981. [Google Scholar] [CrossRef]
  32. Prior, R.L.; Cao, G. In vivo total antioxidant capacity: Comparison of different analytical methods1. Free Radic. Biol. Med. 1999, 27, 1173–1181. [Google Scholar] [CrossRef]
  33. Cao, G.; Prior, R.L. Comparison of different analytical methods for assessing total antioxidant capacity of human serum. Clin. Chem. 1998, 44, 1309–1315. [Google Scholar] [CrossRef] [PubMed]
  34. Aksoy, H.; Keles, S.; Koçer, I.; Akçay, F. Diabetic cataract and the total antioxidant status in aqueous humor. De Gruyter 2001, 39, 143–145. [Google Scholar] [CrossRef] [PubMed]
  35. Mancino, R.; Di Pierro, D.; Varesi, C.; Cerulli, A.; Feraco, A.; Cedrone, C.; Pinazo-Duran, M.D.; Coletta, M.; Nucci, C. Lipid peroxidation and total antioxidant capacity in vitreous, aqueous humor, and blood samples from patients with diabetic retinopathy. Mol. Vis. 2011, 17, 1298. [Google Scholar] [PubMed]
  36. Beyazyıldız, E.; Çankaya, A.B.; Ergan, E.; Anayol, M.A.; Özdamar, Y.; Sezer, S.; Tırhış, M.H.; Yılmazbaş, P.; Öztürk, F. Changes of total antioxidant capacity and total oxidant status of aqueous humor in diabetes patients and correlations with diabetic retinopathy. Int. J. Ophthalmol. 2013, 6, 531. [Google Scholar] [PubMed] [Green Version]
  37. Nucci, C.; Di Pierro, D.; Varesi, C.; Ciuffoletti, E.; Russo, R.; Gentile, R.; Cedrone, C.; Duran, M.D.P.; Coletta, M.; Mancino, R. Increased malondialdehyde concentration and reduced total antioxidant capacity in aqueous humor and blood samples from patients with glaucoma. Mol. Vis. 2013, 19, 1841. [Google Scholar]
  38. Beyazyıldız, E.; Çankaya, A.B.; Beyazyıldız, Ö.; Ergan, E.; Çelik, H.T.; Yılmazbaş, P.; Öztürk, F. Disturbed oxidant/antioxidant balance in aqueous humour of patients with exfoliation syndrome. Jpn. J. Ophthalmol. 2014, 58, 353–358. [Google Scholar] [CrossRef]
  39. Kirboga, K.; Ozec, A.V.; Kosker, M.; Dursun, A.; Toker, M.I.; Aydin, H.; Erdogan, H.; Topalkara, A.; Arici, M.K. The association between diabetic retinopathy and levels of ischemia-modified albumin, total thiol, total antioxidant capacity, and total oxidative stress in serum and aqueous humor. J. Ophthalmol. 2014, 2014, 820853. [Google Scholar] [CrossRef] [Green Version]
  40. Ergan, E.; Ozturk, F.; Beyazyildiz, E.; Elgin, U.; Sen, E.; Cankaya, A.B.; Celik, T. Oxidant/antioxidant balance in the aqueous humor of patients with glaucoma. Int. J. Ophthalmol. 2016, 9, 249. [Google Scholar]
  41. Kulaksızoglu, S.; Karalezli, A. Aqueous humour and serum levels of nitric oxide, malondialdehyde and total antioxidant status in patients with type 2 diabetes with proliferative diabetic retinopathy and nondiabetic senile cataracts. Can. J. Diabetes 2016, 40, 115–119. [Google Scholar] [CrossRef]
  42. Altinisik, M.; Koytak, A.; Elbay, A.; Toklu, E.; Sezer, T.; Kocyigit, A. Oxidant-antioxidant balance in the aqueous humor of patients with retinal vein occlusion. In The Seminars in Ophthalmology; Taylor & Francis: Abingdon, UK, 2018; pp. 675–682. [Google Scholar]
  43. Bozkurt, E.; Çakır, B.; Çelik, E.; Doğan, E.; Uçak, T.; Alagöz, G. Correlation of the aqueous humor total antioxidant capacity, total oxidant status, and levels of IL-6 and VEGF with diabetic retinopathy status. Arq. Bras. Oftalmol. 2019, 82, 136–140. [Google Scholar] [CrossRef] [PubMed] [Green Version]
  44. Siegfried, C.J.; Shui, Y.-B. Intraocular oxygen and antioxidant status: New insights on the effect of vitrectomy and glaucoma pathogenesis. Am. J. Ophthalmol. 2019, 203, 12–25. [Google Scholar] [CrossRef] [PubMed] [Green Version]
  45. Vinson, J.A. Oxidative stress in cataracts. Pathophysiology 2006, 13, 151–162. [Google Scholar] [CrossRef] [PubMed]
  46. Singh, S.; Pardhan, S.; Kulothungan, V.; Swaminathan, G.; Ravichandran, J.S.; Ganesan, S.; Sharma, T.; Raman, R. The prevalence and risk factors for cataract in rural and urban India. Indian J. Ophthalmol. 2019, 67, 477–483. [Google Scholar] [CrossRef]
  47. Tang, Y.; Wang, X.; Wang, J.; Jin, L.; Huang, W.; Luo, Y.; Lu, Y. Risk factors of age-related cataract in a Chinese adult population: The Taizhou Eye Study. Clin. Exp. Ophthalmol. 2018, 46, 371–379. [Google Scholar] [CrossRef]
  48. Garner, B.; Davies, M.J.; Truscott, R.J. Formation of hydroxyl radicals in the human lens is related to the severity of nuclear cataract. Exp. Eye Res. 2000, 70, 81–88. [Google Scholar] [CrossRef]
  49. Nakazawa, Y.; Nagai, N.; Ishimori, N.; Oguchi, J.; Tamura, H. Administration of antioxidant compounds affects the lens chaperone activity and prevents the onset of cataracts. Biomed. Pharmacother. 2017, 95, 137–143. [Google Scholar] [CrossRef]
  50. Ma, Z.; Liu, J.; Li, J.; Jiang, H.; Kong, J. Klotho ameliorates the onset and progression of cataract via suppressing oxidative stress and inflammation in the lens in streptozotocin-induced diabetic rats. Int. Immunopharmacol. 2020, 85, 106582. [Google Scholar] [CrossRef]
  51. Davison, J.A.; Chylack, L.T., Jr. Clinical application of the lens opacities classification system III in the performance of phacoemulsification. J. Cataract Refract. Surg. 2003, 29, 138–145. [Google Scholar] [CrossRef]
  52. Lee, R.Y.; Chen, R.I.; Kasuga, T.; Cui, Q.N.; Porco, T.C.; Lin, S.C. The Effect of Cumulative Dissipated Energy on Changes in Intraocular Pressure Following Uncomplicated Cataract Surgery by Phacoemulsification. J. Glaucoma 2016, 25, 565. [Google Scholar] [CrossRef] [Green Version]
  53. Sahu, P.; Das, G.; Malik, A.; Biakthangi, L. Dry eye following phacoemulsification surgery and its relation to associated intraoperative risk factors. Middle East Afr. J. Ophthalmol. 2015, 22, 472. [Google Scholar] [CrossRef]
  54. Charles Crozafon, P.; Bouchet, C.; Zignani, M.; Griner, R.; Foster, S.D.; Zou, M.; Dhariwal, M. Comparison of real-world treatment outcomes of femtosecond laser-assisted cataract surgery and phacoemulsification cataract surgery: A retrospective, observational study from an outpatient clinic in France. Eur. J. Ophthalmol. 2021, 31, 1809–1816. [Google Scholar] [CrossRef] [PubMed]
  55. Anastasilakis, K.; Mourgela, A.; Symeonidis, C.; Dimitrakos, S.A.; Ekonomidis, P.; Tsinopoulos, I. Macular edema after uncomplicated cataract surgery: A role for phacoemulsification energy and vitreoretinal interface status? Eur. J. Ophthalmol. 2015, 25, 192–197. [Google Scholar] [CrossRef] [PubMed]
  56. Zhou, Y.; Zhou, M.; Wang, Y.; Ben, S.; Gao, M.; Zhang, S.; Liu, H.; Sun, X. Short-term changes in retinal vasculature and layer thickness after phacoemulsification surgery. Curr. Eye Res. 2020, 45, 31–37. [Google Scholar] [CrossRef] [PubMed]
  57. Mahdy, M.A.S.; Eid, M.Z.; Mohammed, M.A.-B.; Hafez, A.; Bhatia, J. Relationship between endothelial cell loss and microcoaxial phacoemulsification parameters in noncomplicated cataract surgery. Clin. Ophthalmol. 2012, 6, 503. [Google Scholar] [CrossRef] [PubMed] [Green Version]
  58. Gonen, T.; Sever, O.; Horozoglu, F.; Yasar, M.; Keskinbora, K.H. Endothelial cell loss: Biaxial small-incision torsional phacoemulsification versus biaxial small-incision longitudinal phacoemulsification. J. Cataract Refract. Surg. 2012, 38, 1918–1924. [Google Scholar] [CrossRef] [PubMed]
Figure 1. Schematic diagram illustrating the hypothetical correlations between oxidative stress, aqueous humor antioxidant capacity, and cataract severity. The ocular lens is continuously exposed to oxidative stresses such as sunlight. Oxidative injury and subsequent cataract formation are the likely results of such oxidative exposure accumulated through aging. However, aqueous humor antioxidant capacity, which is primarily composed of ascorbic acid, could postpone senility and protect the lens from cataract progression. Created with BioRender.com (accessed on 20 December 2021).
Antioxidants 11 00397 g001
Figure 2. Histogram showing the distribution of aqueous humor total antioxidant capacity (TAC) in cataract patients. The data were normally distributed. The mean aqueous humor TAC was 1.643 ± 0.370 mM ascorbic acid equivalent antioxidant capacity (AAEAC) with the highest level of 2.279 mM AAEAC and the lowest level of 0.396 mM AAEAC.
Antioxidants 11 00397 g002
Figure 3. Graphs showing the aqueous humor ascorbic acid (AA) concentrations in cataract patients and its correlation to total antioxidant capacity (TAC): (A) histogram showing the left-skewed distribution of aqueous humor AA concentrations in cataract patients with a mean value of 1.198 ± 0.355 mM; (B) scatter plot showing the high correlation between aqueous humor AA concentrations and TAC with a Spearman correlation coefficient of 0.79 (p value < 0.001); (C) pie chart showing the proportional correlation between aqueous humor AA concentrations and TAC. The AA averagely contributed to 71.9% of the aqueous humor TAC in cataract patients.
Antioxidants 11 00397 g003
Figure 4. Scatter plot showing the correlation between aqueous humor total antioxidant capacity (TAC) and cumulative dissipated energy (CDE) during phacoemulsification in cataract patients. There is a medium degree of correlation between aqueous humor TAC and CDE during the phacoemulsification process in cataract patients. The Spearman correlation coefficient was −0.31 (p value < 0.001).
Antioxidants 11 00397 g004
Figure 5. Scatter plot showing the correlation between aqueous humor ascorbic acid concentration and cumulative dissipated energy (CDE) during phacoemulsification in cataract patients. There is a medium degree of correlation between aqueous humor ascorbic acid concentration and CDE during the phacoemulsification process in cataract patients. The Spearman correlation coefficient was −0.23 (p value = 0.01).
Antioxidants 11 00397 g005
Figure 6. Scatter plot showing the correlation between aqueous humor total antioxidant capacity (TAC) and the best-corrected visual acuity (BCVA) improvement following cataract surgery. There was no significant correlation between aqueous humor TAC and BCVA improvement after surgery. The Spearman correlation coefficient was −0.045 (p value = 0.658). The BCVA was converted to the logarithm of the minimum angle of resolution (LogMAR) values for analysis.
Antioxidants 11 00397 g006
Figure 7. Scatter plot showing the correlation between aqueous humor total antioxidant capacity (TAC) and changes in intraocular pressure (IOP) after cataract surgery. There was no significant correlation between aqueous humor TAC and IOP changes after surgery. The Spearman correlation coefficient was 0.027 (p value = 0.785).
Antioxidants 11 00397 g007
Table 1. Patient characteristics (n = 130).
Basic Characteristics
OD/OS, n59/71
Age, mean ± SD (Years)67.6 ± 8.9
Gender, M/F n (%)67 (51.5%)/63 (48.5%)
BMI, mean ± SD (Kg/m2)24.95 ± 3.49
Disease diagnosis, n (%)ARC: 116 (89.2%) Juvenile cataract: 14 (10.8%)
Underlying Diseases
Hypertension, n (%)51 (39.2%)
Diabetes mellitus, n (%)28 (21.5%)
Other underlying systemic diseases, n (%)55 (42.3%)
ARC = age-related cataract; BMI = body mass index; F = female; M = male; OD = oculus dextrus; OS = oculus sinister; SD = standard deviation. Other systemic diseases include dyslipidemia, heart diseases, kidney diseases, lung diseases, liver diseases, stroke, immunocompromised status, and autoimmune diseases.
Table 2. Univariate and multivariate linear regression analyses for cumulative dissipated energy during the phacoemulsification process.
VariableUnivariate RegressionMultivariate Regression
BSEp ValueBSEp Value
Total antioxidant capacity−18.624.85<0.001 ***−18.474.89<0.001 ***
Basic characteristics
OD/OS0.313.790.934−0.1283.530.971
Age0.450.210.034 *0.7190.270.008 **
Gender−2.583.770.4961.1303.650.758
BMI−0.010.540.99−0.4260.550.444
Disease diagnosis−0.116.090.98613.927.820.078
Underlying disease
Hypertension0.613.870.8760.6764.30.875
Diabetes mellitus11.44.480.012 *8.6234.440.055
Other underlying
systemic disease
−3.733.810.329−3.9964.030.323
B = beta coefficient; BMI = body mass index; OD = oculus dextrus; OS = oculus sinister; SE = standard error. Age, eye site, gender, body mass index, disease diagnosis, and underlying diseases were adjusted in the multivariate regression as confounding factors. p value of the multivariate regression model is 0.001. Other systemic diseases include dyslipidemia, heart diseases, kidney diseases, lung diseases, liver diseases, stroke, immunocompromised status, and autoimmune diseases. *: p-value < 0.05; **: p-value < 0.01; ***: p-value <0.001.
Table 3. Univariate and multivariate ordinal logistic regression analyses for total antioxidant capacity on cataract severity of nuclear opalescence and cortical cataract.
Crude Odds RatioAdjusted Odds Ratio
OR (95% CI)p ValueOR (95% CI)p Value
Nuclear Opalescence
Grade 2 vs. Grade 10.453 (0.04–5.18)0.5240.348 (0.028–4.301)0.411
Grade 3 vs. Grade 10.11 (0.016–0.735)0.023 *0.078 (0.011–0.571)0.012 *
Cortical Cataract
Grade 2 vs. Grade 10.027 (0.001–1.055)0.0530.001 (0–0.355)0.02 *
Grade 3 vs. Grade 10.005 (0–0.147)0.002 **< 0.001 (0–0.051)<0.001 ***
OR: odds ratio; CI: confidence interval. Age, eye site, gender, body mass index, disease diagnosis, and underlying diseases were adjusted as the confounding factors. *: p-value < 0.05; **: p-value < 0.01; ***: p-value < 0.001.
Table 4. The published measuring methods to evaluate total antioxidant capacity in aqueous humor.
ReferenceTotal Antioxidant
Capacity
(Unit: mmol/L
Trolex)
Sample SizeMeasurement Method
Aksoy et al. 2001 [34]0.41 ± 0.0416Spectrophotometric method (elimination of ABTSR+)
Mancino et al. 2011 [35]0.94 ± 0.2614Fluorescence method (inhibit the peroxidation of β-phycoerythrin)
Sorkhabi et al. 2011 [12]0.34 ± 0.1527Spectrophotometric method (elimination of ABTS+)
Beyazyıldız et al. 2013 [36]2.54 ± 0.7133Colorimetric change in Fe2+
Nucci et al. 2013 [37]0.963 ± 0.30226Fluorescence method (inhibit the peroxidation of β-phycoerythrin)
Beyazyıldız et al. 2014 [38]2.5 ± 0.725Colorimetric change in Fe2+
Kirboga et al. 2014 [39]0.65 ± 0.0922Colorimetric method (reduction of 2,2′-azino-bis radical)
Ergan et al. 2016 [40]1.80 ± 0.7931Colorimetric method (inhibit oxidation of H2O2)
Kulaksızoglu et al. 2016 [41]0.77 ± 0.0735TAS kit (unknown mechanism)
Altinisik et al. 2018 [42]0.78 ± 0.4628Colorimetric change in Fe2+
Bozkurt et al. 2019 [43]0.39 [0.39–0.44]28Colorimetric immunodiagnostic assay (H2O2 elimination)
Siegfried et al. 2019 [44]0.479 ± 0.14672Luminescence method (elimination of alkyl peroxyl radicals)
Publisher’s Note: MDPI stays neutral with regard to jurisdictional claims in published maps and institutional affiliations.

