
Therapeutic Effects of Bee Bread on Obesity-Induced Testicular-Derived Oxidative Stress, Inflammation, and Apoptosis in High-Fat Diet Obese Rat Model

 ,
,  ,
,  ,
,  ,
,  and
and 
Abstract
1. Introduction
2. Materials and Methods
2.1. Animal Handling
2.2. Materials
2.2.1. Preparation of Bee Bread Samples
2.2.2. Diets
2.2.3. Chemicals and Kits
2.3. Study Design
- Normal Control (C) group: administered with normal rat pellets and distilled water (1 mL) once daily for 12 weeks.
- Ob group: administered with HFD and 1 mL distilled water once daily for 12 weeks.
- Ob + BB group: administered with HFD for 6 weeks and then HFD + bee bread (0.5 g/kg b.w./day) for another 6 weeks.
- Ob + OR group: administered with HFD for 6 weeks and then HFD + orlistat (10 mg/kg b.w./day) for another 6 weeks.
2.4. Bodyweight, Absolute and Relative Organ Weights
2.5. Determination of Anthropometrical and Nutritional Parameters
2.6. Sample Collection
2.7. Determination of Serum Lipid Parameters
2.8. Histopathology of the Testis
2.9. Oxidative Stress Status of the Testis
2.10. Evaluation of Intratesticular Levels of Lactate, Lactate Dehydrogenase and Glucose
2.11. RNA Expression for Antioxidant, Inflammatory and Apoptosis Markers
2.11.1. Extraction, Quality, and Purity of RNA
2.11.2. Real-Time RT-qPCR
2.12. Immunohistochemistry Expression for PCNA, TNF-α, IL-1β, IL-10 and Cleaved Caspase-3
2.13. Statistical Analysis
3. Results
3.1. Body Weights and Weight Gain
3.2. Energy Intake, Feed Consumption, Lee Obesity and Body Mass Index
3.3. Effects of Bee Bread on Weight of Reproductive Organs and Epididymal Fat of Obese Rats
3.4. Effects of Bee Bread on Serum Lipid Profile of Obese Rats
3.5. Effects of Bee Bread on Testicular Histology of Obese Rats
3.6. Effects of Bee Bread on Testicular Oxidative Stress of Obese Rats
3.7. Effects of Bee Bread on mRNA Expressions of Testicular Oxidative Stress Markers of Obese Rats
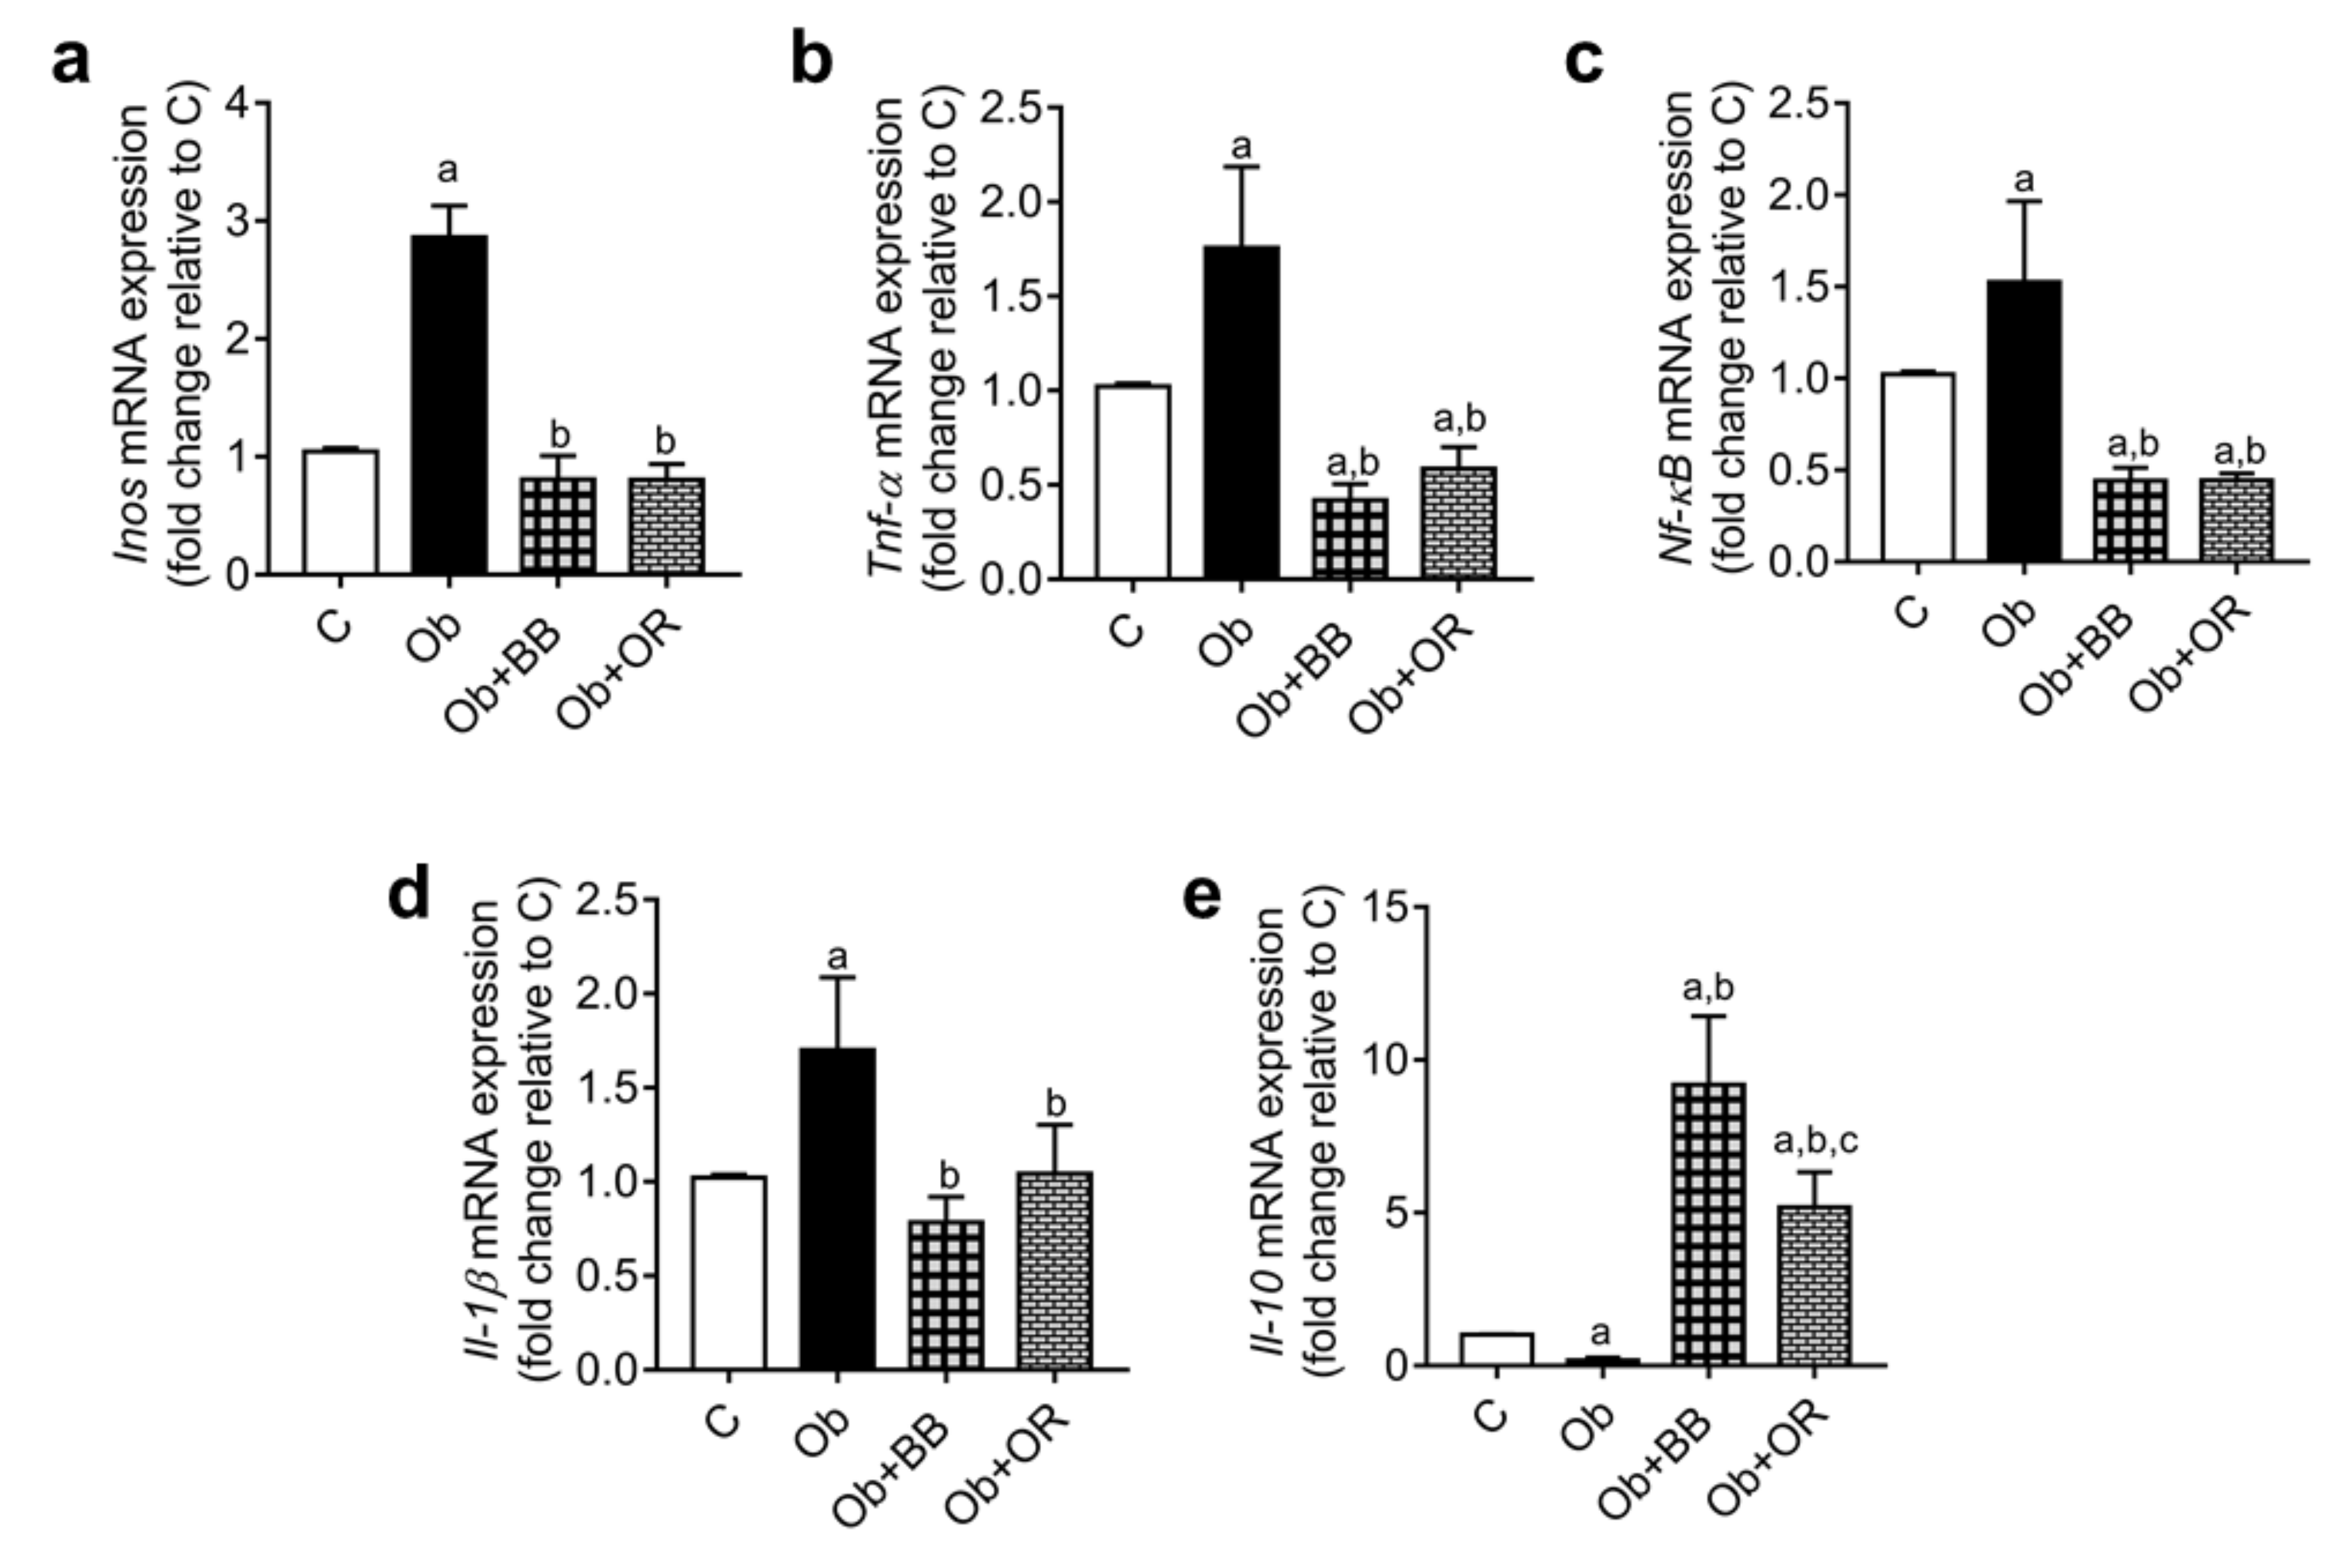
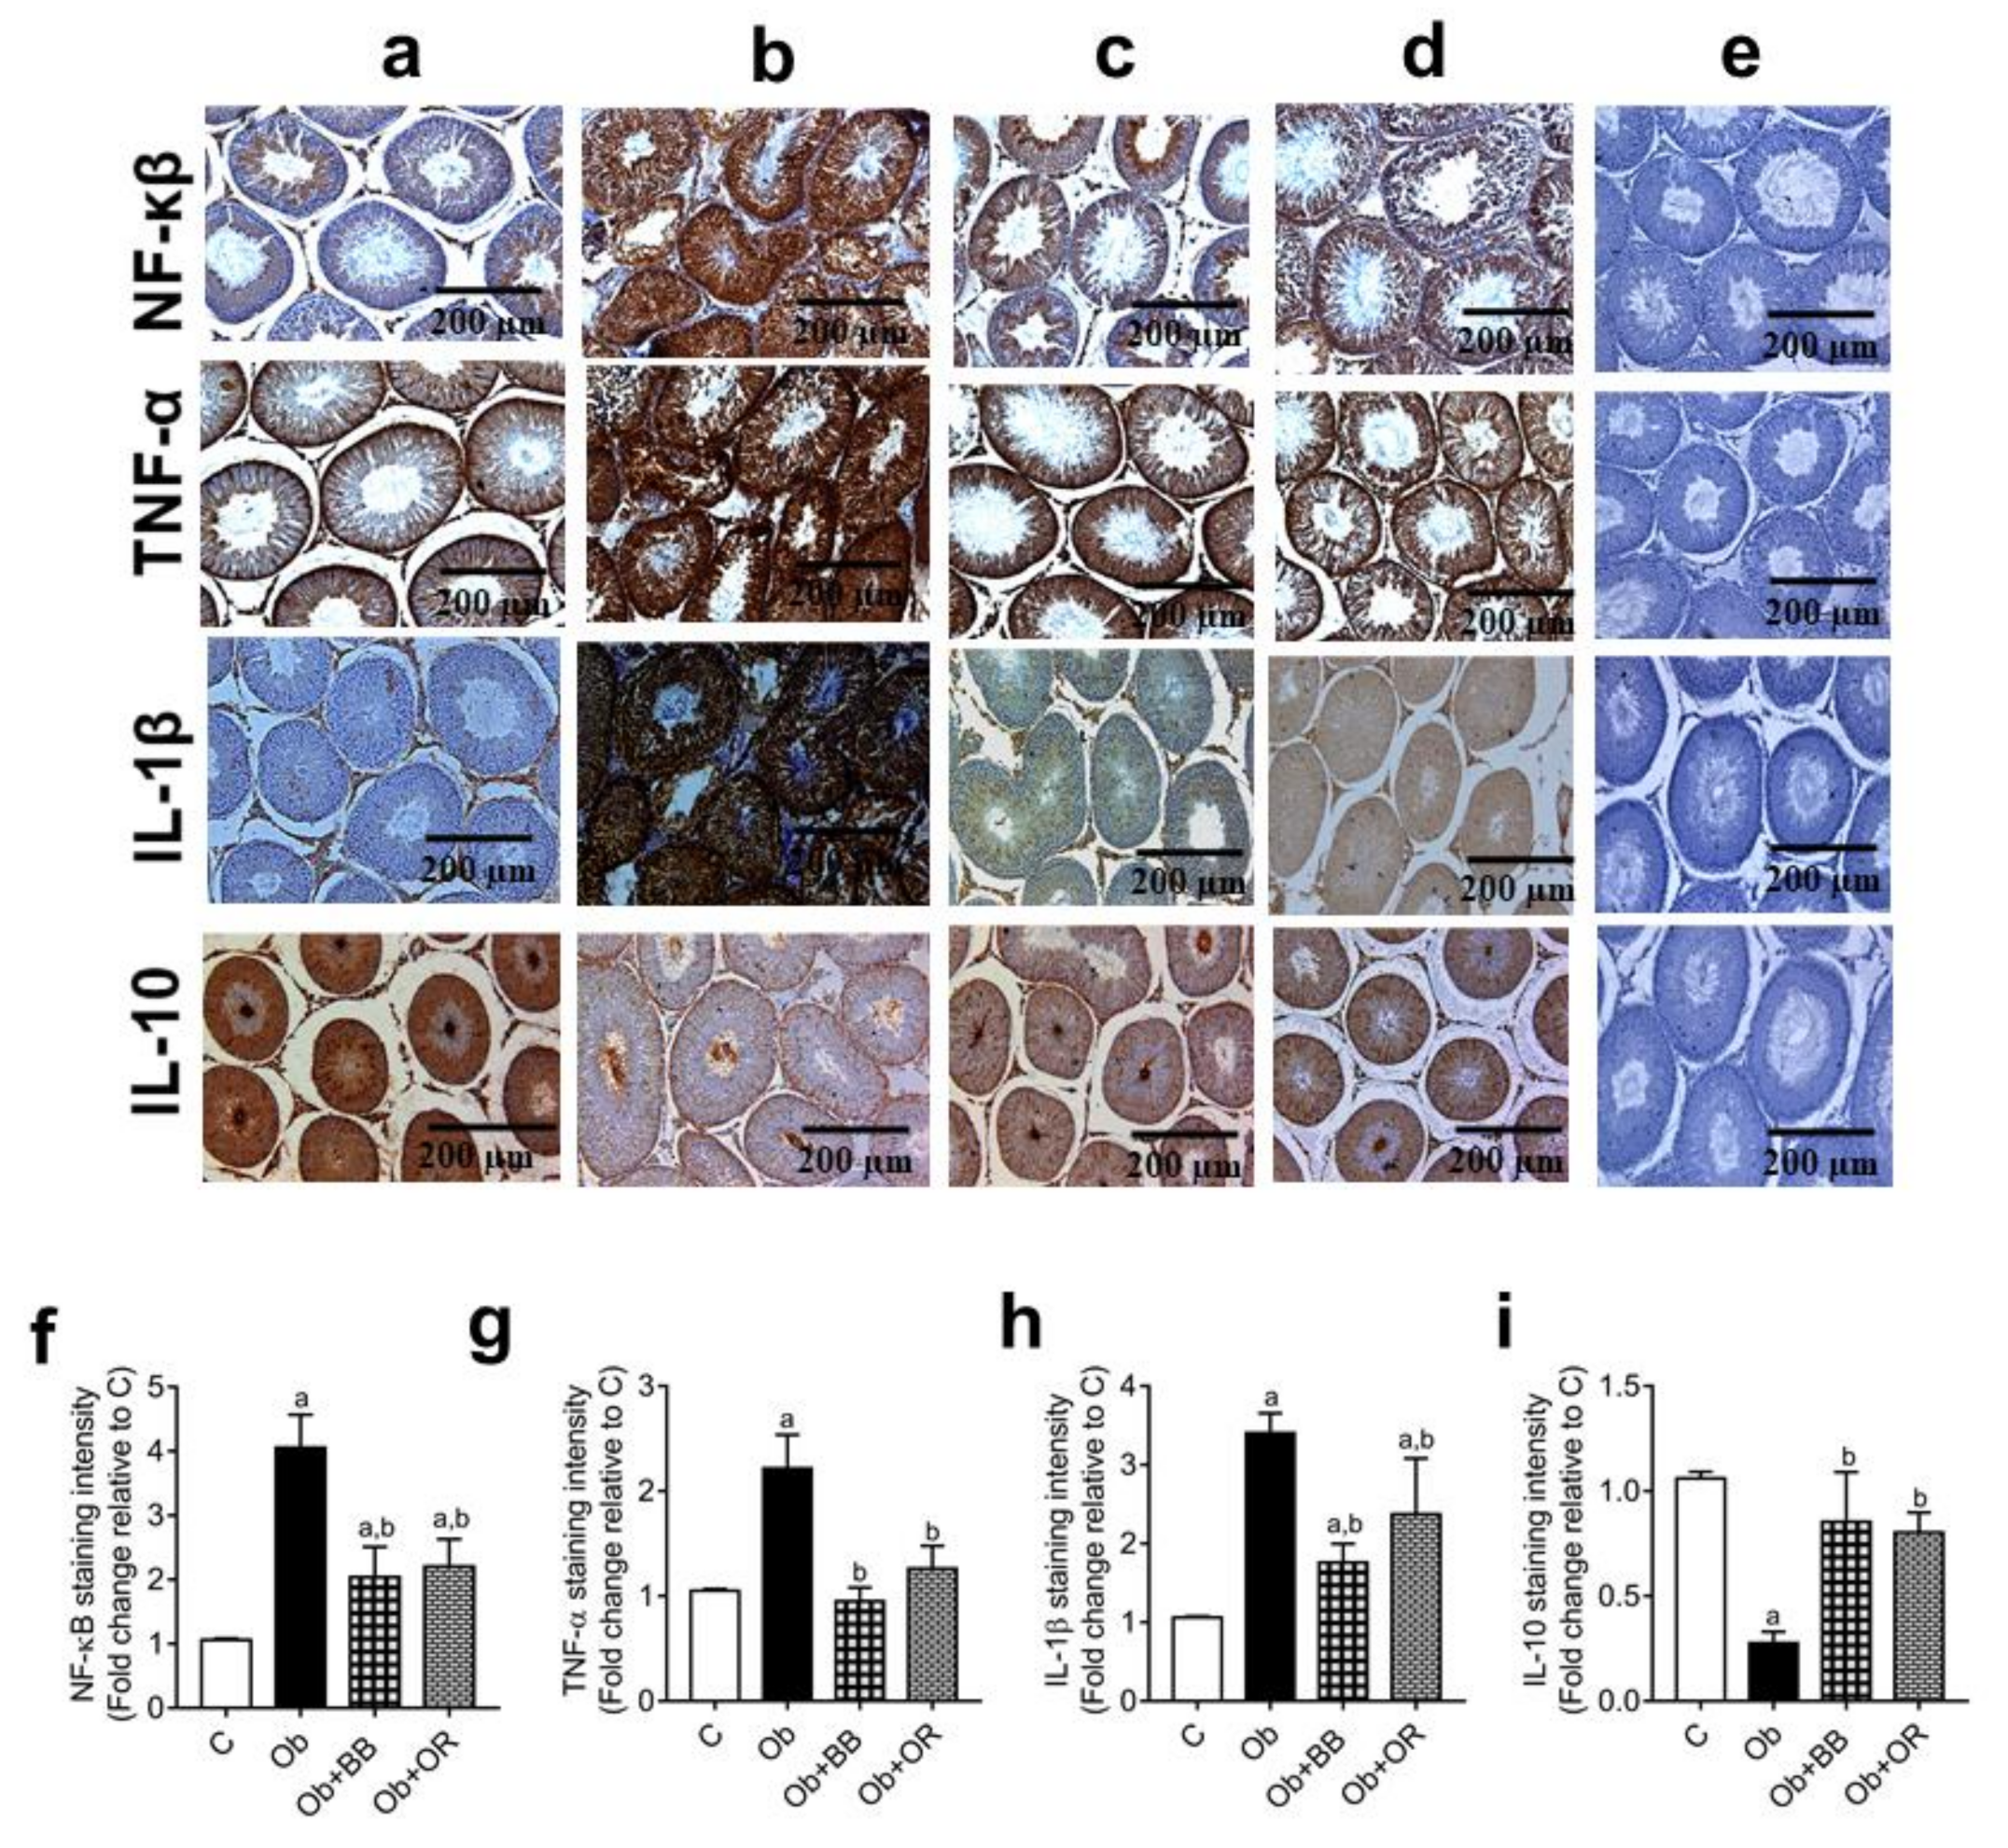
3.8. Effects of Bee Bread on mRNA and Protein Levels of Testicular Inflammation-Related Markers of Obese Rats
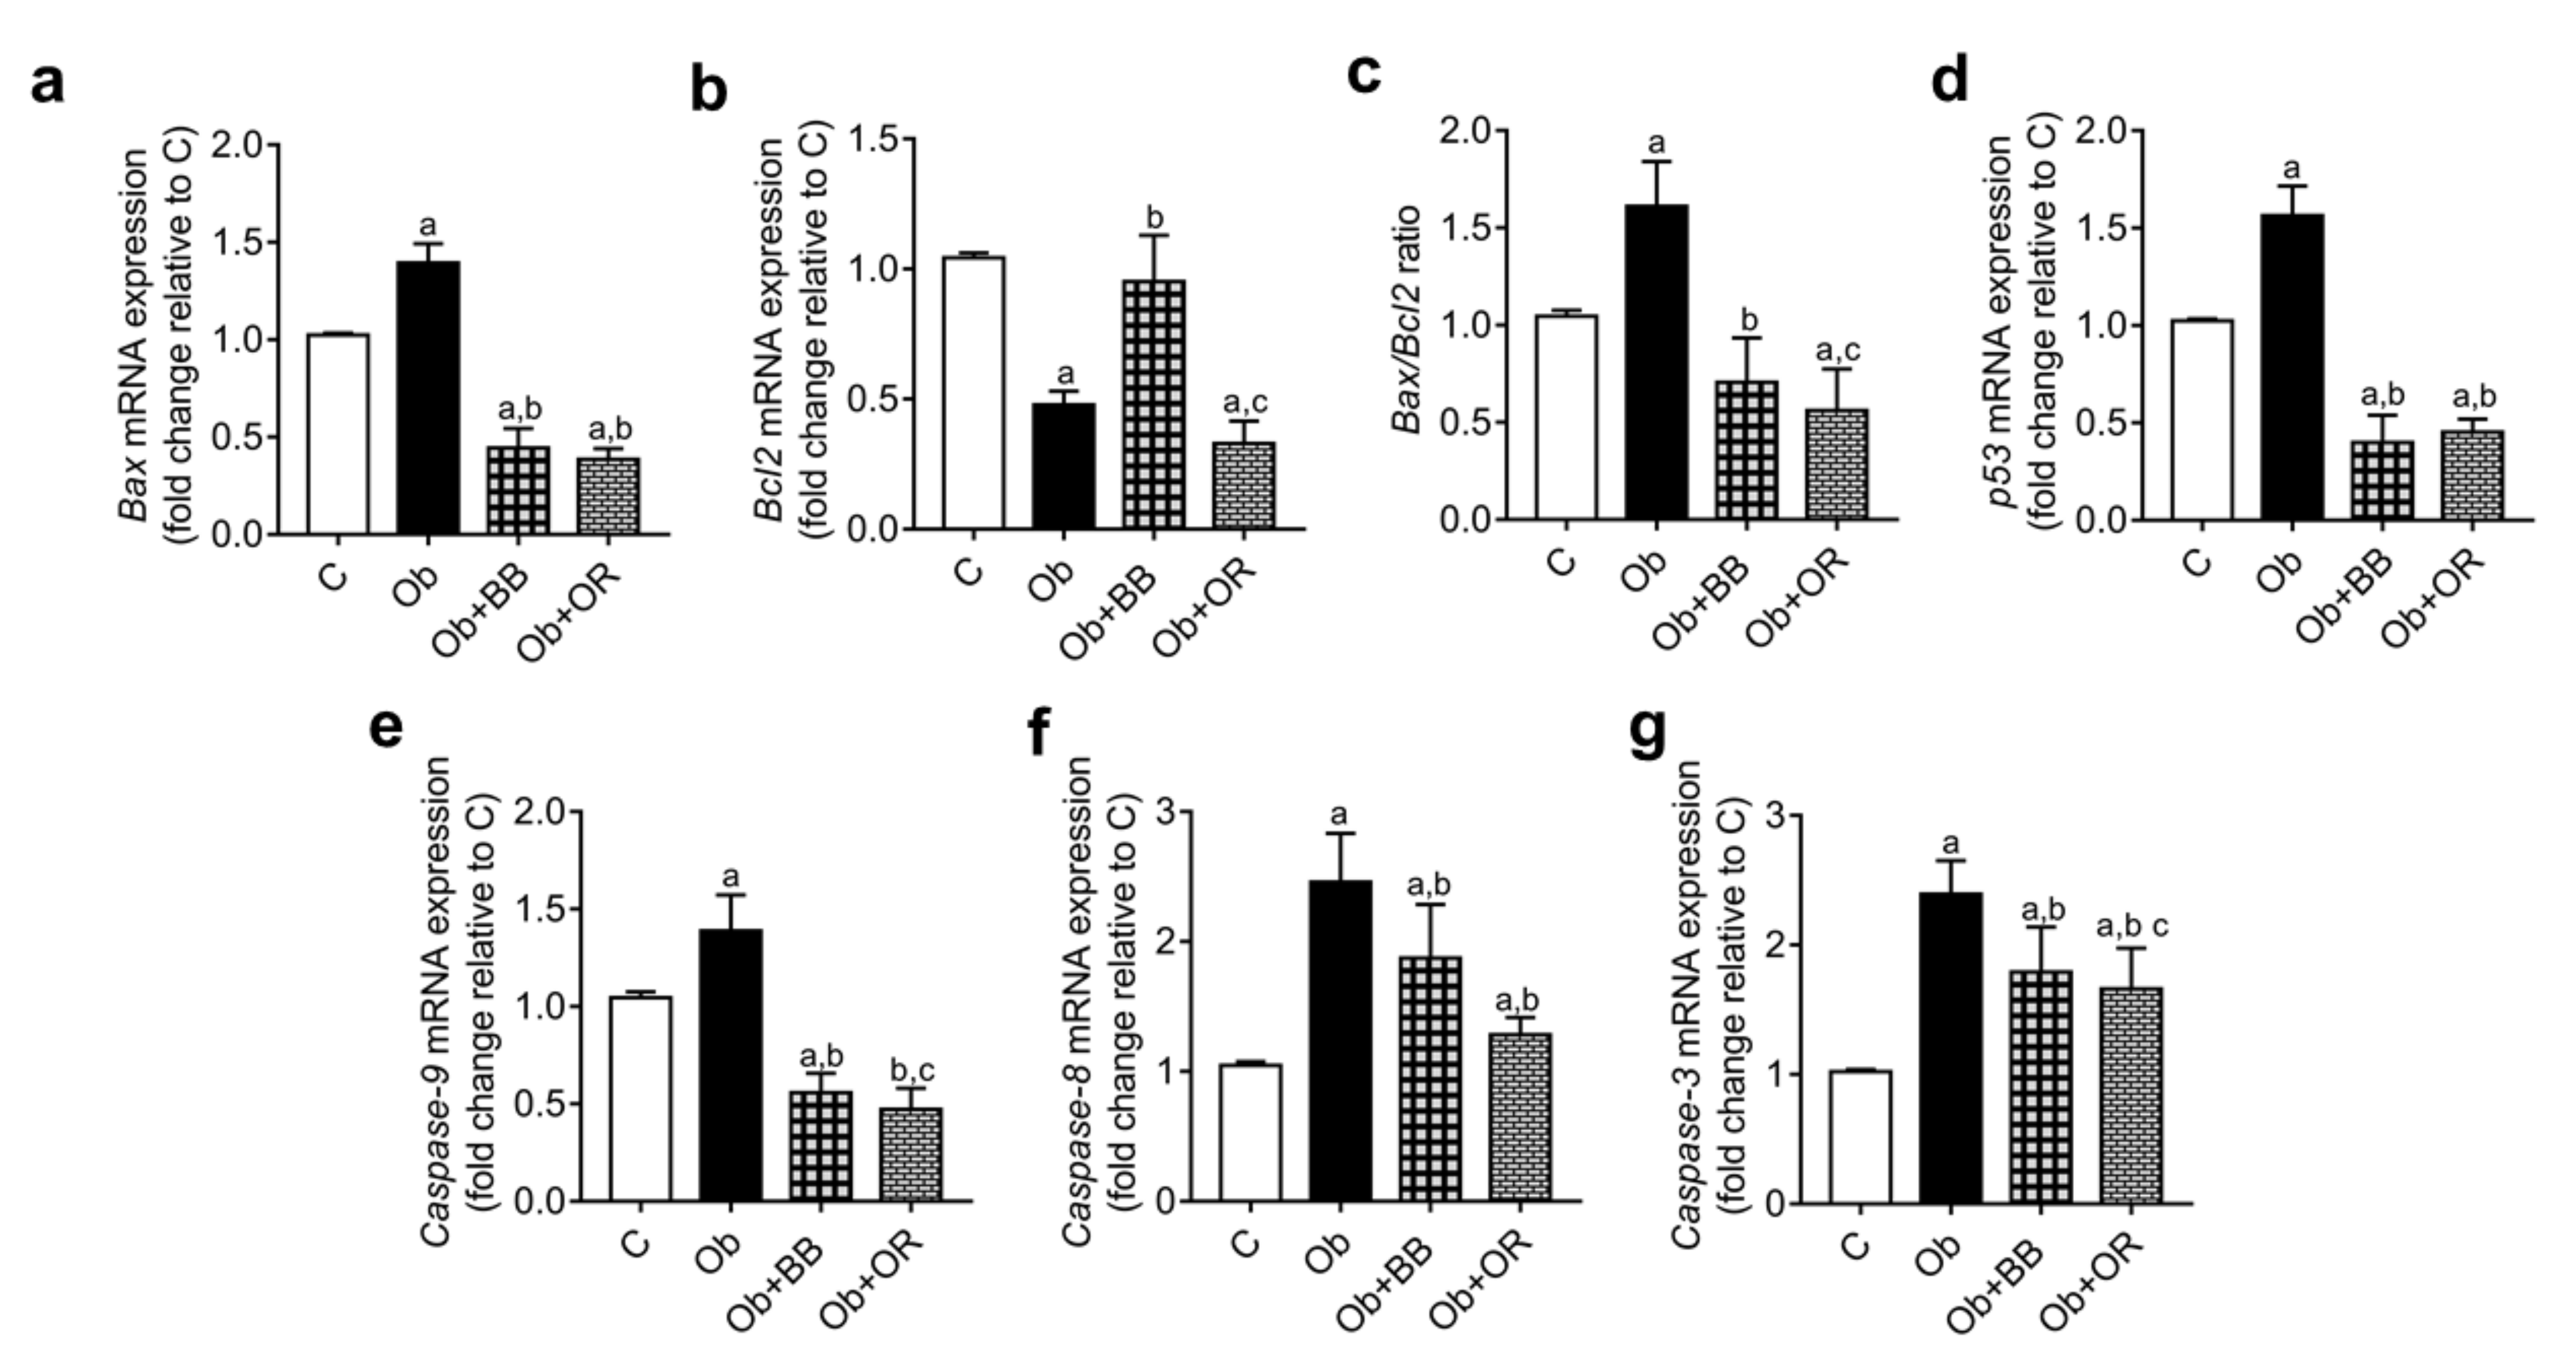
3.9. Effects of Bee Bread on mRNA and Protein Levels of Testicular Apoptosis-Related Markers and PCNA Expression of Obese Rats
4. Discussion
5. Conclusions
Author Contributions
Funding
Institutional Review Board Statement
Informed Consent Statement
Data Availability Statement
Acknowledgments
Conflicts of Interest
References
- Khalifa, S.A.; Elashal, M.; Kieliszek, M.; Ghazala, N.E.; Farag, M.A.; Saeed, A.; Xiao, J.; Zou, X.; Khatib, A.; Göransson, U. Recent insights into chemical and pharmacological studies of bee bread. Trends Food Sci. Technol. 2020, 97, 300–316. [Google Scholar] [CrossRef]
- Kieliszek, M.; Piwowarek, K.; Kot, A.M.; Błażejak, S.; Chlebowska-Śmigiel, A.; Wolska, I. Pollen and bee bread as new health-oriented products: A review. Trends Food Sci. Technol. 2018, 71, 170–180. [Google Scholar] [CrossRef]
- Suleiman, J.B.; Mohamed, M.; Abu Bakar, A.B.; Nna, V.U.; Zakaria, Z.; Othman, Z.A.; Aroyehun, A.B. Chemical Profile, Antioxidant Properties and Antimicrobial Activities of Malaysian Heterotrigona itama Bee Bread. Molecules 2021, 26, 4943. [Google Scholar] [CrossRef] [PubMed]
- Mayda, N.; Özkök, A.; Bayram, N.E.; Gerçek, Y.C.; Sorkun, K. Bee bread and bee pollen of different plant sources: Determination of phenolic content, antioxidant activity, fatty acid and element profiles. J. Food Meas. Charact. 2020, 14, 1795–1809. [Google Scholar] [CrossRef]
- Zuluaga, C.M.; Serrato, J.; Quicazan, M. Chemical, nutritional and bioactive characterization of Colombian bee-bread. Chem. Eng. 2015, 43, 175–180. [Google Scholar]
- Mărgăoan, R.; Stranț, M.; Varadi, A.; Topal, E.; Yücel, B.; Cornea-Cipcigan, M.; Campos, M.G.; Vodnar, D.C. Bee collected pollen and bee bread: Bioactive constituents and health benefits. Antioxidants 2019, 8, 568. [Google Scholar] [CrossRef]
- Suleiman, J.B.; Bakar, A.B.A.; Mohamed, M. Malaysian Bee Bread Attenuates Apoptosis and Improves Cell Proliferation in Testis of High-Fat Diet-Induced Obese Rats. Int. J. Hum. Health Sci 2019, 44, S44. [Google Scholar] [CrossRef][Green Version]
- Pełka, K.; Otłowska, O.; Worobo, R.W.; Szweda, P. Bee bread exhibits higher antimicrobial potential compared to bee pollen. Antibiotics 2021, 10, 125. [Google Scholar] [CrossRef]
- Elsayed, N.; El-Din, H.S.; Altemimi, A.B.; Ahmed, H.Y.; Pratap-Singh, A.; Abedelmaksoud, T.G. In Vitro Antimicrobial, Antioxidant and Anticancer Activities of Egyptian Citrus Beebread. Molecules 2021, 26, 2433. [Google Scholar] [CrossRef]
- Mărgăoan, R.; Cornea-Cipcigan, M.; Topal, E.; Kösoğlu, M. Impact of fermentation processes on the bioactive profile and health-promoting properties of bee bread, mead and honey vinegar. Processes 2020, 8, 1081. [Google Scholar] [CrossRef]
- Martiniakova, M.; Blahova, J.; Kovacova, V.; Mondockova, V.; Babosova, R.; Kalafova, A.; Capcarova, M.; Omelka, R. Effects of bee bread, Cornelian cherries treatment on the femoral bone structure using Zucker diabetic fatty rats as an animal model. Veterinární Medicína 2021, 66, 342–349. [Google Scholar] [CrossRef]
- Suleiman, J.B.; Nna, V.U.; Zakaria, Z.; Othman, Z.A.; Eleazu, C.O.; Bakar, A.B.A.; Ahmad, A.; Usman, U.Z.; Rahman, W.F.W.A.; Mohamed, M. Protective effects of bee bread on testicular oxidative stress, NF-κB-mediated inflammation, apoptosis and lactate transport decline in obese male rats. Biomed. Pharmacother. 2020, 131, 110781. [Google Scholar] [CrossRef] [PubMed]
- Umer, A.; Kelley, G.A.; Cottrell, L.E.; Giacobbi, P.; Innes, K.E.; Lilly, C.L. Childhood obesity and adult cardiovascular disease risk factors: A systematic review with meta-analysis. BMC Public Health 2017, 17, 1–24. [Google Scholar] [CrossRef]
- Blüher, M. Obesity: Global epidemiology and pathogenesis. Nat. Rev. Endocrinol. 2019, 15, 288–298. [Google Scholar] [CrossRef] [PubMed]
- Suleiman, J.B.; Abu Bakar, A.; Mohamed, M. Review on effects of obesity on male reproductive system and the role of natural products. J. Appl. Pharm. Sci. 2019, 9, 131–141. [Google Scholar]
- Morys, F.; García-García, I.; Dagher, A. Is obesity related to enhanced neural reactivity to visual food cues? A review and meta-analysis. Soc. Cogn. Affect. Neurosci. 2020, 14, 957–966. [Google Scholar] [CrossRef]
- Song, R.-h.; Wang, B.; Yao, Q.-m.; Li, Q.; Jia, X.; Zhang, J.-a. The impact of obesity on thyroid autoimmunity and dysfunction: A systematic review and meta-analysis. Front. Immunol. 2019, 10, 2349. [Google Scholar] [CrossRef]
- Othman, Z.A.; Zakaria, Z.; Suleiman, J.B.; Ghazali, W.S.W.; Mohamed, M. Anti-atherogenic effects of orlistat on obesity-induced vascular oxidative stress rat model. Antioxidants 2021, 10, 251. [Google Scholar] [CrossRef]
- Declèves, A.-E.; Sharma, K. Obesity and kidney disease: Differential effects of obesity on adipose tissue and kidney inflammation and fibrosis. Curr. Opin. Nephrol. Hypertens. 2015, 24, 28. [Google Scholar] [CrossRef]
- Åberg, F.; Färkkilä, M. Drinking and obesity: Alcoholic liver disease/nonalcoholic fatty liver disease interactions. Semin. Liver Dis. 2020, 40, 154–162. [Google Scholar] [CrossRef]
- Xu, M.; Jung, X.; Hines, O.J.; Eibl, G.; Chen, Y. Obesity and pancreatic cancer: Overview of epidemiology and potential prevention by weight loss. Pancreas 2018, 47, 158. [Google Scholar] [CrossRef] [PubMed]
- Gotoh, K.; Fujiwara, K.; Anai, M.; Okamoto, M.; Masaki, T.; Kakuma, T.; Shibata, H. Role of spleen-derived IL-10 in prevention of systemic low-grade inflammation by obesity. Endocr. J. 2017, 64, 375–378. [Google Scholar] [CrossRef] [PubMed]
- Tallis, J.; James, R.S.; Seebacher, F. The effects of obesity on skeletal muscle contractile function. J. Exp. Biol. 2018, 221, jeb163840. [Google Scholar] [CrossRef] [PubMed]
- Fintini, D.; Cianfarani, S.; Cofini, M.; Andreoletti, A.; Ubertini, G.M.; Cappa, M.; Manco, M. The bones of children with obesity. Front. Endocrinol. 2020, 11, 200. [Google Scholar] [CrossRef]
- Gorbatenko, N.V.; Bezhenar, V.F.; Fishman, M.B. Obesity and reproductive health of women. Obes. Metab. 2017, 14, 3–8. [Google Scholar] [CrossRef]
- Leisegang, K.; Henkel, R.; Agarwal, A. Obesity and metabolic syndrome associated with systemic inflammation and the impact on the male reproductive system. Am. J. Reprod. Immunol. 2019, 82, e13178. [Google Scholar] [CrossRef]
- Ye, J.; Luo, D.; Xu, X.; Sun, M.; Su, X.; Tian, Z.; Zhang, M.; Yu, C.; Guan, Q. Metformin improves fertility in obese males by alleviating oxidative stress-induced blood-testis barrier damage. Oxid. Med. Cell. Longev. 2019, 2019, 9151067. [Google Scholar] [CrossRef]
- Fariello, R.M.; de Carvalho, R.C.; Spaine, D.M.; Andretta, R.R.; Caetano, E.M.; Sa, G.P.; Cedenho, A.P.; Fraietta, R. Analysis of the Functional Aspects of Sperm and Testicular Oxidative Stress in Individuals Undergoing Metabolic Surgery. Obes. Surg. 2021, 31, 2887–2895. [Google Scholar] [CrossRef]
- Yi, X.; Tang, D.; Cao, S.; Li, T.; Gao, H.; Ma, T.; Yao, T.; Li, J.; Chang, B. Effect of different exercise loads on testicular oxidative stress and reproductive function in obese male mice. Oxid. Med. Cell. Longev. 2020, 2020, 3071658. [Google Scholar] [CrossRef]
- Erdemir, F.; Atilgan, D.; Markoc, F.; Boztepe, O.; Suha-Parlaktas, B.; Sahin, S. The effect of diet induced obesity on testicular tissue and serum oxidative stress parameters. Actas Urológicas Españolas 2012, 36, 153–159. [Google Scholar] [CrossRef]
- Suleiman, J.B.; Nna, V.U.; Zakaria, Z.; Othman, Z.A.; Bakar, A.B.A.; Mohamed, M. Obesity-induced testicular oxidative stress, inflammation and apoptosis: Protective and therapeutic effects of orlistat. Reprod. Toxicol. 2020, 95, 113–122. [Google Scholar] [CrossRef] [PubMed]
- El-Seedi, H.R.; Eid, N.; Abd El-Wahed, A.A.; Rateb, M.E.; Afifi, H.S.; Algethami, A.F.; Zhao, C.; Al Naggar, Y.; Alsharif, S.M.; Tahir, H.E. Honey Bee Products: Preclinical and Clinical Studies of Their Anti-inflammatory and Immunomodulatory Properties. Front. Nutr. 2022, 8, 761267. [Google Scholar] [CrossRef] [PubMed]
- Nguyen, D.H.; Soygur, B.; Peng, S.-P.; Malki, S.; Hu, G.; Laird, D.J. Apoptosis in the fetal testis eliminates developmentally defective germ cell clones. Nat. Cell Biol. 2020, 22, 1423–1435. [Google Scholar] [CrossRef] [PubMed]
- Wang, H.; Yuan, Q.; Niu, M.; Zhang, W.; Wen, L.; Fu, H.; Zhou, F.; He, Z. Transcriptional regulation of P63 on the apoptosis of male germ cells and three stages of spermatogenesis in mice. Cell Death Dis. 2018, 9, 1–16. [Google Scholar] [CrossRef]
- Othman, Z.A.; Ghazali, W.; Syaheedah, W.; Noordin, L.; Yusof, M.; Aiman, N.; Mohamed, M. Phenolic Compounds and the Anti-Atherogenic Effect of Bee Bread in High-Fat Diet-Induced Obese Rats. Antioxidants 2020, 9, 33. [Google Scholar] [CrossRef]
- Eleazu, C.; Suleiman, J.B.; Othman, Z.A.; Zakaria, Z.; Nna, V.U.; Mohamed, M. Effect of bee bread on some biochemical parameters and skeletal muscle histology of high-fat diet-induced obese Sprague-Dawley rats. J. Food Biochem. 2021, 45, e13626. [Google Scholar] [CrossRef]
- Othman, Z.; Noordin, L.; Omar, N.; NA, M.Y.; Mohamaed, M. Protective Effects of Orlistat on Lipid Profile, Cardiac Oxidative Stress Biomarkers and Histology in High-fat Diet-induced Obese Rats. IIUM Med. J. Malays. 2019, 18. [Google Scholar] [CrossRef]
- Eleazu, C.; Suleiman, J.B.; Othman, Z.A.; Zakaria, Z.; Nna, V.U.; Hussain, N.H.N.; Mohamed, M. Bee bread attenuates high fat diet induced renal pathology in obese rats via modulation of oxidative stress, downregulation of NF-kB mediated inflammation and Bax signalling. Arch. Physiol. Biochem. 2020, 1–17. [Google Scholar] [CrossRef]
- Suleiman, J.B.; Nna, V.U.; Othman, Z.A.; Zakaria, Z.; Bakar, A.B.A.; Mohamed, M. Orlistat attenuates obesity-induced decline in steroidogenesis and spermatogenesis by up-regulating steroidogenic genes. Andrology 2020, 8, 1471–1485. [Google Scholar] [CrossRef] [PubMed]
- Ohkawa, H.; Ohishi, N.; Yagi, K. Assay for lipid peroxides in animal tissues by thiobarbituric acid reaction. Anal. Biochem. 1979, 95, 351–358. [Google Scholar] [CrossRef]
- Koracevic, D.; Koracevic, G.; Djordjevic, V.; Andrejevic, S.; Cosic, V. Method for the measurement of antioxidant activity in human fluids. J. Clin. Pathol. 2001, 54, 356–361. [Google Scholar] [CrossRef] [PubMed]
- Sun, Y.; Oberley, L.W.; Li, Y. A simple method for clinical assay of superoxide dismutase. Clin. Chem. 1988, 34, 497–500. [Google Scholar] [CrossRef] [PubMed]
- Goth, L. A simple method for determination of serum catalase activity and revision of reference range. Clin. Chim. Acta 1991, 196, 143–151. [Google Scholar] [CrossRef]
- Paglia, D.E.; Valentine, W.N. Studies on the quantitative and qualitative characterization of erythrocyte glutathione peroxidase. J. Lab. Clin. Med. 1967, 70, 158–169. [Google Scholar]
- Habig, W.H.; Pabst, M.J.; Jakoby, W.B. Glutathione S-transferases the first enzymatic step in mercapturic acid formation. J. Biol. Chem. 1974, 249, 7130–7139. [Google Scholar] [CrossRef]
- Carlberg, I.; Mannervik, B. [59] Glutathione reductase. In Methods in Enzymology; Elsevier: Amsterdam, The Netherlands, 1985; Volume 113, pp. 484–490. [Google Scholar]
- Annuk, M.; Zilmer, M.; Lind, L.; Linde, T.; Fellström, B. Oxidative stress and endothelial function in chronic renal failure. J. Am. Soc. Nephrol. 2001, 12, 2747–2752. [Google Scholar] [CrossRef]
- Livak, K.J.; Schmittgen, T.D. Analysis of relative gene expression data using real-time quantitative PCR and the 2− ΔΔCT method. Methods 2001, 25, 402–408. [Google Scholar] [CrossRef]
- Rohm, I.; Atiskova, Y.; Drobnik, S.; Fritzenwanger, M.; Kretzschmar, D.; Pistulli, R.; Zanow, J.; Krönert, T.; Mall, G.; Figulla, H.R. Decreased regulatory T cells in vulnerable atherosclerotic lesions: Imbalance between pro-and anti-inflammatory cells in atherosclerosis. Mediat. Inflamm. 2015, 2015, 364710. [Google Scholar] [CrossRef]
- Basar, M.M.; Avci, A.E. Obesity and Male Infertility: Energy Imbalance to Inflammation. Chem. Biol. Lett. 2021, 8, 162–170. [Google Scholar]
- Henkel, R.; Offor, U.; Fisher, D. The role of infections and leukocytes in male infertility. Andrologia 2021, 53, e13743. [Google Scholar] [CrossRef]
- Skosana, B.T. An Investigation of Obesity as an Etiology of Male Infertility in a Rat Model. Ph.D. Thesis, Stellenbosch University, Stellenbosch, South Africa, 2021. [Google Scholar]
- Michicotl-Meneses, M.M.; Thompson-Bonilla, M.d.R.; Reyes-López, C.A.; García-Pérez, B.E.; López-Tenorio, I.I.; Ordaz-Pichardo, C.; Jaramillo-Flores, M.E. Inflammation markers in adipose tissue and cardiovascular risk reduction by pomegranate juice in obesity induced by a hypercaloric diet in Wistar rats. Nutrients 2021, 13, 2577. [Google Scholar] [CrossRef] [PubMed]
- Davanzo, G.G.; Hoffman, A.; Moraes-Vieira, P.M.M.d.; Becker, L. Adipose Tissue and Immuno-Metabolic Regulation. In Essential Aspects of Immunometabolism in Health and Disease; Springer: Berlin/Heidelberg, Germany, 2022; pp. 203–220. [Google Scholar]
- Ren, M.; Zhang, M.; Zhang, X.; Wang, C.; Zheng, Y.; Hu, Y. Hydroxysafflor Yellow A Inhibits Aβ1–42-Induced Neuroinflammation by Modulating the Phenotypic Transformation of Microglia via TREM2/TLR4/NF-κB Pathway in BV-2 Cells. Neurochem. Res. 2021, 1–14. [Google Scholar] [CrossRef] [PubMed]
- Feng, J.; Zhan, J.; Ma, S. LRG1 promotes hypoxia-induced cardiomyocyte apoptosis and autophagy by regulating Hypoxia-inducible factor-1α. Bioengineered 2021, 8897–8907. [Google Scholar] [CrossRef] [PubMed]
- Dunn, L.L.; Kong, S.M.; Tumanov, S.; Chen, W.; Cantley, J.; Ayer, A.; Maghzal, G.J.; Midwinter, R.G.; Chan, K.H.; Ng, M.K. Hmox1 (Heme Oxygenase-1) Protects Against Ischemia-Mediated Injury via Stabilization of HIF-1α (Hypoxia-Inducible Factor-1α). Arterioscler. Thromb. Vasc. Biol. 2021, 41, 317–330. [Google Scholar] [CrossRef] [PubMed]
- Kim, B.-S.; Chung, T.-W.; Choi, H.-J.; Bae, S.-J.; Cho, H.-R.; Lee, S.-O.; Choi, J.-H.; Joo, J.K.; Ha, K.-T. Caesalpinia sappan induces apoptotic cell death in ectopic endometrial 12Z cells through suppressing pyruvate dehydrogenase kinase 1 expression. Exp. Ther. Med. 2021, 21, 357. [Google Scholar] [CrossRef]
- Das, S.; Shukla, N.; Singh, S.S.; Kushwaha, S.; Shrivastava, R. Mechanism of interaction between autophagy and apoptosis in cancer. Apoptosis 2021, 26, 512–533. [Google Scholar] [CrossRef]
- Batool, Z.; Hu, G.; Huang, X.; Wu, Y.; Fu, X.; Cai, Z.; Huang, X.; Ma, M. Dietary therapeutic treatment of renal carcinoma cell lines by down-regulating cFlip, Mcl-1, Bcl-XL and STAT3 gene expression under the influence of up-regulated Bax and intrinsic apoptotic pathway. Food Biosci. 2021, 43, 101319. [Google Scholar] [CrossRef]
- Vasquez-Montes, V.; Rodnin, M.V.; Kyrychenko, A.; Ladokhin, A.S. Lipids modulate the BH3-independent membrane targeting and activation of BAX and Bcl-xL. Proc. Natl. Acad. Sci. USA 2021, 118, e2025834118. [Google Scholar] [CrossRef]
- Frungieri, M.B.; Calandra, R.S.; Bartke, A.; Matzkin, M.E. Male and female gonadal ageing: Its impact on health span and life span. Mech. Ageing Dev. 2021, 197, 111519. [Google Scholar] [CrossRef]
- Amiri, G.; Gholami, M.; Assadollahi, V.; Nemati, A.; Fathi, F.; Rostami, T.; Moloudi, M.R.; Alasvand, M. Effect of Cerium Oxide Nanoparticles on the Expression of Developmental and Apoptosis Genes of Testicular Tissue in 6-Day-Old NMRI Mice Fetuses. Biol. Trace Elem. Res. 2021, 1–10. [Google Scholar] [CrossRef]
- Dey, A.; Perveen, H.; Khandare, A.L.; Banerjee, A.; Maiti, S.; Jana, S.; Chakraborty, A.K.; Chattopadhyay, S. Arsenic-induced uterine apoptotic damage is protected by ethyl acetate fraction of Camellia sinensis (green tea) via Bcl-2-BAX through NF-κB regulations in Wistar rats. Environ. Sci. Pollut. Res. 2021, 28, 41095–41108. [Google Scholar] [CrossRef] [PubMed]
- Meenakshi, J.; Goswami, S.; Datta, K. Constitutive expression of hyaluronan binding protein 1 (HABP1/p32/gC1qR) in normal fibroblast cells perturbs its growth characteristics and induces apoptosis. Biochem. Biophys. Res. Commun. 2003, 300, 686–693. [Google Scholar] [CrossRef]


| Primer Sequence (5′–3′) | ||||
|---|---|---|---|---|
| Gene | Accession Number | Forward | Reverse | Amplicon Size (bp) |
| CAT | NM_012520.2 | ACAACTCCCAGAAGCCTAAGAATG | GCTTTTCCCTTGGCAGCTATG | 76 |
| Caspase-8 | NM_022277.1 | GTTCTCTCAGTTGCCTTTCTCC | GGCCAGTCCGCCAAAGTTTA | 90 |
| IL-10 | NM_012854.2 | TTGAACCACCCGGCATCTAC | CCAAGGAGTTGCTCCCGTTA | 91 |
| Inos | XM_006246949.3 | CAGCCCTCAGAGTACAACGAT | CAGCAGGCACACGCAATGAT | 91 |
| SOD | X05634.1 | CGAGCATGGGTTCCATGTC | CTGGACCGCCATGTTTCTTAG | 101 |
| IL-1b | NM_031512.2 | GACTTCACCATGGAACCCGT | GGAGACTGCCCATTCTCGAC | 104 |
| p53 | NG_005120.4 | CTACTAAGGTCGTGAGACGCTGCC | TCAGCATACAGGTTTCCTTCCACC | 106 |
| Nrf2 | NM_031789.1 | CAGGTTGCCCACATTCCCAA | ATATCCAGGGCAAGCGACTCAT | 110 |
| Bax | U49729.1 | CGCGTGGTTGCCCTCTTCTACTTT | CAAGCAGCCGCTCACGGAGGA | 129 |
| Bcl-2 | NM_016993.1 | ATCGCTCTGTGGATGACTGAGTAC | AGAGACAGCCAGGAGAAATCAAAC | 134 |
| GPx | NM_030826.4 | GGAGAATGGCAAGAATGAAGA | CCGCAGGAAGGTAAAGAG | 139 |
| TNF-a | NM_012675.3 | ACTGAACTTCGGGGTGATCG | GCTTGGTGGTTTGCTACGAC | 153 |
| NF-kB(p65) | NM_199267.2 | CGCGGGGACTATGACTTGAA | AGTTCCGGTTTACTCGGCAG | 163 |
| Caspase-9 | NM_031632 | CTGAGCCAGATGCTGTCCCATA | CCAAGGTCTCGATGTACCAGGAA | 168 |
| GAPDH | NM_017008 | TCACCACCATGGAGAAGGC | GCTAAGCAGTTGGTGGTGCA | 169 |
| Caspase-3 | NM_012922 | AAGATACCAGTGGAGGCCGACTTC | GGGAGAAGGACTCAAATTCCGTGG | 199 |
| Parameter | C | Ob | Ob + BB | Ob + OR |
|---|---|---|---|---|
| Initial body weight | 242.20 ± 34.47 | 256.10 ± 47.24 | 271.90 ± 14.14 | 253.50 ± 36.20 |
| Final body weight (g) | 386.80 ± 40.11 | 444.90 ± 38.62 a | 411.90 ± 36.22 | 405.30 ± 41.25 |
| Mean weight gain (g) | 144.70 ± 53.51 | 188.90 ± 44.80 a | 140.10 ± 32.46 b | 151.80 ± 19.18 |
| Mean daily weight gain (g/day) | 1.72 ± 0.64 | 2.25 ± 0.53 | 1.67 ± 0.39 | 1.81 ± 0.23 |
| Parameter | C | Ob | Ob + BB | Ob + OR |
|---|---|---|---|---|
| Lee obesity index | 305.90 ± 5.88 | 323.10 ± 8.91 a | 304.60 ± 8.12 b | 309.10 ± 6.01 b |
| BMI (gcm−1) | 0.71 ± 0.04 | 0.83 ± 0.06 a | 0.72 ± 0.04 b | 0.73 ± 0.05 b |
| Total feed consumption (g) | 1822.00 ± 125.80 | 1647.00 ± 266.20 | 1560.00 ± 171.40 | 1628.00 ± 232.80 |
| Mean food consumption (g) | 21.69 ± 1.49 | 19.61 ± 3.17 | 18.57 ± 2.04 | 19.38 ± 2.77 |
| Energy intake (kcal/day) | 69.15 ± 4.77 | 101.30 ± 16.37 a | 95.91 ± 10.53 a | 100.10 ± 14.31 a |
| Parameter | C | Ob | Ob + BB | Ob + OR | |
|---|---|---|---|---|---|
| Testis ≠ | AW (g) | 3.75 ± 0.26 | 3.34 ± 0.58 a | 3.52 ± 0.29 | 3.57 ± 0.57 |
| RW (%) | 1.00 ± 0.09 | 0.79 ± 0.19 a | 0.82 ± 0.11 | 0.76 ± 0.17 a | |
| Epididymis ≠ | AW (g) | 1.52 ± 0.28 | 1.32 ± 0.29 | 1.51 ± 0.22 | 1.44 ± 1.17 |
| RW (%) | 0.40 ± 0.07 | 0.31 ± 0.09 | 0.35 ± 0.05 | 0.31 ± 0.06 a | |
| Prostate | AW (g) | 1.22 ± 0.43 | 1.52 ± 0.98 | 1.53 ± 0.61 | 1.68 ± 0.40 |
| RW (%) | 0.31 ± 0.11 | 0.34 ± 0.20 | 0.34 ± 0.12 | 0.35 ± 0.09 | |
| Seminal Vessicle | AW(g) | 1.76 ± 0.30 | 1.97 ± 0.57 | 2.11 ± 0.41 | 2.00 ± 0.52 |
| RW (%) | 0.47 ± 0.08 | 0.45 ± 0.11 | 0.48 ± 0.06 | 0.42 ± 0.12 | |
| Penis | AW (g) | 0.27 ± 0.04 | 0.24 ± 0.03 a | 0.27 ± 0.05 | 0.30 ± 0.03 b |
| RW (%) | 0.07 ± 0.01 | 0.06 ± 0.01 | 0.06 ± 0.01 | 0.06 ± 0.01 | |
| Epididymal Fat | AW (g) | 3.77 ± 1.33 | 10.38 ± 4.27 a | 7.87 ± 5.89 b | 9.54 ± 3.92 a |
| RW (%) | 0.99 ± 0.28 | 2.33 ± 0.74 a | 1.74 ± 1.08 | 1.92 ± 0.54 |
| Parameter | C | Ob | Ob + BB | Ob + OR |
|---|---|---|---|---|
| TC (mmol/L) | 1.61 ± 0.18 | 2.36 ± 0.76 a | 1.89 ± 0.20 | 2.11 ± 0.17 |
| TG (mmol/L) | 0.50 ± 0.07 | 0.93 ± 0.09 a | 0.71 ± 0.15 | 0.93 ± 0.28 a |
| HDL-C (mmol/L) | 0.42 ± 0.10 | 0.22 ± 0.15 a | 0.40 ± 0.04 b | 0.37 ± 0.09 |
| LDL-C (mmol/L) | 0.63 ± 0.05 | 1.56 ± 0.15 a | 1.25 ± 0.14 a,b | 1.35 ± 0.21 a |
| Parameters | C | Ob | Ob + BB | Ob + OR |
|---|---|---|---|---|
| CAT activity (unit/mg protein) | 32.88 ± 3.92 | 14.86 ± 3.29 a | 25.80 ± 3.11 a,b | 23.12 ± 1.63 a,b |
| GPx activity (unit/mg protein) | 43.60 ± 2.19 | 20.13 ± 1.88 a | 41.30 ± 3.14 b | 37.79 ± 1.80 a,b,c |
| GR activity (unit/mg protein) | 43.92 ± 2.62 | 16.99 ± 1.79 a | 46.71 ± 6.53 b | 42.26 ± 3.77 b |
| GSH (mmol GSH Eq/mg protein) | 10.73 ± 1.60 | 19.76 ± 5.41 a | 13.94 ± 2.38 b | 13.83 ± 5.00 b |
| GST activity (unit/mg protein) | 257.20 ± 26.93 | 151.40 ± 17.32 a | 272.2 ± 24.37 b | 250.70 ± 32.41 b |
| iNOS activity (ng/mL protein) | 1.80 ± 0.63 | 7.31 ± 1.06 a | 3.01 ± 0.79 a,b | 1.80 ± 0.51 b |
| MDA (nmol/mg protein) | 1.27 ± 0.12 | 12.01 ± 0.76 a | 1.70 ± 0.28 b | 1.38 ± 0.33 b |
| SOD activity (unit/mg protein) | 2.78 ± 0.12 | 0.29 ± 0.05 a | 2.31 ± 0.08 b | 2.31 ± 0.09 b |
| TAC (nmol uric acid Eq/mg protein) | 137.90 ± 4.64 | 63.64 ± 6.01 a | 131.30 ± 10.85 b | 128.70 ± 6.74 b |
Publisher’s Note: MDPI stays neutral with regard to jurisdictional claims in published maps and institutional affiliations. |
© 2022 by the authors. Licensee MDPI, Basel, Switzerland. This article is an open access article distributed under the terms and conditions of the Creative Commons Attribution (CC BY) license (https://creativecommons.org/licenses/by/4.0/).
Share and Cite
Suleiman, J.B.; Mohamed, M.; Abu Bakar, A.B.; Zakaria, Z.; Othman, Z.A.; Nna, V.U. Therapeutic Effects of Bee Bread on Obesity-Induced Testicular-Derived Oxidative Stress, Inflammation, and Apoptosis in High-Fat Diet Obese Rat Model. Antioxidants 2022, 11, 255. https://doi.org/10.3390/antiox11020255
Suleiman JB, Mohamed M, Abu Bakar AB, Zakaria Z, Othman ZA, Nna VU. Therapeutic Effects of Bee Bread on Obesity-Induced Testicular-Derived Oxidative Stress, Inflammation, and Apoptosis in High-Fat Diet Obese Rat Model. Antioxidants. 2022; 11(2):255. https://doi.org/10.3390/antiox11020255
Chicago/Turabian StyleSuleiman, Joseph Bagi, Mahaneem Mohamed, Ainul Bahiyah Abu Bakar, Zaida Zakaria, Zaidatul Akmal Othman, and Victor Udo Nna. 2022. "Therapeutic Effects of Bee Bread on Obesity-Induced Testicular-Derived Oxidative Stress, Inflammation, and Apoptosis in High-Fat Diet Obese Rat Model" Antioxidants 11, no. 2: 255. https://doi.org/10.3390/antiox11020255
APA StyleSuleiman, J. B., Mohamed, M., Abu Bakar, A. B., Zakaria, Z., Othman, Z. A., & Nna, V. U. (2022). Therapeutic Effects of Bee Bread on Obesity-Induced Testicular-Derived Oxidative Stress, Inflammation, and Apoptosis in High-Fat Diet Obese Rat Model. Antioxidants, 11(2), 255. https://doi.org/10.3390/antiox11020255