
Trans-(±)-Kusunokinin Binding to AKR1B1 Inhibits Oxidative Stress and Proteins Involved in Migration in Aggressive Breast Cancer


Abstract
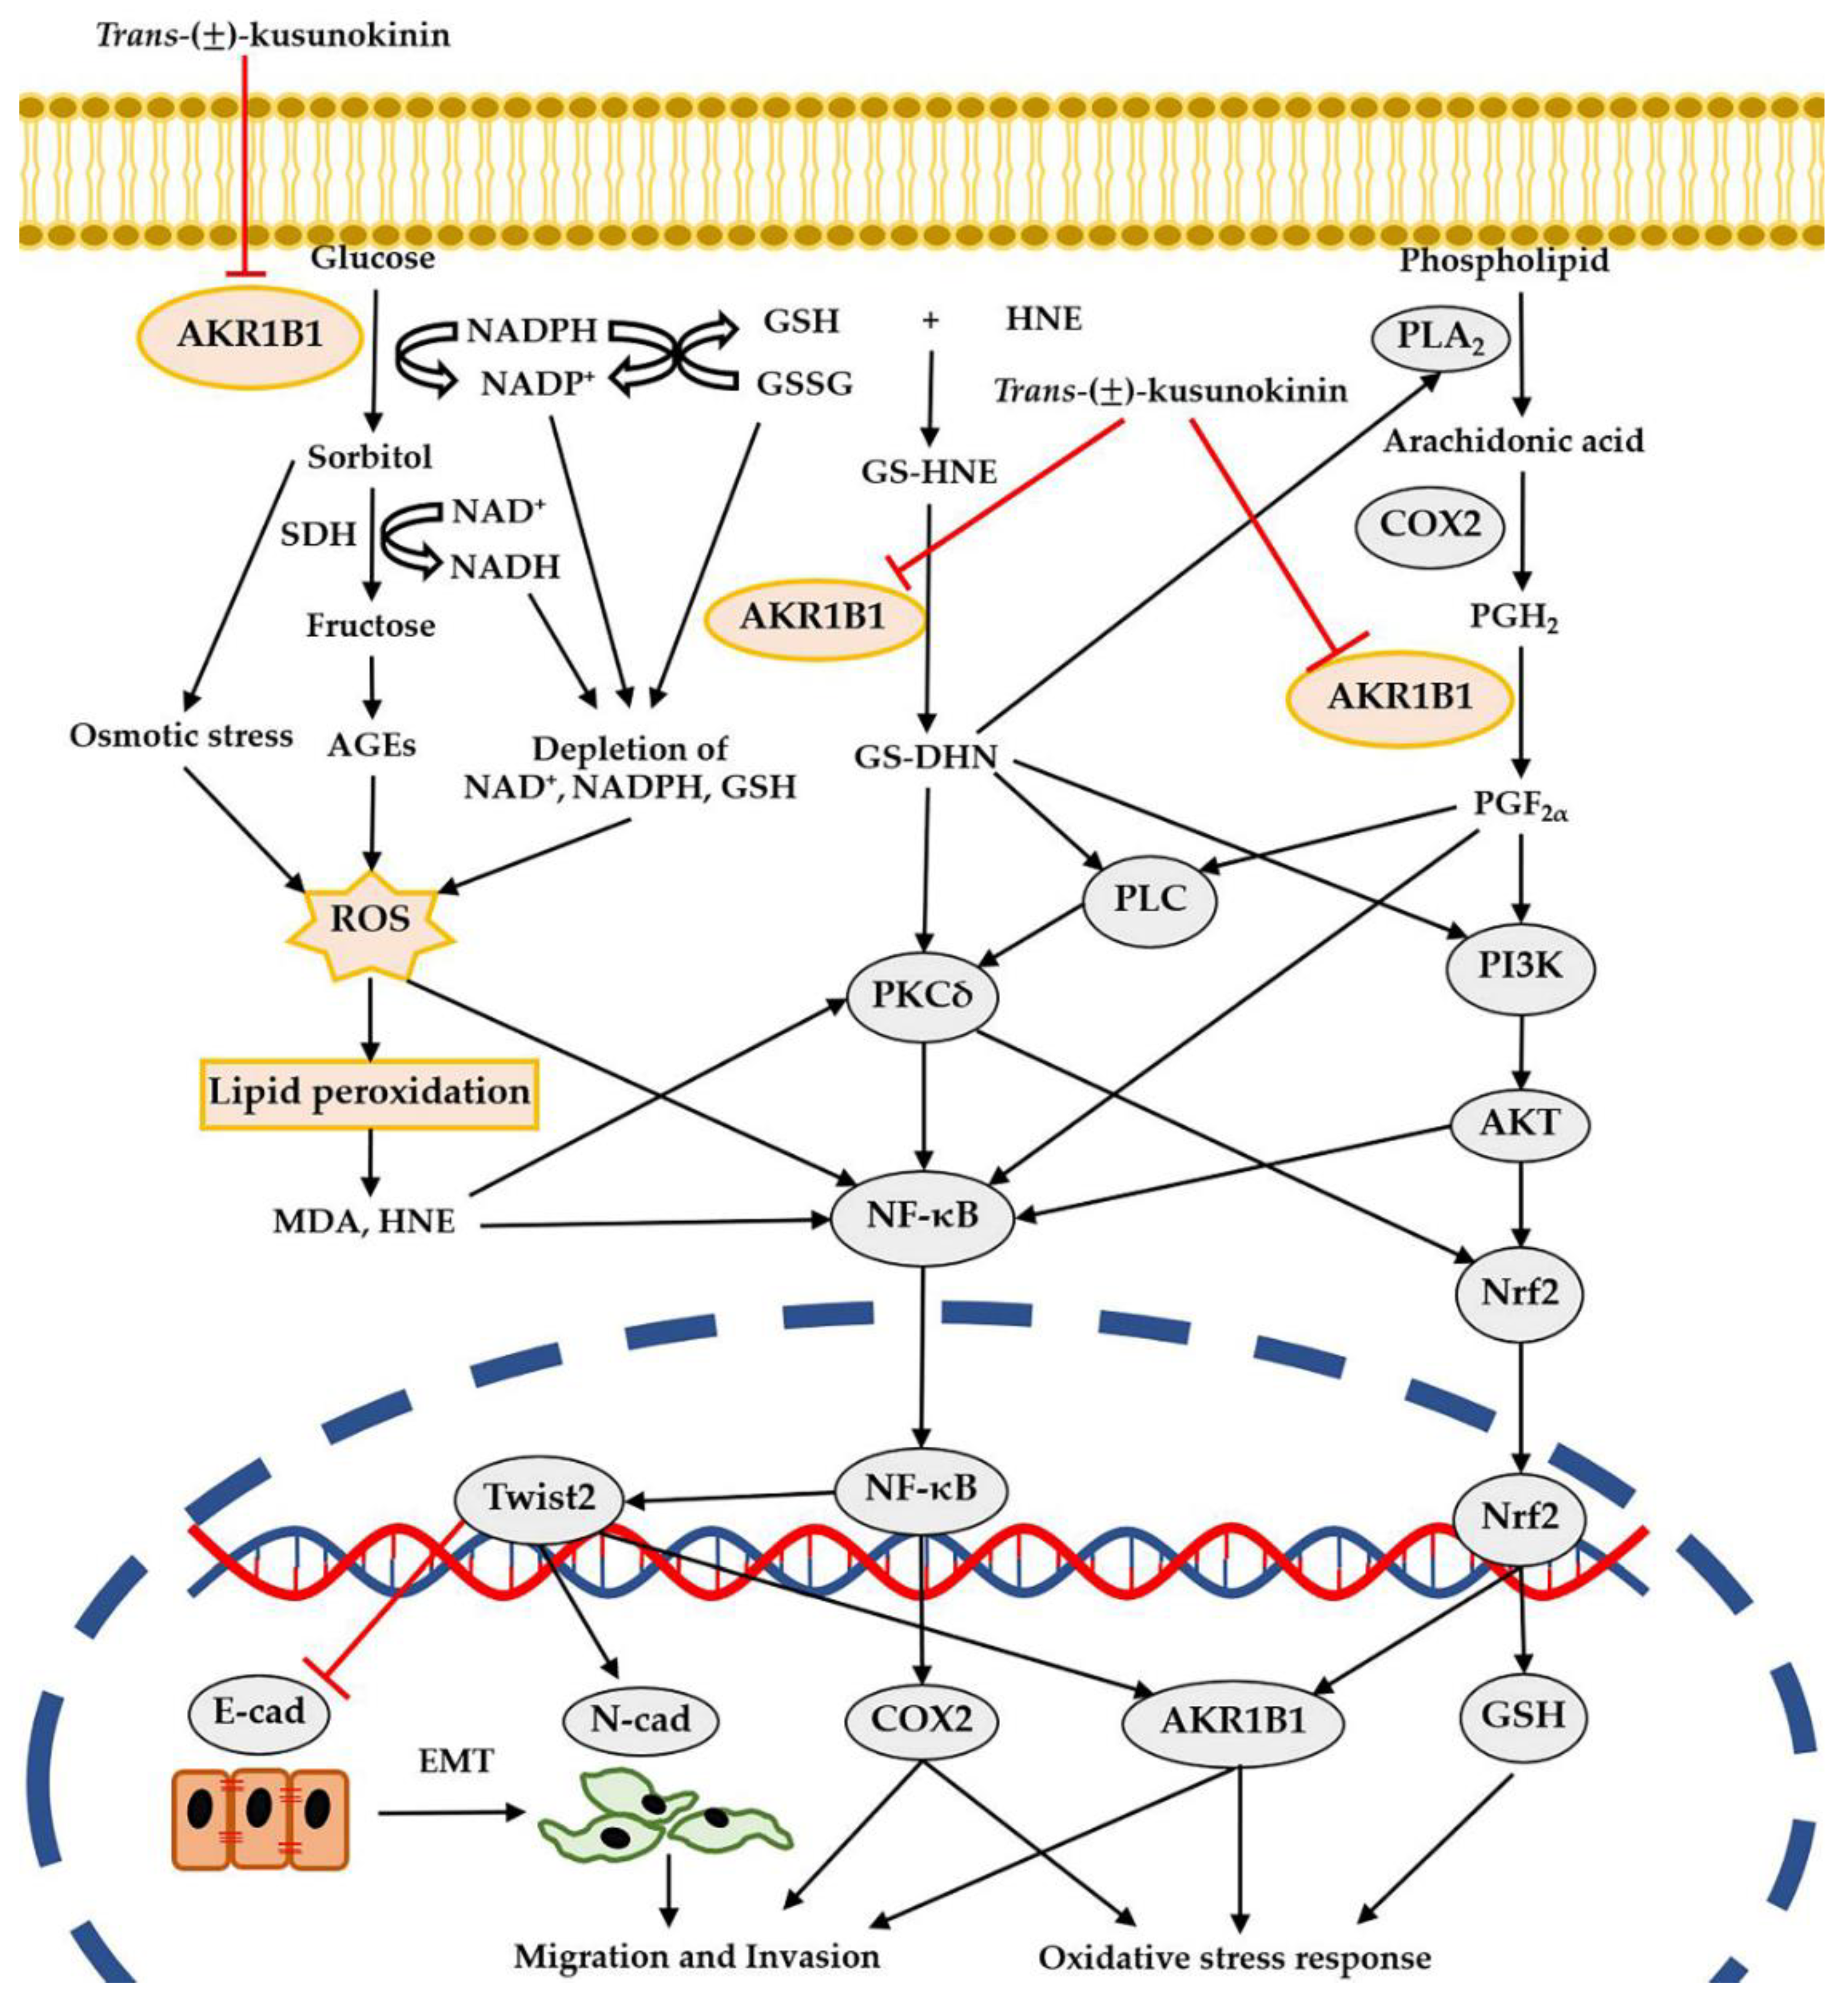
1. Introduction
2. Materials and Methods
2.1. Cell Culture Condition
2.2. Substances
2.3. Cell Viability
2.4. Aldose Reductase Activity Assay
2.5. Cellular Thermal Shift Assay (CETSA)
2.6. Thiobarbituric Acid Reactive Substances (TBARS) Assay
2.7. Western Blot Analysis
2.8. Small Interfering RNA Condition
2.9. Statistical Analysis
3. Results
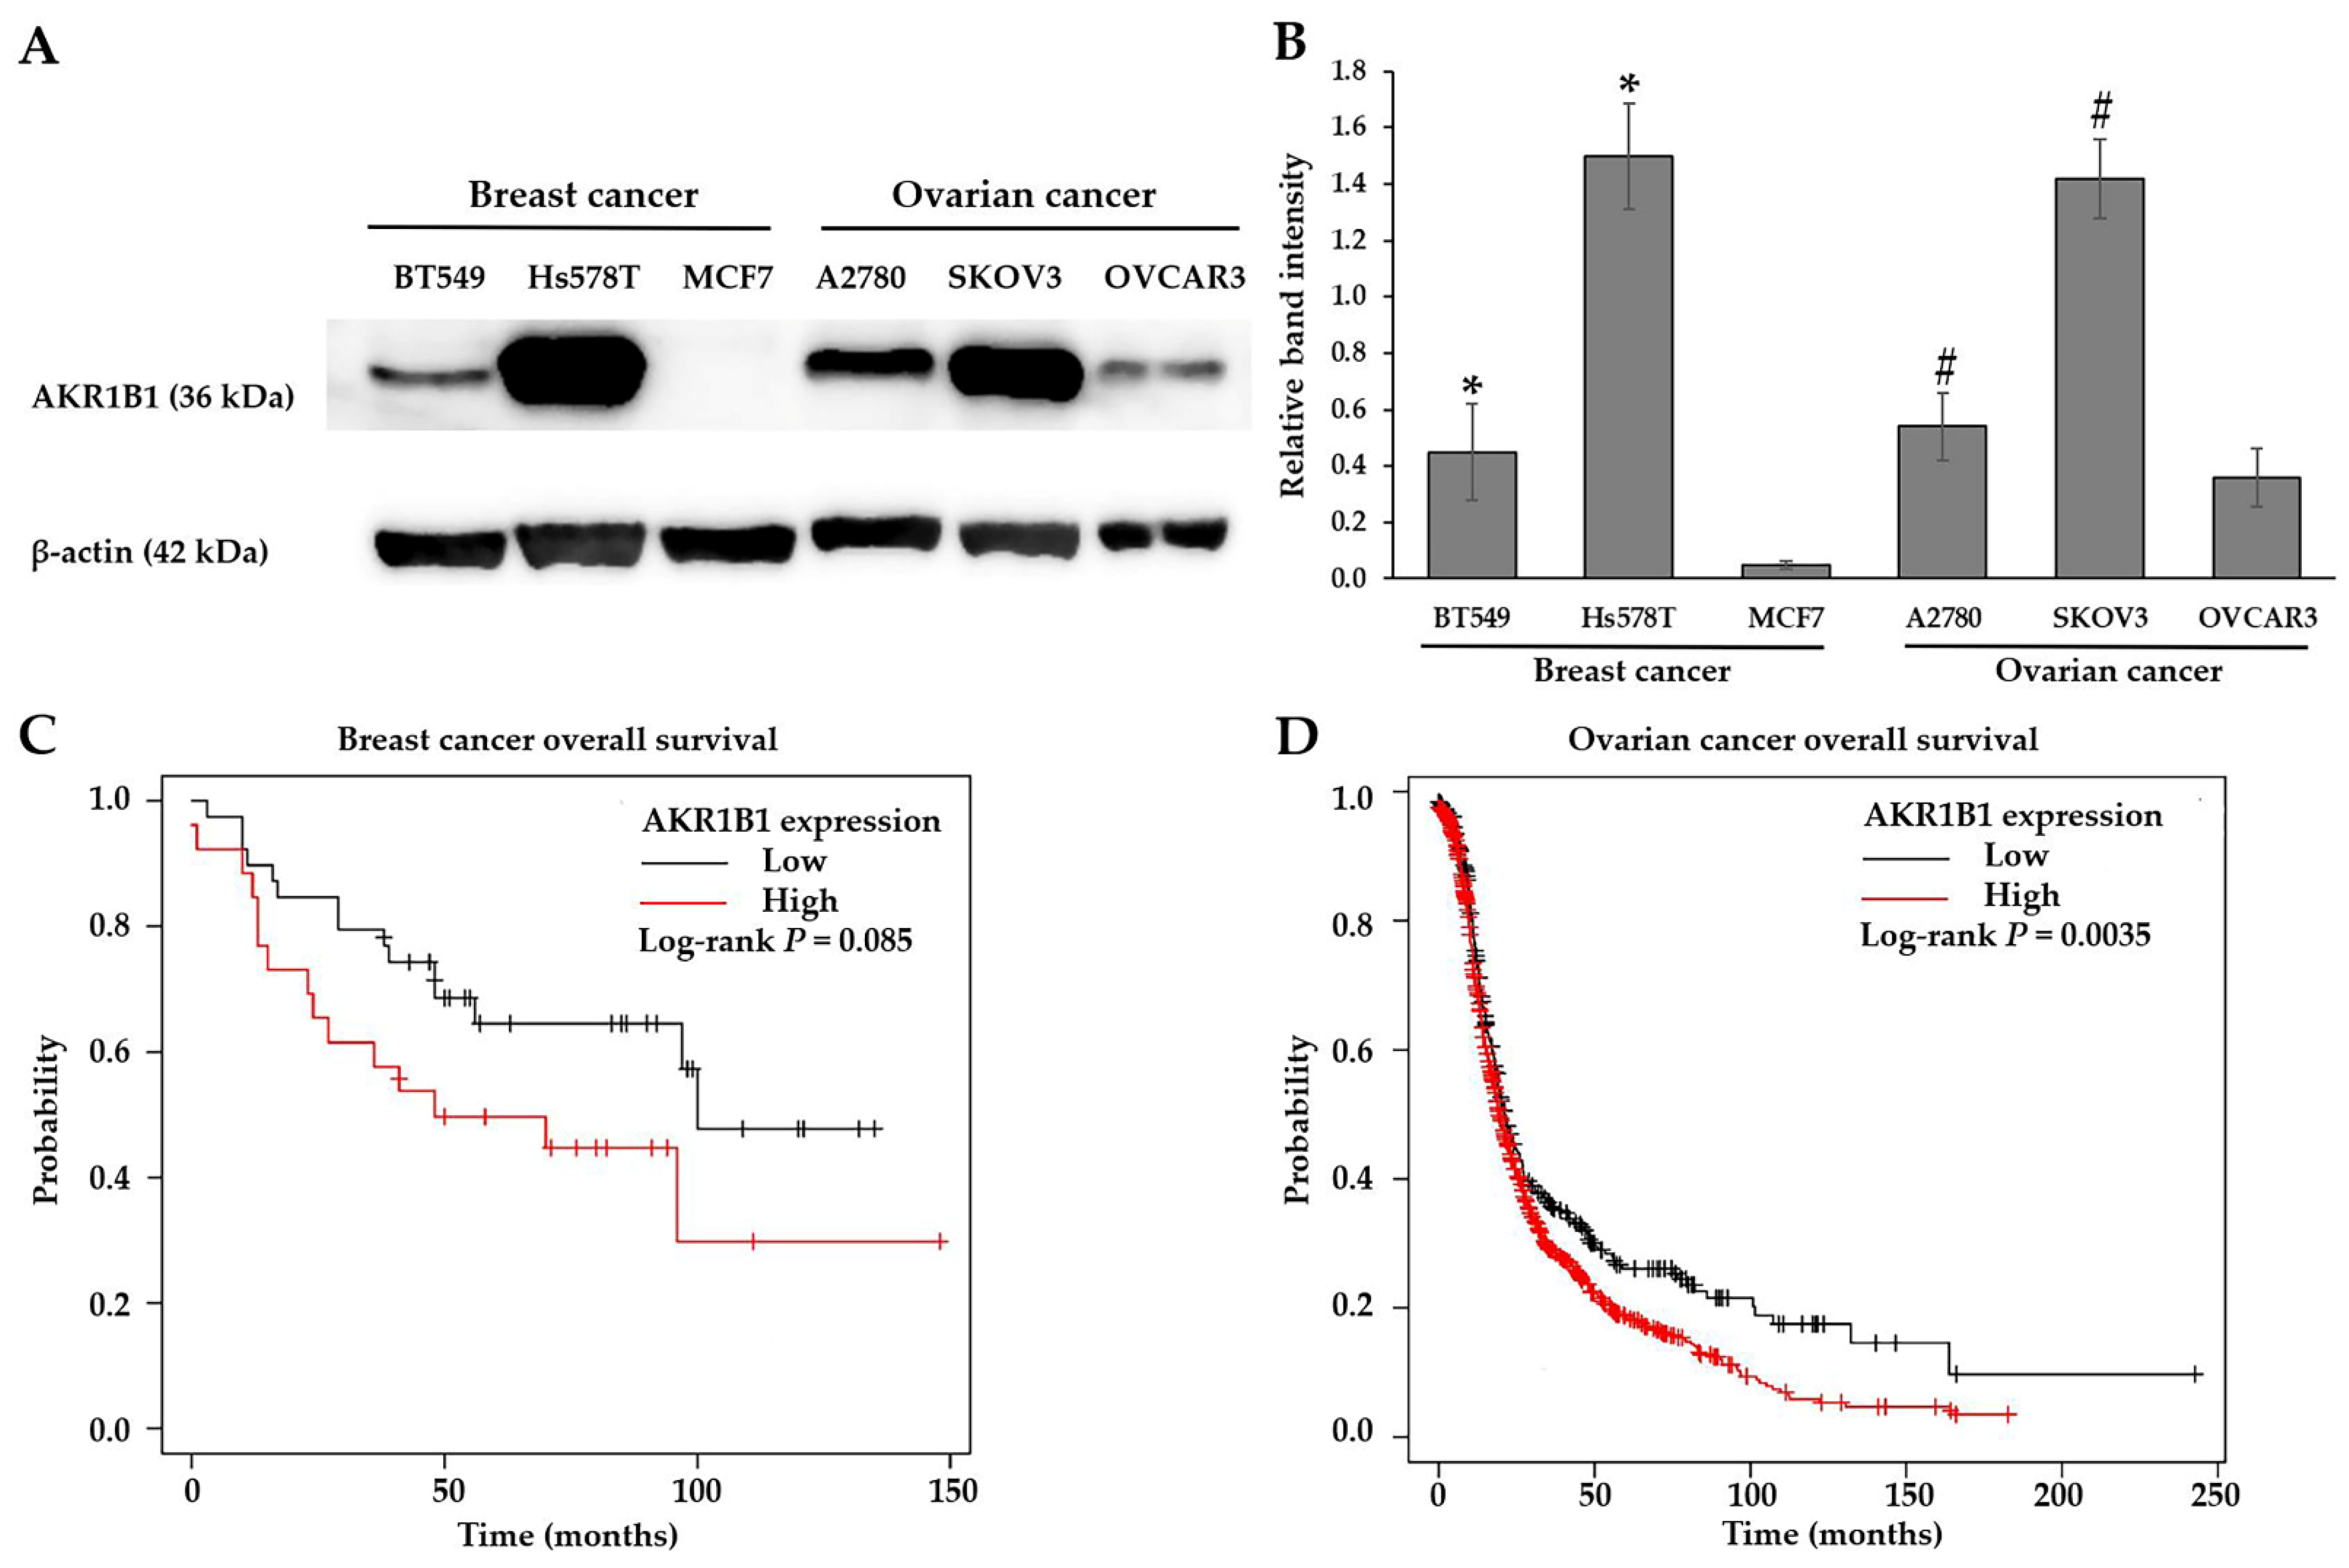
3.1. AKR1B1 Overexpression Correlated with Aggressive Migration Cell Type (TNBC and NS Cells) and Poor Prognosis
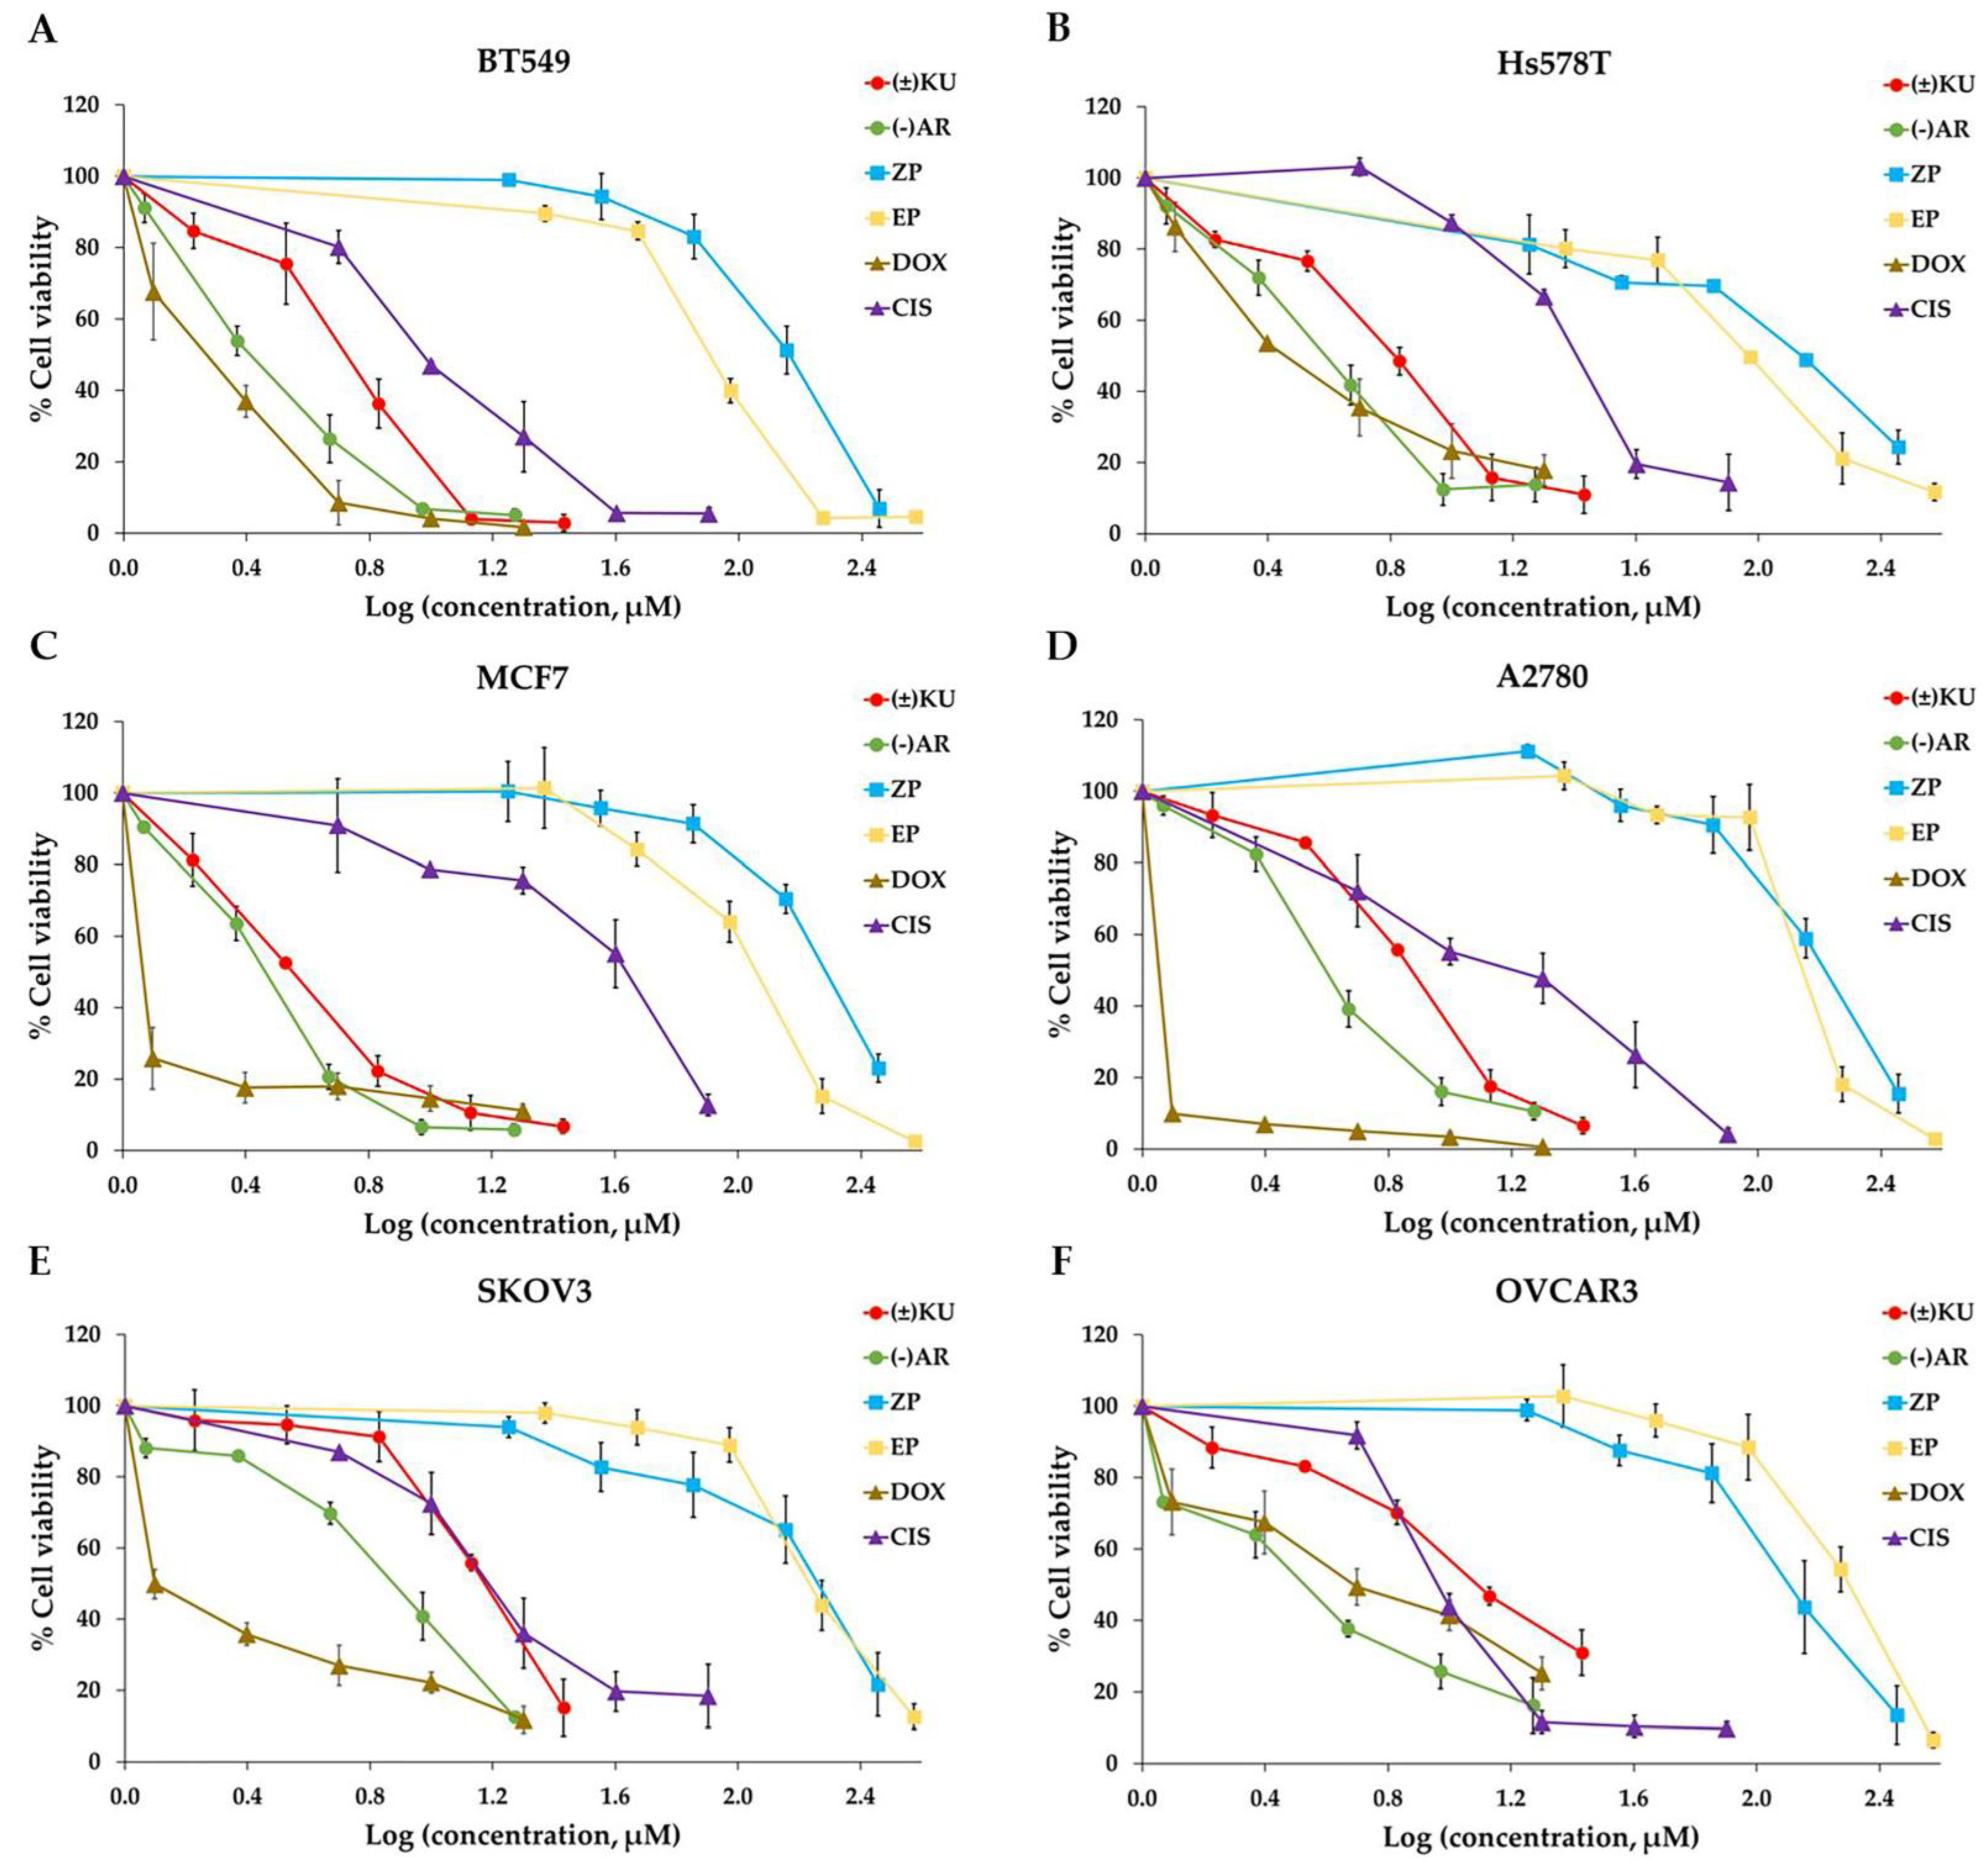
3.2. Cytotoxic Effect of (±)KU on Breast and Ovarian Cancer Cells
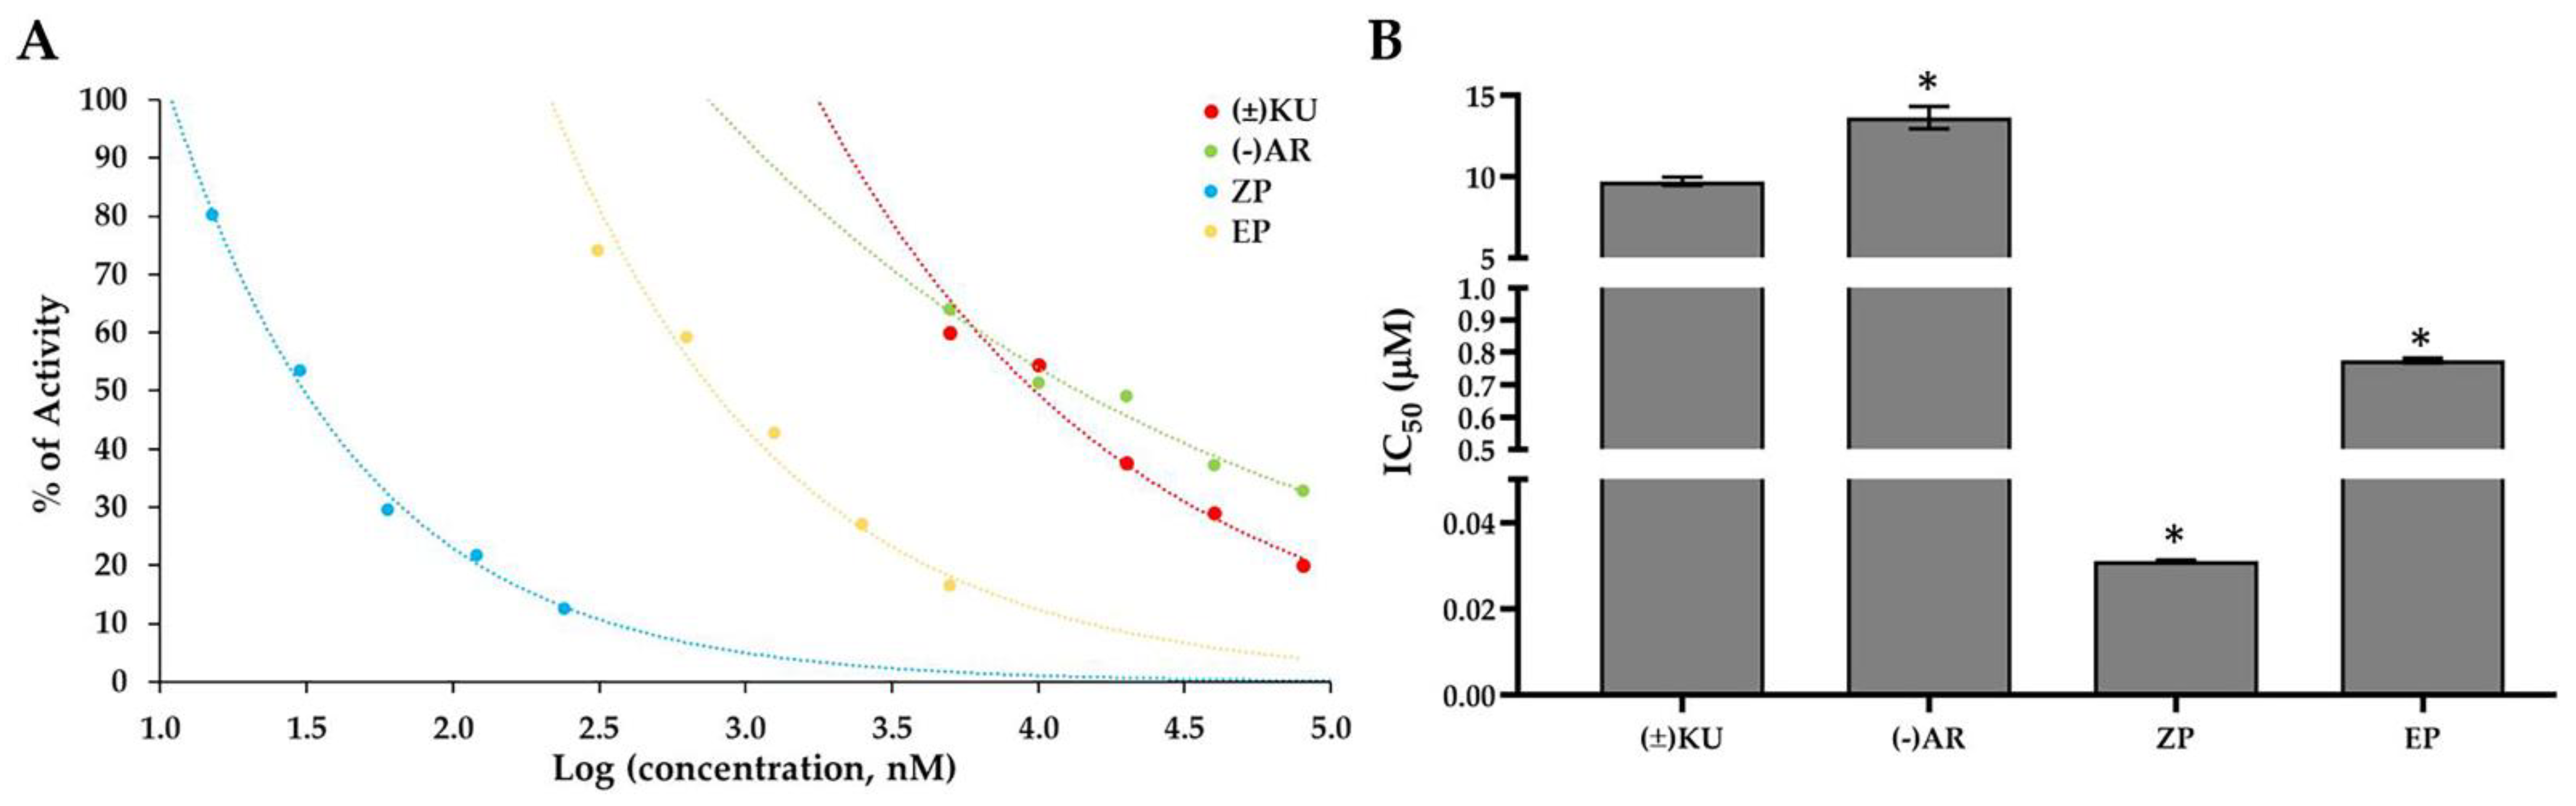
3.3. Aldose Reductase Activity
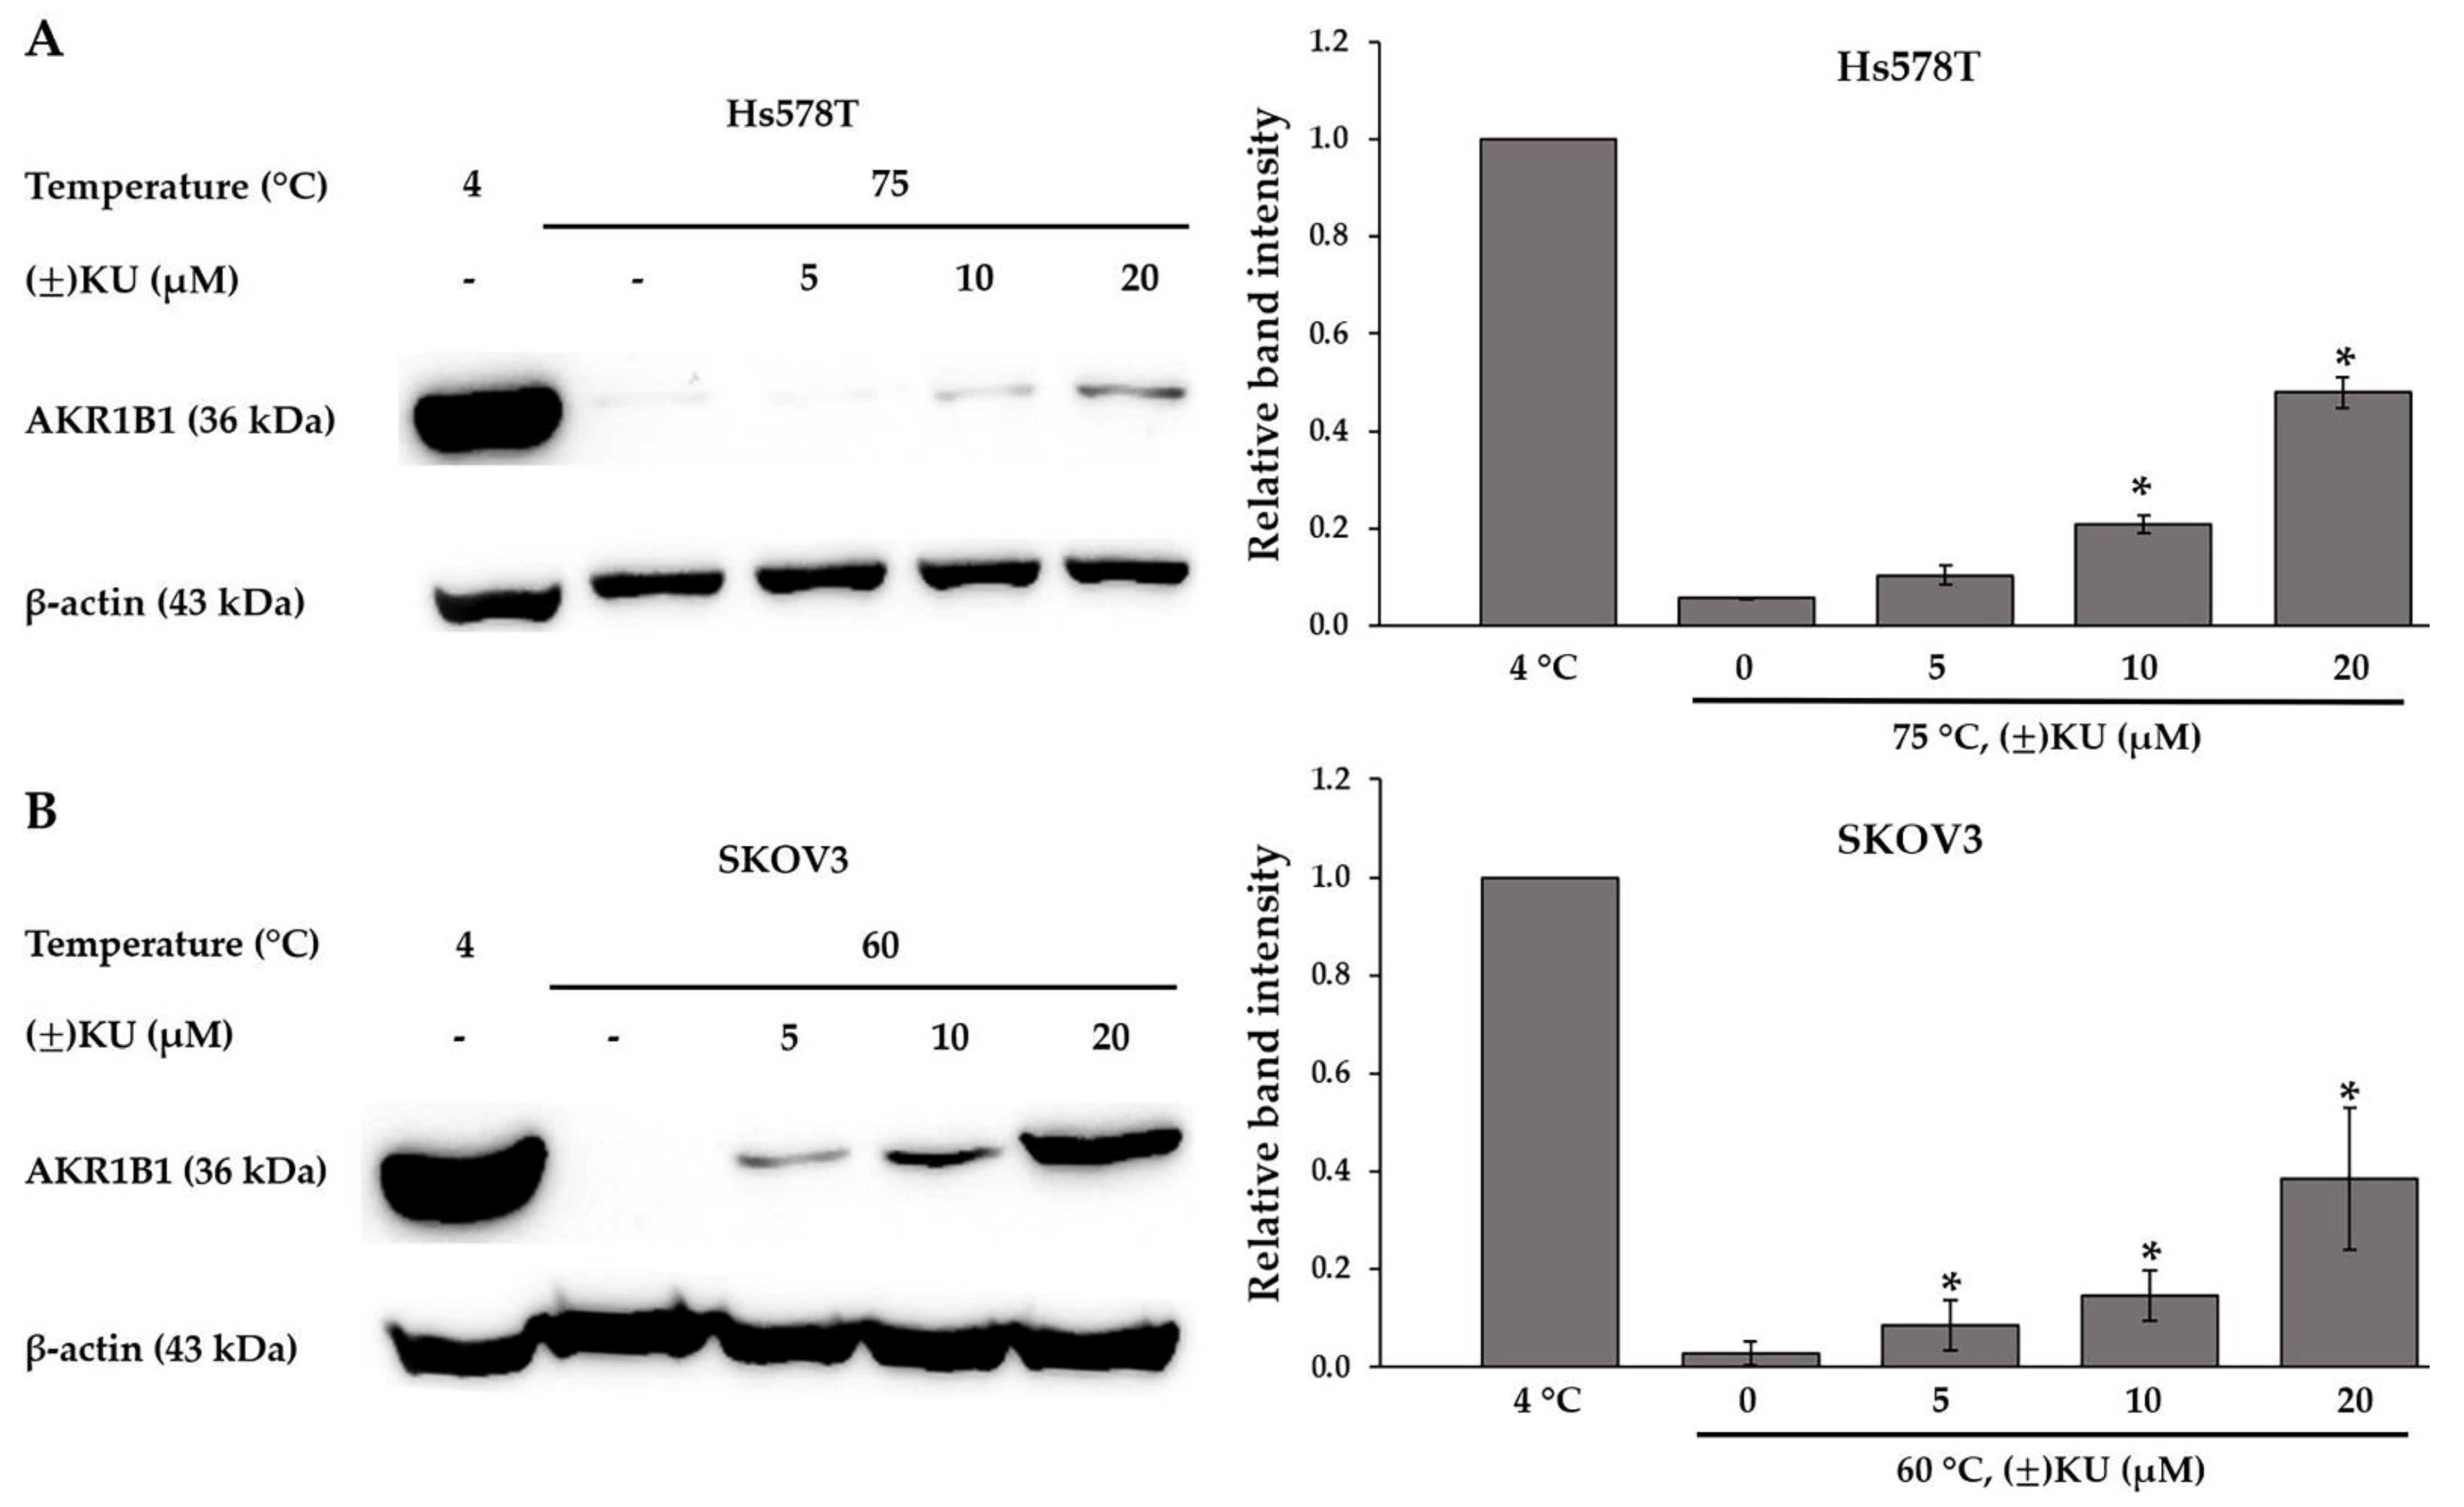
3.4. Cellular Thermal Shift Assay (CETSA)
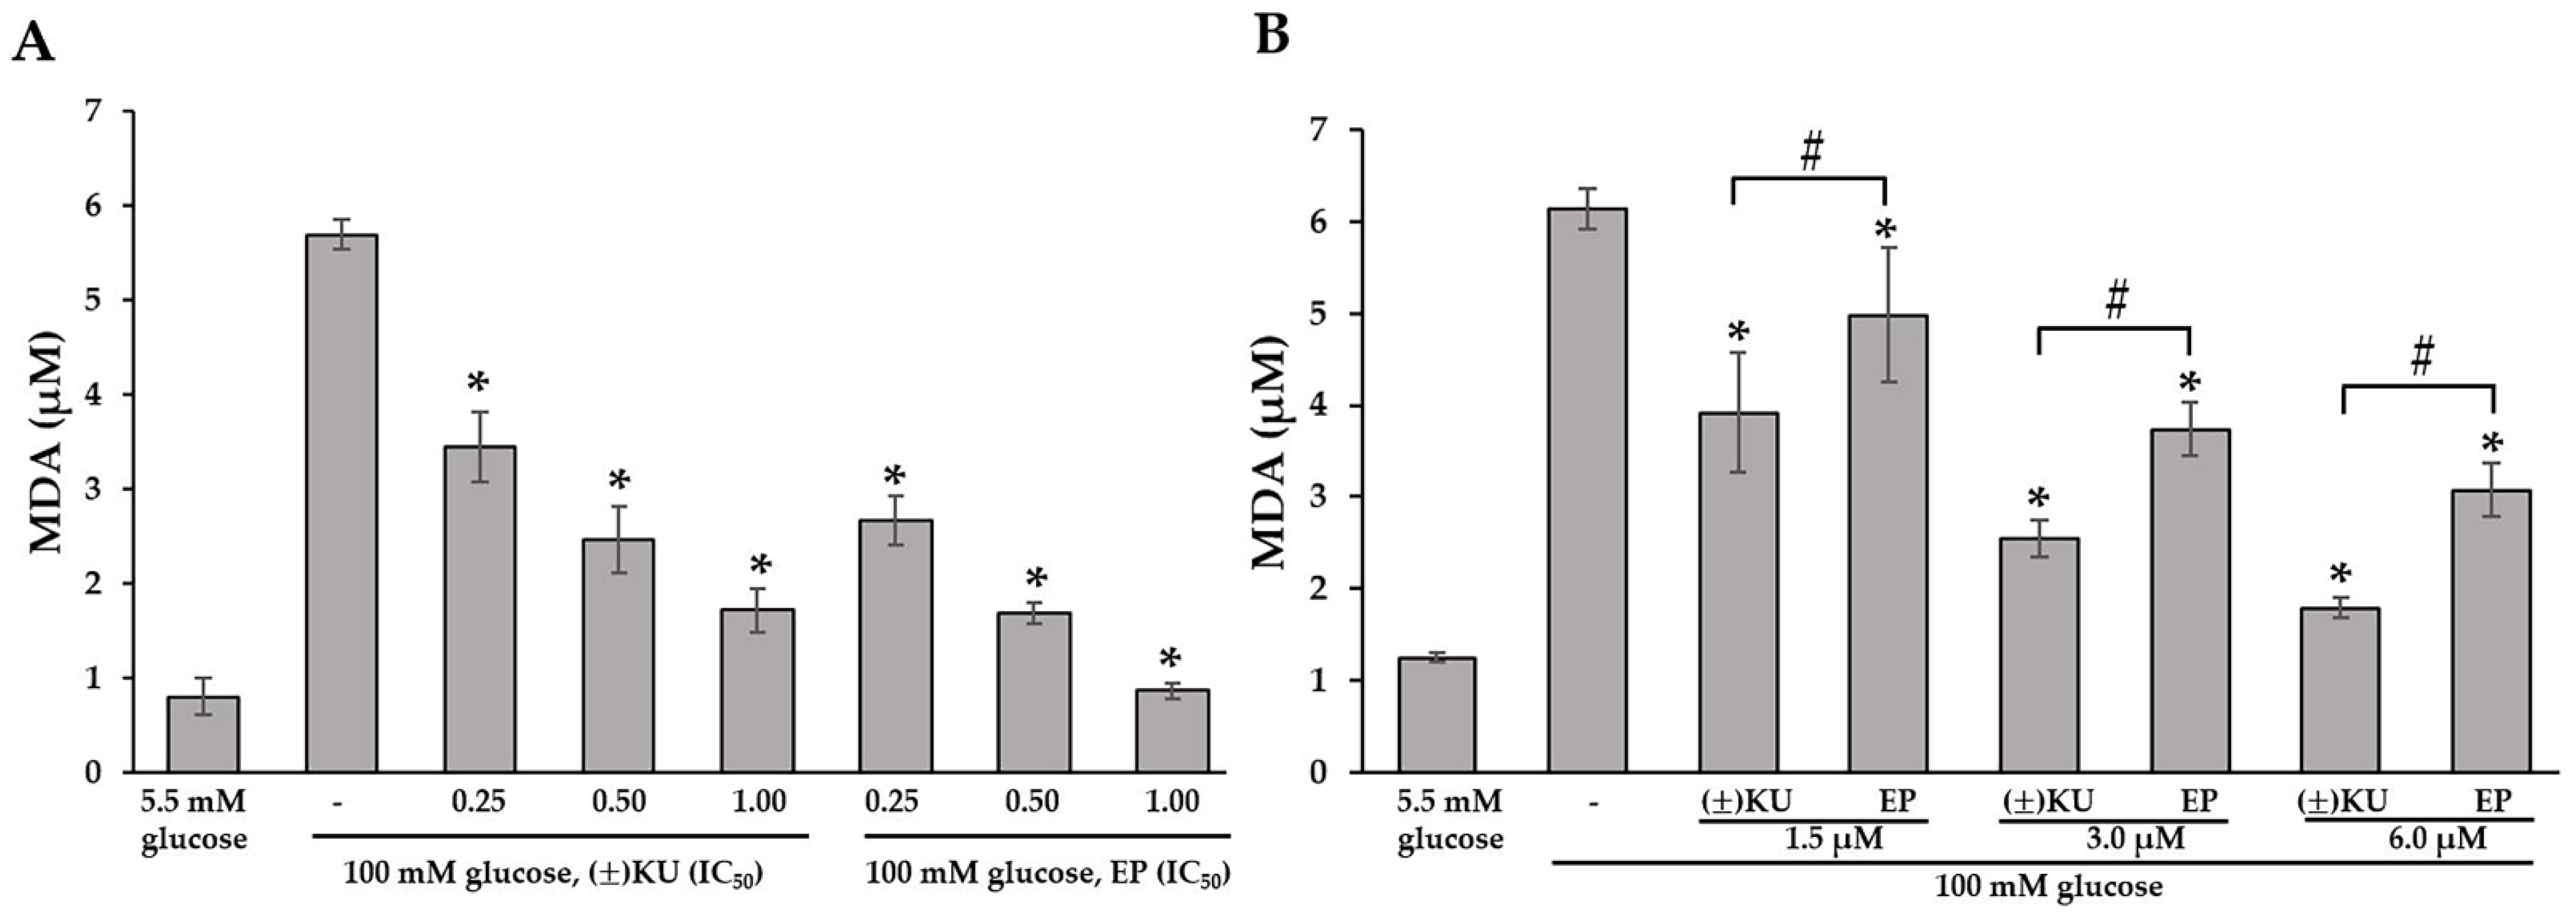
3.5. (±)KU Inhibited Lipid Peroxidation in High-Glucose Condition
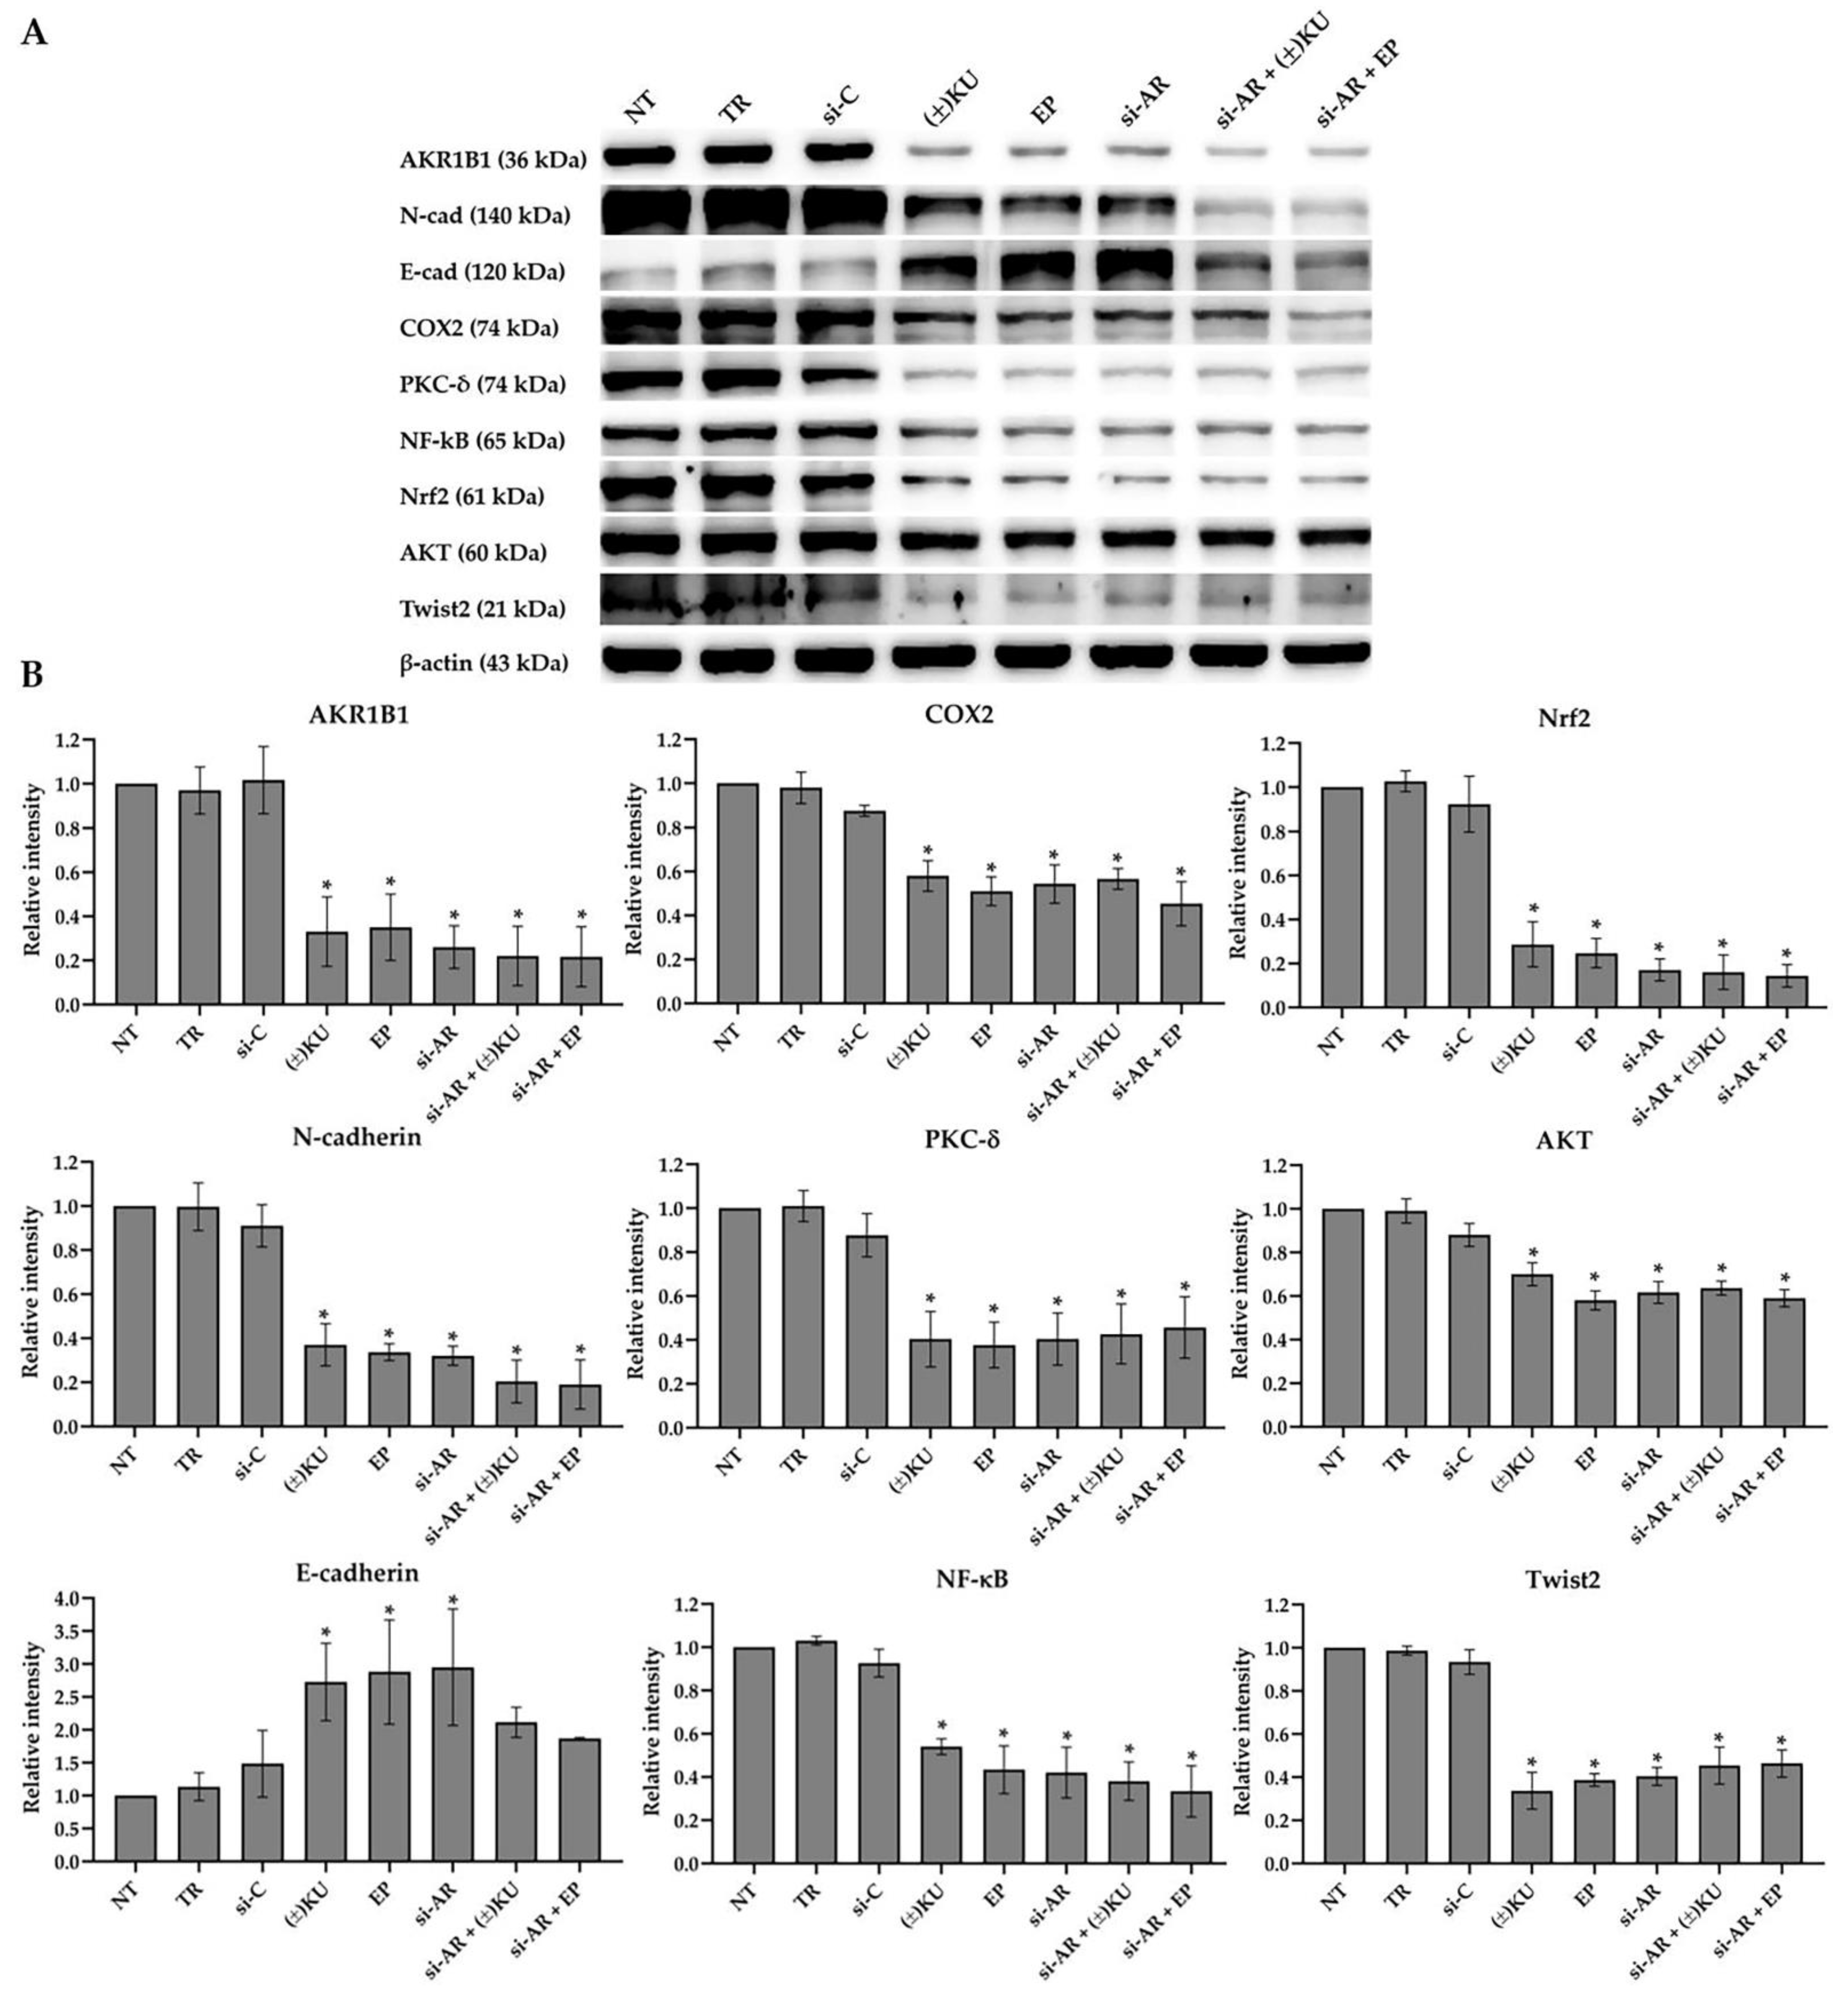
3.6. (±)KU Suppressed AKR1B1 Level in a Dose-Dependent Manner
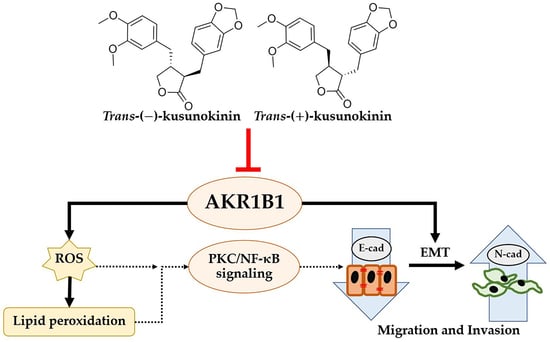
3.7. Down-Regulation of AKR1B1 by (±)KU Leads to Alteration in Signaling Molecules of Oxidative Stress and EMT Markers
4. Discussion
5. Conclusions
Supplementary Materials
Author Contributions
Funding
Institutional Review Board Statement
Informed Consent Statement
Data Availability Statement
Conflicts of Interest
References
- Sung, H.; Ferlay, J.; Siegel, R.L.; Laversanne, M.; Soerjomataram, I.; Jemal, A.; Bray, F. Global cancer statistics 2020: GLOBOCAN estimates of incidence and mortality worldwide for 36 cancers in 185 countries. CA Cancer J. Clin. 2021, 71, 209–249. [Google Scholar] [CrossRef]
- Wojtyla, C.; Bertuccio, P.; Wojtyla, A.; La Vecchia, C. European trends in breast cancer mortality, 1980–2017 and predictions to 2025. Eur. J. Cancer 2021, 152, 4–17. [Google Scholar] [CrossRef]
- Hendrick, R.E.; Helvie, M.A.; Monticciolo, D.L. Breast cancer mortality rates have stopped declining in U.S. women younger than 40 years. Radiology 2021, 299, 143–149. [Google Scholar] [CrossRef] [PubMed]
- Koedoot, E.; Fokkelman, M.; Rogkoti, V.M.; Smid, M.; van de Sandt, I.; de Bont, H.; Pont, C.; Klip, J.E.; Wink, S.; Timmermans, M.A.; et al. Uncovering the signaling landscape controlling breast cancer cell migration identifies novel metastasis driver genes. Nat. Commun. 2019, 10, 2983. [Google Scholar] [CrossRef]
- Hallas-Potts, A.; Dawson, J.C.; Herrington, C.S. Ovarian cancer cell lines derived from non-serous carcinomas migrate and invade more aggressively than those derived from high-grade serous carcinomas. Sci. Rep. 2019, 9, 5515. [Google Scholar] [CrossRef] [PubMed]
- O’Neill, S.; Porter, R.K.; McNamee, N.; Martinez, V.G.; O’Driscoll, L. 2-Deoxy-D-Glucose inhibits aggressive triple-negative breast cancer cells by targeting glycolysis and the cancer stem cell phenotype. Sci. Rep. 2019, 9, 3788. [Google Scholar] [CrossRef]
- Gelmon, K.A.; Tischkowitz, M.; Mackay, H.; Swenerton, K.; Robidoux, A.; Tonkin, K.; Hirte, H.; Huntsman, D.; Clemons, M.; Gilks, B.; et al. Olaparib in patients with recurrent high-grade serous or poorly differentiated ovarian carcinoma or triple-negative breast cancer: A phase 2, multicentre, open-label, non-randomised study. Lancet Oncol. 2011, 12, 852–861. [Google Scholar] [CrossRef] [PubMed]
- Prasad, V.; De Jesus, K.; Mailankody, S. The high price of anticancer drugs: Origins, implications, barriers, solutions. Nat. Rev. Clin. Oncol. 2017, 14, 381–390. [Google Scholar] [CrossRef] [PubMed]
- Rattanaburee, T.; Thongpanchang, T.; Wongma, K.; Tedasen, A.; Sukpondma, Y.; Graidist, P. Anticancer activity of synthetic (+/−)-kusunokinin and its derivative (+/−)-bursehernin on human cancer cell lines. Biomed. Pharmacother. 2019, 117, 109115. [Google Scholar] [CrossRef]
- Mad-Adam, N.; Rattanaburee, T.; Tanawattanasuntorn, T.; Graidist, P. Effects of trans-(+/−)-kusunokinin on chemosensitive and chemoresistant ovarian cancer cells. Oncol. Lett. 2022, 23, 59. [Google Scholar] [CrossRef] [PubMed]
- Tedasen, A.; Dokduang, S.; Sukpondma, Y.; Lailerd, N.; Madla, S.; Sriwiriyajan, S.; Rattanaburee, T.; Tipmanee, V.; Graidist, P. (−)-Kusunokinin inhibits breast cancer in N-nitrosomethylurea-induced mammary tumor rats. Eur. J. Pharm. 2020, 882, 173311. [Google Scholar] [CrossRef]
- Rattanaburee, T.; Tipmanee, V.; Tedasen, A.; Thongpanchang, T.; Graidist, P. Inhibition of CSF1R and AKT by (+/−)-kusunokinin hinders breast cancer cell proliferation. Biomed Pharm. 2020, 129, 110361. [Google Scholar] [CrossRef] [PubMed]
- Chompunud Na Ayudhya, C.; Graidist, P.; Tipmanee, V. Potential stereoselective binding of trans-(+/−)-kusunokinin and cis-(+/−)-kusunokinin isomers to CSF1R. Molecules 2022, 27, 4194. [Google Scholar] [CrossRef] [PubMed]
- Tanawattanasuntorn, T.; Thongpanchang, T.; Rungrotmongkol, T.; Hanpaibool, C.; Graidist, P.; Tipmanee, V. (−)-Kusunokinin as a potential aldose reductase inhibitor: Equivalency observed via AKR1B1 dynamics simulation. ACS Omega 2021, 6, 606–614. [Google Scholar] [CrossRef]
- Han, Z.; Qi, G.; Zhu, J.; Zhang, Y.; Xu, Y.; Yan, K.; Zhu, C.; Hao, X. Novel 3,4-dihydroquinolin-2(1H)-one derivatives as dual inhibitor targeting AKR1B1/ROS for treatment of diabetic complications: Design, synthesis and biological evaluation. Bioorg. Chem. 2020, 105, 104428. [Google Scholar] [CrossRef] [PubMed]
- Wu, X.; Li, X.; Fu, Q.; Cao, Q.; Chen, X.; Wang, M.; Yu, J.; Long, J.; Yao, J.; Liu, H.; et al. AKR1B1 promotes basal-like breast cancer progression by a positive feedback loop that activates the EMT program. J. Exp. Med. 2017, 214, 1065–1079. [Google Scholar] [CrossRef]
- Saraswat, M.; Mrudula, T.; Kumar, P.U.; Suneetha, A.; Rao Rao, T.S.; Srinivasulu, M.; Reddy, B. Overexpression of aldose reductase in human cancer tissues. Med. Sci. Monit. 2006, 12, CR525-529. [Google Scholar] [PubMed]
- Khaled, N.; Bidet, Y. New insights into the implication of epigenetic alterations in the EMT of triple negative breast cancer. Cancers 2019, 11, 559. [Google Scholar] [CrossRef]
- Banala, V.T.; Urandur, S.; Sharma, S.; Sharma, M.; Shukla, R.P.; Marwaha, D.; Gautam, S.; Dwivedi, M.; Mishra, P.R. Targeted co-delivery of the aldose reductase inhibitor epalrestat and chemotherapeutic doxorubicin via a redox-sensitive prodrug approach promotes synergistic tumor suppression. Biomater. Sci. 2019, 7, 2889–2906. [Google Scholar] [CrossRef] [PubMed]
- Ramirez, M.A.; Borja, N.L. Epalrestat: An aldose reductase inhibitor for the treatment of diabetic neuropathy. Pharmacotherapy 2008, 28, 646–655. [Google Scholar] [CrossRef]
- Yang, C.; Cao, M.; Liu, Y.; He, Y.; Yang, C.; Du, Y.; Wang, W.; Zhang, G.; Wu, M.; Zhou, M.; et al. Inhibition of cell invasion and migration by CEACAM1-4S in breast cancer. Oncol. Lett. 2017, 14, 4758–4766. [Google Scholar] [CrossRef]
- Sriwiriyajan, S.; Ninpesh, T.; Sukpondma, Y.; Nasomyon, T.; Graidist, P. Cytotoxicity screening of plants of genus Piper in breast cancer cell lines. Trop. J. Pharm. Res. 2014, 13, 921–928. [Google Scholar] [CrossRef]
- Jafari, R.; Almqvist, H.; Axelsson, H.; Ignatushchenko, M.; Lundback, T.; Nordlund, P.; Martinez Molina, D. The cellular thermal shift assay for evaluating drug target interactions in cells. Nat. Protoc. 2014, 9, 2100–2122. [Google Scholar] [CrossRef] [PubMed]
- Graidist, P.; Phongdara, A.; Fujise, K. Antiapoptotic protein partners fortilin and MCL1 independently protect cells from 5-fluorouracil-induced cytotoxicity. J. Biol. Chem. 2004, 279, 40868–40875. [Google Scholar] [CrossRef]
- Sriwiriyajan, S.; Sukpondma, Y.; Srisawat, T.; Madla, S.; Graidist, P. (−)-Kusunokinin and piperloguminine from Piper nigrum: An alternative option to treat breast cancer. Biomed Pharm. 2017, 92, 732–743. [Google Scholar] [CrossRef]
- Dai, X.; Cheng, H.; Bai, Z.; Li, J. Breast cancer cell line classification and its relevance with breast tumor subtyping. J. Cancer 2017, 8, 3131–3141. [Google Scholar] [CrossRef]
- Rattanaburee, T.; Tanawattanasuntorn, T.; Thongpanchang, T.; Tipmanee, V.; Graidist, P. Trans-(−)-kusunokinin: A potential anticancer lignan compound against HER2 in breast cancer cell lines? Molecules 2021, 26, 4537. [Google Scholar] [CrossRef]
- Cui, Z.; Li, C.; Chen, P.; Yang, H. An update of label-free protein target identification methods for natural active products. Theranostics 2022, 12, 1829–1854. [Google Scholar] [CrossRef]
- Peng, W.; Shen, H.; Lin, B.; Han, P.; Li, C.; Zhang, Q.; Ye, B.; Rahman, K.; Xin, H.; Qin, L.; et al. Docking study and antiosteoporosis effects of a dibenzylbutane lignan isolated from Litsea cubeba targeting Cathepsin K and MEK1. Med. Chem. Res. 2018, 27, 2062–2070. [Google Scholar] [CrossRef]
- Xie, H.; Wang, T.; Matsuda, H.; Morikawa, T.; Yoshikawa, M.; Tani, T. Bioactive constituents from Chinese natural medicines. XV. Inhibitory effect on aldose reductase and structures of Saussureosides A and B from Saussurea medusa. Chem. Pharm. Bull. 2005, 53, 1416–1422. [Google Scholar] [CrossRef]
- Gu, J.; Wang, J.J.; Yan, J.; Cui, C.F.; Wu, W.H.; Li, L.; Wang, Z.S.; Yu, M.; Gao, N.; Liu, L.; et al. Effects of lignans extracted from Eucommia ulmoides and aldose reductase inhibitor epalrestat on hypertensive vascular remodeling. J. Ethnopharmacol. 2011, 133, 6–13. [Google Scholar] [CrossRef] [PubMed]
- Xu, Z.; Yang, H.; Zhou, M.; Feng, Y.; Jia, W. Inhibitory effect of total lignan from Fructus Arctii on aldose reductase. Phytother. Res. 2010, 24, 472–473. [Google Scholar] [CrossRef]
- Zhao, C.-C.; Zhang, X.-H.; Chen, J.; Shao, J.-H.; Zhao, Z.-Y.; Tang, Y.-Y. Lignans with α-glucosidase, protein tyrosine phosphatase 1B, and aldose reductase inhibitory activities from the fruits of Viburnum cylindricum. Ind. Crops Prod. 2022, 178, 114601. [Google Scholar] [CrossRef]
- Khayami, R.; Hashemi, S.R.; Kerachian, M.A. Role of aldo-keto reductase family 1 member B1 (AKR1B1) in the cancer process and its therapeutic potential. J. Cell Mol. Med 2020, 24, 8890–8902. [Google Scholar] [CrossRef] [PubMed]
- Sonowal, H.; Ramana, K.V. 4-Hydroxy-trans-2-nonenal in the regulation of anti-oxidative and pro-inflammatory signaling pathways. Oxidative Med. Cell Longev. 2019, 2019, 5937326. [Google Scholar] [CrossRef]
- Zhang, S.; Xue, R.; Geng, Y.; Wang, H.; Li, W. Fisetin prevents HT22 cells from high glucose-induced neurotoxicity via PI3K/Akt/CREB signaling pathway. Front. Neurosci. 2020, 14, 241. [Google Scholar] [CrossRef] [PubMed]
- Zhou, X.; Liu, Z.; Ying, K.; Wang, H.; Liu, P.; Ji, X.; Chi, T.; Zou, L.; Wang, S.; He, Z. WJ-39, an aldose reductase inhibitor, ameliorates renal lesions in diabetic nephropathy by activating Nrf2 signaling. Oxid. Med. Cell. Longev. 2020, 2020, 7950457. [Google Scholar] [CrossRef] [PubMed]
- Zhang, X.; Xu, L.; Chen, H.; Zhang, X.; Lei, Y.; Liu, W.; Xu, H.; Ma, B.; Zhu, C. Novel hydroxychalcone-based dual inhibitors of aldose reductase and alpha-glucosidase as potential therapeutic agents against diabetes mellitus and its complications. J. Med. Chem. 2022, 65, 9174–9192. [Google Scholar] [CrossRef] [PubMed]
- Schwab, A.; Siddiqui, A.; Vazakidou, M.E.; Napoli, F.; Bottcher, M.; Menchicchi, B.; Raza, U.; Saatci, O.; Krebs, A.M.; Ferrazzi, F.; et al. Polyol pathway links glucose metabolism to the aggressiveness of cancer cells. Cancer Res. 2018, 78, 1604–1618. [Google Scholar] [CrossRef] [PubMed]
- Wu, T.-T.; Chen, Y.-Y.; Chang, H.-Y.; Kung, Y.-H.; Tseng, C.-J.; Cheng, P.-W. AKR1B1-induced epithelial–mesenchymal transition mediated by RAGE-oxidative stress in diabetic cataract lens. Antioxidants 2020, 9, 273. [Google Scholar] [CrossRef] [PubMed]
- Tammali, R.; Reddy, A.B.; Saxena, A.; Rychahou, P.G.; Evers, B.M.; Qiu, S.; Awasthi, S.; Ramana, K.V.; Srivastava, S.K. Inhibition of aldose reductase prevents colon cancer metastasis. Carcinogenesis 2011, 32, 1259–1267. [Google Scholar] [CrossRef] [PubMed]
- Dodson, M.; Castro-Portuguez, R.; Zhang, D.D. NRF2 plays a critical role in mitigating lipid peroxidation and ferroptosis. Redox Biol. 2019, 23, 101107. [Google Scholar] [CrossRef]
- Xu, C.; You, X.; Liu, W.; Sun, Q.; Ding, X.; Huang, Y.; Ni, X. Prostaglandin F2alpha regulates the expression of uterine activation proteins via multiple signalling pathways. Reproduction 2015, 149, 139–146. [Google Scholar] [CrossRef]
- Tanagala, K.K.K.; Baba, A.B.; Kowshik, J.; Reddy, G.B.; Nagini, S. Gedunin, A neem limonoid in combination with epalrestat inhibits cancer hallmarks by attenuating aldose reductase-driven oncogenic signaling in SCC131 oral cancer cells. Anticancer Agents Med. Chem. 2018, 18, 2042–2052. [Google Scholar] [CrossRef]
- Saxena, A.; Shoeb, M.; Tammali, R.; Ramana, K.V.; Srivastava, S.K. Aldose reductase inhibition suppresses azoxymethane-induced colonic premalignant lesions in C57BL/KsJ-db/db mice. Cancer Lett. 2014, 355, 141–147. [Google Scholar] [CrossRef]
- Fedorov, Y.; Anderson, E.M.; Birmingham, A.; Reynolds, A.; Karpilow, J.; Robinson, K.; Leake, D.; Marshall, W.S.; Khvorova, A. Off-target effects by siRNA can induce toxic phenotype. RNA 2006, 12, 1188–1196. [Google Scholar] [CrossRef] [PubMed]


| Cell Lines | IC50 Values of the Compounds (μM) | |||||
|---|---|---|---|---|---|---|
| KU | AR | ZP | EP | DOX | CIS | |
| Breast cancer | ||||||
| BT549 | 6.16 ± 0.32 | 2.52 ± 0.17 | 119.81 ± 1.66 | 82.33 ± 0.56 | 1.84 ± 0.16 | 9.69 ± 0.10 |
| Hs578T | 5.57 ± 0.23 | 3.41 ± 0.05 | 116.34 ± 2.70 | 96.08 ± 2.48 | 2.81 ± 0.16 | 23.39 ± 0.39 |
| MCF7 | 3.55 ± 0.01 | 2.90 ± 0.17 | 191.13 ± 3.88 | 111.93 ± 0.24 | 0.69 ± 0.04 | 40.22 ± 0.53 |
| Ovarian cancer | ||||||
| A2780 | 7.35 ± 0.13 | 4.11 ± 0.12 | 156.45 ± 5.16 | 184.83 ± 1.68 | 0.14 ± 0.05 | 5.06 ± 0.17 |
| SKOV3 | 14.34 ± 0.18 | 7.24 ± 0.09 | 121.37 ± 1.73 | 180.77 ± 1.29 | 1.26 ± 0.02 | 12.31 ± 0.71 |
| OVCAR3 | 12.33 ± 0.23 | 3.42 ± 0.30 | 183.90 ± 4.16 | 191.48 ± 1.24 | 3.93 ± 0.02 | 9.84 ± 0.14 |
Publisher’s Note: MDPI stays neutral with regard to jurisdictional claims in published maps and institutional affiliations. |
© 2022 by the authors. Licensee MDPI, Basel, Switzerland. This article is an open access article distributed under the terms and conditions of the Creative Commons Attribution (CC BY) license (https://creativecommons.org/licenses/by/4.0/).
Share and Cite
Tanawattanasuntorn, T.; Rattanaburee, T.; Thongpanchang, T.; Graidist, P. Trans-(±)-Kusunokinin Binding to AKR1B1 Inhibits Oxidative Stress and Proteins Involved in Migration in Aggressive Breast Cancer. Antioxidants 2022, 11, 2347. https://doi.org/10.3390/antiox11122347
Tanawattanasuntorn T, Rattanaburee T, Thongpanchang T, Graidist P. Trans-(±)-Kusunokinin Binding to AKR1B1 Inhibits Oxidative Stress and Proteins Involved in Migration in Aggressive Breast Cancer. Antioxidants. 2022; 11(12):2347. https://doi.org/10.3390/antiox11122347
Chicago/Turabian StyleTanawattanasuntorn, Tanotnon, Thidarath Rattanaburee, Tienthong Thongpanchang, and Potchanapond Graidist. 2022. "Trans-(±)-Kusunokinin Binding to AKR1B1 Inhibits Oxidative Stress and Proteins Involved in Migration in Aggressive Breast Cancer" Antioxidants 11, no. 12: 2347. https://doi.org/10.3390/antiox11122347
APA StyleTanawattanasuntorn, T., Rattanaburee, T., Thongpanchang, T., & Graidist, P. (2022). Trans-(±)-Kusunokinin Binding to AKR1B1 Inhibits Oxidative Stress and Proteins Involved in Migration in Aggressive Breast Cancer. Antioxidants, 11(12), 2347. https://doi.org/10.3390/antiox11122347