
Nitric Oxide Sensing by a Blue Fluorescent Protein


 ,
,  , and
, and
Abstract
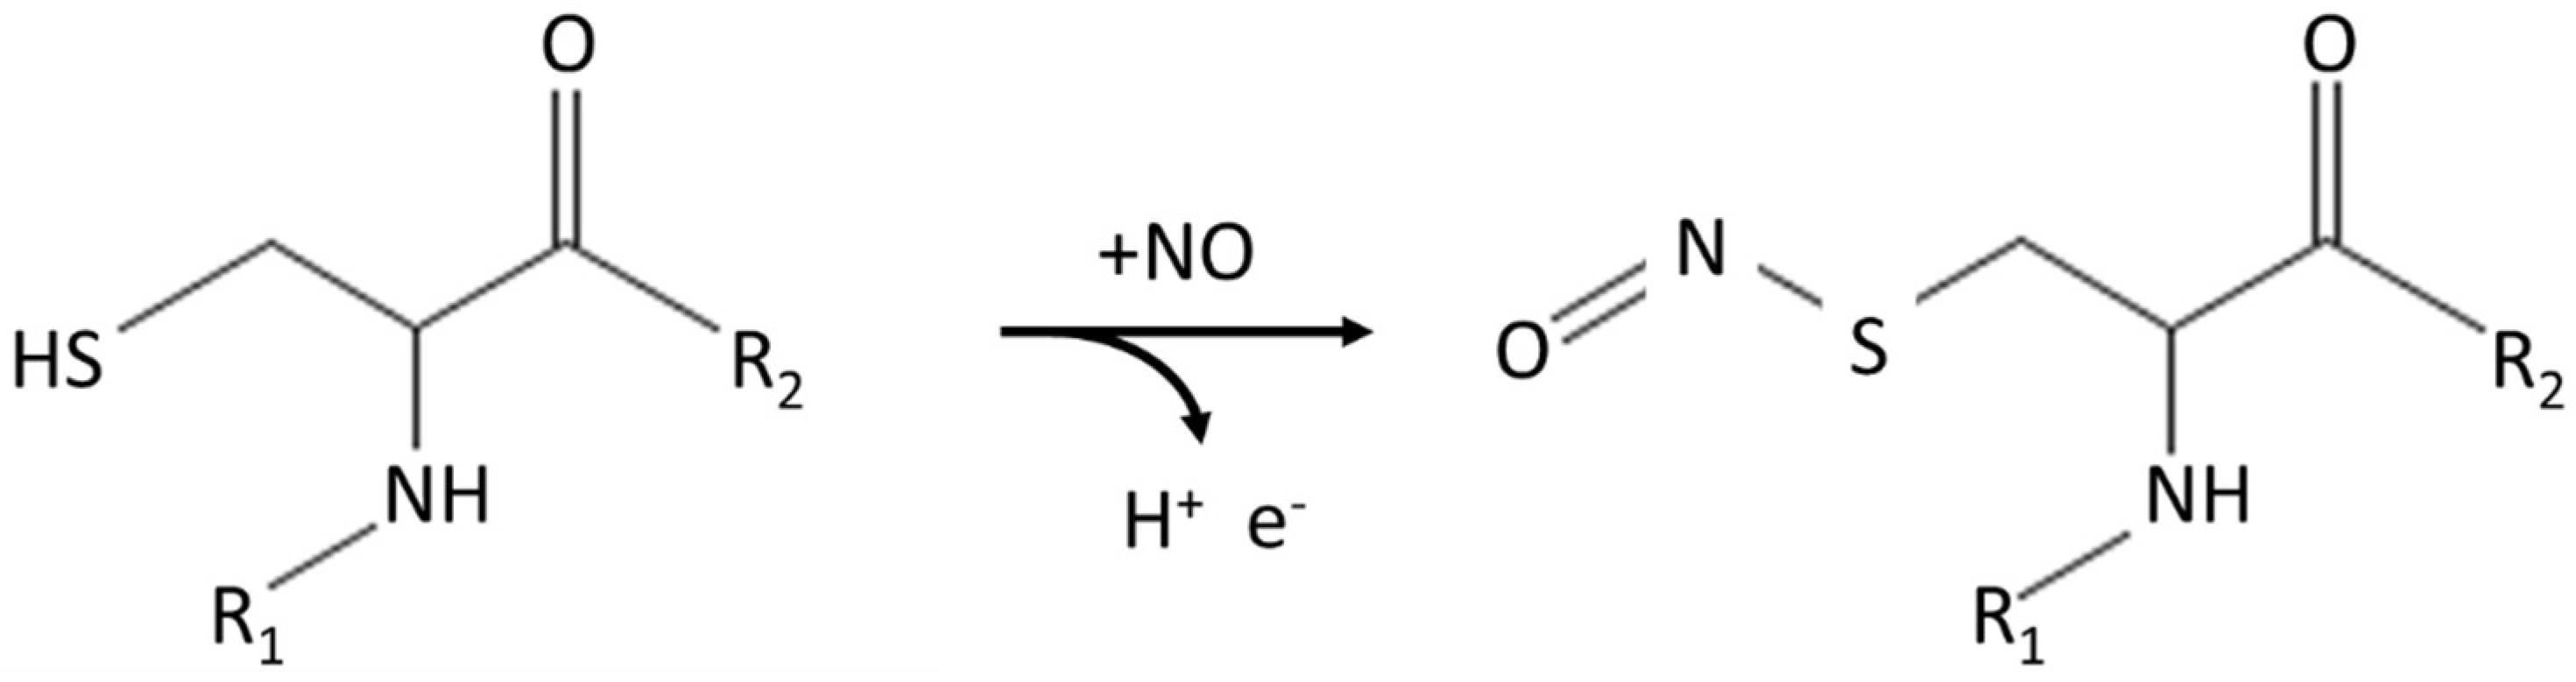
:1. Introduction
2. Materials and Methods
2.1. Plasmid Construction
2.2. Overexpression and Purification of Recombinant Proteins
2.3. Experiments
2.4. Fluorescence Microscopy for Detection of NO by mTagBFP2-Expressing HeLa Cells
2.5. Sequence Alignment
3. Results
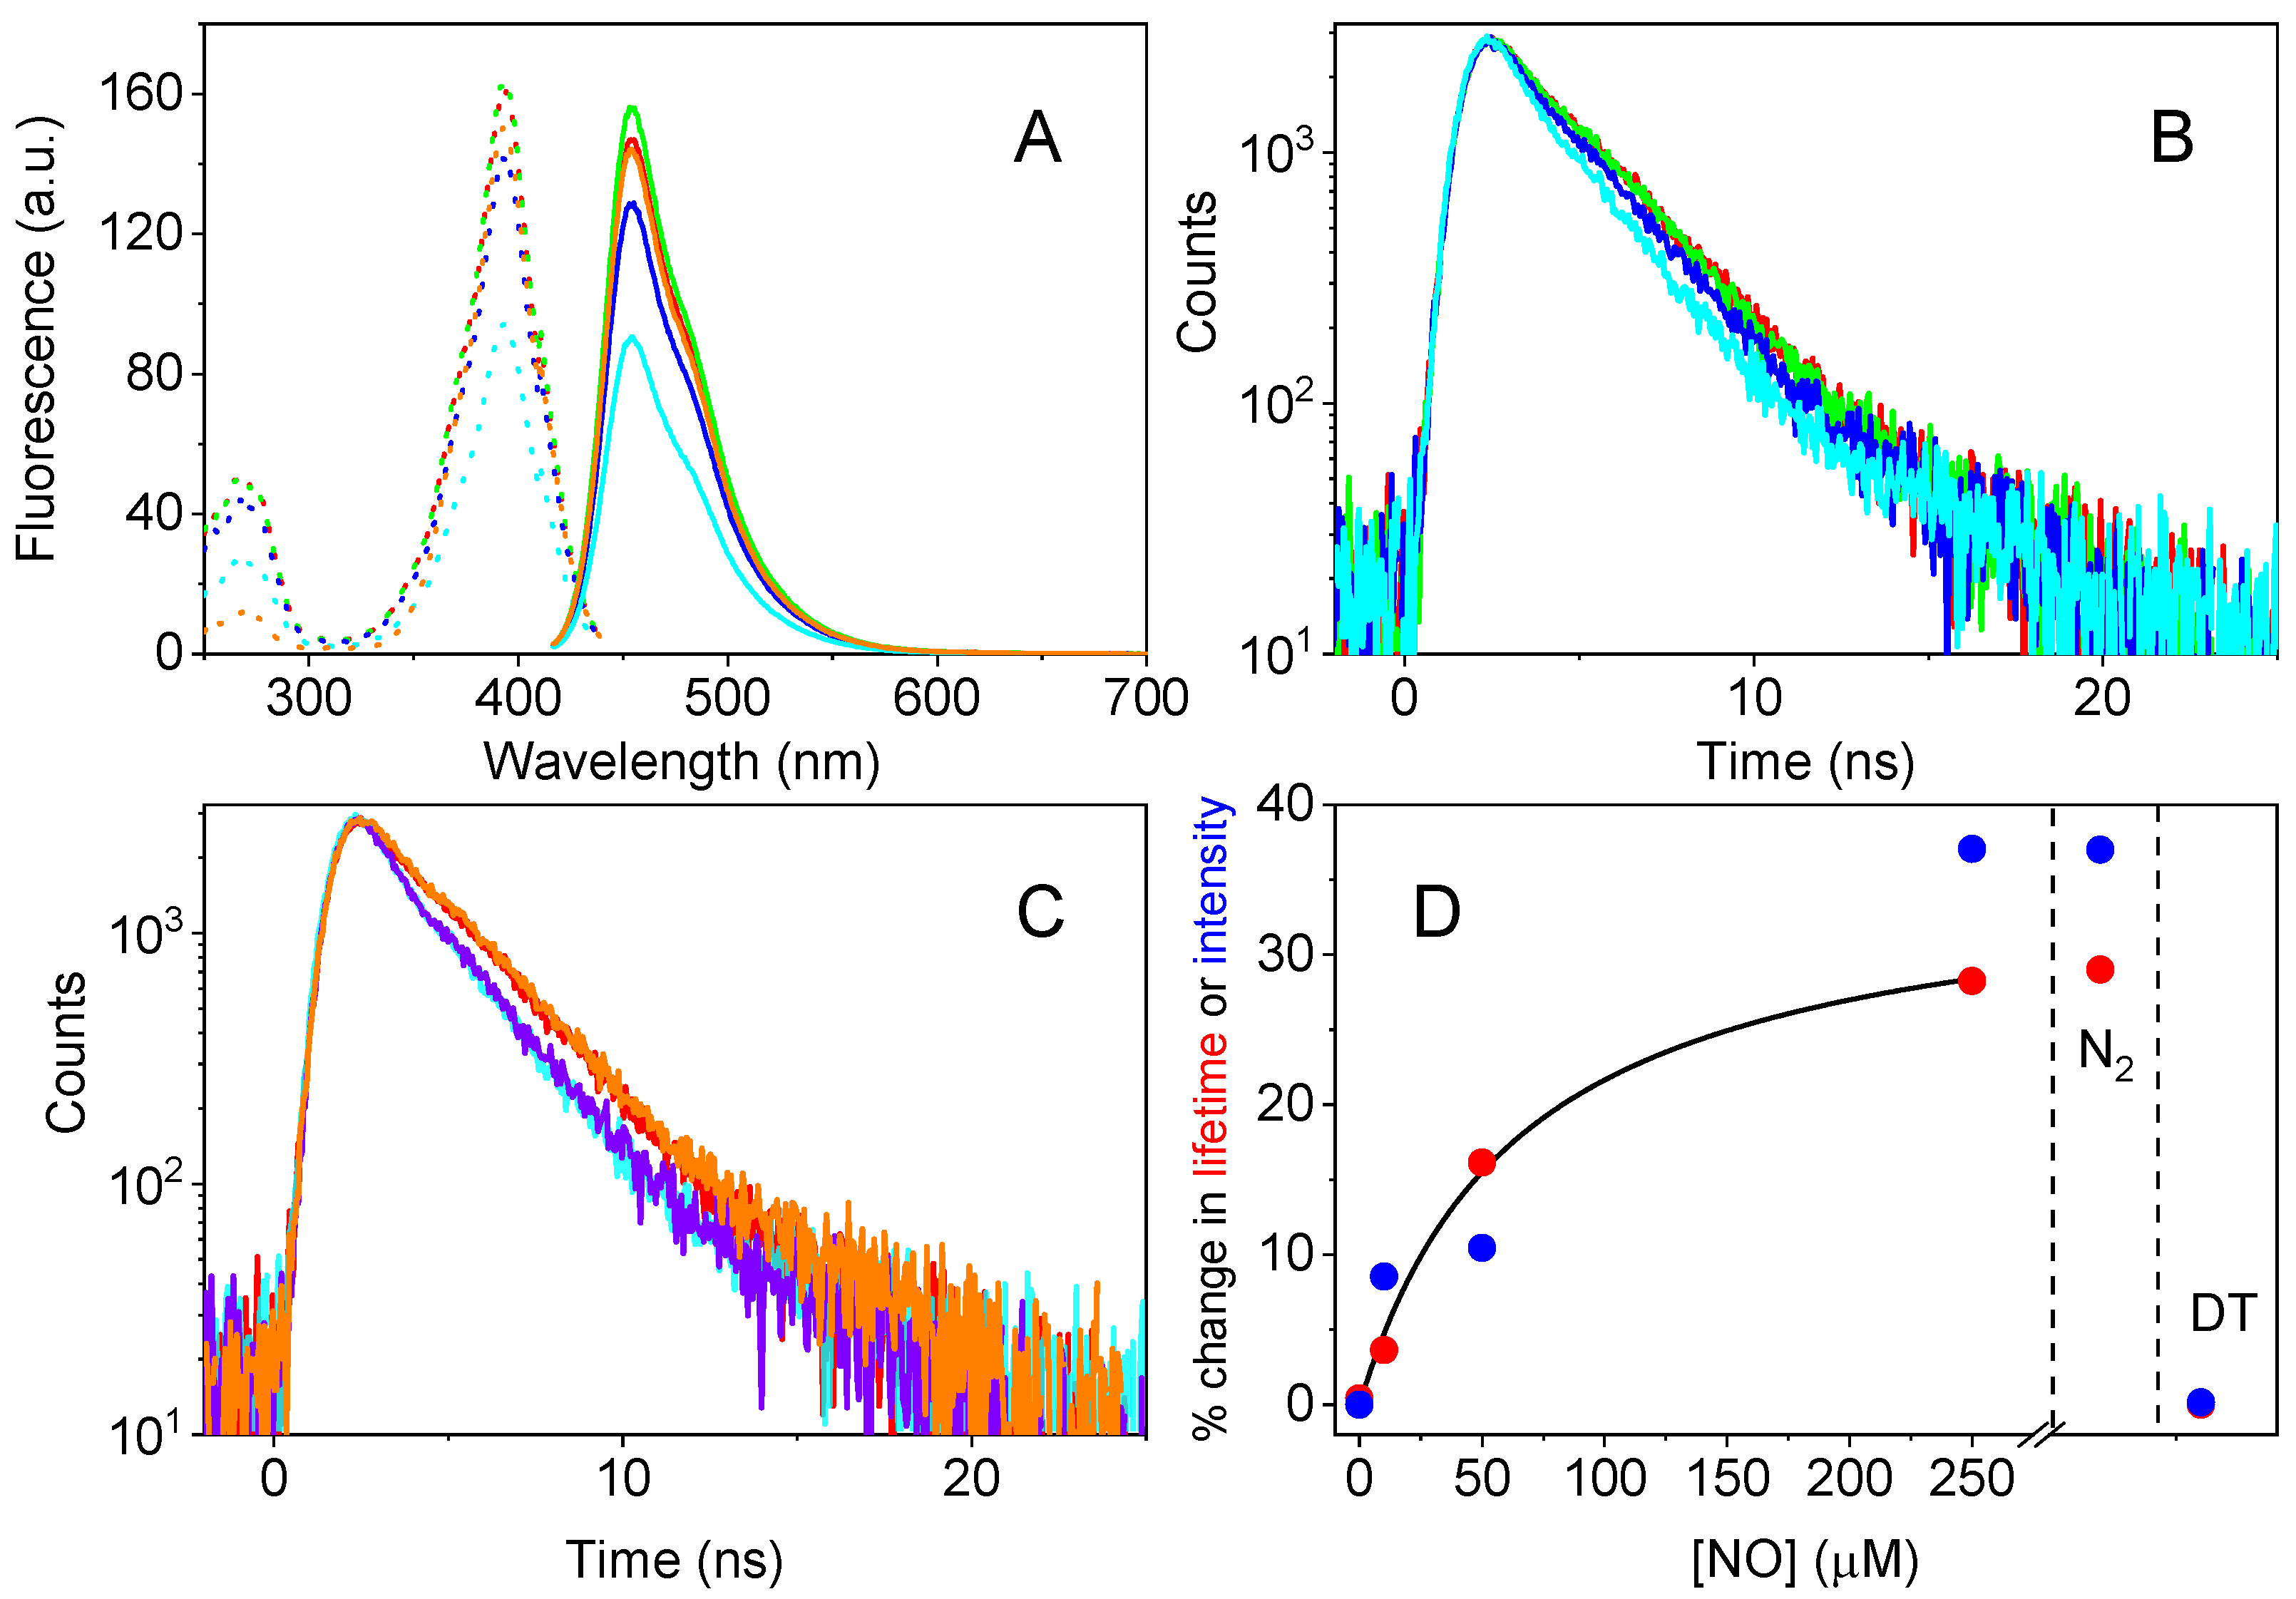
3.1. Effect of NO on mTagBFP2 Fluorescence Emission
3.2. Identification of the Role of Cys Residues
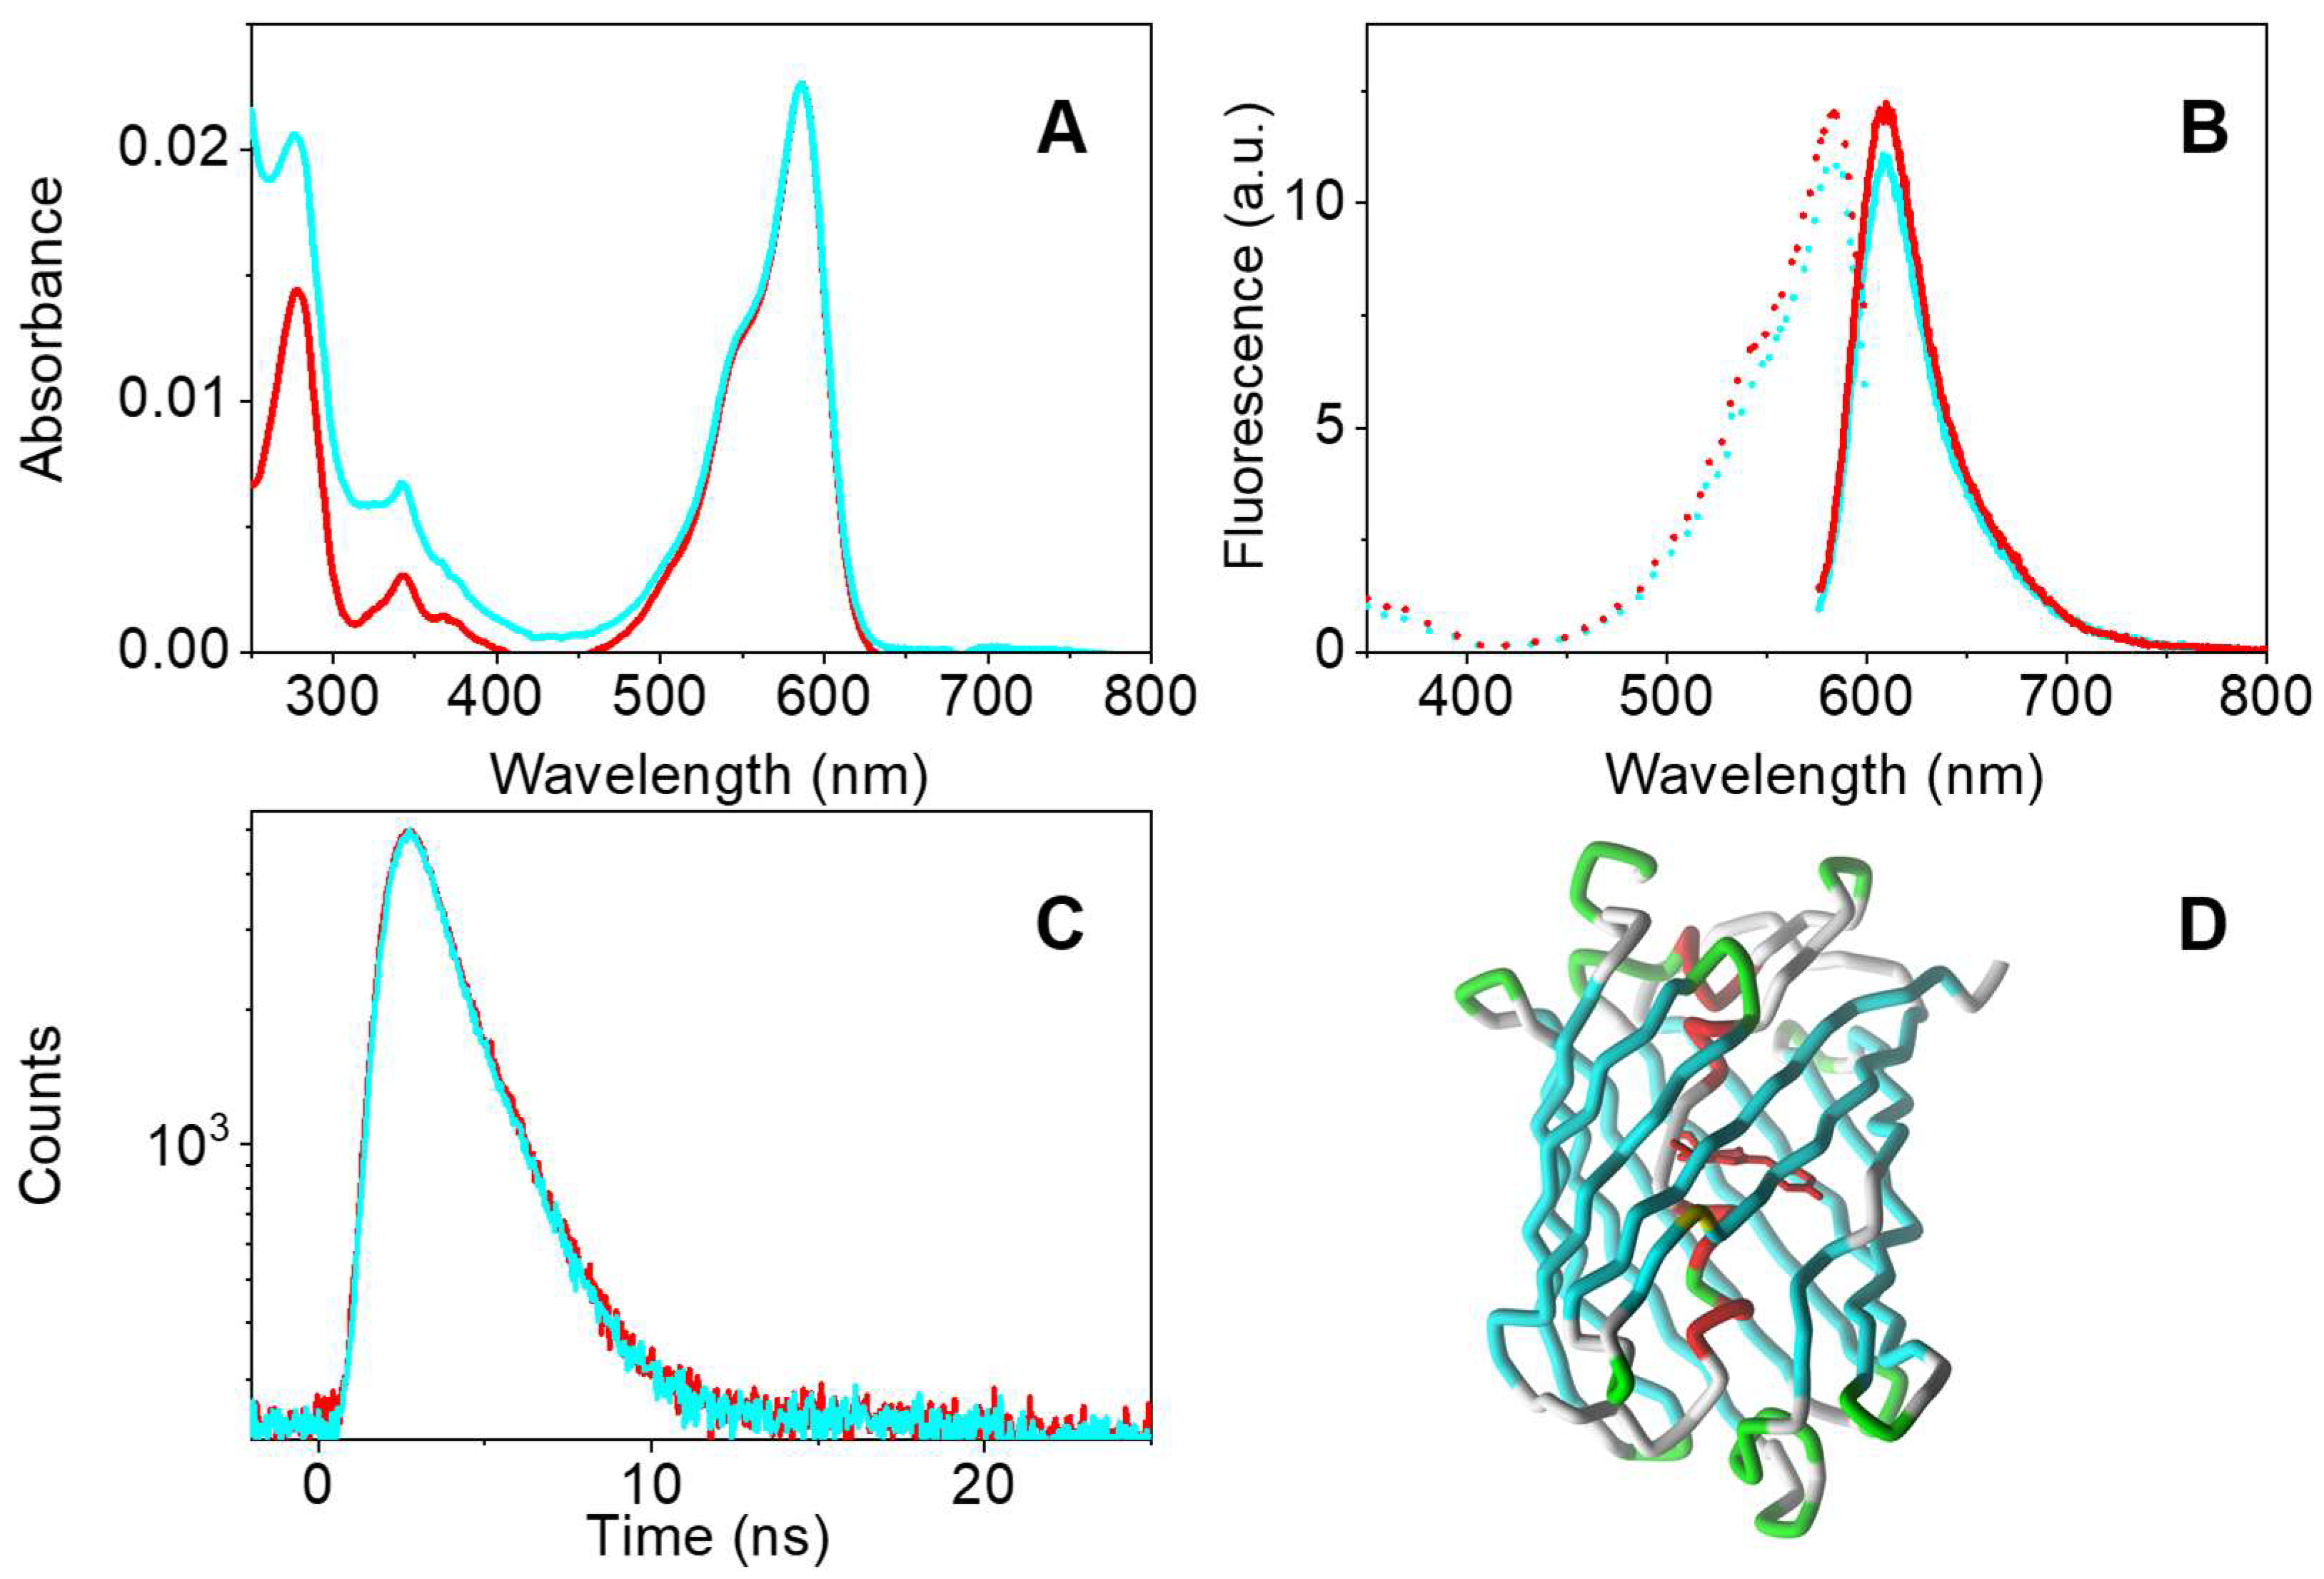
3.3. Effect of NO on Other Fluorescent Proteins
3.4. Effect of pH on NO Sensitivity
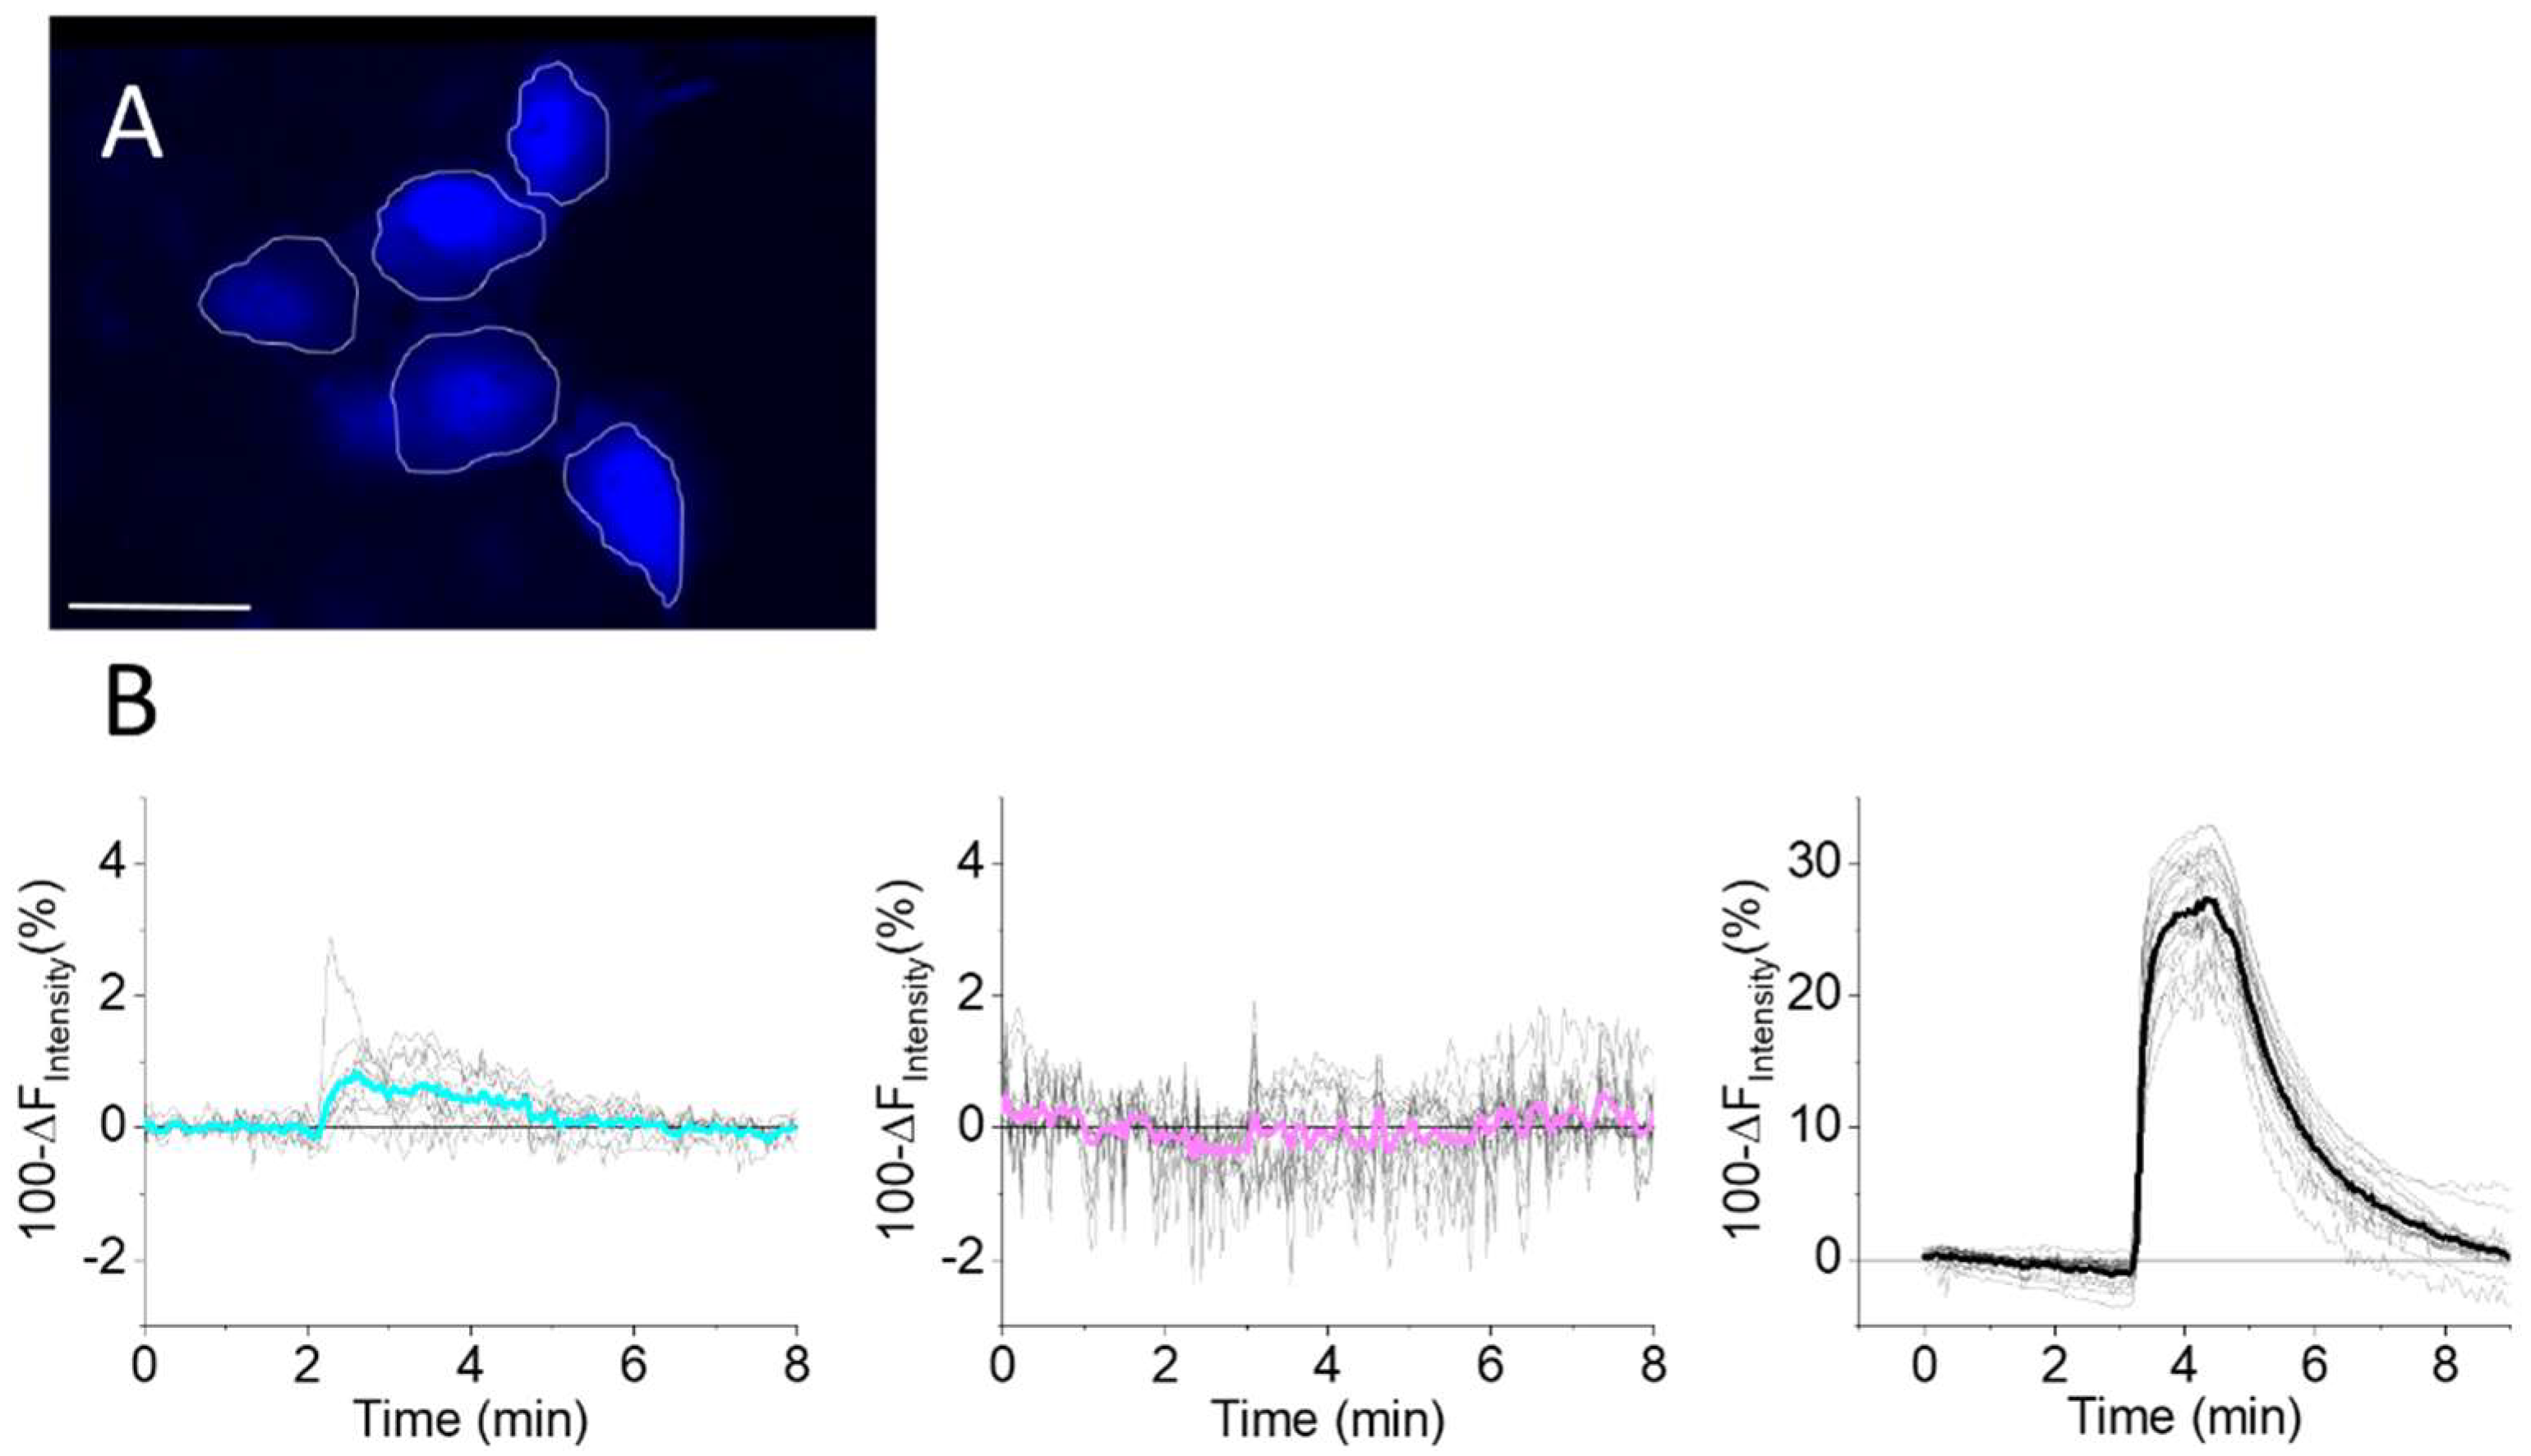
3.5. mTagBFP2 as a NO Sensor in Living Cells
4. Discussion
5. Conclusions
Supplementary Materials
Author Contributions
Funding
Institutional Review Board Statement
Informed Consent Statement
Data Availability Statement
Acknowledgments
Conflicts of Interest
References
- Weichsel, A.; Maes, E.M.; Andersen, J.F.; Valenzuela, J.G.; Shokhireva, T.K.; Walker, F.A.; Montfort, W.R. Heme-assisted S-nitrosation of a proximal thiolate in a nitric oxide transport protein. Proc. Natl. Acad. Sci. USA 2005, 102, 594–599. [Google Scholar] [CrossRef] [PubMed] [Green Version]
- Fomenko, D.E.; Marino, S.M.; Gladyshev, V.N. Functional Diversity of Cysteine Residues in Proteins and Unique Features of Catalytic Redox-active Cysteines in Thiol Oxidoreductases. Mol. Cells 2008, 26, 228–235. [Google Scholar] [PubMed]
- Poole, L.B. The basics of thiols and cysteines in redox biology and chemistry. Free Radic. Biol. Med. 2015, 80, 148–157. [Google Scholar] [CrossRef] [PubMed] [Green Version]
- Reischl, E.; Dafre, A.L.; Franco, J.L.; Wilhelm Filho, D. Distribution, adaptation and physiological meaning of thiols from vertebrate hemoglobins. Comp. Biochem. Physiol. Part C Toxicol. Pharmacol. 2007, 146, 22–53. [Google Scholar] [CrossRef] [PubMed]
- Hamdane, D.; Kiger, L.; Dewilde, S.; Green, B.N.; Pesce, A.; Uzan, J.; Burmester, T.; Hankeln, T.; Bolognesi, M.; Moens, L.; et al. The redox state of the cell regulates the ligand binding affinity of human neuroglobin and cytoglobin. J. Biol. Chem. 2003, 278, 51713–51721. [Google Scholar] [CrossRef] [Green Version]
- Hess, D.T.; Matsumoto, A.; Kim, S.-O.; Marshall, H.E.; Stamler, J.S. Protein S-nitrosylation: Purview and parameters. Nat. Rev. Mol. Cell Biol. 2005, 6, 150. [Google Scholar] [CrossRef]
- Sun, J.; Steenbergen, C.; Murphy, E. S-Nitrosylation: NO-Related Redox Signaling to Protect Against Oxidative Stress. Antioxid. Redox Signal. 2006, 8, 1693–1705. [Google Scholar] [CrossRef] [Green Version]
- Marchesani, F.; Gianquinto, E.; Autiero, I.; Michielon, A.; Campanini, B.; Faggiano, S.; Bettati, S.; Mozzarelli, A.; Spyrakis, F.; Bruno, S. The allosteric interplay between S-nitrosylation and glycine binding controls the activity of human serine racemase. FEBS J. 2021, 288, 3034–3054. [Google Scholar] [CrossRef]
- Jia, L.; Bonaventura, C.; Bonaventura, J.; Stamler, J.S. S-nitrosohaemoglobin: A dynamic activity of blood involved in vascular control. Nature 1996, 380, 221–226. [Google Scholar] [CrossRef]
- Derakhshan, B.; Hao, G.; Gross, S.S. Balancing reactivity against selectivity: The evolution of protein S-nitrosylation as an effector of cell signaling by nitric oxide. Cardiovasc. Res. 2007, 75, 210–219. [Google Scholar] [CrossRef]
- Nagahara, N. Intermolecular disulfide bond to modulate protein function as a redox-sensing switch. Amino Acids 2011, 41, 59–72. [Google Scholar] [CrossRef]
- Costantini, L.M.; Baloban, M.; Markwardt, M.L.; Rizzo, M.A.; Guo, F.; Verkhusha, V.V.; Snapp, E.L. A palette of fluorescent proteins optimized for diverse cellular environments. Nat. Commun. 2015, 6, 7670. [Google Scholar] [CrossRef] [Green Version]
- Hanson, G.T.; Aggeler, R.; Oglesbee, D.; Cannon, M.; Capaldi, R.A.; Tsien, R.Y.; Remington, S.J. Investigating Mitochondrial Redox Potential with Redox-sensitive Green Fluorescent Protein Indicators. J. Biol. Chem. 2004, 279, 13044–13053. [Google Scholar] [CrossRef] [Green Version]
- Lukyanov, K.A.; Belousov, V.V. Genetically encoded fluorescent redox sensors. BBA Gen. Subj. 2014, 1840, 745–756. [Google Scholar] [CrossRef]
- Yang, K.; Kolanowski, J.L.; New, E.J. Mitochondrially targeted fluorescent redox sensors. Interface Focus 2017, 7, 20160105. [Google Scholar] [CrossRef] [Green Version]
- Müller, A.; Schneider, J.F.; Degrossoli, A.; Lupilova, N.; Dick, T.P.; Leichert, L.I. Systematic in vitro assessment of responses of roGFP2-based probes to physiologically relevant oxidant species. Free Radic. Biol. Med. 2017, 106, 329–338. [Google Scholar] [CrossRef]
- Suzuki, T.; Arai, S.; Takeuchi, M.; Sakurai, C.; Ebana, H.; Higashi, T.; Hashimoto, H.; Hatsuzawa, K.; Wada, I. Development of Cysteine-Free Fluorescent Proteins for the Oxidative Environment. PLoS ONE 2012, 7, e37551. [Google Scholar] [CrossRef]
- Subach, O.M.; Cranfill, P.J.; Davidson, M.W.; Verkhusha, V.V. An Enhanced Monomeric Blue Fluorescent Protein with the High Chemical Stability of the Chromophore. PLoS ONE 2011, 6, e28674. [Google Scholar] [CrossRef] [Green Version]
- Shinoda, H.; Shannon, M.; Nagai, T. Fluorescent Proteins for Investigating Biological Events in Acidic Environments. Int. J. Mol. Sci. 2018, 19, 1548. [Google Scholar] [CrossRef] [Green Version]
- Eroglu, E.; Gottschalk, B.; Charoensin, S.; Blass, S.; Bischof, H.; Rost, R.; Madreiter-Sokolowski, C.T.; Pelzmann, B.; Bernhart, E.; Sattler, W.; et al. Development of novel FP-based probes for live-cell imaging of nitric oxide dynamics. Nat. Commun. 2015, 7, 10623. [Google Scholar] [CrossRef]
- Eroglu, E.; Charoensin, S.; Bischof, H.; Ramadani, J.; Gottschalk, B.; Depaoli, M.R.; Waldeck-Weiermair, M.; Graier, W.F.; Malli, R. Genetic biosensors for imaging nitric oxide in single cells. Free Radic. Biol. Med. 2018, 128, 50–58. [Google Scholar] [CrossRef] [PubMed]
- Pearce, L.L.; Gandley, R.E.; Han, W.; Wasserloos, K.; Stitt, M.; Kanai, A.J.; McLaughlin, M.K.; Pitt, B.R.; Levitan, E.S. Role of metallothionein in nitric oxide signaling as revealed by a green fluorescent fusion protein. Proc. Natl. Acad. Sci. USA 2000, 97, 477–482. [Google Scholar] [CrossRef] [PubMed] [Green Version]
- Sevimli, G.; Smith, M.J.; Caglar, T.A.; Bilir, Ş.; Secilmis, M.; Altun, H.Y.; Yigit, E.N.; Yang, F.; Keeley, T.P.; Malli, R.; et al. Nitric oxide biosensor uncovers diminished ferrous iron-dependency of cultured cells adapted to physiological oxygen levels. Redox Biol. 2022, 53, 102319. [Google Scholar] [CrossRef] [PubMed]
- Penjweini, R.; Mori, M.P.; Hwang, P.M.; Sackett, D.L.; Knutson, J.R. Fluorescence lifetime imaging of metMyoglobin formation due to nitric oxide stress. In Proceedings of the SPIE—the International Society for Optical Engineering, San Francisco, CA, USA, 22 January–28 February 2022; Volume 11965. [Google Scholar]
- Penjweini, R.; Roarke, B.; Alspaugh, G.; Link, K.A.; Andreoni, A.; Mori, M.P.; Hwang, P.M.; Sackett, D.L.; Knutson, J.R. Intracellular imaging of metmyoglobin and oxygen using new dual purpose probe EYFP-Myoglobin-mCherry. J. Biophotonics 2022, 15, e202100166. [Google Scholar] [CrossRef] [PubMed]
- Link, K.; Penjweini, R.; Brown, A.; Alspaugh, G.; Chung, J.H.; Knutson, J.R. met myoglobin detection in mitochondria using fluorescence lifetime imaging of Citrine-Myoglobin-mCherry construct. In Progress in Biomedical Optics and Imaging—Proceedings of SPIE; SPIE: San Francisco, CA, USA, 2022. [Google Scholar]
- Alspaugh, G.; Roarke, B.; Chand, A.; Penjweini, R.; Andreoni, A.; Knutson, J.R. Developing Analysis Protocols for Monitoring Intracellular Oxygenation Using Fluorescence Lifetime Imaging of Myoglobin-mCherry. In Confocal Microscopy: Methods and Protocols; Brzostowski, J., Sohn, H., Eds.; Springer US: New York, NY, USA, 2021; pp. 315–337. [Google Scholar]
- Madeira, F.; Pearce, M.; Tivey, A.R.N.; Basutkar, P.; Lee, J.; Edbali, O.; Madhusoodanan, N.; Kolesnikov, A.; Lopez, R. Search and sequence analysis tools services from EMBL-EBI in 2022. Nucleic Acids Res. 2022, 50, W276–W279. [Google Scholar] [CrossRef]
- Shu, X.; Shaner, N.C.; Yarbrough, C.A.; Tsien, R.Y.; Remington, S.J. Novel Chromophores and Buried Charges Control Color in mFruits. Biochemistry 2006, 45, 9639–9647. [Google Scholar] [CrossRef]
- Lawrence, R.E.; Zoncu, R. The lysosome as a cellular centre for signalling, metabolism and quality control. Nat. Cell Biol. 2019, 21, 133–142. [Google Scholar] [CrossRef]
- Ballabio, A.; Bonifacino, J.S. Lysosomes as dynamic regulators of cell and organismal homeostasis. Nat. Rev. Mol. Cell Biol. 2020, 21, 101–118. [Google Scholar] [CrossRef]
- Shaner, N.C.; Lin, M.Z.; McKeown, M.R.; Steinbach, P.A.; Hazelwood, K.L.; Davidson, M.W.; Tsien, R.Y. Improving the photostability of bright monomeric orange and red fluorescent proteins. Nat. Methods 2008, 5, 545–551. [Google Scholar] [CrossRef] [Green Version]
- Buie, J.J.; Renaud, L.L.; Muise-Helmericks, R.; Oates, J.C. IFN-α Negatively Regulates the Expression of Endothelial Nitric Oxide Synthase and Nitric Oxide Production: Implications for Systemic Lupus Erythematosus. J. Immunol. 2017, 199, 1979–1988. [Google Scholar] [CrossRef]
- Miyata, S.; Noda, A.; Hara, Y.; Ueyama, J.; Kitaichi, K.; Kondo, T.; Koike, Y. Nitric Oxide Plasma Level as a Barometer of Endothelial Dysfunction in Factory Workers. Exp. Clin. Endocrinol. Diabetes 2017, 125, 684–689. [Google Scholar] [CrossRef]
- Fabris, S.; MacLean, D.A. Doxorubicin chemotherapy affects intracellular and interstitial nitric oxide concentrations in skeletal muscle. Cell Biol. Toxicol. 2016, 32, 121–131. [Google Scholar] [CrossRef]
- Prietl, B.; Meindl, C.; Roblegg, E.; Pieber, T.R.; Lanzer, G.; Fröhlich, E. Nano-sized and micro-sized polystyrene particles affect phagocyte function. Cell Biol. Toxicol. 2014, 30, 1–16. [Google Scholar] [CrossRef] [Green Version]
- Chen, Y. Recent developments of fluorescent probes for detection and bioimaging of nitric oxide. Nitric Oxide 2020, 98, 1–19. [Google Scholar] [CrossRef]
- Greenwald, E.C.; Mehta, S.; Zhang, J. Genetically Encoded Fluorescent Biosensors Illuminate the Spatiotemporal Regulation of Signaling Networks. Chem. Rev. 2018, 118, 11707–11794. [Google Scholar] [CrossRef]
- Hall, C.N.; Attwell, D. Assessing the physiological concentration and targets of nitric oxide in brain tissue. J. Physiol. 2008, 586, 3597–3615. [Google Scholar] [CrossRef]
- Palmieri, E.M.; McGinity, C.; Wink, D.A.; McVicar, D.W. Nitric Oxide in Macrophage Immunometabolism: Hiding in Plain Sight. Metabolites 2020, 10, 429. [Google Scholar] [CrossRef]
- Meyer, J.M.; Ryu, S.; Pendland, S.L.; Kanyok, T.P.; Danziger, L.H. In-vitro synergy of paromomycin with metronidazole alone or metronidazole plus hydroxymetronidazole against Helicobacter pylori. J. Antimicrob. Chemother. 1999, 43, 403–406. [Google Scholar] [CrossRef] [Green Version]
- Elsliger, M.A.; Wachter, R.M.; Hanson, G.T.; Kallio, K.; Remington, S.J. Structural and spectral response of green fluorescent protein variants to changes in pH. Biochemistry 1999, 38, 5296–5301. [Google Scholar] [CrossRef]
- Chapagain, P.P.; Regmi, C.K.; Castillo, W. Fluorescent protein barrel fluctuations and oxygen diffusion pathways in mCherry. J. Chem. Phys. 2011, 135, 235101. [Google Scholar] [CrossRef]
- Abbruzzetti, S.; Grandi, E.; Viappiani, C.; Bologna, S.; Campanini, B.; Raboni, S.; Bettati, S.; Mozzarelli, A. Kinetics of Acid-Induced Spectral Changes in the GFPmut2 Chromophore. J. Am. Chem. Soc. 2005, 127, 626–635. [Google Scholar] [CrossRef] [PubMed]
- Jiménez-Banzo, A.; Ragàs, X.; Abbruzzetti, S.; Viappiani, C.; Campanini, B.; Flors, C.; Nonell, S. Singlet oxygen photosensitisation by GFP mutants: Oxygen accessibility to the chromophore. Photochem. Photobiol. Sci. 2010, 9, 1336–1341. [Google Scholar] [CrossRef] [PubMed]
- Majmudar, J.D.; Martin, B.R. Strategies for profiling native S-nitrosylation. Biopolymers 2014, 101, 173–179. [Google Scholar] [CrossRef] [PubMed] [Green Version]
- Ren, W.; Ai, H.-W. Genetically Encoded Fluorescent Redox Probes. Sensors 2013, 13, 15422–15433. [Google Scholar] [CrossRef] [Green Version]
- Becker, W. Fluorescence lifetime imaging—Techniques and applications. J. Microsc. 2012, 247, 119–136. [Google Scholar] [CrossRef]
- Biskup, C.; Gensch, T. Fluorescence Lifetime Imaging of Ions in Biological Tissues. In Fluorescence Lifetime Spectroscopy and Imaging. Principles and Applications in Biomedical Diagnostics; Taylor & Francis: Boca Raton, FL, USA, 2014; pp. 497–533. [Google Scholar]
- Datta, R.; Heaster, T.M.; Sharick, J.T.; Gillette, A.A.; Skala, M.C. Fluorescence lifetime imaging microscopy: Fundamentals and advances in instrumentation, analysis, and applications. J. Biomed. Opt. 2020, 25, 071203. [Google Scholar] [CrossRef]
- Fang, F.C. Antimicrobial reactive oxygen and nitrogen species: Concepts and controversies. Nat. Rev. Microbiol. 2004, 2, 820–832. [Google Scholar] [CrossRef]
- Stölting, G.; de Oliveira, R.C.; Guzman, R.E.; Miranda-Laferte, E.; Conrad, R.; Jordan, N.; Schmidt, S.; Hendriks, J.; Gensch, T.; Hidalgo, P. Direct interaction of CaVβ with actin up-regulates L-type calcium currents in HL-1 cardiomyocytes. J. Biol. Chem. 2015, 290, 4561–4572. [Google Scholar] [CrossRef] [Green Version]
- Kaneko, H.; Putzier, I.; Frings, S.; Kaupp, U.B.; Gensch, T. Chloride accumulation in mammalian olfactory sensory neurons. J. Neurosci. Off. J. Soc. Neurosci. 2004, 24, 7931–7938. [Google Scholar] [CrossRef] [Green Version]


| Protein | Kd (μM) | Max % Change | <τ> (ns) |
|---|---|---|---|
| mTagBFP2 | |||
| pH = 7.4 | 70 ± 10 | 36 ± 2 | 2.49 ± 0.04 |
| pH = 7.4 + BSA 100 µM | -- | -- | 2.50 ± 0.05 |
| pH = 5 | 35 ± 10 | 16 ± 1 | 2.80 ± 0.05 |
| C26A | 80 ± 10 | 23 ± 2 | 2.46 ± 0.04 |
| C26A C114S C222S | -- | 3 ± 1 | 2.35 ± 0.02 |
| EGFP | 10 ± 5 | 7 ± 1 | 3.35 ± 0.04 |
| EYFP | 20 ± 6 | 7 ± 1 | 2.76 ± 0.05 |
| TagRFP-T | |||
| pH = 7.4 | 15 ± 4 | 16 ± 1 | 1.93 ± 0.04 |
| pH = 5 | 10 ± 4 | 7 ± 1 | 2.00 ± 0.03 |
| mCherry | -- | 0 | 0.97 ± 0.02 |
Publisher’s Note: MDPI stays neutral with regard to jurisdictional claims in published maps and institutional affiliations. |
© 2022 by the authors. Licensee MDPI, Basel, Switzerland. This article is an open access article distributed under the terms and conditions of the Creative Commons Attribution (CC BY) license (https://creativecommons.org/licenses/by/4.0/).
Share and Cite
Montali, C.; Abbruzzetti, S.; Franzen, A.; Casini, G.; Bruno, S.; Delcanale, P.; Burgstaller, S.; Ramadani-Muja, J.; Malli, R.; Gensch, T.; et al. Nitric Oxide Sensing by a Blue Fluorescent Protein. Antioxidants 2022, 11, 2229. https://doi.org/10.3390/antiox11112229
Montali C, Abbruzzetti S, Franzen A, Casini G, Bruno S, Delcanale P, Burgstaller S, Ramadani-Muja J, Malli R, Gensch T, et al. Nitric Oxide Sensing by a Blue Fluorescent Protein. Antioxidants. 2022; 11(11):2229. https://doi.org/10.3390/antiox11112229
Chicago/Turabian StyleMontali, Chiara, Stefania Abbruzzetti, Arne Franzen, Giorgia Casini, Stefano Bruno, Pietro Delcanale, Sandra Burgstaller, Jeta Ramadani-Muja, Roland Malli, Thomas Gensch, and et al. 2022. "Nitric Oxide Sensing by a Blue Fluorescent Protein" Antioxidants 11, no. 11: 2229. https://doi.org/10.3390/antiox11112229
APA StyleMontali, C., Abbruzzetti, S., Franzen, A., Casini, G., Bruno, S., Delcanale, P., Burgstaller, S., Ramadani-Muja, J., Malli, R., Gensch, T., & Viappiani, C. (2022). Nitric Oxide Sensing by a Blue Fluorescent Protein. Antioxidants, 11(11), 2229. https://doi.org/10.3390/antiox11112229