Abstract
Bacillus subtilis has been widely used in animal husbandry as a potential alternative to antibiotics due to its excellent bacteriostasis and antioxidant activity. This study aims to investigate the effects of Bacillus subtilis on the protection of ducks from Escherichia coli infection and its mechanism. The four experimental groups include the negative control group, positive control group, antibiotic group and Bacillus subtilis group. Ducks in positive, antibiotic and Bacillus subtilis groups are orally administered with Escherichia coli and equivalent saline solution for the negative group. The results show that supplements with Bacillus subtilis enhances the performance and health status of the infected ducks. Moreover, Bacillus subtilis alleviates the increase in globulin, LPS and MDA, and the decrease in albumin, T-AOC and T-SOD in the serum caused by Escherichia coli infection. Bacillus subtilis also attenuates injury in the intestine and partially reverses the increase in ROS production and the depletion of ATP in the jejunum. These effects are accompanied with the change of related genes of the ribosome (13.54%) and oxidative phosphorylation (6.68%). Collectively, Bacillus subtilis alleviates the damage caused by Escherichia coli infection in ducks by activating ribosome and oxidative phosphorylation signaling to regulate antioxidant and energy metabolism.
1. Introduction
Oxidative stress caused by an imbalance between the excessive production of free radicals and the antioxidant defense is an important component of biological damage and also the main source of serious diseases [1]. It was reported that the endotoxin produced by pathogenic Escherichia coli (E. coli), such as lipopolysaccharide (LPS), can cause excessive production of reactive oxygen or nitrogen species, which exceeds the defense capacity of the host and increases the level of oxidative stress products such as MDA, ultimately causing a series of oxidative injuries [2,3]. What is more, severe oxidative stress caused by E. coli infection leads to impairment of energy metabolism through interference with oxidative phosphorylation pathways, ultimately compromising host antioxidant capacity, immune response and productive performance [1].
Ducks and chickens are the main victims of avian pathogenic E. coli. The infected individuals show progressive debilitation, which results in damage to organs throughout the body and eventual death due to functional failure [4,5]. Antibacterial drugs and vaccines are the main treatments for E. coli infections; however, the multidrug-resistant and complicated pathogenicity of E. coli continues to increase and attracts endless attention [6].
The challenges outlined above have prompted a global search for alternatives to antibiotics. Probiotics are widely used in humans and have gained acceptance as an animal feed additive to reduce the use of antibiotics gradually [7,8]. In the poultry industry, probiotics have been shown to stimulate innate immunity and overall health by preventing pathogen infections, thereby improving growth performance, promoting intestinal morphology and other functions [9,10,11,12]. Bacillus subtilis (B. subtilis) is a kind of probiotic that produces subtilisin, polymyxin, nystatin, short bacitracin and other active substances. It has been widely used in animal husbandry as a potential alternative to antibiotics due to its excellent bacteriostasis, antioxidant, immune and growth improvement functions [13,14,15]. However, B. subtilis has been less studied in ducklings, especially the ducklings exposed to E. coli. In recent years, we have been concerned about the negative effect of pathogenic E. coli on waterfowl and have successfully established a model of E. coli infection in Pekin ducklings [16]. Based on previous work, we compared the effects of B. subtilis L6 and virginiamycin on growth performance, antioxidation function and the intestinal health of ducks challenged with E. coli in the current study. In addition to the physiological and biochemical analyses, the RNA-Seq was also used to determine possible molecular mechanisms by which B. subtilis relieved intestinal oxidative stress caused by E. coli infection in Pekin ducklings.
2. Materials and Methods
2.1. Preparation of E. coli O88 and B. subtilis L6
The strain of pathogenic E. coli O88 was obtained from China Veterinary Culture Collection Center (CVCC). The probiotic B. subtilis L6 in microcapsules (viable count ≥1.0 × 10¹⁰ CFU/g, powder state) was provided by Challenge Biotechnology Co., LTD (Beijing, China). The viable B. subtilis count in feed was determined based on Nikoskelainen (2003) [17].
2.2. Experimental Design
The experiment was conducted in Nankou pilot base of the Chinese Academy of Agricultural Sciences. The methods for animal experiments were set out by the National Institute of Animal Health and research reporting follows the guidelines of ARRIVE [18]. A total of 192 newly hatched, male lean Pekin ducklings were randomly allocated into 4 treatment groups with 6 replicates of 8 ducks each replicate. The 4 treatment groups were negative control group (NC), positive control group (PC), 30 mg/kg virginiamycin group (ANT) and 2.5 × 10⁹ CFU/kg B. subtilis L6 group (BS), respectively. The basal diets meet the nutritional requirements of the ducks as determined by the National Research Council (NRC, 1994) and the Nutrient Requirements of Meat-type Duck published by the Ministry of Agriculture of the People’s Republic of China, NY/T 2122-2012 (Supplementary Table S1). The experiment lasted for 28 days.
2.3. Oral Challenge
The infection model was established based on our previous protocol [16]. Briefly, the frozen E. coli O88 was thawed and cultured in Luria-Bertani (LB) broth to activate three times (37 °C, 12 h). Bacteria were resuspended in sterilized 0.9% saline solution and counted by plate cultivation. On day 7, the ducks in PC, ANT and BS groups were orally administered with 0.2 mL E. coli (3 × 10⁹ CFU/mL) twice, 8 h apart and equivalent volumes of 0.9% sterile saline solution for the NC group. The workflow is shown in Figure 1.
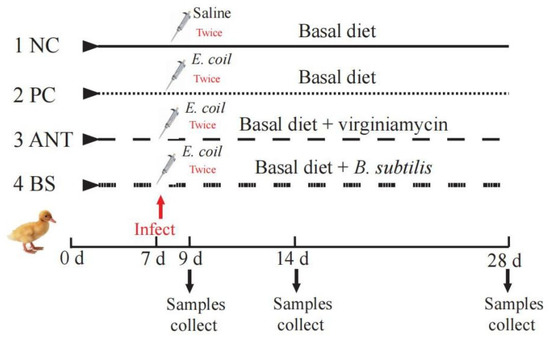
Figure 1.
Workflow for the experiment. NC–negative group, basal diet without E. coli challenge. PC–positive group, basal diet with E. coli challenge. ANT–antibiotic group, basal diet + virginiamycin (30 mg/kg) with E. coli challenge. BS–basal diet + 2.5 × 10⁹ CFU/kg B. subtilis with E. coli challenge.
2.4. Sampling
On days 9, 14 and 28, after fasting 6 h, all ducks were weighed and the feed intake was measured on a per cage basis. Average daily feed intake (ADFI), average daily gain (ADG) and the feed intake/weight gain (F/G) ratio were calculated. After a 6 h fast, one duck (close to the average BW) from each replicate was selected and euthanized by electric stunning, and then the blood samples (2.5 mL) were taken from the wing vein into an anticoagulant-free vacuum test tube (5 mL), centrifuged at 3000× g for 10 min and stored at −20 °C. The ducks were opened longitudinally, both ceca were ligated and aseptically removed from the gastrointestinal tract for cecal E. coli analysis. The middle portion of jejunum (1.5 cm) was cut off and flushed residual digesta with ice-cold phosphate-buffered saline (PBS), and then fixed in 10% neutral formalin for intestinal histomorphology analysis [19]. The mucosa of jejunum segments was gently scraped and snap-frozen in liquid nitrogen and then transferred to a −80 °C freezer till analyzed.
2.5. Cecal E. coli
Cecal contents were obtained from the ligated ceca on days 9, 14 and 28. The viable counts of E. coli were analyzed by the method of Manafi [20]. Briefly, the cecal contents of each bird were pooled and serially diluted. E. coli was counted on Eosin Methylene Blue agar plates after incubation 24 h at 37 °C. The colony-forming unit was defined as distinct colony at least one mm in diameter.
2.6. Serum Indices
The serum albumin, total protein and LPS levels were measured using commercial assay kits (Nanjing Jiancheng Bioengineering Institute, Nanjing, China. The catalog numbers were A028-1-1, A045-3-2 and H255, respectively) by colorimetric method (UV-2550, Shimadzu, Japan). Because the total protein in serum mainly consists of globulin and albumin, the globulin content was obtained by subtracting the albumin value from that of the total protein [21]. Serum total antioxidant capacity (T-AOC), activity of total superoxide dismutase (T-SOD) and malonaldehyde (MDA) concentration were determined by the commercial assay kits (Nanjing Jiancheng Bioengineering Institute, Nanjing, China. The catalog numbers were A015-2-1, A001-1-2 and A003-2-2, respectively) with an automated fluorescence instrument (MultiskanM™ SkyHigh, Thermo Fisher Scientific, Waltham, MA, USA).
2.7. Intestinal Morphology
The middle portion of jejunum was fixed in formalin for 24 h, embedded in paraffin, deparaffinized, dehydrated and stained, observed the jejunum morphological structure by Motic Panthera Moticam 5 trinocular microscope BA210LED (Motic Incorporation Ltd., Hong Kong, China) and analyzed by Moticam digital imaging system (Motic images Software Plus 2.0, Motic Incorporation Ltd., Hong Kong, China). Villus height and crypt depth were measured at least 10 well-oriented villus and then calculated the villus height/crypt depth ratio (V/C) ratio. The measurement has referred to the method of Lin [22].
2.8. ROS Production and ATP Level of Jejunum
The reactive oxygen species (ROS) production of jejunum was measured by using the ROS commercial assay kits (S0033S. Beyotime Institute of Biotechnology, Haimen, China) and 2,7-dichlorofluorescein diacetate as fluorescence probe. The specific process was carried out as the method of Zhang [23,24]. The adenosine triphosphate (ATP) level was determined by the commercial ATP assay kits (BC0305. Solarbio, Beijing, China).
2.9. RNA-Seq Analysis of the Jejunum
The RNA-Seq analysis was performed on 12 jejunum samples from PC and BS groups. The middle portion of jejunum was collected on day 14. Total RNA in jejunum tissues was extracted by Trizol kits (Invitrogen, Carlsbad, CA, USA) and treated by DNase I to avoid DNA contamination. RNA concentration was determined by Nanodrop 2000. Total RNA was analyzed qualitatively and quantitatively using Agilent 2100 (Agilent Technologies, Inc., Palo Alto, CA, USA). RNA-seq libraries were generated using NEBNext Ultra RNA Library Prep Kit for Illumina (NEB, Ipswich, MA, USA). Libraries were sequenced on a HiSeq2500 platform (Illumina Inc., San Diego, CA, USA) to generate Paired-end 100 bp raw reads.
The adaptor sequences and low-quality sequence reads were removed from the data sets using fastx-toolkit tool. These clean reads were then mapped to the reference genome sequence (Anas_platyrhynchos: ASM874695v1). Gene expression levels were quantified as fragments per kilo base of transcript per million fragments (FPKM) mapped from different jejunum samples [25]. Differential expression analysis was performed using the DESeq2 R package (1.6.3) [26]. DEGs with |fold change (FC)| ≥ 2 and false discovery rate (FDR) < 0.05 were considered as differentially expression. The differentially expressed genes (DEGs) were annotated and enriched by Kyoto Encyclopedia of Genes and Genomes (KEGG, http://www.kegg.jp/kegg/pathway.html, accessed on 13 September 2022) using the clusterProfiler R package (3.10.1).
2.10. RT-qPCR
Nine DEGs associated with “ribosome” and “oxidative phosphorylation” pathways, including Ribosomal protein lateral stalk subunit P2 (RPLP2), Mitochondrial ribosomal protein L23 (MRPL23), NHP2 ribonucleoprotein (NHP2), NADH-ubiquinone oxidoreductase core subunit V1 (NDUFV1), Cytochrome c oxidase subunit 7B mitochondrial (COX7B), ATP synthase membrane subunit F (ATP5MF), Ribosomal protein L22 like 1 (RPL22L1), ATPase H+ transporting V1 subunit A (ATP6V1A), NADH-ubiquinone oxidoreductase subunit A6 (NDUFA6) were selected and using RT-qPCR to confirm the accuracy and reliability of RNA-Seq results. The total RNA from the jejunum tissues was isolated by TRI-zol reagent (TIANGEN, Beijing, China) and reversely transcribed into complementary DNA (cDNA) pursuant. The concentration of total RNA was determined by a spectrophotometer (Ultrospec 2100 pro, GE Healthcare, Chicago, IL, USA) and purified by agarose gel electrophoresis. Then 500 ng total RNA was reversely transcribed into cDNA using the primescript of Fast Quant RT Kit (TIANGEN, Beijing, China). The qPCR was conducted by the Biosystems Bio-Rad Real-Time PCR system (Bio-Rad, Carlsbad, CA, USA) with the Brilliant SYBR Green qPCR Master Mix (Stratagene, La Jolla, CA, USA). The primers used are listed in (Supplementary Table S2). The beta-actin (β-actin) was used to normalize the expression of the targeted genes. The mRNA level of the relative genes was calculated using the method of 2−ΔΔCt [27]. All samples were analyzed in triplicate and the geometric mean of internal references.
2.11. Statistical Analysis
Each replicate cage was considered as the experimental unit for growth performance data, whereas the individual duck in each replicate was the experimental unit for other parameters analysis (n = 6). The data were analyzed by a one-factor ANOVA procedure of SPSS19.0 software package for Windows (SPSS Inc., Chicago, IL, USA). Significant differences between groups were separated using Duncan’s multiple range test. Differences were considered significant at p < 0.05. The graphs were designed using GraphPad Prism 9 Project (GraphPad Software Inc., San Diego, CA, USA) and Origin 8.5 (Origin Lab, Berkeley, CA, USA).
3. Results
3.1. Oral Challenge, Growth Performance and Serum Parameters
The challenge with E. coli significantly increased the population of E. coli in the cecum of ducks on day 9 (p < 0.01, Figure 2), which indicates that the infection model was successfully established. When these birds were also treated with ANT or BS, the population of E. coli in their cecum showed a significant reduction when compared with the PC group on day 14 (p < 0.01). Moreover, the amount of E. coli was not a significant difference was found on day 28 between the ANT, BS and NC groups.
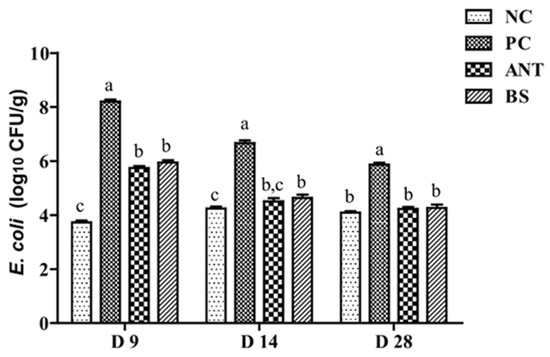
Figure 2.
Effect of B. subtilis on the quantity of E. coli in the cecum of ducks challenged with E. coli. NC–negative group, basal diet without E. coli challenge. PC–positive group, basal diet with E. coli challenge. ANT–antibiotic group, basal diet + virginiamycin (30 mg/kg) with E. coli challenge. BS–basal diet + 2.5 × 10⁹ CFU/kg B. subtilis with E. coli challenge. Data are indicated as means ± SEM. a,b,c Values, for the same day, with different superscripts are significantly different (p < 0.05). The individual duck in each replicate was the experimental unit (n = 6).
The response to growth performance is shown in Table 1. Ducks in the PC group had the lowest BW on day 14 and ADG during days 9–14 and had the highest F/G ratio during days 14–28 and overall (p < 0.05). B. subtilis supplementation significantly increased the BW and ADG during the whole period and decreased the F/G ratio during days 14–28 compared to the PC group (p < 0.05). There was no significant difference in ADG, ADFI and F/G ratio between the BS and ANT groups.

Table 1.
Effect of B. subtilis on growth performance of ducks challenged with E. coli.
As shown in Table 2, the E. coli challenge significantly decreased the albumin level, A/G ratio and increased the LPS level on days 9 and 14, increasing the globulin level on day 9 (p < 0.05). While B. subtilis supplementation significantly increased the A/G ratio on day 14 compared to the PC group (p < 0.05). There was no significant difference in albumin, globulin and A/G ration between BS and ANT groups.
Table 2.
Effect of B. subtilis on serum albumin, globulin, A/G ratio and LPS content of ducks challenged with E. coli.
Serum antioxidant indices of ducks are shown in Figure 3. Compared with the NC group, the PC group had lowered the T-AOC level in the whole test stage, lower T-SOD and higher MDA level on days 9 and 14 (p < 0.05). The BS group had higher T-AOC levels on days 14 and 28, higher T-SOD levels on day 14 and lower MDA levels on day 14 than the PC group (p < 0.05). There was no difference in T-AOC, T-SOD and MDA levels between the BS and ANT groups.
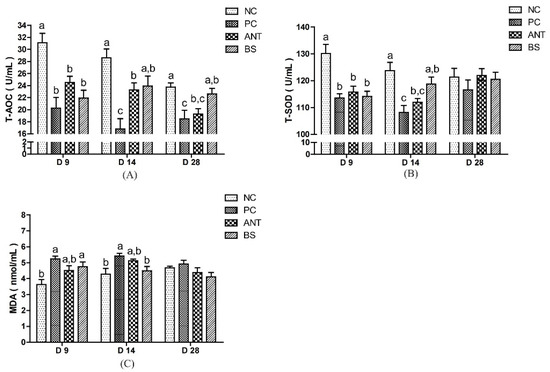
Figure 3.
Effect of B. subtilis on serum antioxidant parameters of ducks challenged with E. coli. NC–negative group, basal diet without E. coli challenge. PC–positive group, basal diet with E. coli challenge. ANT–antibiotic group, basal diet + virginiamycin (30 mg/kg) with E. coli challenge. BS–basal diet + 2.5 × 10⁹ CFU/kg B. subtilis with E. coli challenge. Data are indicated as means ± SEM. The individual duck in each replicate was the experimental unit (n = 6). (A) T-AOC, total antioxidant capacity. (B) T-SOD, total superoxide dismutase. (C) MDA, malonaldehyde. a,b,c Values, for the same parameter and day, with different superscripts are significantly different (p < 0.05).
3.2. Intestinal Morphology, ROS Production and ATP Level
Changes in the intestinal morphology of ducks are shown in Figure 4. Compared with the NC group, the villus height and V/C ratio of the PC group were lower on days 9 and 14 (p < 0.05). The BS group had higher villus height and V/C ratio than the PC group on days 9 and 14 (p < 0.05). The villus height was higher for ducks in the BS group than in the ANT group on day 9 (p < 0.05). There was no significant difference in crypt depth among these four groups. The histological examination showed normal jejunal villous structure for the NC group, disorganized and interrupted and incomplete for the PC group, and to some extent repaired for the BS group.
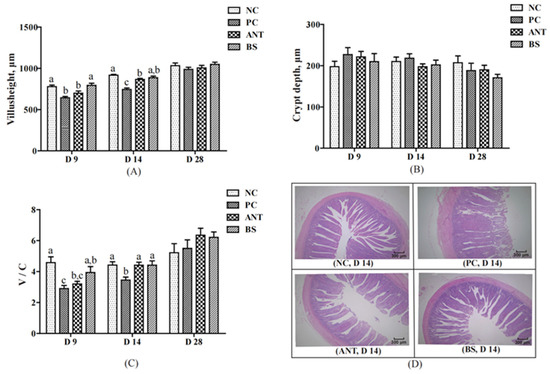
Figure 4.
Effect of B. subtilis on jejunum histomorphology of ducks challenged with E. coli. NC–negative group, basal diet without E. coli challenge. PC–positive group, basal diet with E. coli challenge. ANT–antibiotic group, basal diet + virginiamycin (30 mg/kg) with E. coli challenge. BS–basal diet + 2.5 × 10⁹ CFU/kg B. subtilis with E. coli challenge. Data are indicated as means ± SEM. The individual duck in each replicate was the experimental unit (n = 6). (A) The villus height in jejunal of ducks. (B) The crypt depth in jejunal of ducks. (C) The ratio of villus height to crypt depth in jejunal of ducks. (D) Histological damage in jejunal of ducks on day 14. a,b,c Values, for the same parameter and day, with different superscripts are significantly different (p < 0.05).
As shown in Figure 5, E.coli infection significantly increased the ROS production of jejunum on days 9 and 14 than the NC group (p < 0.05). The antibiotic supplementation significantly decreased the ROS production on day 14 than the PC group (p < 0.05). B. subtilis treatment significantly reduced ROS production on days 9 and 14 than the PC group (p < 0.05). There was no significant difference in ROS production between the BS and the ANT groups. E.coli infection significantly decreased the ATP level of jejunum on days 9 and 14 than NC group (p < 0.05). While the B. subtilis significantly increased the ATP level than the PC and the ANT groups (p < 0.05). There was no significant difference between PC and ANT groups on days 9 and 14.
Figure 5.
Effect of B. subtilis on the ROS production and ATP levels of jejunum in ducks challenged with E. coli. NC–negative group, basal diet without E. coli challenge. PC–positive group, basal diet with E. coli challenge. ANT–antibiotic group, basal diet + virginiamycin (30 mg/kg) with E. coli challenge. BS–basal diet + 2.5 × 10⁹ CFU/kg B. subtilis with E. coli challenge. Data are indicated as means ± SEM. The individual duck in each replicate was the experimental unit (n = 6). (A) ROS, reactive oxygen species. (B) ATP, adenosine triphosphate. a,b,c Values, for the same parameter and day, with different superscripts are significantly different (p < 0.05).
3.3. RNA-Seq Analysis of the Jejunum
To define the mechanism underlying the biological effects of B. subtilis that facilitates the recovery from E. coli-induced damage, the 12 sequencing libraries from the PC group (PC-1, PC-2, PC-3, PC-4, PC-5, PC-6) and the BS group (BS-1, BS-2, BS-3, BS-4, BS-5, BS-6) were constructed. After quality control of sequencing data, 20,587,116–31,570,825 clean reads were obtained to establish 12 RNA-Seq libraries. The clean data of each sample reached 6.14 GB, the GC content ranged from 50.45% to 53.05% and the percentage of Q30 base was above 94.32%. Sequence alignment of each sample was conducted against the designated reference genome with an efficiency from 87.89 to 91.80%. Statistics of the sequencing data are provided in Table 3.
Table 3.
Characteristics of the reads from 12 duck’s jejunum libraries.
FPKM was applied to determine the expression of genes. Volcano plots of transcriptome sequencing data were used to visualize the distribution of DEGs between the two groups. A total of 1267 genes were differentially expressed between the PC and BS groups. Of those, 544 were up-regulated and 723 were down-regulated (Figure 6A).
Figure 6.
RNA-seq analysis of the jejunum tissue of ducks (PC VS BS). PC–positive group, basal diet with E. coli challenge. BS–basal diet + 2.5 × 10⁹ CFU/kg B. subtilis with E. coli challenge. (A) Volcano plot of differentially expressed genes. X-axis shows log2 (FC) of DEGs between each two groups, Y-axis represents the statistically significant negative logarithm value of the gene expression change; Each point in the volcanic map represents a gene, Red represents increased expression while green represents decreased expression; (B) Dot plot of KEGG pathway enrichment analyses of differentially expressed genes.
We performed a KEGG pathway enrichment analysis for the 1267 DEGs, and a scatter plot of KEGG data was created by selecting the top 20 enriched pathways (Figure 6B). Among them, ribosome (ko03010) and oxidative phosphorylation (ko00190) were the most significant predictors (p < 0.01). All DEGs involved in the ribosome pathway were up-regulated, while DEGs involved in the oxidative phosphorylation pathway showed varied expression patterns. Taking a further step, the KEGG annotations of DEGs were classified according to the type of cellular processes, environmental information processing, genetic information processing, human disease, metabolism and organismal system pathways. A detailed classification is shown in Supplementary Figure S1. The 50 canonical pathways were observed among DEGs, of which the highest enriched pathways are ribosome (13.54%) and oxidative phosphorylation (6.68%). The top 10 key DEGs known functions related to these pathways are listed in Table 4 and Table 5, respectively. Compared with the PC group, B. subtilis supplementation increased the expression of ribosomal protein lateral stalk subunit, mitochondrial ribosomal protein and NHP2 ribonucleoprotein. B. subtilis also increased the expression of genes associated with oxidative phosphorylation metabolism, including NADH-ubiquinone oxidoreductase core subunit, mitochondrial Cytochrome c oxidase subunit and ATP synthase membrane subunit. These findings indicate that B. subtilis may be involved in the generation of ribosomes and energy metabolism.
Table 4.
The top 10 DEGs with known functions contained in ribosome pathway.
Table 5.
The top 10 DEGs with known functions contained in oxidative phosphorylation pathway.
3.4. Validation of Gene Expression by Using RT-qPCR
Nine genes involved in pathways of ribosomal (RPLP2, MRPL23, NHP2, RPL22L1) and oxidative phosphorylation (NDUFV1, COX7B, ATP5MF, ATP6V1A, NDUFA6) were selected for validation by RT-qPCR. Their results showed that, compared with PC ducks, B. subtilis increased the expression of RPLP2, MRPL23, NHP2, RPL22L1, NDUFV1, COX7B, ATP5MF, NDUFA6 and decreased the expression of ATP6V1A to varying degrees. The changes in the relative expression levels of the RT-qPCR showed similar trends to the transcriptome-sequencing analyses (Figure 7), suggesting that the RNA-Seq data are reliable.
Figure 7.
Relative expression levels from RT-qPCR. PC–positive group, basal diet with E. coli challenge. BS–basal diet + 2.5 × 10⁹ CFU/kg B. subtilis with E. coli challenge. The relative expression values were normalized to the β-actin gene. RPLP2: Ribosomal protein lateral stalk subunit P2; MRPL23: Mitochondrial ribosomal protein L23; NHP2: NHP2 ribonucleoprotein; NDUFV1: NADH-ubiquinone oxidoreductase core subunit V1; COX7B: Cytochrome c oxidase subunit 7Bmitochondrial; ATP5MF: ATP synthase membrane subunit F; RPL22L1: Ribosomal protein L22 like 1; ATP6V1A: ATPase H+ transporting V1 subunit A; NDUFA6: NADH-ubiquinone oxidoreductase subunit A6.
4. Discussion
Colibacillosis is the most common infectious bacterial disease of poultry that may cause host health damage and loss of production. Antibiotics are effective in the treatment of avian colibacillosis due to the large-scale use of antibiotic growth promoters (AGP), which has caused drug residues and resistance, and threatened food safety. B. subtilis is a kind of probiotic and a potential alternative to AGP, which can improve growth performance and gut health and even resist pathogenic bacteria. Therefore, the current study was designed to investigate the effects of the probiotic B. subtilis L6 on duck health compared with AGP. Our results showed that E. coli O88 decreased the body weight of ducks, but the supplementation of virginiamycin and B. subtilis improved the growth performance of ducks challenged with E. coli., and there was no significant difference between them. This is consistent with previous studies that E.coli infection reduces productivity by threatening host health [16], but B. subtilis or its fermented products could alleviate the adverse effects on the growth performance of broilers challenged with LPS or E. coli [28,29].
The pathogenic E. coli could cause septic multiple organ inflammation and injury. Serum biochemical indexes are closely related to metabolism, in which ALB and GLB are the two major components of serum proteins. The albumin level represents the systemic inflammatory response and appears to be used as biomarkers of kidney or liver damage. The globulin level is associated with chronic inflammation and participates in the process of inflammation response [30]. The A/G ratio reflects the immune response capacity of the body, and the decrease in the ratio indicates the presence of immunologic injury [31]. LPS is the main outer component of E. coli and is also an important virulence factor for E. coli infection, which can cause oxidativee stress and immune response, seriously threatening the immune system of the host [32,33,34]. In the current study, B. subtilis alleviates the negative impacts of E. coli. In support of these findings, Manafi and Erinle reported that probiotics could play an active role in the regulation of serum biochemical parameters through multiple mechanisms when broilers were challenged with E. coli [20,33]. As the gram-negative bacterial cell wall component [35], LPS may leak into the bloodstream through the damaged intestinal mucosa [36], providing opportunities for the invasion of harmful metabolites and pathogens, consequently, triggering a robust systemic inflammatory response [37]. We found that pathogenic E.coli increased the levels of LPS in the serum, but this negative impact was well alleviated by B. subtilis, which suggested that specific probiotic strains could decrease LPS and maintain immune homeostasis.
The oxidative stress is caused by an imbalance between the antioxidant and pro-oxidative systems [38]. The T-SOD, T-AOC activity and MDA level are the main indices to evaluate the oxidation state of the body. Of these, T-SOD can regulate the balance in vivo through enzymatic reactions [39]. The T-AOC reflects the ability of the non-enzymatic antioxidant defense system [40]. MDA is an end product of lipid peroxidation and also a biomarker of oxidative stress [41]. It was reported that the pathogenic microorganism’s infection or LPS induced oxidative stress [42], while probiotics may enhance antioxidant defenses in tissues [43]. In the present study, the decrease in T-AOC and T-SOD activities and the increase in MDA concentration of the PC group indicated that the E. coli infection caused oxidative stress reactions in ducks. Conversely, B. subtilis alleviated the changes in the biomarker of oxidative stress, which might be due to the fact that B. subtilis counteracted oxidative stresses by promoting the early innate immune system [44]. In terms of the mechanism explanation, it is possible that B. subtilis competes with E. coli for attachment sites and nutrients in the intestine and reduces the initialization step of oxidative stress caused by E. coli. Moreover, B. Subtilis may also play some role in the repair of oxidative lesions [45,46].
The integrity of the gut structure is related to gut health and nutrient absorption [47]. Intestinal villus height, crypt depth and V/C ratio are important indicators to measure the intestinal barrier function and absorption ability [48]. E. coli infection could seriously damage the morphology and structure of the intestinal tract by decreasing the villi height and increasing the crypt depth [49]. Studies have shown that B. subtilis strains can improve gut histomorphological indices and promote the repair of tissue damage in animals infected by pathogenic bacteria [29,50]. Our results showed that E. coli infection severely disrupted the morphological structure of the jejunum in early-stage ducks; however, B. subtilis was more beneficial to maintaining the morphology of the intestinal epithelium and repairing intestinal barrier damage caused by E. coli infection than the virginiamycin, which also provided a reasonable explanation for the improvement in growth performance of ducks in the BS group.
Mitochondria are the main source of physiological and pathological ROS and also an important part of ROS elimination. The outbreak and excessive accumulation of ROS in the mitochondrial respiratory chain, which exceeds the scavenging capacity of the antioxidant system, may cause mitochondrial dysfunction, including impaired mitochondrial respiratory complex activity and reduced ATP level [51]. The current study indicated that ROS content in jejunum tissue increased, and ATP level decreased after the E. coli challenge, indicating that the mitochondrial respiratory chain is damaged.
In recent years, the effects of cellular energy metabolism in regulating intestinal inflammatory diseases have received increasing attention [52,53]. The mitochondrion plays a central role in energy metabolism homeostasis through the respiratory chain. ATP synthesis takes place in the mitochondria by oxidative phosphorylation [54,55]. Mitochondrial oxidative phosphorylation contributes to producing enough ATP for the body to use [56], and once this process is disrupted and ATP synthesis is also affected [57]. Inflammation and metabolic diseases are associated with mitochondrial dysfunction. It has been demonstrated that E. coli infection can damage the intestinal barrier and trigger mucosal inflammatory responses subsequently in ducks, which is an energy-consuming process [58]. In the previous study, ducks infected with E. coli impaired the growth performance of ducks through an interfering energy metabolism pathway, down-regulating gene expression related to the ribosome and oxidative phosphorylation [59]. In the present study, B. subtilis reduced intestinal oxidative stress through interfering with ribosome and energy metabolism by up-regulating the expression of genes that encode mitochondrial ribosome proteins, ribosome biogenesis and translation factors. There was evidence that increased expression of ribosomal protein genes was associated with increased cellular growth and that it could be regulated by a variety of upstream factors [60]. The potential mechanism may involve the lysate or secreted chemical inducer of probiotics [61]. Apart from this, B. subtilis up-regulated the oxidative phosphorylation complex genes and restored mitochondrial function damaged by E. coli infection. This was similar to the report that after the damage to the intestine, the activities of jejunal mitochondrial respiratory complexes and the level of ATP were reduced [22]. The mechanism was also demonstrated at the cellular level. The LPS-activated-macrophages are characterized by high glycolysis and low oxidative phosphorylation [62,63], B. subtilis may be reversed this process.
5. Conclusions
In conclusion, pathogenic E. coli O88 could cause systemic injuries to ducks, including oxidative stress, triggered inflammatory responses and impaired growth performance of ducks. These changes may be effectively mitigated by B. subtilis supplementation, and the effectiveness of the treatment was comparable to that of virginiamycin. The possible molecular mechanism was that B. subtilis impacted the energy metabolism of intestinal cells by up-regulating the pathways related to the ribosome and oxidative phosphorylation so as to reduce the oxidative stress and inflammatory response induced by E. coli O88 and promote growth performance.
Supplementary Materials
The following supporting information can be downloaded at: https://www.mdpi.com/article/10.3390/antiox11101951/s1, Table S1: Analysis composition of basal diets and nutrient level (air-dry basis, %); Table S2: Primers used for the RT-qPCR in this study; Table S3: The KEGG pathway enrichment analysis of DEGs; Figure S1: The KEGG classification of DEGs.
Author Contributions
C.L., S.L. and W.C., Conceptualization; C.L., Y.L. and G.L., Methodology; C.L. and H.C., investigation, software, data curation and writing-original draft preparation; Y.L. and X.D. validation and resources; S.C. and S.L., formal analysis; W.C. and H.C., writing review, editing and supervision; W.C. project administration and funding acquisition. All authors have read and agreed to the published version of the manuscript.
Funding
This research was funded by Agricultural Science and Technology Innovation Program (ASTIP) and the Collaborative Innovation Task in Agricultural Science and Technology Innovation Program (CAAS-XTCX).
Institutional Review Board Statement
All experimental procedures were approved by the Animal Ethics Committee of the Chinese Academy of Agricultural Sciences (AEC-CAAS-20191106, Beijing, China).
Informed Consent Statement
Not applicable.
Data Availability Statement
The original contributions presented in the study are included in the article/supplementary material, further inquiries can be directed to the corresponding author. The raw sequence reads of ducks were deposited in NCBI’s Sequence Read Archive (SRA) database and accessible through accession No. PRJNA835725.
Acknowledgments
C.L. gratefully acknowledges financial support from the China Scholarship Council (No. 202103250085).
Conflicts of Interest
The authors declare no conflict of interest.
References
- Da Rosa, G.; Da Silva, A.S.; Souza, C.F.; Baldissera, M.D.; Mendes, R.E.; Araujo, D.N.; Alba, D.F.; Boiago, M.M.; Stefani, L.M. Impact of Colibacillosis on Production in Laying Hens Associated with Interference of the Phosphotransfer Network and Oxidative Stress. Microb. Pathog. 2019, 130, 131–136. [Google Scholar] [CrossRef]
- Abbas, A.O.; Alaqil, A.A.; El-Beltagi, H.S.; Abd El-Atty, H.K.; Kamel, N.N. Modulating Laying Hens Productivity and Immune Performance in Response to Oxidative Stress Induced by E. Coli Challenge Using Dietary Propolis Supplementation. Antioxidants 2020, 9, 893. [Google Scholar] [CrossRef]
- Bi, S.; Qu, Y.; Shao, J.; Zhang, J.; Li, W.; Zhang, L.; Ni, J.; Cao, L. Ginsenoside Rg3 Ameliorates Stress of Broiler Chicks Induced by Escherichia Coli Lipopolysaccharide. Front. Vet. Sci. 2022, 9, 384. [Google Scholar] [CrossRef]
- Li, R.; Lin, J.; Hou, X.; Han, S.; Weng, H.; Xu, T.; Li, N.; Chai, T.; Wei, L. Characterization and Roles of Cherry Valley Duck Nlrp3 in Innate Immunity during Avian Pathogenic Escherichia Coliinfection. Front. Immunol. 2018, 9, 2300. [Google Scholar] [CrossRef]
- Jeong, J.; Lee, J.Y.; Kang, M.S.; Lee, H.J.; Kang, S.I.L.; Lee, O.M.; Kwon, Y.K.; Kim, J.H. Comparative Characteristics and Zoonotic Potential of Avian Pathogenic Escherichia Coli (APEC) Isolates from Chicken and Duck in South Korea. Microorganisms 2021, 9, 946. [Google Scholar] [CrossRef]
- Song, Y.; Yu, L.; Zhang, Y.; Dai, Y.; Wang, P.; Feng, C.; Liu, M.; Sun, S.; Xie, Z.; Wang, F. Prevalence and Characteristics of Multidrug-Resistant Mcr-1-Positive Escherichia Coli Isolates from Broiler Chickens in Tai’an, China. Poult. Sci. 2020, 99, 1117–1123. [Google Scholar] [CrossRef]
- Ma, J.; Mahfuz, S.; Wang, J.; Piao, X. Effect of Dietary Supplementation with Mixed Organic Acids on Immune Function, Antioxidative Characteristics, Digestive Enzymes Activity, and Intestinal Health in Broiler Chickens. Front. Nutr. 2021, 8, 673316. [Google Scholar] [CrossRef]
- Shini, S.; Aland, R.C.; Bryden, W.L. Avian Intestinal Ultrastructure Changes Provide Insight into the Pathogenesis of Enteric Diseases and Probiotic Mode of Action. Sci. Rep. 2021, 11, 167. [Google Scholar] [CrossRef]
- Al-Khalaifa, H.; Al-Nasser, A.; Al-Surayee, T.; Al-Kandari, S.; Al-Enzi, N.; Al-Sharrah, T.; Ragheb, G.; Al-Qalaf, S.; Mohammed, A. Effect of Dietary Probiotics and Prebiotics on the Performance of Broiler Chickens. Poult. Sci. 2019, 98, 4465–4479. [Google Scholar] [CrossRef]
- Gharib-Naseri, K.; Dorigam, J.C.P.; Doranalli, K.; Morgan, N.; Swick, R.A.; Choct, M.; Wu, S.B. Bacillus Amyloliquefaciens CECT 5940 Improves Performance and Gut Function in Broilers Fed Different Levels of Protein and/or under Necrotic Enteritis Challenge. Anim. Nutr. 2021, 7, 185–197. [Google Scholar] [CrossRef]
- Rehman, A.; Arif, M.; Sajjad, N.; Al-Ghadi, M.Q.; Alagawany, M.; Abd El-Hack, M.E.; Alhimaidi, A.R.; Elnesr, S.S.; Almutairi, B.O.; Amran, R.A.; et al. Dietary Effect of Probiotics and Prebiotics on Broiler Performance, Carcass, and Immunity. Poult. Sci. 2020, 99, 6946–6953. [Google Scholar] [CrossRef]
- Zheng, A.; Luo, J.; Meng, K.; Li, J.; Bryden, W.L.; Chang, W.; Zhang, S.; Wang, L.X.N.; Liu, G.; Yao, B. Probiotic (Enterococcus Faecium) Induced Responses of the Hepatic Proteome Improves Metabolic Efficiency of Broiler Chickens (Gallus Gallus). BMC Genom. 2016, 17, 89. [Google Scholar] [CrossRef]
- Jeong, J.S.; Kim, I.H. Effect of Bacillus Subtilis C-3102 Spores as a Probiotic Feed Supplement on Growth Performance, Noxious Gas Emission, and Intestinal Microflora in Broilers. J. Name Poult. Sci. 2014, 93, 3097–3103. [Google Scholar] [CrossRef]
- Bai, K.; Huang, Q.; Zhang, J.; He, J.; Zhang, L.; Wang, T. Supplemental Effects of Probiotic Bacillus Subtilis FmbJ on Growth Performance, Antioxidant Capacity, and Meat Quality of Broiler Chickens. Poult. Sci. 2017, 96, 74–82. [Google Scholar] [CrossRef]
- Nguyen, A.T.V.; Nguyen, D.V.; Tran, M.T.; Nguyen, L.T.; Nguyen, A.H.; Phan, T. Isolation and Characterization of Bacillus Subtilis CH16 Strain from Chicken Gastrointestinal Tracts for Use as a Feed Supplement to Promote Weight Gain in Broilers. Lett. Appl. Microbiol. 2015, 6, 580–588. [Google Scholar] [CrossRef]
- Liu, J.; Liu, G.; Chen, Z.; Zheng, A.; Cai, H.; Chang, W.; Li, C.; Chen, J.; Wu, Z. Effects of Glucose Oxidase on Growth Performance, Immune Function, and Intestinal Barrier of Ducks Infected with Escherichia Coli O88. Poult. Sci. 2020, 99, 6549–6558. [Google Scholar] [CrossRef]
- Nikoskelainen, S.; Ouwehand, A.C.; Bylund, G.; Salminen, S.; Lilius, E.M. Immune Enhancement in Rainbow Trout (Oncorhynchus Mykiss) by Potential Probiotic Bacteria (Lactobacillus Rhamnosus). Fish. Shellfish Immunol. 2003, 15, 443–452. [Google Scholar] [CrossRef]
- Kilkenny, C.; Browne, W.J.; Cuthi, I.; Emerson, M.; Altman, D.G. Improving Bioscience Research Reporting: The ARRIVE Guidelines for Reporting Animal Research. Vet. Clin. Pathol. 2012, 41, 27–31. [Google Scholar] [CrossRef]
- Watkins, E.J.; Butler, P.J.; Kenyon, B.P. Posthatch Growth of the Digestive System in Wild and Domesticated Ducks. Br. Poult. Sci. 2004, 45, 331–341. [Google Scholar] [CrossRef]
- Manafi, M.; Khalaji, S.; Hedayati, M.; Pirany, N. Efficacy of Bacillus Subtilis and Bacitracin Methylene Disalicylate on Growth Performance, Digestibility, Blood Metabolites, Immunity, and Intestinal Microbiota after Intramuscular Inoculation with Escherichia Coli in Broilers. Poult. Sci. 2017, 96, 1174–1183. [Google Scholar] [CrossRef]
- Abo El-Maaty, H.A.; EL-Khateeb, A.Y.; Al-Khalaifah, H.; El-Sayed, E.S.A.; Hamed, S.; El-Said, E.A.; Mahrose, K.M.; Metwally, K.; Mansour, A.M. Effects of Ecofriendly Synthesized Calcium Nanoparticles with Biocompatible Sargassum Latifolium Algae Extract Supplementation on Egg Quality and Scanning Electron Microscopy Images of the Eggshell of Aged Laying Hens. Poult. Sci. 2021, 100, 675. [Google Scholar] [CrossRef]
- Lin, Q.; Zhao, J.; Xie, K.; Wang, Y.; Hu, G.; Jiang, G.; Dai, Q.; Fan, Z.; He, J.; He, X.; et al. Magnolol Additive as a Replacer of Antibiotic Enhances the Growth Performance of Linwu Ducks. Anim. Nutr. 2017, 3, 132–138. [Google Scholar] [CrossRef]
- Zhang, J.; Yang, Y.; Han, H.; Zhang, L.; Wang, T. Bisdemethoxycurcumin Protects Small Intestine from Lipopolysaccharide-Induced Mitochondrial Dysfunction via Activating Mitochondrial Antioxidant Systems and Mitochondrial Biogenesis in Broiler Chickens. Oxid. Med. Cell. Longev. 2021, 2021, 9927864. [Google Scholar] [CrossRef]
- Zhang, J.; Bai, K.W.; He, J.; Niu, Y.; Lu, Y.; Zhang, L.; Wang, T. Curcumin Attenuates Hepatic Mitochondrial Dysfunction through the Maintenance of Thiol Pool, Inhibition of MtDNA Damage, and Stimulation of the Mitochondrial Thioredoxin System in Heat-Stressed Broilers. J. Anim. Sci. 2018, 96, 867–879. [Google Scholar] [CrossRef]
- Florea, L.; Song, L.; Salzberg, S.L. Thousands of Exon Skipping Events Differentiate among Splicing Patterns in Sixteen Human Tissues. F1000Research 2013, 2, 188. [Google Scholar] [CrossRef]
- Love, M.I.; Huber, W.; Anders, S. Moderated Estimation of Fold Change and Dispersion for RNA-Seq Data with DESeq2. Genome Biol. 2014, 15, 550. [Google Scholar] [CrossRef]
- Livak, K.J.; Schmittgen, T.D. Analysis of Relative Gene Expression Data Using Real-Time Quantitative PCR and the 2−ΔΔCT Method. Methods 2001, 25, 402–408. [Google Scholar] [CrossRef]
- Chen, J.Y.; Yu, Y.H. Bacillus Subtilis–Fermented Products Ameliorate the Growth Performance and Alter Cecal Microbiota Community in Broilers under Lipopolysaccharide Challenge. Poult. Sci. 2021, 100, 875–886. [Google Scholar] [CrossRef]
- Dong, Y.; Li, R.; Liu, Y.; Ma, L.; Zha, J.; Qiao, X.; Chai, T.; Wu, B. Benefit of Dietary Supplementation with Bacillus Subtilis BYS2 on Growth Performance, Immune Response, and Disease Resistance of Broilers. Probiot. Antimicrob. Proteins 2020, 12, 1385–1397. [Google Scholar] [CrossRef]
- Li, K.; Fu, W.; Bo, Y.; Zhu, Y. Effect of Albumin-Globulin Score and Albumin to Globulin Ratio on Survival in Patients with Heart Failure: A Retrospective Cohort Study in China. BMJ Open 2018, 8, e022960. [Google Scholar] [CrossRef]
- Lumeij, J.T. Avian Clinical Biochemistry. Clin. Biochem. Domest. Anim. 1997, 5, 857–883. [Google Scholar] [CrossRef]
- Javed, M.; Ahmad, M.I.; Usmani, N.; Ahmad, M. Multiple Biomarker Responses (Serum Biochemistry, Oxidative Stress, Genotoxicity and Histopathology) in Channa Punctatus Exposed to Heavy Metal Loaded Waste Water. Sci. Rep. 2017, 7, 1675. [Google Scholar] [CrossRef]
- Erinle, T.; MacIsaac, J.; Yang, C.; Adewole, D. Effect of Red Osier Dogwood Extract on Growth Performance, Blood Biochemical Parameters, and Gut Functionality of Broiler Chickens Challenged or Unchallenged Intraperitoneally with Salmonella Enteritidis Lipopolysaccharide. Poult. Sci. 2022, 101, 101861. [Google Scholar] [CrossRef]
- Sharma, V.; Jakhar, K.K.; Nehra, V.; Kumar, S. Biochemical Studies in Experimentally Escherichia Coli Infected Broiler Chicken Supplemented with Neem (Azadirachta Indica) Leaf Extract. Vet. World 2015, 8, 1340. [Google Scholar] [CrossRef]
- Tomlinson, J.E.; Blikslager, A.T. Interactions between Lipopolysaccharide and the Intestinal Epithelium. J. Am. Vet. Med. Assoc. 2004, 224, 1446–1452. [Google Scholar] [CrossRef]
- Qu, L.; Tan, W.; Yang, J.; Lai, L.; Liu, S.; Wu, J.; Zou, W. Combination Compositions Composed of L-Glutamine and Si-Jun-Zi-Tang Might Be a Preferable Choice for 5-Fluorouracil-Induced Intestinal Mucositis: An Exploration in a Mouse Model. Front. Pharmacol. 2020, 11, 1–11. [Google Scholar] [CrossRef]
- Leng, Y.; Yi, M.; Fan, J.; Bai, Y.; Ge, Q.; Yao, G. Effects of Acute Intra-Abdominal Hypertension on Multiple Intestinal Barrier Functions in Rats. Sci. Rep. 2016, 6, 22814. [Google Scholar] [CrossRef]
- Valko, M.; Leibfritz, D.; Moncol, J.; Cronin, M.T.D.; Mazur, M.; Telser, J. Free Radicals and Antioxidants in Normal Physiological Functions and Human Disease. Int. J. Biochem. Cell Biol. 2007, 39, 44–84. [Google Scholar] [CrossRef]
- Hayes, J.D.; Dinkova-Kostova, A.T. The Nrf2 Regulatory Network Provides an Interface between Redox and Intermediary Metabolism. Trends Biochem. Sci. 2014, 39, 199–218. [Google Scholar] [CrossRef]
- Giustarini, D.; Dalle-Donne, I.; Tsikas, D.; Rossi, R. Oxidative Stress and Human Diseases: Origin, Link, Measurement, Mechanisms, and Biomarkers. Crit. Rev. Clin. Lab. Sci. 2009, 46, 241–281. [Google Scholar] [CrossRef]
- Urso, M.L.; Clarkson, P.M. Oxidative Stress, Exercise, and Antioxidant Supplementation. Toxicology 2003, 189, 41–54. [Google Scholar] [CrossRef]
- Yang, T.C.; Zhang, S.W.; Sun, L.N.; Wang, H.; Ren, A.M. Magnolol Attenuates Sepsis-Induced Gastrointestinal Dysmotility in Rats by Modulating Inflammatory Mediators. World J. Gastroenterol. 2008, 14, 7353. [Google Scholar] [CrossRef]
- Lasker, S.; Rahman, M.M.; Parvez, F.; Zamila, M.; Miah, P.; Nahar, K.; Kabir, F.; Sharmin, S.B.; Subhan, N.; Ahsan, G.U.; et al. High-Fat Diet-Induced Metabolic Syndrome and Oxidative Stress in Obese Rats Are Ameliorated by Yogurt Supplementation. Sci. Rep. 2019, 9, 20026. [Google Scholar] [CrossRef]
- Tovar-Ramírez, D.; Mazurais, D.; Gatesoupe, J.F.; Quazuguel, P.; Cahu, C.L.; Zambonino-Infante, J.L. Dietary Probiotic Live Yeast Modulates Antioxidant Enzyme Activities and Gene Expression of Sea Bass (Dicentrarchus Labrax) Larvae. Aquaculture 2010, 300, 142–147. [Google Scholar] [CrossRef]
- Plessas, S.; Bosnea, L.; Alexopoulos, A.; Bezirtzoglou, E. Potential Effects of Probiotics in Cheese and Yogurt Production: A Review. Eng. Life Sci. 2012, 12, 433–440. [Google Scholar] [CrossRef]
- Vasanth, G.K.; Kiron, V.; Kulkarni, A.; Dahle, D.; Lokesh, J.; Kitani, Y. A Microbial Feed Additive Abates Intestinal Inflammation in Atlantic Salmon. Front. Immunol. 2015, 6, 409. [Google Scholar] [CrossRef]
- Daneshmand, A.; Kermanshahi, H.; Sekhavati, M.H.; Javadmanesh, A.; Ahmadian, M. Antimicrobial Peptide, CLF36, Affects Performance and Intestinal Morphology, Microflora, Junctional Proteins, and Immune Cells in Broilers Challenged with E. coli. Sci. Rep. 2019, 9, 14167. [Google Scholar] [CrossRef]
- Inatomi, T.; Otomaru, K. Effect of Dietary Probiotics on the Semen Traits and Antioxidative Activity of Male Broiler Breeders. Sci. Rep. 2018, 8, 5874. [Google Scholar] [CrossRef]
- Ekim, B.; Calik, A.; Ceylan, A.; Saçaklı, P. Effects of Paenibacillus Xylanexedens on Growth Performance, Intestinal Histomorphology, Intestinal Microflora, and Immune Response in Broiler Chickens Challenged with Escherichia Coli K88. Poult. Sci. 2020, 99, 214–223. [Google Scholar] [CrossRef]
- Liew, W.P.P.; Mohd-Redzwan, S.; Than, L.T.L. Gut Microbiota Profiling of Aflatoxin B1-Induced Rats Treated with Lactobacillus Casei Shirota. Toxins 2019, 11, 49. [Google Scholar] [CrossRef]
- Cimolai, M.C.; Vanasco, V.; Marchini, T.; Magnani, N.D.; Evelson, P.; Alvarez, S. α-Lipoic Acid Protects Kidney from Oxidative Stress and Mitochondrial Dysfunction Associated to Inflammatory Conditions. Food Funct. 2014, 5, 3143–3150. [Google Scholar] [CrossRef]
- O’Neill, L.A.J.; Pearce, E.J. Immunometabolism Governs Dendritic Cell and Macrophage Function. J. Exp. Med. 2016, 213, 15–23. [Google Scholar] [CrossRef]
- Kingdom, U.; Kingdom, U.; London, F.; Health, N.; Foundation, S.; Kingdom, U.; Kingdom, U. Mitochondrial Dynamics Controls T Cell Fate Through Metabolic Programming. Cell 2017, 166, 63–76. [Google Scholar] [CrossRef]
- Ashton, T.M.; Gillies McKenna, W.; Kunz-Schughart, L.A.; Higgins, G.S. Oxidative Phosphorylation as an Emerging Target in Cancer Therapy. Clin. Cancer Res. 2018, 24, 2482–2490. [Google Scholar] [CrossRef]
- Fujiwara, H.; Seike, K.; Brooks, M.D.; Mathew, A.V.; Kovalenko, I.; Pal, A.; Lee, H.J.; Peltier, D.; Kim, S.; Liu, C.; et al. Mitochondrial Complex II in Intestinal Epithelial Cells Regulates T Cell-Mediated Immunopathology. Nat. Immunol. 2021, 22, 1440–1451. [Google Scholar] [CrossRef]
- Xiong, W.; Wang, R.; Mao, W.; Wu, Y.; Wang, D.; Hu, Y.; Liu, J. Icariin and Its Phosphorylated Derivatives Reduce Duck Hepatitis A Virus Serotype 1-Induced Oxidative Stress and Inflammatory Damage in Duck Embryonic Hepatocytes through Mitochondrial Regulation. Res. Vet. Sci. 2021, 139, 133–139. [Google Scholar] [CrossRef]
- Czarny, P.; Wigner, P.; Galecki, P.; Sliwinski, T. The Interplay between Inflammation, Oxidative Stress, DNA Damage, DNA Repair and Mitochondrial Dysfunction in Depression. Prog. Neuro-Psychopharmacol. Biol. Psychiatry 2018, 80, 309–321. [Google Scholar] [CrossRef]
- Pi, D.; Liu, Y.; Shi, H.; Li, S.; Odle, J.; Lin, X.; Zhu, H.; Chen, F.; Hou, Y.; Leng, W. Dietary Supplementation of Aspartate Enhances Intestinal Integrity and Energy Status in Weanling Piglets after Lipopolysaccharide Challenge. J. Nutr. Biochem. 2014, 25, 456–462. [Google Scholar] [CrossRef]
- Li, C.; Li, S.; Liu, J.; Cai, H.; Liu, G.; Deng, X.; Chang, W. Escherichia Coli O88 Induces Intestinal Damage and Inflammatory Response through the Oxidative Phosphorylation and Ribosome Pathway in Pekin Ducks. Front. Cell. Infect. Microbiol. 2022, 12, 1187. [Google Scholar] [CrossRef]
- Kim, S.; Li, Q.; Dang, C.V.; Lee, L.A. Induction of Ribosomal Genes and Hepatocyte Hypertrophy by Adenovirus-Mediated Expression of c-Myc in Vivo. Proc. Natl. Acad. Sci. USA 2000, 97, 11198–11202. [Google Scholar] [CrossRef]
- Mohammedsaeed, W.; Cruickshank, S.; McBain, A.J.; O’Neill, C.A. Lactobacillus Rhamnosus GG Lysate Increases Re-Epithelialization of Keratinocyte Scratch Assays by Promoting Migration. Sci. Rep. 2015, 5, 16147. [Google Scholar] [CrossRef]
- Vats, D.; Mukundan, L.; Odegaard, J.I.; Zhang, L.; Smith, K.L.; Morel, C.R.; Greaves, D.R.; Murray, P.J.; Chawla, A. Oxidative Metabolism and PGC-1β Attenuate Macrophage-Mediated Inflammation. Cell Metab. 2006, 4, 13–24. [Google Scholar] [CrossRef]
- Rodríguez-Prados, J.-C.; Través, P.G.; Cuenca, J.; Rico, D.; Aragonés, J.; Martín-Sanz, P.; Cascante, M.; Boscá, L. Substrate Fate in Activated Macrophages: A Comparison between Innate, Classic, and Alternative Activation. J. Immunol. 2010, 185, 605–614. [Google Scholar] [CrossRef]
Publisher’s Note: MDPI stays neutral with regard to jurisdictional claims in published maps and institutional affiliations. |
© 2022 by the authors. Licensee MDPI, Basel, Switzerland. This article is an open access article distributed under the terms and conditions of the Creative Commons Attribution (CC BY) license (https://creativecommons.org/licenses/by/4.0/).