
Dietary Intake of Flavonoids and Carotenoids Is Associated with Anti-Depressive Symptoms: Epidemiological Study and In Silico—Mechanism Analysis


Abstract
:1. Introduction
2. Materials and Methods
2.1. Subjects
2.2. Methods
2.2.1. Depressive Disorder Screening
2.2.2. Nutritional Assessment
2.2.3. Other Variables
2.2.4. Molecular Docking (In Silico Analysis)
2.2.5. Statistical Analysis
3. Results
3.1. Characteristics of the Study Participants
3.2. Flavonoid and Carotenoid Intake between the Control and Depressive Symptoms Groups
3.3. Association between Flavonoid Intake and Depressive Symptoms
3.4. Association between Carotenoid Intake and Depressive Symptoms
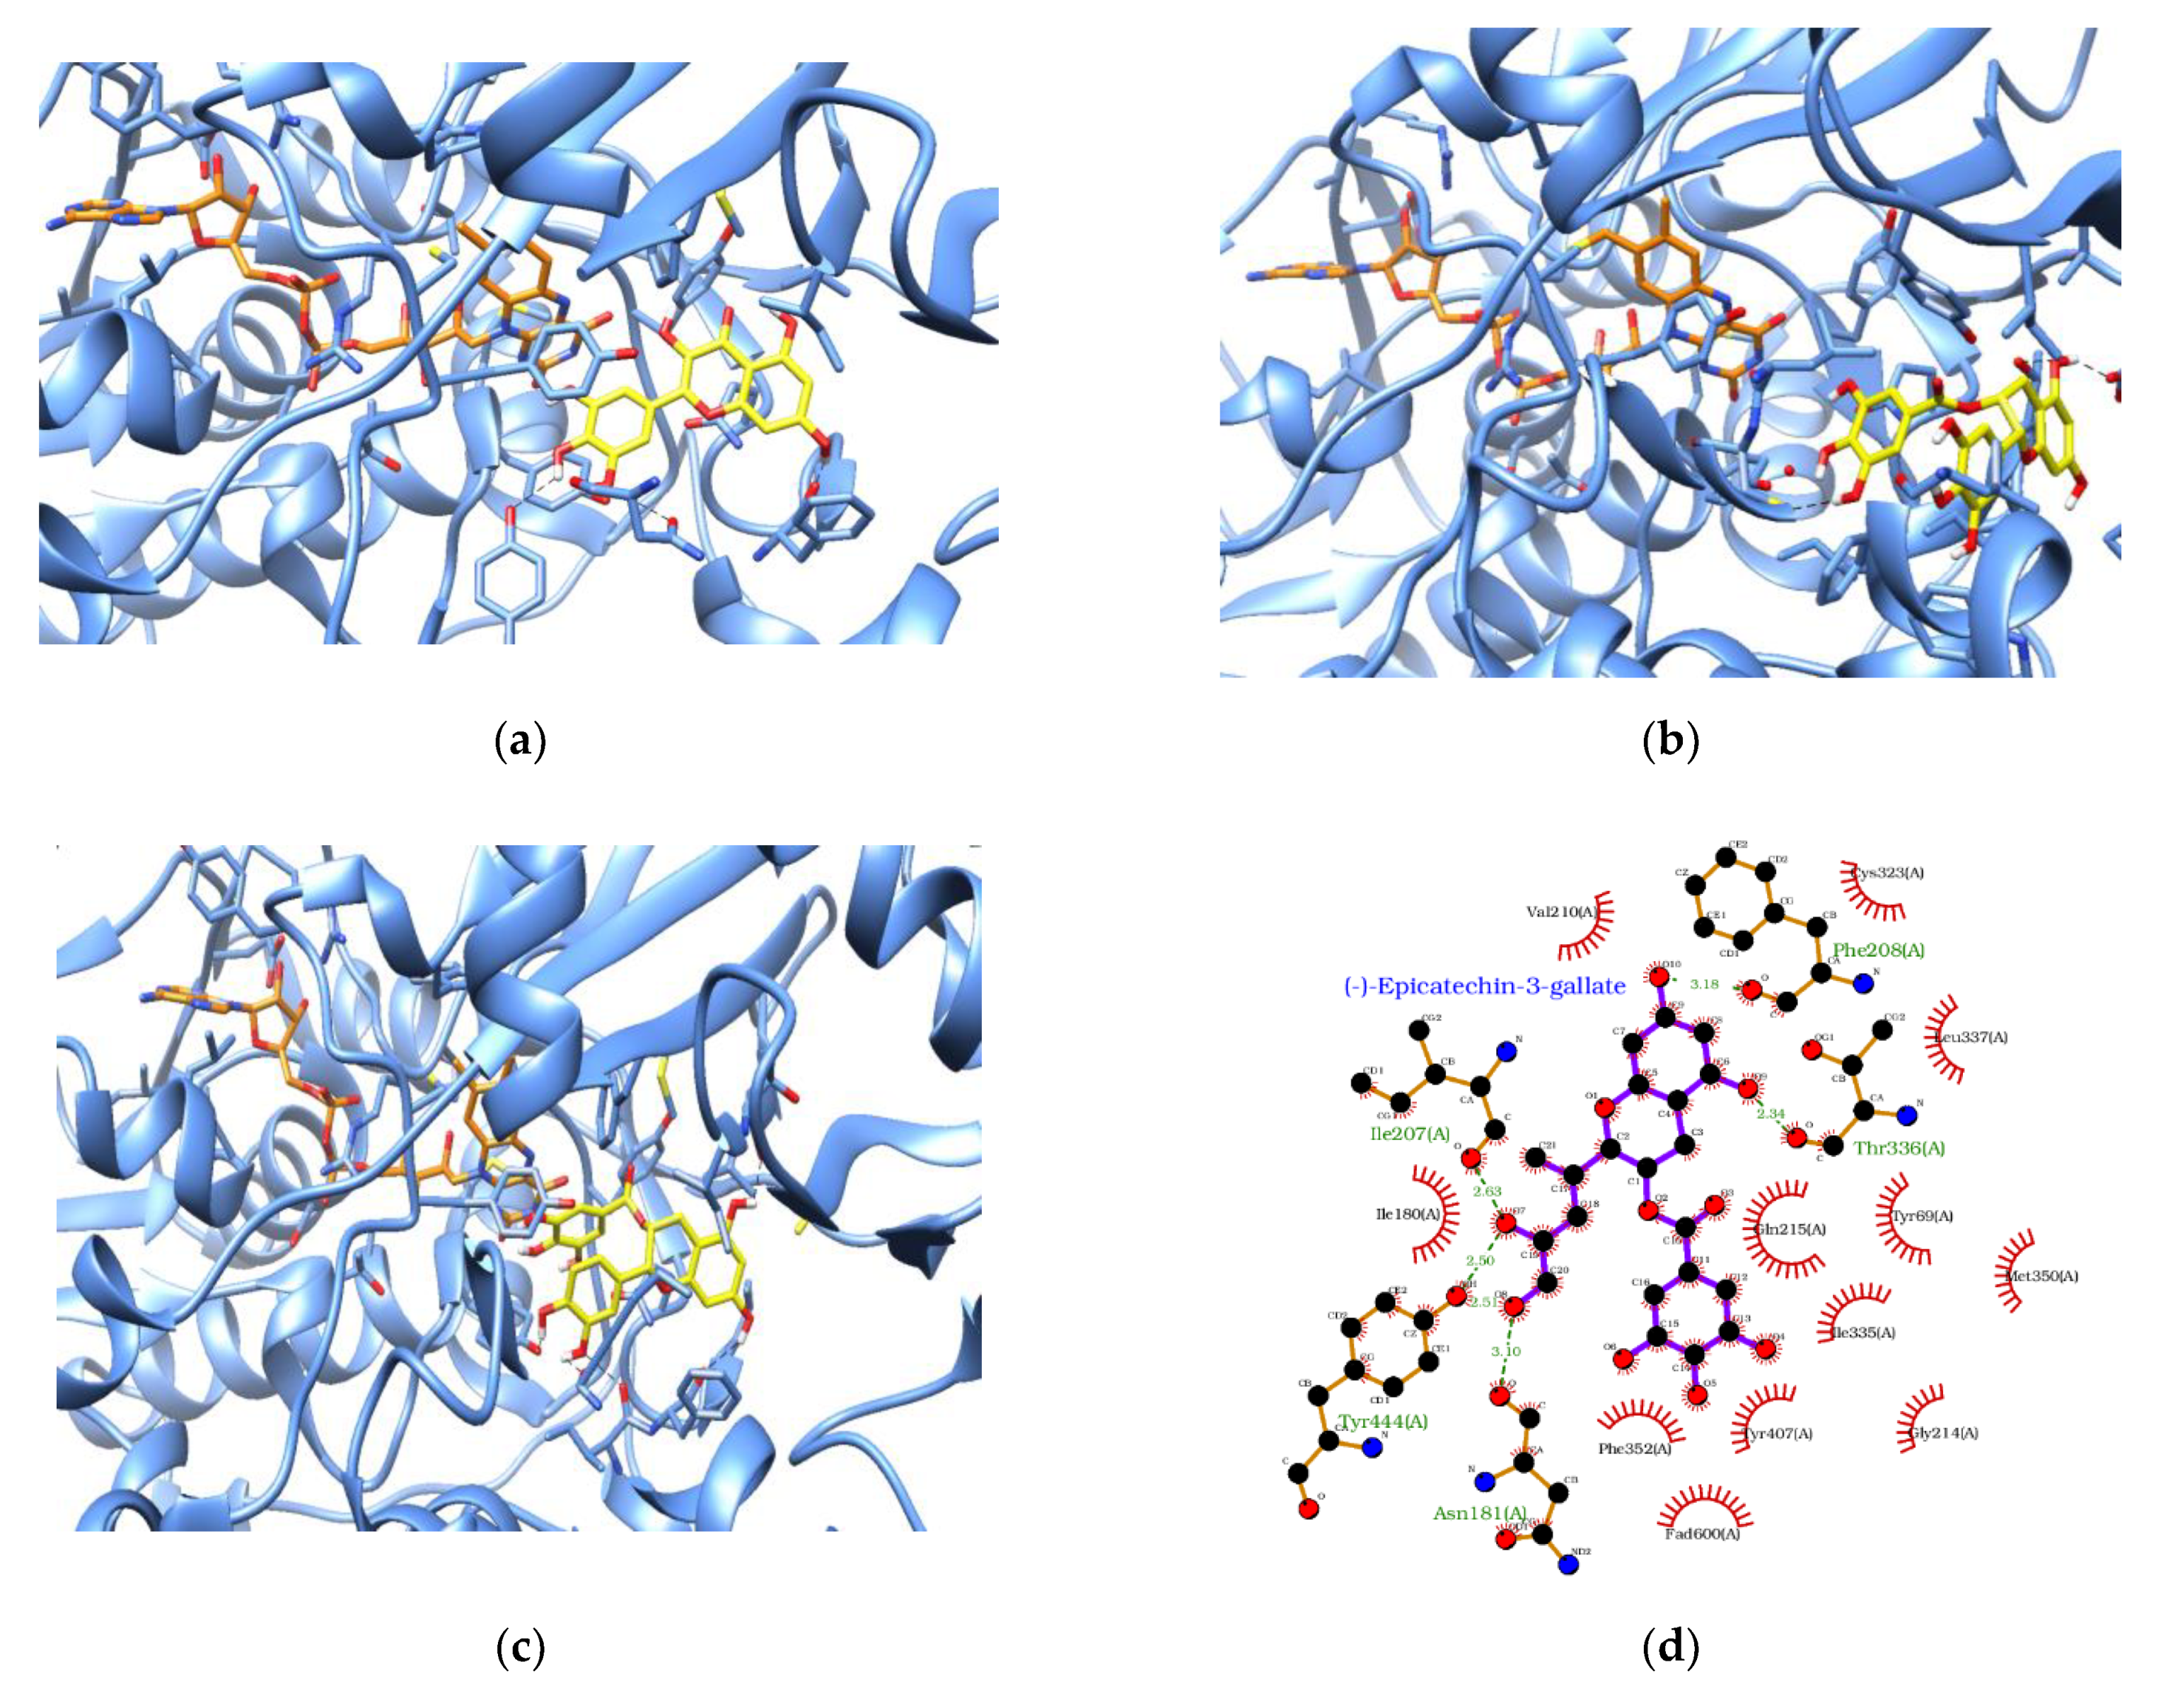
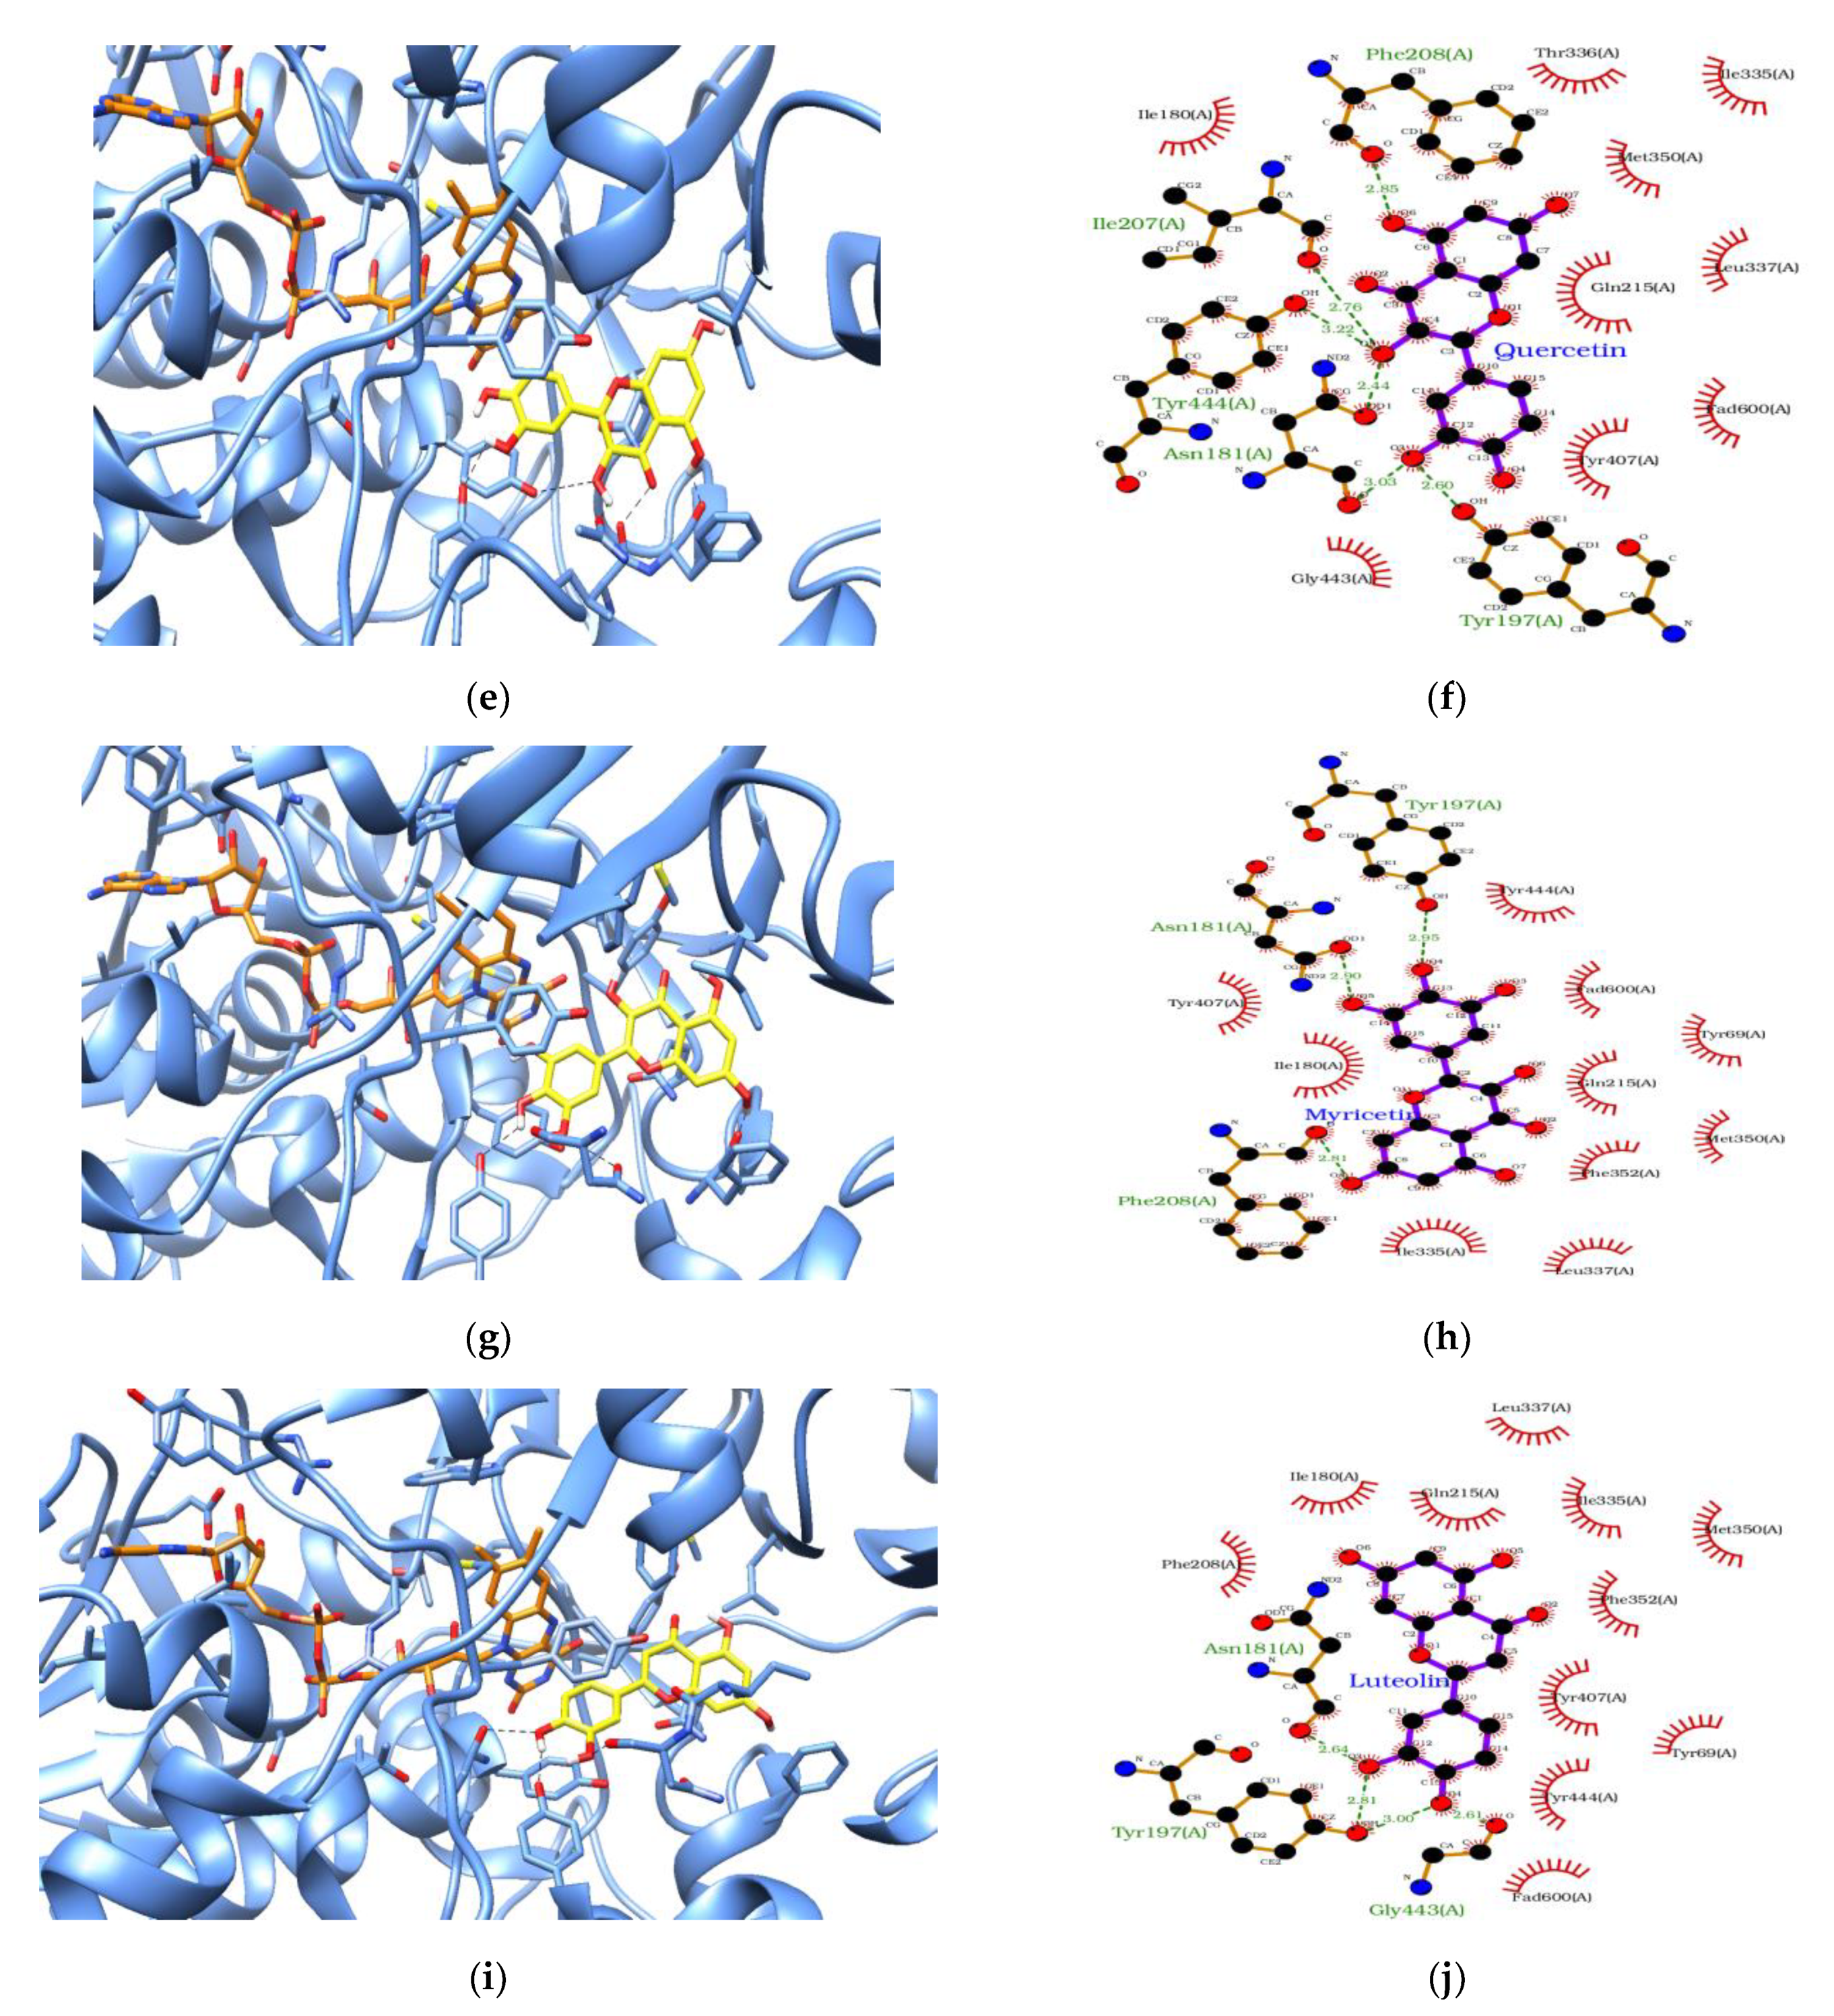
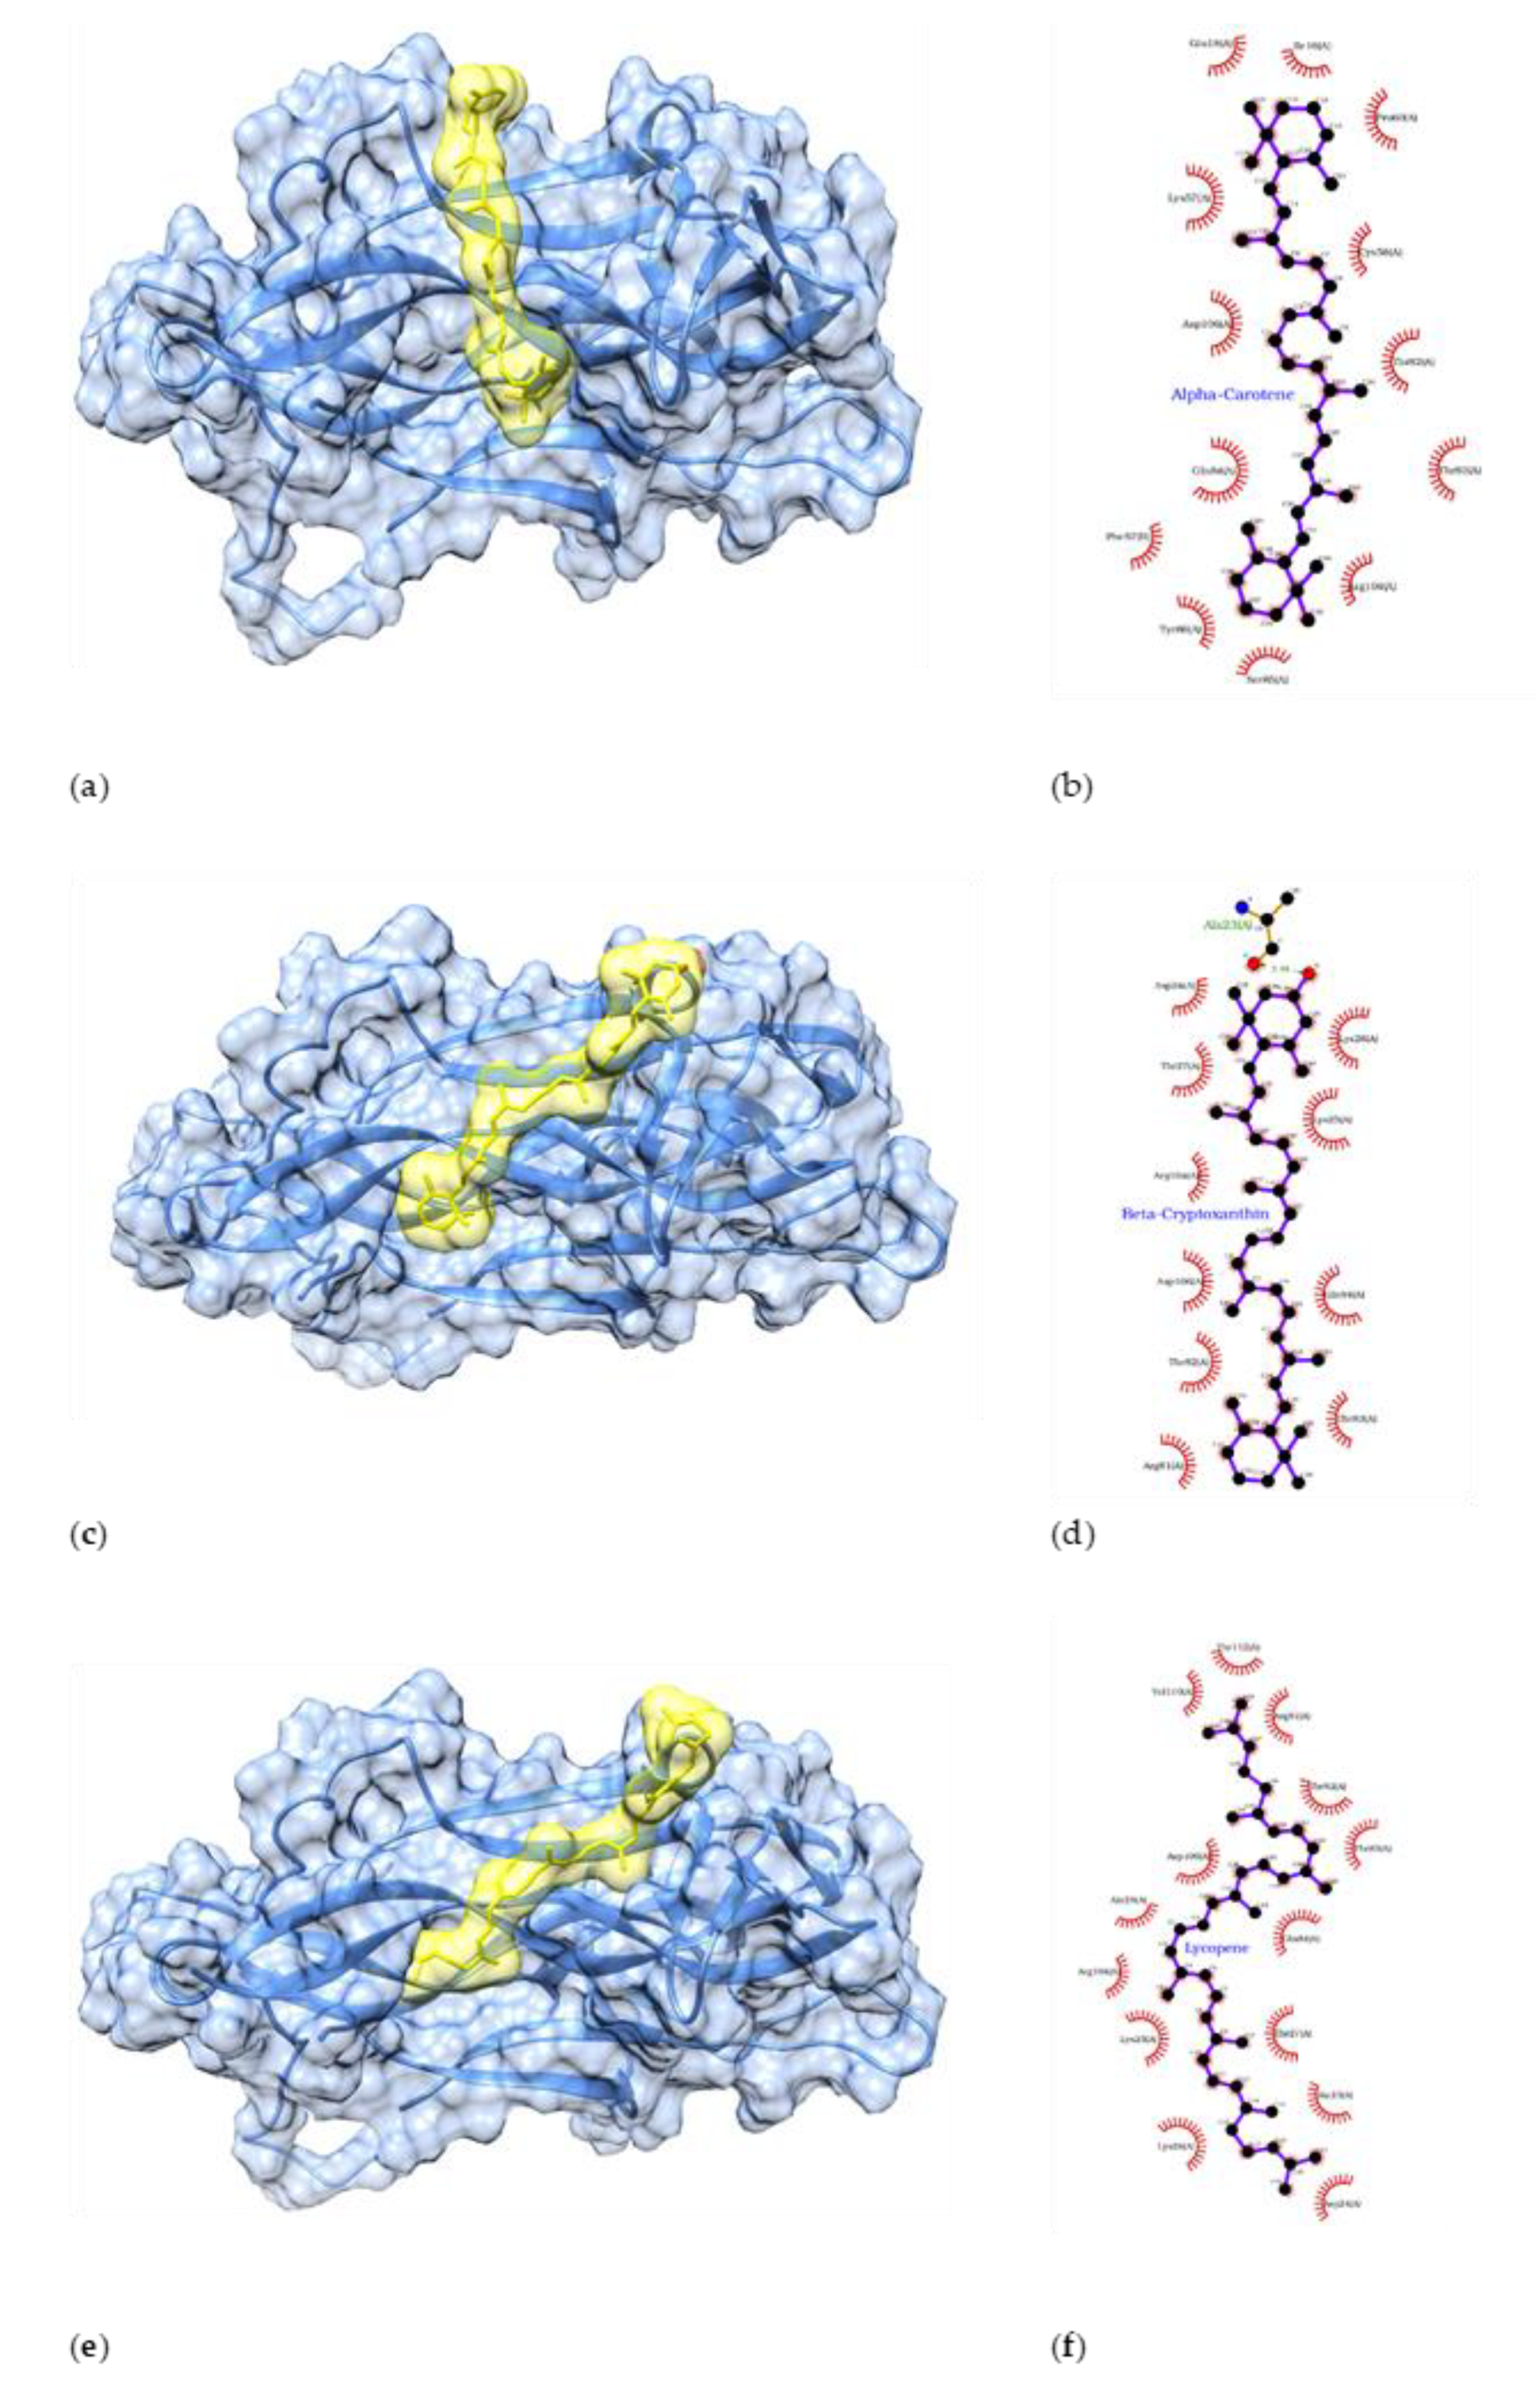
3.5. Results of the In Silico Analysis
4. Discussion
Author Contributions
Funding
Institutional Review Board Statement
Informed Consent Statement
Data Availability Statement
Conflicts of Interest
References
- James, S.L.; Abate, D.; Abate, K.H.; Abay, S.M.; Abbafati, C.; Abbasi, N.; Abbastabar, H.; Abd-Allah, F.; Abdela, J.; Abdelalim, A. Global, regional, and national incidence, prevalence, and years lived with disability for 354 diseases and injuries for 195 countries and territories, 1990–2017: A systematic analysis for the Global Burden of Disease Study 2017. Lancet 2018, 392, 1789–1858. [Google Scholar] [CrossRef] [Green Version]
- Daskalopoulou, M.; George, J.; Walters, K.; Osborn, D.P.; Batty, G.D.; Stogiannis, D.; Rapsomaniki, E.; Pujades-Rodriguez, M.; Denaxas, S.; Udumyan, R. Depression as a risk factor for the initial presentation of twelve cardiac, cerebrovascular, and peripheral arterial diseases: Data linkage study of 1.9 million women and men. PLoS ONE 2016, 11, e0153838. [Google Scholar] [CrossRef] [PubMed]
- Li, H.; Qian, F.; Hou, C.; Li, X.; Gao, Q.; Luo, Y.; Tao, L.; Yang, X.; Wang, W.; Zheng, D. Longitudinal changes in depressive symptoms and risks of cardiovascular disease and all-cause mortality: A nationwide population-based cohort study. J. Gerontol. Ser. A 2020, 75, 2200–2206. [Google Scholar] [CrossRef] [PubMed]
- Gold, S.M.; Köhler-Forsberg, O.; Moss-Morris, R.; Mehnert, A.; Miranda, J.J.; Bullinger, M.; Steptoe, A.; Whooley, M.A.; Otte, C. Comorbid depression in medical diseases. Nat. Rev. Dis. Primers 2020, 6, 69. [Google Scholar] [CrossRef] [PubMed]
- Moussavi, S.; Chatterji, S.; Verdes, E.; Tandon, A.; Patel, V.; Ustun, B. Depression, chronic diseases, and decrements in health: Results from the World Health Surveys. Lancet 2007, 370, 851–858. [Google Scholar] [CrossRef]
- Kozela, M.; Bobak, M.; Besala, A.; Micek, A.; Kubinova, R.; Malyutina, S.; Denisova, D.; Richards, M.; Pikhart, H.; Peasey, A. The association of depressive symptoms with cardiovascular and all-cause mortality in Central and Eastern Europe: Prospective results of the HAPIEE study. Eur. J. Prev. Cardiol. 2016, 23, 1839–1847. [Google Scholar] [CrossRef]
- Cuijpers, P.; Vogelzangs, N.; Twisk, J.; Kleiboer, A.; Li, J.; Penninx, B.W. Comprehensive meta-analysis of excess mortality in depression in the general community versus patients with specific illnesses. Am. J. Psychiatry 2014, 171, 453–462. [Google Scholar] [CrossRef] [Green Version]
- Wang, P.S.; Aguilar-Gaxiola, S.; Alonso, J.; Angermeyer, M.C.; Borges, G.; Bromet, E.J.; Bruffaerts, R.; De Girolamo, G.; De Graaf, R.; Gureje, O. Use of mental health services for anxiety, mood, and substance disorders in 17 countries in the WHO world mental health surveys. Lancet 2007, 370, 841–850. [Google Scholar] [CrossRef] [Green Version]
- Godos, J.; Castellano, S.; Ray, S.; Grosso, G.; Galvano, F. Dietary polyphenol intake and depression: Results from the mediterranean healthy eating, lifestyle and aging (meal) study. Molecules 2018, 23, 999. [Google Scholar] [CrossRef] [Green Version]
- Dias, G.P.; Cavegn, N.; Nix, A.; do Nascimento Bevilaqua, M.C.; Stangl, D.; Zainuddin, M.S.A.; Nardi, A.E.; Gardino, P.F.; Thuret, S. The role of dietary polyphenols on adult hippocampal neurogenesis: Molecular mechanisms and behavioural effects on depression and anxiety. Oxidative Med. Cell. Longev. 2012, 2012, 541971. [Google Scholar] [CrossRef]
- Kontogianni, M.D.; Vijayakumar, A.; Rooney, C.; Noad, R.L.; Appleton, K.M.; McCarthy, D.; Donnelly, M.; Young, I.S.; McKinley, M.C.; McKeown, P.P. A high polyphenol diet improves psychological well-being: The polyphenol intervention trial (pphit). Nutrients 2020, 12, 2445. [Google Scholar] [CrossRef] [PubMed]
- Bouayed, J. Polyphenols: A potential new strategy for the prevention and treatment of anxiety and depression. Curr. Nutr. Food Sci. 2010, 6, 13–18. [Google Scholar] [CrossRef]
- Chang, S.-C.; Cassidy, A.; Willett, W.C.; Rimm, E.B.; O’Reilly, E.J.; Okereke, O.I. Dietary flavonoid intake and risk of incident depression in midlife and older women. Am. J. Clin. Nutr. 2016, 104, 704–714. [Google Scholar] [CrossRef] [PubMed] [Green Version]
- Ko, Y.-H.; Kim, S.-K.; Lee, S.-Y.; Jang, C.-G. Flavonoids as therapeutic candidates for emotional disorders such as anxiety and depression. Arch. Pharmacal Res. 2020, 43, 1128–1143. [Google Scholar] [CrossRef] [PubMed]
- Wang, J.; Cheng, C.; Xin, C.; Wang, Z. The Antidepressant-like Effect of Flavonoids from Trigonella Foenum-Graecum Seeds in Chronic Restraint Stress Mice via Modulation of Monoamine Regulatory Pathways. Molecules 2019, 24, 1105. [Google Scholar] [CrossRef] [Green Version]
- Hritcu, L.; Ionita, R.; Postu, P.A.; Gupta, G.K.; Turkez, H.; Lima, T.C.; Carvalho, C.U.S.; de Sousa, D.P. Antidepressant flavonoids and their relationship with oxidative stress. Oxidative Med. Cell. Longev. 2017, 2017, 5762172. [Google Scholar] [CrossRef] [Green Version]
- Ge, H.; Yang, T.; Sun, J.; Zhang, D. Associations between dietary carotenoid intakes and the risk of depressive symptoms. Food Nutr. Res. 2020, 64, 3920. [Google Scholar] [CrossRef]
- Li, D.; Li, Y. Associations of α-carotenoid and β-carotenoid with depressive symptoms in late midlife women. J. Affect. Disord. 2019, 256, 424–430. [Google Scholar] [CrossRef]
- Milaneschi, Y.; Bandinelli, S.; Penninx, B.W.; Corsi, A.M.; Lauretani, F.; Vazzana, R.; Semba, R.D.; Guralnik, J.M.; Ferrucci, L. The relationship between plasma carotenoids and depressive symptoms in older persons. World J. Biol. Psychiatry 2012, 13, 588–598. [Google Scholar] [CrossRef]
- Hosoi, T.; Okuma, Y.; Nomura, Y. The mechanisms of immune-to-brain communication in inflammation as a drug target. Curr. Drug Targets Inflamm. Allergy 2002, 1, 257–262. [Google Scholar] [CrossRef]
- León, S.L.; Croes, E.A.; Sayed-Tabatabaei, F.A.; Claes, S.; Van Broeckhoven, C.; van Duijn, C.M. The dopamine D4 receptor gene 48-base-pair-repeat polymorphism and mood disorders: A meta-analysis. Biol. Psychiatry 2005, 57, 999–1003. [Google Scholar] [CrossRef]
- Paykel, E. The evolution of life events research in psychiatry. J. Affect. Disord. 2001, 62, 141–149. [Google Scholar] [CrossRef]
- Sahay, A.; Hen, R. Adult hippocampal neurogenesis in depression. Nat. Neurosci. 2007, 10, 1110–1115. [Google Scholar] [CrossRef]
- Jesulola, E.; Micalos, P.; Baguley, I.J. Understanding the pathophysiology of depression: From monoamines to the neurogenesis hypothesis model-are we there yet? Behav. Brain Res. 2018, 341, 79–90. [Google Scholar] [CrossRef] [PubMed]
- Ramos-Hryb, A.B.; Cunha, M.P.; Kaster, M.P.; Rodrigues, A.L.S. Natural Polyphenols and Terpenoids for Depression Treatment: Current Status. In Studies in Natural Products Chemistry; Elsevier: Amsterdam, The Netherlands, 2018; Volume 55, pp. 181–221. [Google Scholar]
- Machado, D.G.; Bettio, L.E.; Cunha, M.P.; Santos, A.R.; Pizzolatti, M.G.; Brighente, I.M.; Rodrigues, A.L.S. Antidepressant-like effect of rutin isolated from the ethanolic extract from Schinus molle L. in mice: Evidence for the involvement of the serotonergic and noradrenergic systems. Eur. J. Pharmacol. 2008, 587, 163–168. [Google Scholar] [CrossRef] [PubMed]
- Samad, N.; Saleem, A.; Yasmin, F.; Shehzad, M. Quercetin protects against stress-induced anxiety-and depression-like behavior and improves memory in male mice. Physiol. Res. 2018, 67, 795–808. [Google Scholar] [CrossRef]
- Park, S.-H.; Sim, Y.-B.; Han, P.-L.; Lee, J.-K.; Suh, H.-W. Antidepressant-like effect of kaempferol and quercitirin, isolated from Opuntia ficus-indica var. saboten. Exp. Neurobiol. 2010, 19, 30–38. [Google Scholar] [CrossRef] [Green Version]
- Weng, L.; Guo, X.; Li, Y.; Yang, X.; Han, Y. Apigenin reverses depression-like behavior induced by chronic corticosterone treatment in mice. Eur. J. Pharmacol. 2016, 774, 50–54. [Google Scholar] [CrossRef]
- Lee, B.; Shim, I.; Lee, H.; Hahm, D.-H. Effects of epigallocatechin gallate on behavioral and cognitive impairments, hypothalamic–pituitary–adrenal Axis dysfunction, and alternations in hippocampal BDNF expression under single prolonged stress. J. Med. Food 2018, 21, 979–989. [Google Scholar] [CrossRef]
- Ma, Z.; Wang, G.; Cui, L.; Wang, Q. Myricetin attenuates depressant-like behavior in mice subjected to repeated restraint stress. Int. J. Mol. Sci. 2015, 16, 28377–28385. [Google Scholar] [CrossRef] [Green Version]
- Antunes, M.S.; Jesse, C.R.; Ruff, J.R.; de Oliveira Espinosa, D.; Gomes, N.S.; Altvater, E.E.T.; Donato, F.; Giacomeli, R.; Boeira, S.P. Hesperidin reverses cognitive and depressive disturbances induced by olfactory bulbectomy in mice by modulating hippocampal neurotrophins and cytokine levels and acetylcholinesterase activity. Eur. J. Pharmacol. 2016, 789, 411–420. [Google Scholar] [CrossRef]
- Tayyab, M.; Farheen, S.; Khanam, N.; Hossain, M.M.; Shahi, M.H. Antidepressant and neuroprotective effects of naringenin via sonic hedgehog-GLI1 cell signaling pathway in a rat model of chronic unpredictable mild stress. Neuromol. Med. 2019, 21, 250–261. [Google Scholar] [CrossRef]
- Fu, X.; Qin, T.; Yu, J.; Jiao, J.; Ma, Z.; Fu, Q.; Deng, X.; Ma, S. Formononetin Ameliorates Cognitive Disorder via PGC-1α Pathway in Neuroinflammation Conditions in High-Fat Diet-Induced Mice. CNS Neurol. Disord. Drug Targets 2019, 18, 566–577. [Google Scholar] [CrossRef]
- Dhingra, D.; Bansal, Y. Antidepressant-like activity of beta-carotene in unstressed and chronic unpredictable mild stressed mice. J. Funct. Foods 2014, 7, 425–434. [Google Scholar] [CrossRef]
- Unno, K.; Noda, S.; Nii, H.; Kawasaki, Y.; Iguchi, K.; Yamada, H. Anti-stress Effect of β-Cryptoxanthin in Satsuma Mandarin Orange on Females. Biol. Pharm. Bull. 2019, 42, 1402–1408. [Google Scholar] [CrossRef] [PubMed]
- Zeni, A.L.B.; Camargo, A.; Dalmagro, A.P. Lutein prevents corticosterone-induced depressive-like behavior in mice with the involvement of antioxidant and neuroprotective activities. Pharmacol. Biochem. Behav. 2019, 179, 63–72. [Google Scholar] [CrossRef] [PubMed]
- Hu, P.; Ma, L.; Wang, Y.-g.; Ye, F.; Wang, C.; Zhou, W.-H.; Zhao, X. Genistein, a dietary soy isoflavone, exerts antidepressant-like effects in mice: Involvement of serotonergic system. Neurochem. Int. 2017, 108, 426–435. [Google Scholar] [CrossRef]
- Jacka, F.N.; Pasco, J.A.; Mykletun, A.; Williams, L.J.; Hodge, A.M.; O’Reilly, S.L.; Nicholson, G.C.; Kotowicz, M.A.; Berk, M. Association of Western and traditional diets with depression and anxiety in women. Am. J. Psychiatry 2010, 167, 305–311. [Google Scholar] [CrossRef] [Green Version]
- Rhee, J.J.; Sampson, L.; Cho, E.; Hughes, M.D.; Hu, F.B.; Willett, W.C. Comparison of methods to account for implausible reporting of energy intake in epidemiologic studies. Am. J. Epidemiol. 2015, 181, 225–233. [Google Scholar] [CrossRef]
- Beck, A.; Steer, R.; Brown, G. Manual for the Beck Depression Inventory-II; Psychological Corporation: San Antonia, TX, USA, 1996. [Google Scholar]
- Oh, D.H.; Kim, S.A.; Lee, H.Y.; Seo, J.Y.; Choi, B.-Y.; Nam, J.H. Prevalence and correlates of depressive symptoms in korean adults: Results of a 2009 korean community health survey. J. Korean Med. Sci. 2013, 28, 128–135. [Google Scholar] [CrossRef] [Green Version]
- Lee, H.; Park, S.; Kim, J.; Kim, C.; Chang, K.; Yim, K.; Kim, K.; Choi, H. Development and validation of a computerized semi-quantitative food frequency questionnaire program for evaluating the nutritional status of the Korean elderly. J. Community Nutr. 2002, 7, 277–285. [Google Scholar]
- National Rural Living Science Institute. Food Composition Table, 6th ed.; Rural Development Administration: Suwon, Korea, 2006.
- National Academy of Agricultural Sciences. Tables of Food Functional Composition, 1st ed.; National Academy of Agricultural Sciences: Suwon, Korea, 2009; pp. 1–450.
- U.S. Department of Agriculture; Agricultural Research Service. USDA Database for the Flavonoid Content of Selected Foods, Release 3.2. 2015. Available online: https://data.nal.usda.gov/system/files/Flav3.2.pdf (accessed on 1 October 2016).
- U.S. Department of Agriculture; Agricultural Research Service. USDA Database for the Isoflavone Content of Selected Foods, Release 2.1. 2015. Available online: https://www.ars.usda.gov/ARSUserFiles/80400525/Data/isoflav/Isoflav_R2-1.pdf (accessed on 1 October 2016).
- U.S. Department of Agriculture; Agricultural Research Service. USDA Database for the Proanthocyanidin Content of Selected Foods, Release 2. 2015. Available online: https://www.ars.usda.gov/ARSUserFiles/80400525/Data/PA/PA02.pdf (accessed on 1 October 2016).
- Son, S.-Y.; Ma, J.; Kondou, Y.; Yoshimura, M.; Yamashita, E.; Tsukihara, T. Structure of human monoamine oxidase A at 2.2-Å resolution: The control of opening the entry for substrates/inhibitors. Proc. Natl. Acad. Sci. USA 2008, 105, 5739–5744. [Google Scholar] [CrossRef] [PubMed] [Green Version]
- Binda, C.; Aldeco, M.; Geldenhuys, W.J.; Tortorici, M.; Mattevi, A.; Edmondson, D.E. Molecular insights into human monoamine oxidase B inhibition by the glitazone antidiabetes drugs. ACS Med. Chem. Lett. 2012, 3, 39–42. [Google Scholar] [CrossRef] [PubMed]
- Xu, Y.; Wang, S.; Hu, Q.; Gao, S.; Ma, X.; Zhang, W.; Shen, Y.; Chen, F.; Lai, L.; Pei, J. CavityPlus: A web server for protein cavity detection with pharmacophore modelling, allosteric site identification and covalent ligand binding ability prediction. Nucleic Acids Res. 2018, 46, W374–W379. [Google Scholar] [CrossRef]
- O’Boyle, N.M.; Banck, M.; James, C.A.; Morley, C.; Vandermeersch, T.; Hutchison, G.R. Open Babel: An open chemical toolbox. J. Cheminf. 2011, 3, 33. [Google Scholar] [CrossRef] [Green Version]
- Morris, G.M.; Huey, R.; Lindstrom, W.; Sanner, M.F.; Belew, R.K.; Goodsell, D.S.; Olson, A.J. AutoDock4 and AutoDockTools4: Automated docking with selective receptor flexibility. J. Comput. Chem. 2009, 30, 2785–2791. [Google Scholar] [CrossRef] [Green Version]
- Laskowski, R.A.; Swindells, M.B. LigPlot+: Multiple ligand–protein interaction diagrams for drug discovery. J. Chem. Inf. Model. 2011, 51, 2778–2786. [Google Scholar] [CrossRef]
- Pettersen, E.F.; Goddard, T.D.; Huang, C.C.; Couch, G.S.; Greenblatt, D.M.; Meng, E.C.; Ferrin, T.E. UCSF Chimera—A visualization system for exploratory research and analysis. J. Comput. Chem. 2004, 25, 1605–1612. [Google Scholar] [CrossRef] [Green Version]
- Pathak, L.; Agrawal, Y.; Dhir, A. Natural polyphenols in the management of major depression. Expert Opin. Investig. Drugs 2013, 22, 863–880. [Google Scholar] [CrossRef]
- Darooghegi Mofrad, M.; Siassi, F.; Guilani, B.; Bellissimo, N.; Azadbakht, L. Association of dietary phytochemical index and mental health in women: A cross-sectional study. Br. J. Nutr. 2019, 121, 1049–1056. [Google Scholar] [CrossRef]
- Zhang, F.; Fu, Y.; Zhou, X.; Pan, W.; Shi, Y.; Wang, M.; Zhang, X.; Qi, D.; Li, L.; Ma, K.; et al. Depression-like behaviors and heme oxygenase-1 are regulated by Lycopene in lipopolysaccharide-induced neuroinflammation. J. Neuroimmunol. 2016, 298, 1–8. [Google Scholar] [CrossRef] [PubMed]
- Zhou, X.; Gan, T.; Fang, G.; Wang, S.; Mao, Y.; Ying, C. Zeaxanthin improved diabetes-induced anxiety and depression through inhibiting inflammation in hippocampus. Metab. Brain Dis. 2018, 33, 705–711. [Google Scholar] [CrossRef] [PubMed]
- Herraiz, T.; Guillén, H. Monoamine oxidase-A inhibition and associated antioxidant activity in plant extracts with potential antidepressant actions. BioMed Res. Int. 2018, 2018, 4810394. [Google Scholar] [CrossRef] [PubMed] [Green Version]
- Bandaruk, Y.; Mukai, R.; Terao, J. Cellular uptake of quercetin and luteolin and their effects on monoamine oxidase-A in human neuroblastoma SH-SY5Y cells. Toxicol. Rep. 2014, 1, 639–649. [Google Scholar] [CrossRef] [PubMed] [Green Version]
- Dreiseitel, A.; Korte, G.; Schreier, P.; Oehme, A.; Locher, S.; Domani, M.; Hajak, G.; Sand, P.G. Berry anthocyanins and their aglycons inhibit monoamine oxidases A and B. Pharmacol. Res. 2009, 59, 306–311. [Google Scholar] [CrossRef] [PubMed]
- Lee, B.-H.; Kim, Y.-K. The roles of BDNF in the pathophysiology of major depression and in antidepressant treatment. Psychiatry Investig. 2010, 7, 231. [Google Scholar] [CrossRef] [Green Version]
- Finberg, J.P.; Rabey, J.M. Inhibitors of MAO-A and MAO-B in psychiatry and neurology. Front. Pharmacol. 2016, 7, 340. [Google Scholar] [CrossRef] [Green Version]
- Naumovski, N.; Blades, B.L.; Roach, P.D. Food inhibits the oral bioavailability of the major green tea antioxidant epigallocatechin gallate in humans. Antioxidants 2015, 4, 373–393. [Google Scholar] [CrossRef]
- Rendeiro, C.; Rhodes, J.S.; Spencer, J.P. The mechanisms of action of flavonoids in the brain: Direct versus indirect effects. Neurochem. Int. 2015, 89, 126–139. [Google Scholar] [CrossRef]
- Hu, M.; Wu, B.; Liu, Z. Bioavailability of polyphenols and flavonoids in the era of precision medicine. Mol. Pharm. 2017, 14, 2861–2863. [Google Scholar] [CrossRef] [Green Version]
- Cazorla, M.; Prémont, J.; Mann, A.; Girard, N.; Kellendonk, C.; Rognan, D. Identification of a low–molecular weight TrkB antagonist with anxiolytic and antidepressant activity in mice. J. Clin. Investig. 2011, 121, 1846–1857. [Google Scholar] [CrossRef] [PubMed] [Green Version]

| Variables | Total (n = 2190) |
|---|---|
| Age (years), mean ± SD | 58.2 ± 5.8 |
| BMI (kg/m2), mean ± SD | 24.1 ± 3.2 |
| BDI-II score, mean ± SD | 9.0 ± 7.8 |
| CES-D score, mean ± SD | 8.5 ± 8.5 |
| Depressive disorder prevalence, n (%) | |
| BDI-II score ≥ 14 | 487 (22.2) |
| CES-D score ≥ 16 | 363 (16.6) |
| Stage of depression using BDI-II score, n (%) | |
| Minimal (0–13) | 1703 (77.8) |
| Mild (14–19) | 270 (12.3) |
| Moderate (20–28) | 151 (6.9) |
| Severe (29–63) | 66 (3.0) |
| Stage of depression using CES-D score, n (%) | |
| Normal (0–15) | 1827 (83.4) |
| Probable depression (16–24) | 238 (10.9) |
| Definite depression(25–60) | 125 (5.7) |
| Education level, n (%) | |
| Elementary school | 322 (14.7) |
| Middle school | 569 (25.9) |
| High school | 967 (44.2) |
| College and higher | 332 (15.2) |
| Household income, n (%) | |
| <1000 dollar | 184 (8.4) |
| 1000–2000 dollar | 450 (20.5) |
| 2000–4000 dollar | 801 (36.6) |
| >4000 dollar | 755 (34.5) |
| Current Smoking, n (%) | |
| No | 2119 (96.8) |
| Yes | 71 (3.2) |
| Current alcohol drinking, n (%) | |
| No | 1530 (69.9) |
| Yes | 660 (30.1) |
| Physical activity, n (%) | |
| No | 907 (41.4) |
| Yes | 1283 (58.6) |
| Marital status, n (%) | |
| Married | 1689 (77.1) |
| Others | 501 (22.9) |
| Job, n (%) | |
| White-collar worker | 169 (7.7) |
| Service worker | 497 (22.7) |
| Blue-collar worker | 205 (9.4) |
| Housewife | 1319 (60.2) |
| Chronic disease, n (%) | |
| No | 1440 (65.8) |
| Yes | 750 (34.2) |
| Family history of depression, n (%) | |
| No | 2150 (98.2) |
| Yes | 40 (1.8) |
| Use of antidepressant, n (%) | |
| No | 2154 (98.4) |
| Yes | 36 (1.6) |
| Sleep duration, n (%) | |
| <6 h | 385 (17.5) |
| 6–8 h | 1420 (65.0) |
| >8 h | 385 (17.5) |
| Stress, n (%) | |
| Rarely | 549 (25.1) |
| A litter | 1088 (49.7) |
| A lot | 520 (23.7) |
| Very much | 33 (1.5) |
| Menopausal status | |
| No | 282 (12.9) |
| Yes | 1908 (87.1) |
| Variables | Control (n = 1703) | Depressive Symptoms * (n = 487) | p-Value |
|---|---|---|---|
| Total flavonoids | 126.12 ± 1.44 | 113.71 ± 2.71 | <0.0001 |
| Flavonols | 13.39 ± 0.19 | 12.84 ± 0.38 | 0.0174 |
| Flavones | 1.45 ± 0.02 | 1.30 ± 0.03 | <0.0001 |
| Flavanols | 78.90 ± 1.08 | 70.51 ± 2.05 | 0.0001 |
| Flavanones | 7.44 ± 0.19 | 6.82 ± 0.31 | 0.046 |
| Isoflavonoids | 15.87 ± 0.30 | 14.68 ± 0.52 | 0.0322 |
| Anthocyanins | 8.74 ± 0.19 | 7.29 ± 0.31 | 0.0001 |
| Flavonols | |||
| Kaempferol | 1.53 ± 0.0.02 | 1.49 ± 0.05 | 0.2623 |
| Myricetin | 0.18 ± 0.00 | 0.17 ± 0.00 | 0.0004 |
| Quercetin | 11.69 ± 0.17 | 11.18 ± 0.34 | 0.0149 |
| Flavones | |||
| Luteolin | 1.23 ± 0.01 | 1.09 ± 0.03 | <0.0001 |
| Apigenin | 0.22 ± 0.00 | 0.21 ± 0.01 | 0.093 |
| Flavanols | |||
| (+)-Catechin | 3.71 ± 0.06 | 3.22 ± 0.11 | <0.0001 |
| (+)-Gallocatechin | 0.01 ± 0.00 | 0.01 ± 0.00 | 0.003 |
| (−)-Epicatechin | 3.37 ± 0.07 | 2.88 ± 0.13 | <0.0001 |
| (−)-Epigallocatechin | 0.30 ± 0.01 | 0.27 ± 0.01 | 0.0003 |
| (−)-Epicatechin 3-gallate | 0.01 ± 0.00 | 0.01 ± 0.00 | 0.8674 |
| Theaflavin | 9.67 ± 0.16 | 8.41 ± 0.29 | <0.0001 |
| Theaflavin 3-gallate | 6.21 ± 0.09 | 5.50 ± 0.17 | <0.0001 |
| Theaflavin 3′-gallate | 26.13 ± 0.36 | 23.43 ± 0.70 | 0.0003 |
| Theaflavin 3,3′ digallate | 29.49 ± 0.40 | 26.79 ± 0.78 | 0.0016 |
| Flavanones | |||
| Hesperidin | 6.58 ± 0.17 | 6.11 ± 0.30 | 0.0515 |
| Naringenin | 0.83 ± 0.03 | 0.69 ± 0.03 | 0.0012 |
| Eriodictyol | 0.03 ± 0.00 | 0.03 ± 0.00 | 0.0215 |
| Isoflavones | |||
| Daidzein | 6.07 ± 0.12 | 5.63 ± 0.21 | 0.0487 |
| Genistein | 7.58 ± 0.14 | 6.99 ± 0.25 | 0.0251 |
| Glycitein | 2.12 ± 0.04 | 1.98 ± 0.07 | 0.0436 |
| Coumestrol | 0.06 ± 0.00 | 0.06 ± 0.00 | 0.0216 |
| Formonnetin | 0.01 ± 0.00 | 0.01 ± 0.00 | 0.1729 |
| Biochanin A | 0.01 ± 0.00 | 0.01 ± 0.00 | 0.1777 |
| Anthocyanins | |||
| Cyanidin | 7.04 ± 0.17 | 5.80 ± 0.26 | <0.0001 |
| Delphinidine | 0.32 ± 0.02 | 0.28 ± 0.03 | 0.0019 |
| Pelargonidine | 0.21 ± 0.01 | 0.18 ± 0.01 | <0.0001 |
| Peonidine | 1.18 ± 0.03 | 1.04 ± 0.06 | 0.0046 |
| Total carotenoids | 24.69 ± 0.32 | 22.62 ± 0.59 | 0.0001 |
| α-carotene | 0.53 ± 0.01 | 0.45 ± 0.02 | 0.0042 |
| β-carotene | 6.46 ± 0.08 | 5.95 ± 0.15 | 0.0004 |
| Lycopene | 2.21 ± 0.06 | 1.91 ± 0.10 | 0.0015 |
| Lutein | 1.90 ± 0.03 | 1.79 ± 0.06 | 0.0391 |
| Zeaxanthin | 0.21 ± 0.00 | 0.19 ± 0.01 | 0.0038 |
| β-cryptoxanthin | 0.31 ± 0.00 | 0.28 ± 0.01 | 0.0025 |
| Capsaicin | 12.40 ± 0.20 | 11.44 ± 0.38 | 0.0015 |
| Variables | Quartile | Median | No. of Total | No. of Cases | Model 1 | Model 2 | ||||
|---|---|---|---|---|---|---|---|---|---|---|
| OR | 95% CI Lower Upper | OR | 95% CI Lower Upper | |||||||
| Total flavonoids | Q1 | 58.1 | 547 | 147 | 1.00 | 1.00 | ||||
| Q2 | 99.7 | 548 | 133 | 0.88 | 0.67 | 1.16 | 0.99 | 0.72 | 1.35 | |
| Q3 | 135.9 | 548 | 111 | 0.70 | 0.53 | 0.93 | 0.92 | 0.65 | 1.29 | |
| Q4 | 193.7 | 547 | 96 | 0.59 | 0.44 | 0.79 | 0.69 | 0.47 | 1.02 | |
| p-value for trend | 0.0001 | 0.0604 | ||||||||
| Flavonols | Q1 | 6.2 | 547 | 139 | 1.00 | 1.00 | ||||
| Q2 | 10.1 | 548 | 120 | 0.83 | 0.63 | 1.10 | 0.95 | 0.69 | 1.31 | |
| Q3 | 13.8 | 548 | 110 | 0.75 | 0.56 | 1.00 | 0.99 | 0.70 | 1.39 | |
| Q4 | 20.4 | 547 | 118 | 0.81 | 0.61 | 1.08 | 1.05 | 0.73 | 1.53 | |
| p-value for trend | 0.1602 | 0.7063 | ||||||||
| Flavones | Q1 | 0.7 | 547 | 158 | 1.00 | 1.00 | ||||
| Q2 | 1.2 | 548 | 124 | 0.73 | 0.55 | 0.95 | 0.86 | 0.63 | 1.17 | |
| Q3 | 1.6 | 548 | 106 | 0.60 | 0.45 | 0.79 | 0.78 | 0.57 | 1.09 | |
| Q4 | 2.2 | 547 | 99 | 0.55 | 0.41 | 0.74 | 0.69 | 0.48 | 0.99 | |
| p-value for trend | <0.0001 | 0.0388 | ||||||||
| Flavanols | Q1 | 21.7 | 547 | 148 | 1.00 | 1.00 | ||||
| Q2 | 61.0 | 548 | 121 | 0.77 | 0.58 | 1.02 | 0.96 | 0.70 | 1.31 | |
| Q3 | 87.9 | 548 | 124 | 0.80 | 0.61 | 1.06 | 1.12 | 0.81 | 1.55 | |
| Q4 | 128.5 | 547 | 94 | 0.57 | 0.42 | 0.77 | 0.77 | 0.54 | 1.11 | |
| p-value for trend | 0.0004 | 0.2801 | ||||||||
| Flavanones | Q1 | 1.2 | 547 | 138 | 1.00 | 1.00 | ||||
| Q2 | 3.4 | 548 | 112 | 0.76 | 0.58 | 1.01 | 0.82 | 0.60 | 1.13 | |
| Q3 | 7.7 | 548 | 126 | 0.89 | 0.67 | 1.17 | 0.83 | 0.60 | 1.13 | |
| Q4 | 13.5 | 547 | 111 | 0.76 | 0.57 | 1.00 | 0.80 | 0.57 | 1.12 | |
| p-value for trend | 0.1707 | 0.2967 | ||||||||
| Isoflavones | Q1 | 4.9 | 547 | 137 | 1.00 | 1.00 | ||||
| Q2 | 9.6 | 548 | 128 | 0.91 | 0.69 | 1.21 | 0.94 | 0.68 | 1.28 | |
| Q3 | 15.7 | 548 | 115 | 0.79 | 0.59 | 1.05 | 0.75 | 0.54 | 1.04 | |
| Q4 | 28.8 | 547 | 107 | 0.73 | 0.55 | 0.97 | 0.73 | 0.51 | 1.07 | |
| p-value for trend | 0.0217 | 0.0784 | ||||||||
| Anthocyanins | Q1 | 1.9 | 547 | 141 | 1.00 | 1.00 | ||||
| Q2 | 4.4 | 548 | 135 | 0.95 | 0.72 | 1.25 | 1.02 | 0.75 | 1.40 | |
| Q3 | 9.0 | 548 | 114 | 0.76 | 0.58 | 1.01 | 0.83 | 0.60 | 1.16 | |
| Q4 | 16.6 | 547 | 97 | 0.63 | 0.47 | 0.84 | 0.68 | 0.48 | 0.96 | |
| p-value for trend | 0.0006 | 0.0093 | ||||||||
| Variables | Quartile | Median | No. of Total | No. of Cases | Model 1 | Model 2 | ||||
|---|---|---|---|---|---|---|---|---|---|---|
| OR | 95% CI Lower Upper | OR | 95% CI Lower Upper | |||||||
| Flavonols | ||||||||||
| Kaempferol | Q1 | 0.61 | 547 | 132 | 1.00 | 1.00 | ||||
| Q2 | 1.10 | 548 | 115 | 0.84 | 0.63 | 1.12 | 1.05 | 0.76 | 1.44 | |
| Q3 | 1.59 | 548 | 121 | 0.89 | 0.67 | 1.18 | 1.13 | 0.82 | 1.55 | |
| Q4 | 2.47 | 547 | 119 | 0.87 | 0.66 | 1.15 | 1.21 | 0.85 | 1.71 | |
| p-value for trend | 0.4562 | 0.2663 | ||||||||
| Myricetin | Q1 | 0.09 | 547 | 153 | 1.00 | |||||
| Q2 | 0.14 | 548 | 115 | 0.69 | 0.52 | 0.91 | 0.83 | 0.60 | 1.14 | |
| Q3 | 0.18 | 548 | 124 | 0.75 | 0.57 | 0.99 | 0.91 | 0.65 | 1.26 | |
| Q4 | 0.26 | 547 | 95 | 0.54 | 0.41 | 0.73 | 0.66 | 0.44 | 0.98 | |
| p-value for trend | 0.0001 | 0.0602 | ||||||||
| Quercetin | Q1 | 5.05 | 547 | 139 | 1.00 | |||||
| Q2 | 8.74 | 548 | 119 | 0.82 | 0.62 | 1.09 | 0.93 | 0.68 | 1.28 | |
| Q3 | 12.12 | 548 | 110 | 0.75 | 0.56 | 1.00 | 1.01 | 0.72 | 1.41 | |
| Q4 | 17.96 | 547 | 119 | 0.82 | 0.62 | 1.09 | 1.06 | 0.73 | 1.53 | |
| p-value for trend | 0.1858 | 0.6646 | ||||||||
| Flavones | ||||||||||
| Luteolin | Q1 | 0.59 | 547 | 161 | 1.00 | |||||
| Q2 | 0.96 | 548 | 122 | 0.69 | 0.53 | 0.91 | 0.81 | 0.60 | 1.11 | |
| Q3 | 1.32 | 548 | 114 | 0.64 | 0.48 | 0.84 | 0.83 | 0.60 | 1.15 | |
| Q4 | 1.87 | 547 | 90 | 0.48 | 0.36 | 0.64 | 0.57 | 0.39 | 0.82 | |
| p-value for trend | <0.0001 | 0.004 | ||||||||
| Apigenin | Q1 | 0.00 | 547 | 138 | 1.00 | |||||
| Q2 | 0.19 | 548 | 116 | 0.80 | 0.60 | 1.06 | 0.81 | 0.58 | 1.11 | |
| Q3 | 0.26 | 548 | 116 | 0.81 | 0.61 | 1.07 | 1.06 | 0.77 | 1.46 | |
| Q4 | 0.39 | 547 | 117 | 0.83 | 0.62 | 1.10 | 1.13 | 0.81 | 1.59 | |
| p-value for trend | 0.1531 | 0.5143 | ||||||||
| Flavanols | ||||||||||
| (+)-Catechin | Q1 | 1.23 | 547 | 152 | 1.00 | 1.00 | ||||
| Q2 | 2.45 | 548 | 127 | 0.79 | 0.60 | 1.04 | 0.98 | 0.72 | 1.34 | |
| Q3 | 3.70 | 548 | 114 | 0.69 | 0.52 | 0.92 | 0.84 | 0.60 | 1.16 | |
| Q4 | 6.38 | 547 | 94 | 0.55 | 0.41 | 0.73 | 0.65 | 0.45 | 0.94 | |
| p-value for trend | <0.0001 | 0.0128 | ||||||||
| (+)-Gallocatechin | Q1 | 0.00 | 562 | 140 | 1.00 | 1.00 | ||||
| Q2 | 0.00 | 381 | 92 | 0.96 | 0.71 | 1.30 | 1.02 | 0.73 | 1.44 | |
| Q3 | 0.01 | 540 | 123 | 0.90 | 0.68 | 1.19 | 0.90 | 0.66 | 1.24 | |
| Q4 | 0.02 | 707 | 132 | 0.70 | 0.54 | 0.92 | 0.73 | 0.53 | 1.00 | |
| p-value for trend | 0.0069 | 0.0226 | ||||||||
| (−)-Epicatechin | Q1 | 0.60 | 547 | 155 | 1.00 | 1.00 | ||||
| Q2 | 1.53 | 548 | 126 | 0.76 | 0.58 | 1.00 | 0.85 | 0.63 | 1.16 | |
| Q3 | 3.31 | 548 | 98 | 0.56 | 0.42 | 0.74 | 0.65 | 0.47 | 0.91 | |
| Q4 | 7.09 | 547 | 108 | 0.63 | 0.48 | 0.84 | 0.77 | 0.54 | 1.08 | |
| p-value for trend | 0.0033 | 0.169 | ||||||||
| (−)-Epigallocatechin | Q1 | 0.09 | 547 | 147 | 1.00 | 1.00 | ||||
| Q2 | 0.18 | 548 | 125 | 0.81 | 0.61 | 1.06 | 0.85 | 0.62 | 1.16 | |
| Q3 | 0.32 | 548 | 115 | 0.73 | 0.55 | 0.97 | 0.93 | 0.67 | 1.29 | |
| Q4 | 0.54 | 547 | 100 | 0.61 | 0.46 | 0.82 | 0.76 | 0.53 | 1.09 | |
| p-value for trend | 0.0011 | 0.2027 | ||||||||
| (−)-Epicatechin 3-gallate | Q1 | 0.00 | 547 | 125 | 1.00 | 1.00 | ||||
| Q2 | 0.00 | 548 | 113 | 0.87 | 0.65 | 1.16 | 0.90 | 0.65 | 1.25 | |
| Q3 | 0.01 | 548 | 112 | 0.85 | 0.64 | 1.14 | 1.05 | 0.76 | 1.46 | |
| Q4 | 0.01 | 547 | 137 | 1.10 | 0.83 | 1.46 | 1.36 | 0.97 | 1.92 | |
| p-value for trend | 0.6703 | 0.0742 | ||||||||
| Theaflavin | Q1 | 2.72 | 547 | 155 | 1.00 | 1.00 | ||||
| Q2 | 6.02 | 548 | 130 | 0.79 | 0.60 | 1.04 | 0.91 | 0.67 | 1.24 | |
| Q3 | 10.33 | 548 | 95 | 0.54 | 0.40 | 0.72 | 0.68 | 0.48 | 0.95 | |
| Q4 | 17.15 | 547 | 107 | 0.62 | 0.47 | 0.83 | 0.72 | 0.51 | 1.02 | |
| p-value for trend | 0.0004 | 0.0426 | ||||||||
| Theaflavin 3-gallate | Q1 | 1.81 | 547 | 152 | 1.00 | 1.00 | ||||
| Q2 | 4.59 | 548 | 128 | 0.80 | 0.61 | 1.05 | 0.93 | 0.68 | 1.26 | |
| Q3 | 6.72 | 548 | 111 | 0.67 | 0.50 | 0.89 | 0.90 | 0.64 | 1.25 | |
| Q4 | 10.54 | 547 | 96 | 0.56 | 0.42 | 0.75 | 0.69 | 0.48 | 0.98 | |
| p-value for trend | <0.0001 | 0.0395 | ||||||||
| Theaflavin 3′-gallate | Q1 | 6.17 | 547 | 145 | 1.00 | 1.00 | ||||
| Q2 | 20.06 | 548 | 124 | 0.82 | 0.62 | 1.08 | 1.04 | 0.76 | 1.42 | |
| Q3 | 29.28 | 548 | 123 | 0.82 | 0.62 | 1.08 | 1.12 | 0.81 | 1.55 | |
| Q4 | 42.43 | 547 | 95 | 0.60 | 0.44 | 0.80 | 0.80 | 0.56 | 1.14 | |
| p-value for trend | 0.0009 | 0.3429 | ||||||||
| Theaflavin 3,3′ digallate | Q1 | 5.27 | 547 | 142 | 1.00 | |||||
| Q2 | 24.35 | 548 | 118 | 0.79 | 0.60 | 1.05 | 0.91 | 0.67 | 1.25 | |
| Q3 | 36.33 | 548 | 130 | 0.91 | 0.69 | 1.20 | 1.22 | 0.89 | 1.69 | |
| Q4 | 47.04 | 547 | 97 | 0.63 | 0.47 | 0.85 | 0.84 | 0.59 | 1.20 | |
| p-value for trend | 0.0101 | 0.8335 | ||||||||
| Flavanones | ||||||||||
| Hesperidin | Q1 | 0.83 | 549 | 138 | 1.00 | 1.00 | ||||
| Q2 | 2.56 | 544 | 111 | 0.76 | 0.57 | 1.01 | 0.83 | 0.61 | 1.14 | |
| Q3 | 6.96 | 546 | 128 | 0.92 | 0.69 | 1.21 | 0.87 | 0.63 | 1.19 | |
| Q4 | 12.34 | 551 | 110 | 0.74 | 0.56 | 0.99 | 0.81 | 0.58 | 1.12 | |
| p-value for trend | 0.1644 | 0.3301 | ||||||||
| Naringenin | Q1 | 0.16 | 547 | 144 | 1.00 | 1.00 | ||||
| Q2 | 0.38 | 551 | 137 | 0.93 | 0.71 | 1.22 | 1.19 | 0.87 | 1.62 | |
| Q3 | 0.70 | 554 | 102 | 0.64 | 0.48 | 0.85 | 0.71 | 0.51 | 0.99 | |
| Q4 | 1.77 | 538 | 104 | 0.67 | 0.51 | 0.90 | 0.74 | 0.53 | 1.03 | |
| p-value for trend | 0.0055 | 0.0201 | ||||||||
| Eriodictyol | Q1 | 0.00 | 563 | 145 | 1.00 | 1.00 | ||||
| Q2 | 0.02 | 513 | 111 | 0.80 | 0.60 | 1.06 | 0.87 | 0.63 | 1.19 | |
| Q3 | 0.04 | 577 | 134 | 0.88 | 0.67 | 1.16 | 1.01 | 0.74 | 1.38 | |
| Q4 | 0.05 | 537 | 97 | 0.65 | 0.48 | 0.87 | 0.90 | 0.64 | 1.28 | |
| p-value for trend | 0.0186 | 0.8027 | ||||||||
| Isoflavones | ||||||||||
| Daidzein | Q1 | 1.78 | 547 | 135 | 1.00 | 1.00 | ||||
| Q2 | 3.60 | 548 | 129 | 0.94 | 0.72 | 1.25 | 0.95 | 0.69 | 1.30 | |
| Q3 | 5.96 | 548 | 116 | 0.81 | 0.61 | 1.08 | 0.83 | 0.59 | 1.15 | |
| Q4 | 11.19 | 547 | 107 | 0.74 | 0.56 | 0.99 | 0.74 | 0.51 | 1.07 | |
| p-value for trend | 0.0282 | 0.0832 | ||||||||
| Genistein | Q1 | 2.34 | 547 | 140 | 1.00 | 1.00 | ||||
| Q2 | 4.51 | 548 | 125 | 0.86 | 0.65 | 1.14 | 0.91 | 0.66 | 1.25 | |
| Q3 | 7.41 | 548 | 113 | 0.75 | 0.57 | 0.99 | 0.75 | 0.54 | 1.04 | |
| Q4 | 13.95 | 547 | 109 | 0.72 | 0.54 | 0.96 | 0.73 | 0.51 | 1.06 | |
| p-value for trend | 0.0278 | 0.0885 | ||||||||
| Glycitein | Q1 | 0.69 | 547 | 129 | 1.00 | 1.00 | ||||
| Q2 | 1.31 | 548 | 127 | 0.98 | 0.74 | 1.30 | 1.04 | 0.76 | 1.43 | |
| Q3 | 2.07 | 548 | 125 | 0.95 | 0.72 | 1.26 | 0.98 | 0.71 | 1.36 | |
| Q4 | 3.79 | 547 | 106 | 0.77 | 0.58 | 1.04 | 0.83 | 0.57 | 1.20 | |
| p-value for trend | 0.0626 | 0.2374 | ||||||||
| Coumestrol | Q1 | 0.02 | 547 | 139 | 1.00 | 1.00 | ||||
| Q2 | 0.03 | 548 | 114 | 0.77 | 0.58 | 1.02 | 0.77 | 0.56 | 1.06 | |
| Q3 | 0.05 | 548 | 126 | 0.87 | 0.66 | 1.15 | 0.95 | 0.68 | 1.31 | |
| Q4 | 0.11 | 547 | 108 | 0.72 | 0.54 | 0.95 | 0.72 | 0.50 | 1.04 | |
| p-value for trend | 0.0766 | 0.1683 | ||||||||
| Formonnetin | Q1 | 0.00 | 547 | 126 | 1.00 | 1.00 | ||||
| Q2 | 0.01 | 548 | 133 | 1.05 | 0.79 | 1.39 | 1.18 | 0.86 | 1.62 | |
| Q3 | 0.01 | 548 | 110 | 0.83 | 0.62 | 1.11 | 0.91 | 0.66 | 1.28 | |
| Q4 | 0.03 | 547 | 118 | 0.90 | 0.68 | 1.20 | 1.09 | 0.77 | 1.55 | |
| p-value for trend | 0.5079 | 0.5766 | ||||||||
| Biochanin A | Q1 | 0.00 | 547 | 129 | 1.00 | 1.00 | ||||
| Q2 | 0.01 | 548 | 130 | 0.99 | 0.75 | 1.31 | 1.03 | 0.75 | 1.42 | |
| Q3 | 0.02 | 548 | 110 | 0.81 | 0.61 | 1.08 | 0.86 | 0.61 | 1.20 | |
| Q4 | 0.03 | 547 | 118 | 0.88 | 0.66 | 1.17 | 1.03 | 0.72 | 1.48 | |
| p-value for trend | 0.1913 | 0.8488 | ||||||||
| Anthocyanins | ||||||||||
| Cyanidin | Q1 | 1.32 | 547 | 141 | 1.00 | 1.00 | ||||
| Q2 | 3.30 | 548 | 142 | 1.02 | 0.77 | 1.33 | 1.00 | 0.74 | 1.36 | |
| Q3 | 6.89 | 548 | 104 | 0.68 | 0.51 | 0.91 | 0.74 | 0.53 | 1.03 | |
| Q4 | 13.05 | 547 | 100 | 0.65 | 0.49 | 0.87 | 0.66 | 0.47 | 0.93 | |
| p-value for trend | 0.0004 | 0.0055 | ||||||||
| Delphinidine | Q1 | 0.01 | 547 | 151 | 1.00 | 1.00 | ||||
| Q2 | 0.07 | 546 | 121 | 0.75 | 0.57 | 0.98 | 0.77 | 0.57 | 1.05 | |
| Q3 | 0.20 | 552 | 97 | 0.56 | 0.42 | 0.75 | 0.65 | 0.47 | 0.91 | |
| Q4 | 0.54 | 545 | 118 | 0.73 | 0.55 | 0.96 | 0.77 | 0.56 | 1.07 | |
| p-value for trend | 0.0991 | 0.3163 | ||||||||
| Pelargonidine | Q1 | 0.02 | 547 | 156 | 1.00 | 1.00 | ||||
| Q2 | 0.09 | 546 | 124 | 0.73 | 0.56 | 0.96 | 0.83 | 0.61 | 1.13 | |
| Q3 | 0.16 | 552 | 109 | 0.62 | 0.47 | 0.82 | 0.67 | 0.49 | 0.92 | |
| Q4 | 0.48 | 545 | 98 | 0.55 | 0.41 | 0.73 | 0.64 | 0.46 | 0.90 | |
| p-value for trend | 0.0003 | 0.0199 | ||||||||
| Peonidine | Q1 | 0.10 | 530 | 139 | 1.00 | 1.00 | ||||
| Q2 | 0.48 | 513 | 117 | 0.83 | 0.62 | 1.10 | 1.02 | 0.74 | 1.40 | |
| Q3 | 0.83 | 576 | 118 | 0.72 | 0.55 | 0.95 | 0.80 | 0.58 | 1.10 | |
| Q4 | 2.50 | 571 | 113 | 0.70 | 0.52 | 0.92 | 0.78 | 0.56 | 1.08 | |
| p-value for trend | 0.029 | 0.115 | ||||||||
| Variables | Quartile | Median | No. of Total | No. of Cases | Model 1 | Model 2 | ||||
|---|---|---|---|---|---|---|---|---|---|---|
| OR | 95% CI Lower Upper | OR | 95% CI Lower Upper | |||||||
| Total Carotenoids | Q1 | 11.61 | 396 | 151 | 1.00 | 1.00 | ||||
| Q2 | 18.03 | 423 | 125 | 0.77 | 0.58 | 1.01 | 0.72 | 0.53 | 0.99 | |
| Q3 | 25.65 | 444 | 104 | 0.61 | 0.46 | 0.82 | 0.67 | 0.48 | 0.94 | |
| Q4 | 38.29 | 440 | 107 | 0.64 | 0.48 | 0.84 | 0.70 | 0.47 | 1.04 | |
| p-value for trend | 0.0001 | 0.0604 | ||||||||
| α-carotene | Q1 | 0.15 | 412 | 135 | 1.00 | 1.00 | ||||
| Q2 | 0.30 | 418 | 130 | 0.94 | 0.71 | 1.24 | 0.85 | 0.62 | 1.17 | |
| Q3 | 0.48 | 428 | 120 | 0.84 | 0.63 | 1.11 | 0.82 | 0.59 | 1.15 | |
| Q4 | 0.83 | 445 | 102 | 0.69 | 0.51 | 0.92 | 0.74 | 0.51 | 1.09 | |
| p-value for trend | 0.0068 | 0.1635 | ||||||||
| β-carotene | Q1 | 3.27 | 397 | 150 | 1.00 | 1.00 | ||||
| Q2 | 4.99 | 429 | 119 | 0.74 | 0.56 | 0.98 | 0.82 | 0.59 | 1.12 | |
| Q3 | 6.75 | 437 | 111 | 0.68 | 0.51 | 0.90 | 0.90 | 0.64 | 1.27 | |
| Q4 | 9.56 | 440 | 107 | 0.65 | 0.49 | 0.87 | 0.82 | 0.55 | 1.22 | |
| p-value for trend | 0.0041 | 0.4396 | ||||||||
| Lycopene | Q1 | 0.28 | 406 | 141 | 1.00 | 1.00 | ||||
| Q2 | 0.82 | 416 | 132 | 0.91 | 0.69 | 1.20 | 0.92 | 0.68 | 1.26 | |
| Q3 | 2.00 | 434 | 114 | 0.76 | 0.57 | 1.00 | 0.80 | 0.58 | 1.10 | |
| Q4 | 4.30 | 447 | 100 | 0.64 | 0.48 | 0.86 | 0.66 | 0.47 | 0.92 | |
| p-value for trend | 0.0015 | 0.0106 | ||||||||
| Lutein | Q1 | 0.71 | 412 | 135 | 1.00 | 1.00 | ||||
| Q2 | 1.23 | 427 | 121 | 0.86 | 0.65 | 1.14 | 0.95 | 0.69 | 1.31 | |
| Q3 | 1.88 | 434 | 114 | 0.80 | 0.60 | 1.06 | 0.99 | 0.71 | 1.39 | |
| Q4 | 3.42 | 430 | 117 | 0.84 | 0.63 | 1.11 | 1.01 | 0.70 | 1.45 | |
| p-value for trend | 0.2813 | 0.8717 | ||||||||
| Zeaxanthin | Q1 | 0.07 | 403 | 144 | 1.00 | 1.00 | ||||
| Q2 | 0.13 | 431 | 117 | 0.76 | 0.58 | 1.01 | 0.75 | 0.55 | 1.04 | |
| Q3 | 0.22 | 423 | 125 | 0.83 | 0.63 | 1.10 | 0.86 | 0.62 | 1.19 | |
| Q4 | 0.37 | 446 | 101 | 0.64 | 0.48 | 0.86 | 0.63 | 0.44 | 0.90 | |
| p-value for trend | 0.0077 | 0.028 | ||||||||
| β-cryptoxanthin | Q1 | 0.12 | 416 | 131 | 1.00 | 1.00 | ||||
| Q2 | 0.21 | 406 | 142 | 1.11 | 0.85 | 1.47 | 1.05 | 0.77 | 1.44 | |
| Q3 | 0.32 | 434 | 114 | 0.84 | 0.63 | 1.12 | 0.76 | 0.54 | 1.07 | |
| Q4 | 0.50 | 447 | 100 | 0.72 | 0.53 | 0.96 | 0.75 | 0.52 | 1.09 | |
| p-value for trend | 0.004 | 0.0542 | ||||||||
| Capsaicin | Q1 | 4.70 | 401 | 146 | 1.00 | 1.00 | ||||
| Q2 | 8.02 | 424 | 124 | 0.79 | 0.60 | 1.05 | 0.82 | 0.60 | 1.13 | |
| Q3 | 12.90 | 436 | 112 | 0.70 | 0.53 | 0.93 | 0.77 | 0.55 | 1.08 | |
| Q4 | 20.52 | 442 | 105 | 0.65 | 0.49 | 0.86 | 0.70 | 0.48 | 1.02 | |
| p-value for trend | 0.0035 | 0.0782 | ||||||||
| No | Name of Compound | EFEB in MAOA | EFEB in MAOB |
|---|---|---|---|
| 1 | (−) Epicatechin-3-gallate | −12.73 | −13.84 |
| 2 | Quercetin | −11.43 | −10.91 |
| 3 | Myricetin | −10.83 | −10.91 |
| 4 | Luteolin | −10.81 | −10.84 |
| 5 | Eriodictyol | −10.78 | −10.98 |
| 6 | Kaempferol | −10.37 | −9.97 |
| 7 | Delphinidine | −10.27 | −10.4 |
| 8 | Petunidine | −10.25 | −10.38 |
| 9 | Capsaicin | −10.24 | −10.43 |
| 10 | Biochanin A | −10.12 | −10.37 |
| 11 | Cyanidin | −9.98 | −9.86 |
| 12 | Naringenin | −9.89 | −10.05 |
| 13 | Apigenin | −9.84 | −9.94 |
| 14 | Peonidine | −9.69 | −10.41 |
| 15 | Glycitein | −9.68 | −9.59 |
| 16 | Formonnetin | −9.67 | −10.26 |
| 17 | Genistein | −9.65 | −10.28 |
| 18 | (+)-Catechin | −9.62 | −10.33 |
| 19 | (+)-Gallocatechin | −9.54 | −10.37 |
| 20 | Coumestrol | −9.47 | −10.3 |
| 21 | Epigallocatechin | −8.96 | −13.34 |
| 22 | Pelargonidine | −8.96 | −9.06 |
| 23 | Daidzein | −8.96 | −9.72 |
| 24 | Theaflavin | 59.64 | −7.74 |
| Sr. No | Name of Compound | EFEB in BDNF |
|---|---|---|
| 1 | α-Carotene | −7.24 |
| 2 | β-Cryptoxanthin | −6.79 |
| 3 | Lycopene | −6.47 |
| 4 | β-Carotene | −6.18 |
| 5 | Capsaicin | −6.17 |
| 6 | Zeaxanthin | −6.10 |
| 7 | Lutein | −6.06 |
Publisher’s Note: MDPI stays neutral with regard to jurisdictional claims in published maps and institutional affiliations. |
© 2021 by the authors. Licensee MDPI, Basel, Switzerland. This article is an open access article distributed under the terms and conditions of the Creative Commons Attribution (CC BY) license (https://creativecommons.org/licenses/by/4.0/).
Share and Cite
Park, S.-J.; Jaiswal, V.; Lee, H.-J. Dietary Intake of Flavonoids and Carotenoids Is Associated with Anti-Depressive Symptoms: Epidemiological Study and In Silico—Mechanism Analysis. Antioxidants 2022, 11, 53. https://doi.org/10.3390/antiox11010053
Park S-J, Jaiswal V, Lee H-J. Dietary Intake of Flavonoids and Carotenoids Is Associated with Anti-Depressive Symptoms: Epidemiological Study and In Silico—Mechanism Analysis. Antioxidants. 2022; 11(1):53. https://doi.org/10.3390/antiox11010053
Chicago/Turabian StylePark, Seon-Joo, Varun Jaiswal, and Hae-Jeung Lee. 2022. "Dietary Intake of Flavonoids and Carotenoids Is Associated with Anti-Depressive Symptoms: Epidemiological Study and In Silico—Mechanism Analysis" Antioxidants 11, no. 1: 53. https://doi.org/10.3390/antiox11010053
APA StylePark, S.-J., Jaiswal, V., & Lee, H.-J. (2022). Dietary Intake of Flavonoids and Carotenoids Is Associated with Anti-Depressive Symptoms: Epidemiological Study and In Silico—Mechanism Analysis. Antioxidants, 11(1), 53. https://doi.org/10.3390/antiox11010053