Article

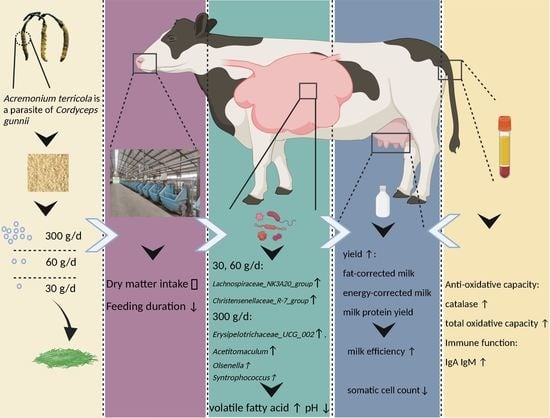
Acremonium terricola Culture’s Dose–Response Effects on Lactational Performance, Antioxidant Capacity, and Ruminal Characteristics in Holstein Dairy Cows

1
Beijing Engineering Technology Research Center of Raw Milk Quality and Safety Control, The State Key Laboratory of Animal Nutrition, Department of Animal Nutrition and Feed Science, College of Animal Science and Technology, China Agricultural University, No. 2 Yuanmingyuan West Road, Haidian District, Beijing 100094, China
2
Laboratory of Anatomy of Domestic Animals, Department of Basic Veterinary Medicine, College of Veterinary Medicine, China Agricultural University, No. 2 Yuanmingyuan West Road, Haidian District, Beijing 100094, China
3
Microbial Biological Engineering Company Limited, Fanhua Road Jingkai District, Hefei 230009, China
4
Beijing JingWa Agricultural Science and Technology Innovation Center, Mishan Road, Pinggu District, Beijing 101200, China
*
Authors to whom correspondence should be addressed.
These authors contributed equally to this work.
Antioxidants 2022, 11(1), 175; https://doi.org/10.3390/antiox11010175
Submission received: 25 December 2021 / Revised: 13 January 2022 / Accepted: 13 January 2022 / Published: 17 January 2022
(This article belongs to the Special Issue Antioxidants in Animal Feed)

Abstract

:
Acremonium terricola culture (ATC) has similar bioactive constituents to Cordyceps and is known for its nutrient and pharmacological value, indicating the potential of ATC as a new feed additive in dairy cow feeding. The primary aim of this experiment was to investigate the effects of increasing amounts of ATC in diets on milk performance, antioxidant capacity, and rumen fermentation, and the secondary aim was to evaluate the potential effects of high doses of ATC. A total of 60 multiparous Holstein cows (110 ± 21 days in milk; 2.53 ± 0.82 parity) were assigned into 15 blocks and randomly assigned to one of four groups: 0, 30, 60, or 300 g/d of ATC per cow for 97 days. Data were analyzed using repeated measures in the Mixed procedure. Dry-matter intake was not changed (p > 0.05), while energy-corrected milk and fat-corrected milk yields increased linearly and quadratically, and somatic cell count in milk decreased linearly and quadratically (p < 0.05). The lactation efficiency and the yields of milk fat and protein increased linearly (p < 0.05). On day 90, serum catalase level, total oxidative capacity, glutathione peroxidase, immunoglobulin A, and immunoglobulin M concentrations were significantly higher in the 60 and 300 g/d groups than in the 0 g/d group (p < 0.05). ATC addition showed linear effects on total volatile fatty acid (VFA), acetate, branched VFA concentrations, and rumen pH (p < 0.05). Supplementing 60 and 300 g/d ATC significantly affected the bacterial composition (p < 0.05). The relative abundance of Christensenellaceae_R–7_group and Lachnospiraceae_NK3A20_group were significantly increased by 60 g/d supplementation, and the relative abundance of Erysipelotrichaceae_UCG_002, Acetitomaculum, Olsenella, and Syntrophococcus were significantly increased by 300 g/d supplementation (p < 0.05). ATC was effective in enhancing rumen fermentation and reducing somatic cell count in milk, thereby improving milk yield. The optimized dose of ATC was 60 g/d for lactating cows, and there were no risks associated with high doses of ATC.

Graphical Abstract

1. Introduction

The health and biological function of livestock often have been prioritized in recent years [1]. Nutritional strategies have emerged, and they have been proposed as a key factor to improve the health status and welfare of animals, as well as to enhance productivity of livestock [2,3,4]. Feed additives, which are nutrients that when added to the feed can trigger the desired response of the animal’s body on production parameters, have been widely used in animal nutrition for quite a long time [5,6,7,8]. The main compounds used for this purpose are fermented feed, probiotics, prebiotics, synbiotics, or various types of residues from plant production. Cordyceps has a long history, and has been used for the last 300 years [9]. It is a rare, naturally entomopathogenic fungus that is mostly collected on the Himalayan plateau in China. Although wild Cordyceps has many functional bioactive ingredients, including cordycepin, cordycepic acid, and cordyceps polysaccharide, it takes a long time to grow under strict conditions, cannot be cultivated artificially, and can only be harvested once [10]. In recent decades, many studies have shown that the major functional components in Cordyceps possess multiple resistances to viruses, inflammation, oxidants, tumors, diabetes, and thrombi [9,11,12,13] Thus, many investigators have been devoted to artificial cultivation to obtain prebiotics [14,15].
Acremonium terricola is a parasite isolated from Cordyceps gunnii; artificial solid fermentation is then used to obtain Acremonium terricola culture (ATC). ATC is a new feed additive with bioactive ingredients that are the same as those of C. gunnii, such as D-mannitol, galactomannan, cordycepin, and essential amino acids [16]. As reported in previous studies, ATC supplementation enhanced the growth performance, antioxidant capacity, and immune function of calves [17]. ATC supplementation increased the total tract apparent digestibility and milk performance in dairy cows, then decreased somatic cell counts in milk [18,19]. Dairy cows during the transition period are at risk of diseases, and undergo extensive tissue mobilization due to a negative energy balance [20,21,22]. Li et al. [23] found that 30 g/d ATC ameliorated the negative energy balance and improved milk production and antioxidant capacity. These studies indicated that ATC was an effective feed additive for dairy cows at 30 g/d, and the maximum addition amount (30 g/d) was more effective than other additional amounts. However, studies on the effects of the higher dose of ATC supplementation on milk production are lacking, which means that the appropriate level of ATC in the diet is still not clear. In this regard, galactomannans from ATC are water-soluble polysaccharide polymers, and several studies have reported that galactomannan plays a crucial role in manipulating gastrointestinal microbiota by providing nutrients for beneficial microbes [12,24,25]. Additionally, D-mannitol can also become the sole energy source for bacterial growth in the rumen [26]. It is known that highly dense and diverse microbial populations in the rumen cause many differences in feeding modes and physiology between ruminants and monogastric animals [27]. Thus, ATC supplementation in dairy cows may have the potential to further improve milk performance and rumen function.
The ingredients and bioactivities of ATC are the same as those of wild Cordyceps. Owing to the wild occurrence, natural Cordyceps is regarded as pharmacologically secure. However, dry mouth, nausea, abdominal distension, throat discomfort, headache, diarrhea, and allergic reactions have been reported in Cordyceps studies [28,29,30]. Tests of cordycepin in dogs involved gastrointestinal toxicity and bone marrow toxicity [31]. However, these toxicity tests were conducted using monogastric animals instead of ruminants. Thus, future in-depth evaluation of the security of ATC will benefit its mass production and use as a feed additive.
We hypothesized that ATC supplementation would improve the milk performance, antioxidant capacity, and immune function of midlactating dairy cows, and reshape their microbiota. Hence, this study investigated the effects of different amounts of ATC on feeding behavior, ruminal fermentation, bacterial composition, serum variables, and milk performance, as well as the possible adverse effects of high doses of ATC, on lactating dairy cows.

2. Materials and Methods

2.1. Animals and Treatments

On a commercial dairy farm (Jinyindao Dairy Farm; Sanyuan Food Co., Ltd., Beijing, China), 60 multiparous lactating dairy cows averaging 110 ± 21 days (mean ± SD) in milk, 28 ± 3 kg/d of milk, 2.53 ± 0.82 parity, and 630 ± 50 kg of body weight were selected and assigned into 15 blocks according to days in milk (DIM) and milk yield, and then randomly allocated to 1 of 4 groups: 0, 30, 60, or 300 g/d of ATC for each cow, added into a total mixed ration (TMR). The ATC was provided by Microbial Biological Engineering Ltd. (Hefei, China), and the functional composition of the ATC is listed in Supplementary Table S1. The recommended dose for ATC was 30 g/d [19,32]. In this experiment, we included double the recommended dose to determine whether ATC had a linear and quadratic effect on lactation performance, as well as 10 times the recommended dose to test the potential effects on dairy cow health. The same barn equipped with water bowls and automatic weighing feeding equipment (Insentec B.V., Marknesse, The Netherlands) were provided for these cows to obtain individual feed intake. All cows were fed and milked 3 times per day at 09:00, 16:00, and 22:00. The ATC was top-dressed onto a TMR; ingredients and nutrient contents of the TMR are listed in Supplementary Table S2. The diet was formatted using National Research Council (NRC, 2001) [33] to meet the nutrient requirements of lactating dairy cows. The experiment period was 97 days, including 7 days to allow for adaptation, during which ATC was supplemented gradually. According to the standard operating procedure on this commercial dairy farm, all cows had de-worming (ivermectin, Harbin Qianhe Animal Medicine Manufacturing Co., Ltd., Harbin, China) during the dry-off period, and the farm followed the epidemic prevention and control procedures. All experimental procedures were submitted to the experimental animal welfare and animal ethics committee of China Agricultural University and approved (CAU2021009-2).

2.2. Sampling and Analysis

Individual feed intake was recorded daily using feed-weighing equipment (RIC system, Insentec B.V., Marknesse, The Netherlands), and the samples of TMR and orts were collected on the same day (the first day of every week). The TMR, orts, and ATC were used to determine the nutrient composition, including dry matter (DM, 105 °C for 5 h), acid detergent fiber (ADF), neutral detergent fiber (NDF), and crude protein (CP) contents [34,35]. Daily dry-matter intake (DMI) was calculated using Equation (1):
DMI = as   fed   TMR   ×   dry   matter   content     ort   ×   dry   matter   content
The amino acid (AA) concentrations were analyzed with a Hitachi L-8900 automatic AA analyzer (HITACHI High-Tech Corporation Ltd., Shanghai, China). The concentrations of D-mannitol, galactomannan, 3’-deoxyadenosine, and ergosterol were determined using liquid chromatography [36].
Milk yield was recorded electronically, and 50 mL of representative milk from each cow was collected at 0, 30, 60, and 90 days using a diverter (BouMatic Company, Madison, WI, USA). The 50 mL milk sample included 20 mL of milk from the 09:00 milking, 15 mL from the 16:00 milking, and 15 mL from the 22:00 milking. Milk samples were stored at 4 °C for further analysis of milk composition (protein, fat, lactose, urea nitrogen, and somatic cell count) using a FOSS MilkoScanTM 7 (FOSS, Hillerod, Denmark).
Blood samples were collected from the tail vein of each cow into 5 mL Vacutainer K2EDTA tubes (OLABO Biotechnology Co., Ltd., Jinan, China) at 0, 45, and 90 days after morning feeding between 11:00 and 12:00. Blood serum was separated by centrifugation (3000× g for 10 min at 4 °C) after sampling immediately and stored at −20 °C. At the end of the experiment, all serum samples were analyzed using a GF-D200 Auto Analyzer (Caihong Analytical Instrument Co., Ltd., Gaomi, China) to determine urea nitrogen (SUN) and total amino acid (TAA) concentrations using standard commercial kits (BioSino BioTechnology and Science Inc., Beijing, China). The superoxide dismutase (SOD), catalase (CAT), malondialdehyde (MDA), total oxidative capacity (TAC), and glutathione peroxidase (GSH-Px) levels were determined by colorimetry using commercial kits (Nanjing Jian Cheng Bioengineering Institute, Nanjing, China). Immunoglobulin A (IgA), immunoglobulin G (IgG), and immunoglobulin M (IgM) concentrations were determined with ELISA kits (Abcam, Cambridge, UK) using a Thermo Multiskan Ascent (Thermo Fisher Scientific, Shanghai, China). The intra- and interassay coefficients of variations were both <10%.
Ruminal fluid was collected using an oral stomach tube after 2 h morning feeding from six cows at 0 and 90 days in each group, which accounted for close to the average milk production. The tube was cleaned thoroughly with fresh warm water after each sampling. The first 150 mL of rumen fluid was useless, and subsequent rumen fluid was collected and filtered through four layers of cheesecloth to obtain the fluid fraction. The fluid fraction pH value was measured with a Sartorius PB-10 pH meter (Beijing Sartorius Instrument Systems Co., Ltd., Beijing, China). The rumen fluid was stored in a 20 mL centrifuge tube, then frozen at –20 °C for volatile fatty acid (VFA) analysis. The rest of the fluid was stored in a 2 mL centrifuge tube and frozen at –80 °C for 16S sequencing. VFA content was quantified using gas chromatography (Agilent 6890N, Agilent Technology, Inc., Beijing, China), according to Kong et al [37].
Total DNA was extracted from 1 mL rumen fluid samples (thawing for 10 min) using an E.Z.N.A.® Soil DNA Kit (Omega Bio-Tek, Norcross, GA, USA) according to the manufacturer’s instructions. The DNA extract was analyzed on a 1% agarose gel, and DNA concentration and purity were determined using a NanoDrop 2000 UV–vis spectrophotometer (Thermo Scientific, Wilmington, DE, USA). The hypervariable region V3-V4 of the bacterial 16S rRNA gene was amplified with primer pairs 338F (5′-ACTCCTACGGGAGGCAGCAG-3’) and 806R (5′–GGACTACHVGGGTWTCTAAT-3′) using an ABI GeneAmp® 9700 PCR thermocycler (ABI, Foster City, CA, USA) [38]. The PCR amplification of the 16S rRNA gene was performed according to Kong et al [38]. The PCR product was extracted from a 2% agarose gel and purified using an AxyPrep DNA Gel Extraction Kit (Axygen Biosciences, Union City, CA, USA) according to the manufacturer’s instructions, and quantified using a Quantus™ Fluorometer (Promega, Madison, WI, USA). Purified amplicons were pooled in equimolar amounts and paired-end sequenced on an Illumina MiSeq PE300 platform (Illumina, San Diego, CA, USA).
The raw 16S rRNA gene sequencing reads were demultiplexed, quality-filtered using Fastp (Version 0.20.1, Haplox, Shenzhen, China) [39], and merged using FLASH version 1.2.7 (The Center for Computational Biology at Johns Hopkins University, MD, USA) [40] with the criteria set according to Huang et al [41]. All samples were subsampled to equal size of 25,122 sequences for downstream analysis. Operational taxonomic units (OTUs) with a 97% similarity cutoff were clustered using UPARSE version 7.1 (Independent Investigator, CA, USA) [42], and chimeric sequences were identified and removed. The taxonomy of each OTU representative sequence was analyzed using the RDP Classifier version 2.2 (Center for Microbial Ecology, Michigan State University, MI, USA) [43] against the 16S rRNA database (e.g., Silva v138) using a confidence threshold of 0.7 [44]. The relative abundance of phylum or genus ≥ 1% was used to consider the predominant phylum or genus. Alpha diversity indices (observed richness, Chao1, ACE, Shannon, Simpson) and Good’s coverage were obtained using the alpha rarefaction script in QIIME [45]. Principal coordinates analysis (PCoA) was conducted by Bray–Curtis matrices in R (http://www.rstudio.com, accessed on 3 May 2021). An analysis of similarities (ANOSIM) using Bray–Curtis distance matrices was performed to test the statistical differences among the observed microbial profiles.

2.3. Statistical Analysis

The effects on feeding behavior, milk performance, serum variables, and rumen fermentation parameters were analyzed using the Mixed procedure in Statistical Analysis System 9.4 (SAS Institute Inc., Cary, NC, USA). Before analyses, data were screened for normality using the Univariate procedure; the variables except for sequencing data met the assumptions for normality. A randomized block experimental design was used for the month, treatment, and interaction of treatment and month according to the following model:
Y ijkl = μ + A i + T j + AT ij + B k + ε ijkl
where Y is the dependent variable, μ is the overall mean, Ai is the fixed effect of ATC supplementation, Tj is the repeated effect, ATij is the interaction effect of A and T, Bk is the block effect, and εijkl is the random residual error. Cows were used as the experimental units. The linear and quadratic effects of the treatment on these variables were tested using orthogonal polynomials, accounting for unequal spacing of ATC supplementation levels. The results are presented as least-squares means and were separated using the PDIFF statement when the fixed effects were significant. Significance was declared at p ≤ 0.05, and tendencies were declared at 0.05 ≤ p ≤ 0.10.
The effects on alpha diversity indices and the relative abundance of genera were assessed using the Kruskal–Wallis H test, and Dunn’s test was applied to conduct multiple comparisons. All p-values were corrected using a false discovery rate of 0.05, and a corrected p-value < 0.05 was considered significant. The data are presented as the mean ± standard error (SEM). Spearman’s correlations were calculated between the relative abundances of genera. Significant correlations were defined as −0.7 > r > 0.7, and p < 0.05.

3. Results

3.1. Feeding Behavior

Table 1 shows the effects of ATC supplementation on feeding behavior. In the third month, 30 g/d ATC supplementation increased DMI (p < 0.05), whereas DMI/feeding frequency, average DMI, and average feeding frequency were not changed after ATC supplementation (p > 0.05). The different levels of ATC supplementation decreased feeding duration and feeding duration/feeding frequency, and increased DMI/feeding duration linearly (p < 0.05).

3.2. Milk Performance

As shown in Table 2, the performances including milk yield, fat-corrected milk yield (FCM), and energy-corrected milk yield (ECM) increased linearly and quadratically with ATC supplementation level (p < 0.05). There were no significant differences between the average milk yield and average ECM yield between the 60 g/d group and 300 g/d groups (p > 0.05), which were both higher than those of cows in the 30 g/d and 0 g/d groups (p < 0.05). The milk efficiency values both increased linearly with ATC supplementation level (p < 0.05), while there was no difference between the 60 g/d ATC treatment and 300 g/d ATC treatment groups (p > 0.05).
Table 3 shows the effects of different amounts of ATC supplementation on milk composition. Milk protein, milk fat, milk lactose, and milk urea nitrogen (MUN) were not affected by ATC supplementation (p > 0.05). Milk protein yield, milk fat yield, and somatic cell count (SCC) were linearly influenced by ATC supplementation (p < 0.05). The milk protein yield in the first month was not increased after ATC supplementation (p > 0.05). The milk protein yield in the second and third months and the average yield were increased after 60 g/d and 300 g/d ATC supplementation (p < 0.05), but the milk protein yield and milk fat yield did not differ between the 60 g/d and 300 g/d ATC supplementation groups (p > 0.05). The SCC decreased in both a linear and quadratic manner after supplementation with ATC (p < 0.05), but there was no significant difference between the 60 g/d and 300 g/d ATC supplementation groups (p > 0.05).

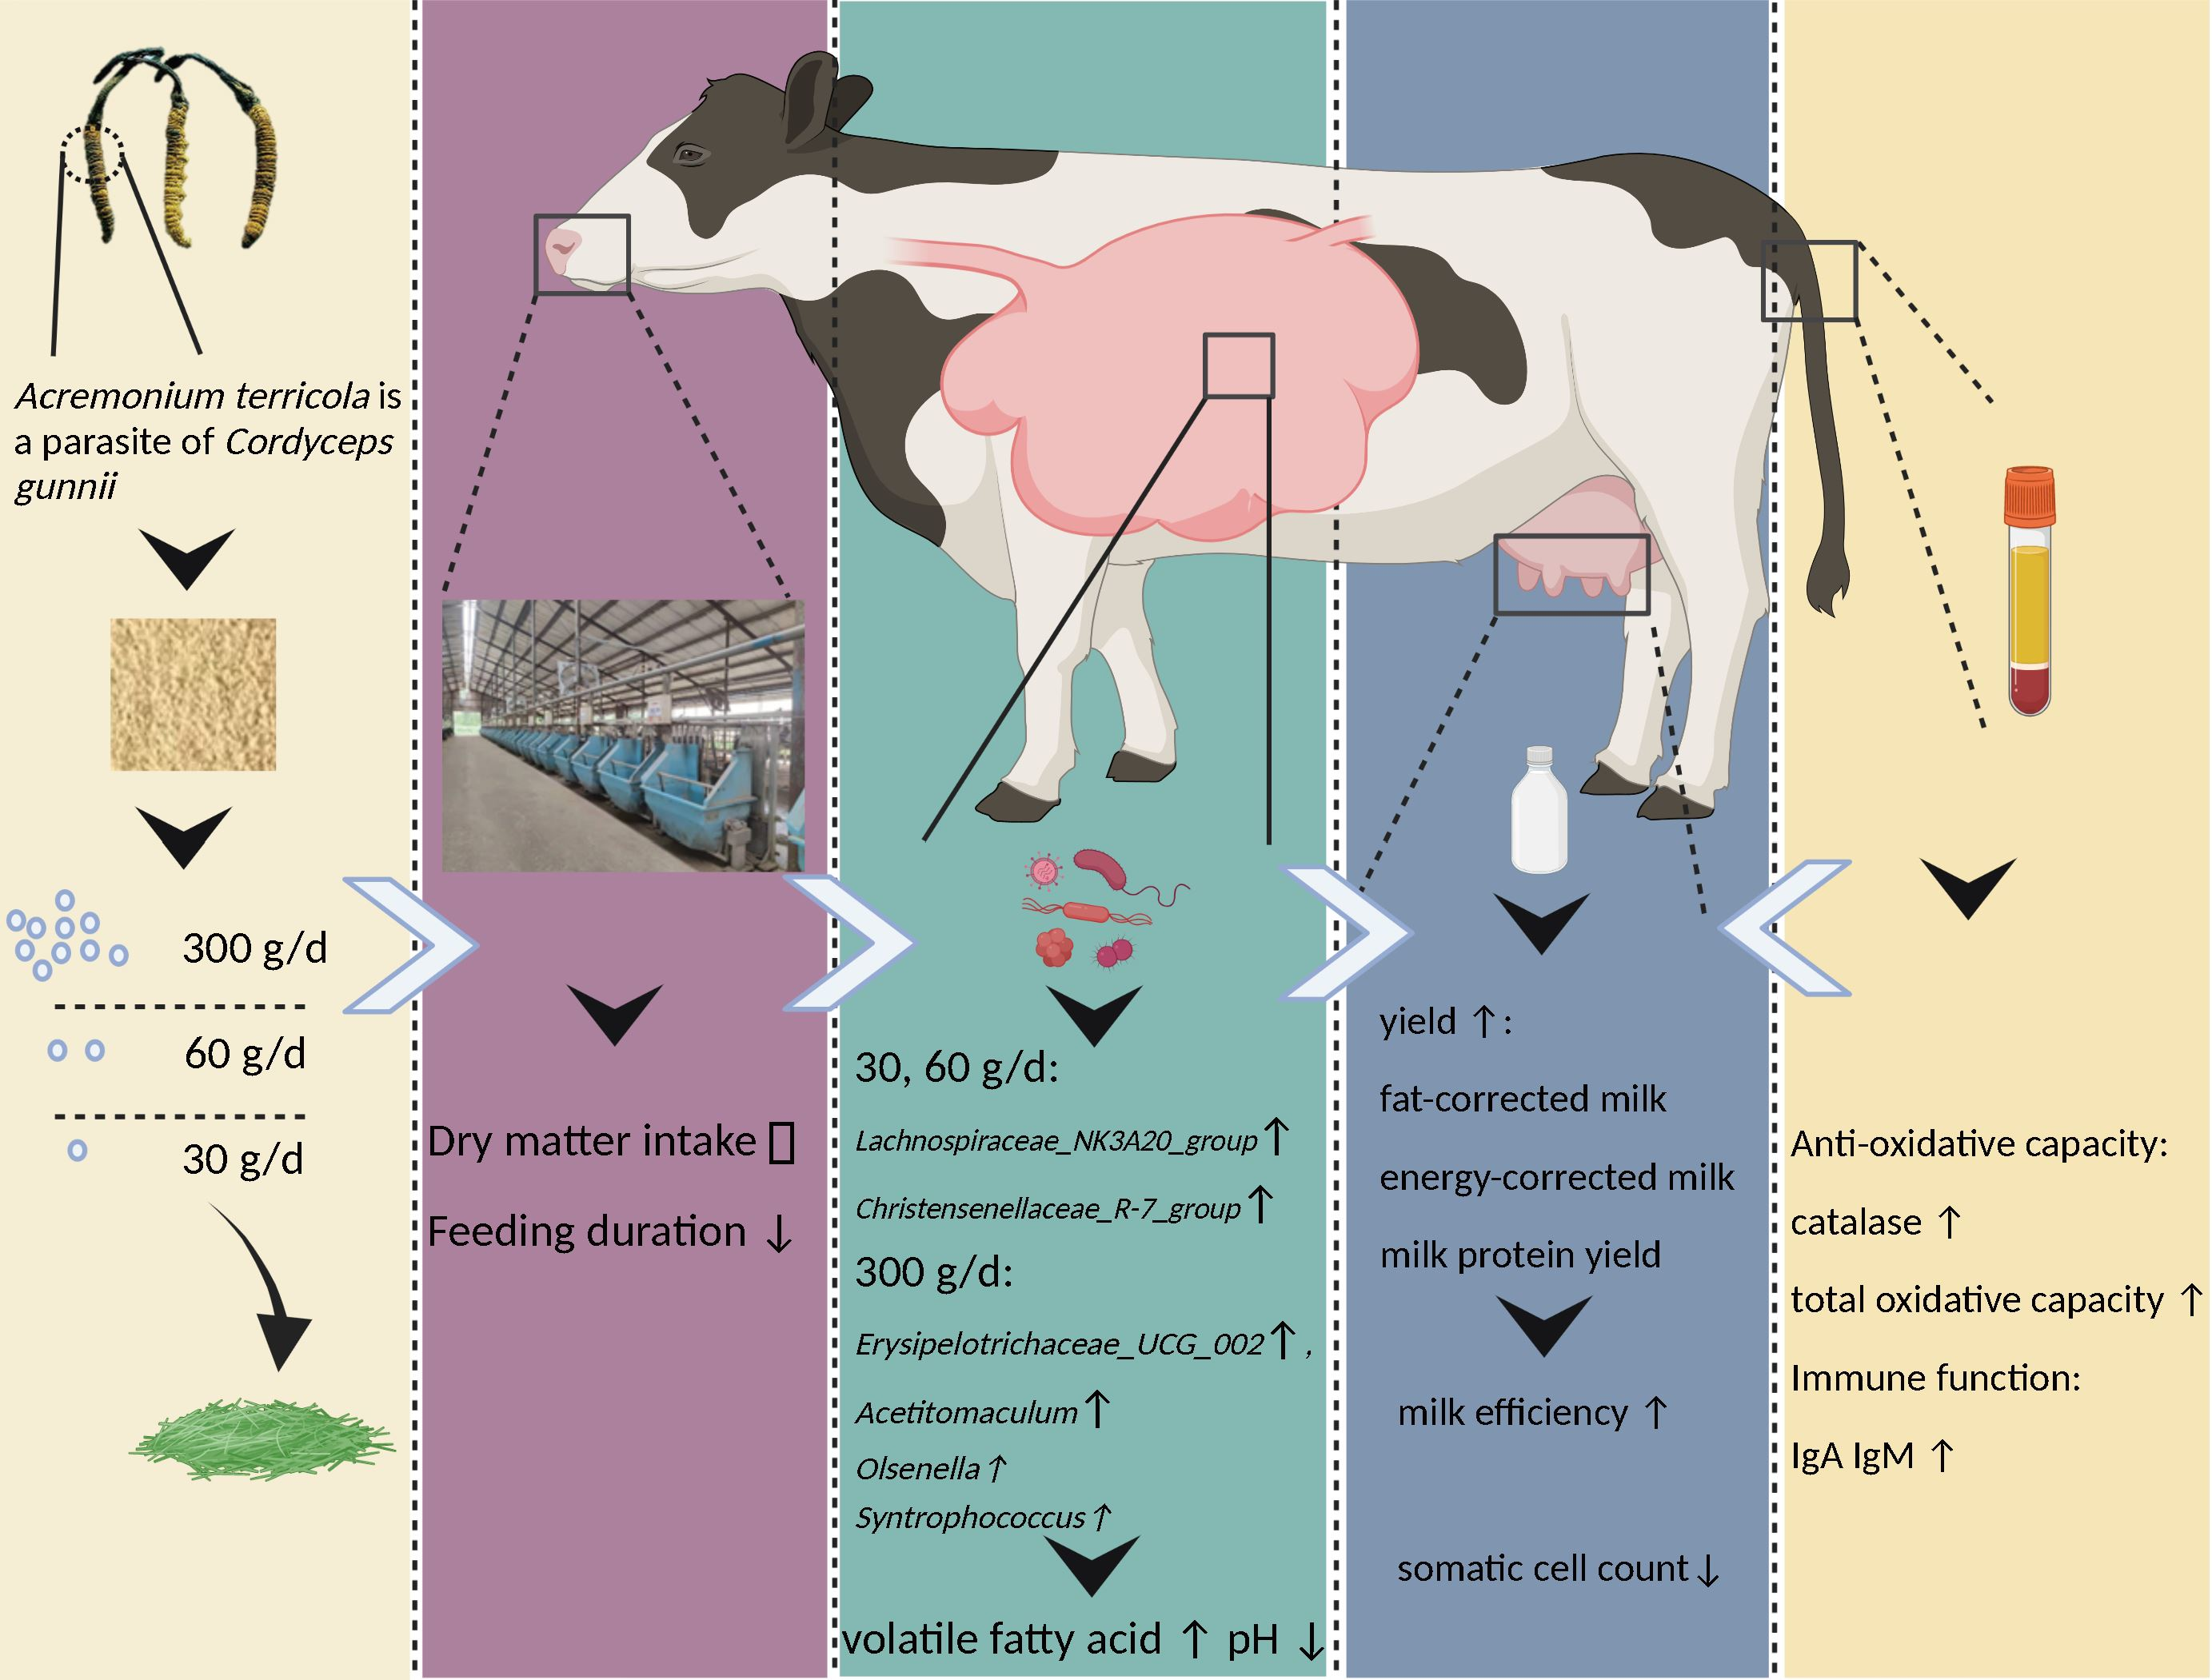
3.3. Serum Variables

Figure 1 shows the summary of the statistics for serum variables, including antioxidant capacity, immune function, and metabolites. On day 0, there was no significant difference on any serum variables among the four groups (Figure 1; p > 0.05). For antioxidant capacity, the CAT and TAC concentrations increased linearly after ATC supplementation (Figure 1A,C; p < 0.05). On day 90, the 60 g/d and 300 g/d ATC supplementation increased CAT, TAC, and GSH-Px concentrations (Figure 1A,C,E; p < 0.05). Only 300 g/d ATC supplementation increased SOD concentration on day 90 (Figure 1D; p < 0.05). For immune function, the ATC supplementation did not influence IgG concentration (Figure 1G; p > 0.05), but significantly increased IgA and IgM concentrations on day 90 (Figure 1F,H; p < 0.05). The IgA concentration increased linearly, and the IgM concentration increased quadratically after ATC supplementation (Figure 1F,H; p < 0.05). However, there were no differences among the 30 g/d, 60 g/d, and 300 g/d supplementation groups on day 45 and day 90 (Figure 1F,H; p > 0.05). For metabolites in the serum, the glucose concentration of the 300 g/d group was lower than in the 0 g/d group on day 45 (Figure 1I; p < 0.05). The SUN concentration was not affected by ATC supplementation (Figure 1J; p > 0.05). The TAA concentration increased linearly after ATC supplementation (Figure 1K; p < 0.05), and was higher in 300 g/d group on day 45 than in the 0, 30, and 60 g/d groups (Figure 1K; p < 0.05).

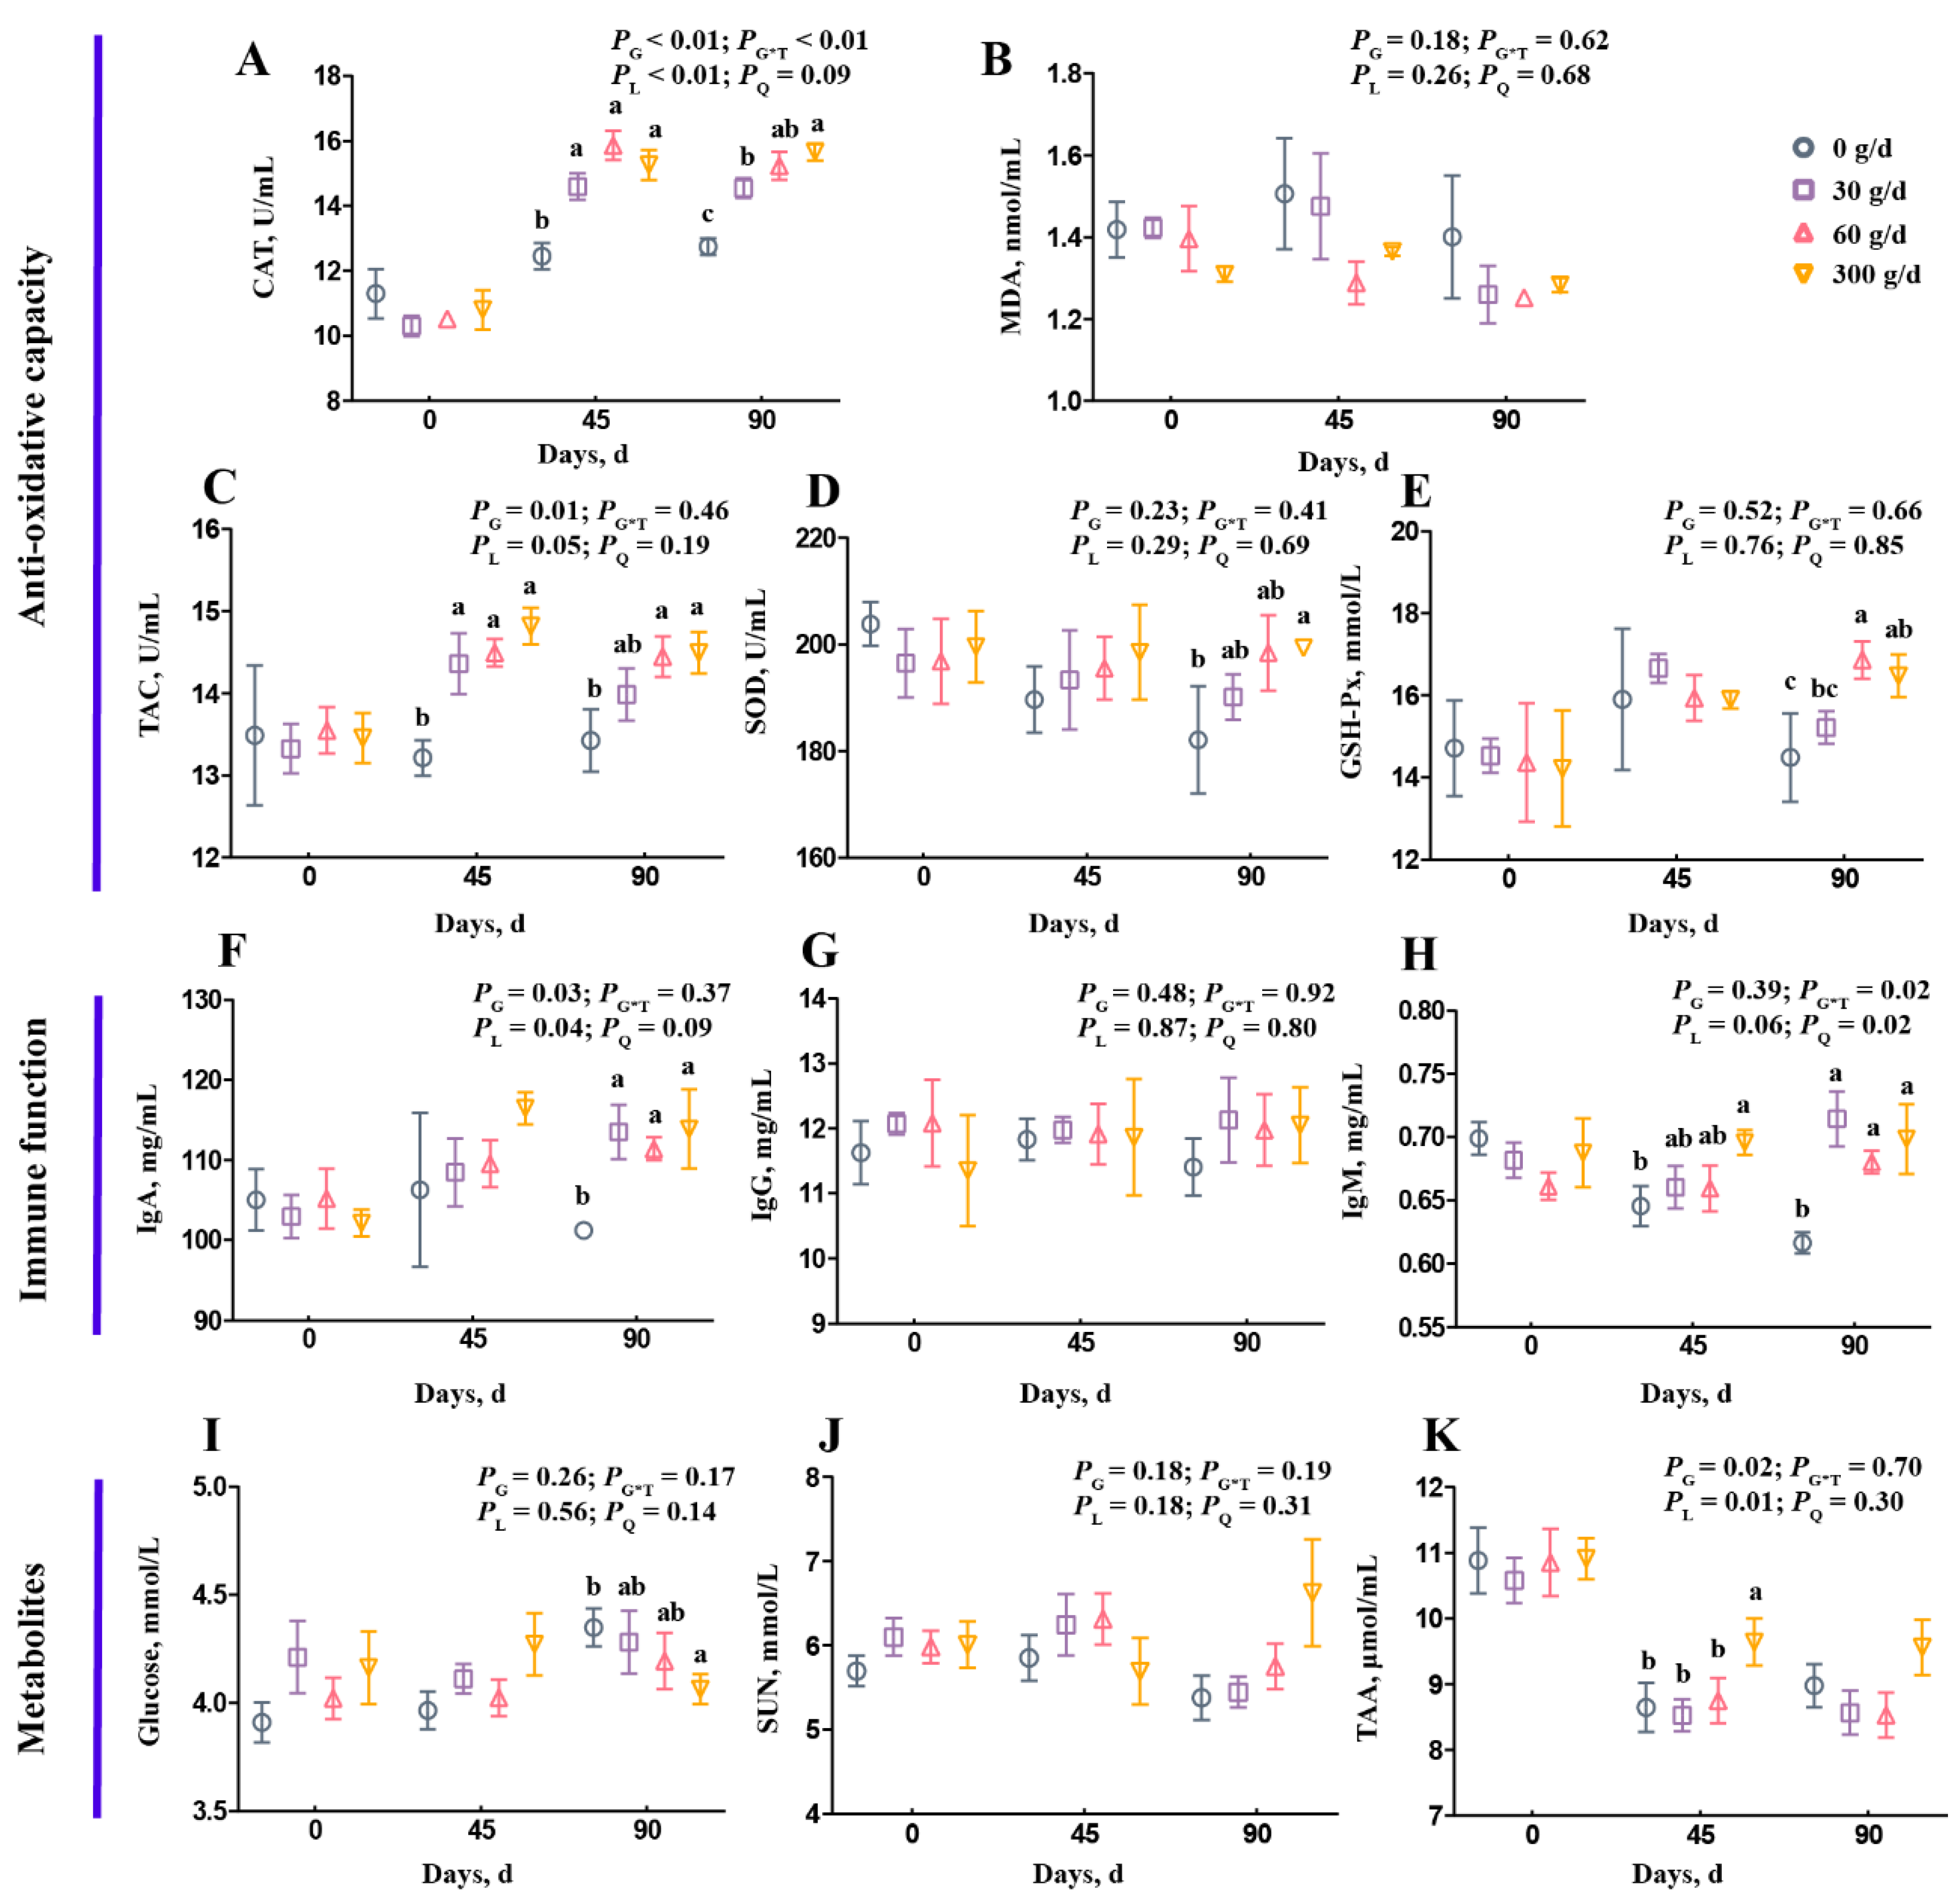
3.4. Rumen Fermentation Parameters

From the data in Figure 2, we observed a linear decrease in the rumen pH, and the pH of the 0 g/d group was higher than in other groups on day 90 (Figure 2A; p < 0.05). The supplementation did not affect ruminal NH3-N, propionate, butyrate, or valerate concentrations (Figure 2B,E–G; p > 0.05). Treatment significantly affected the molar proportion of propionate with no linear or quadratic effects (Figure 2J), and the molar proportion of butyrate decreased after 60 g/d and 300 g/d supplementation at day 90 (Figure 2K). The total volatile fatty acid (TVFA), acetate, and branched volatile fatty acid (BVFA) concentrations increased linearly with ATC supplementation (Figure 2C,D,H; p < 0.05), but the molar proportion of acetate only significantly increased after 60 g/d and 300 g/d supplementation at day 90 compared with that of the 0 g/d group (Figure 2I; p < 0.05). The TVFA and acetate concentrations were higher in cows fed with 60 g/d and 300 g/d of ATC at day 45, and were higher in the 30, 60, and 300 g/d groups on day 90 than that of those fed with 0 g/d of ATC (Figure 2C,D; p < 0.05).

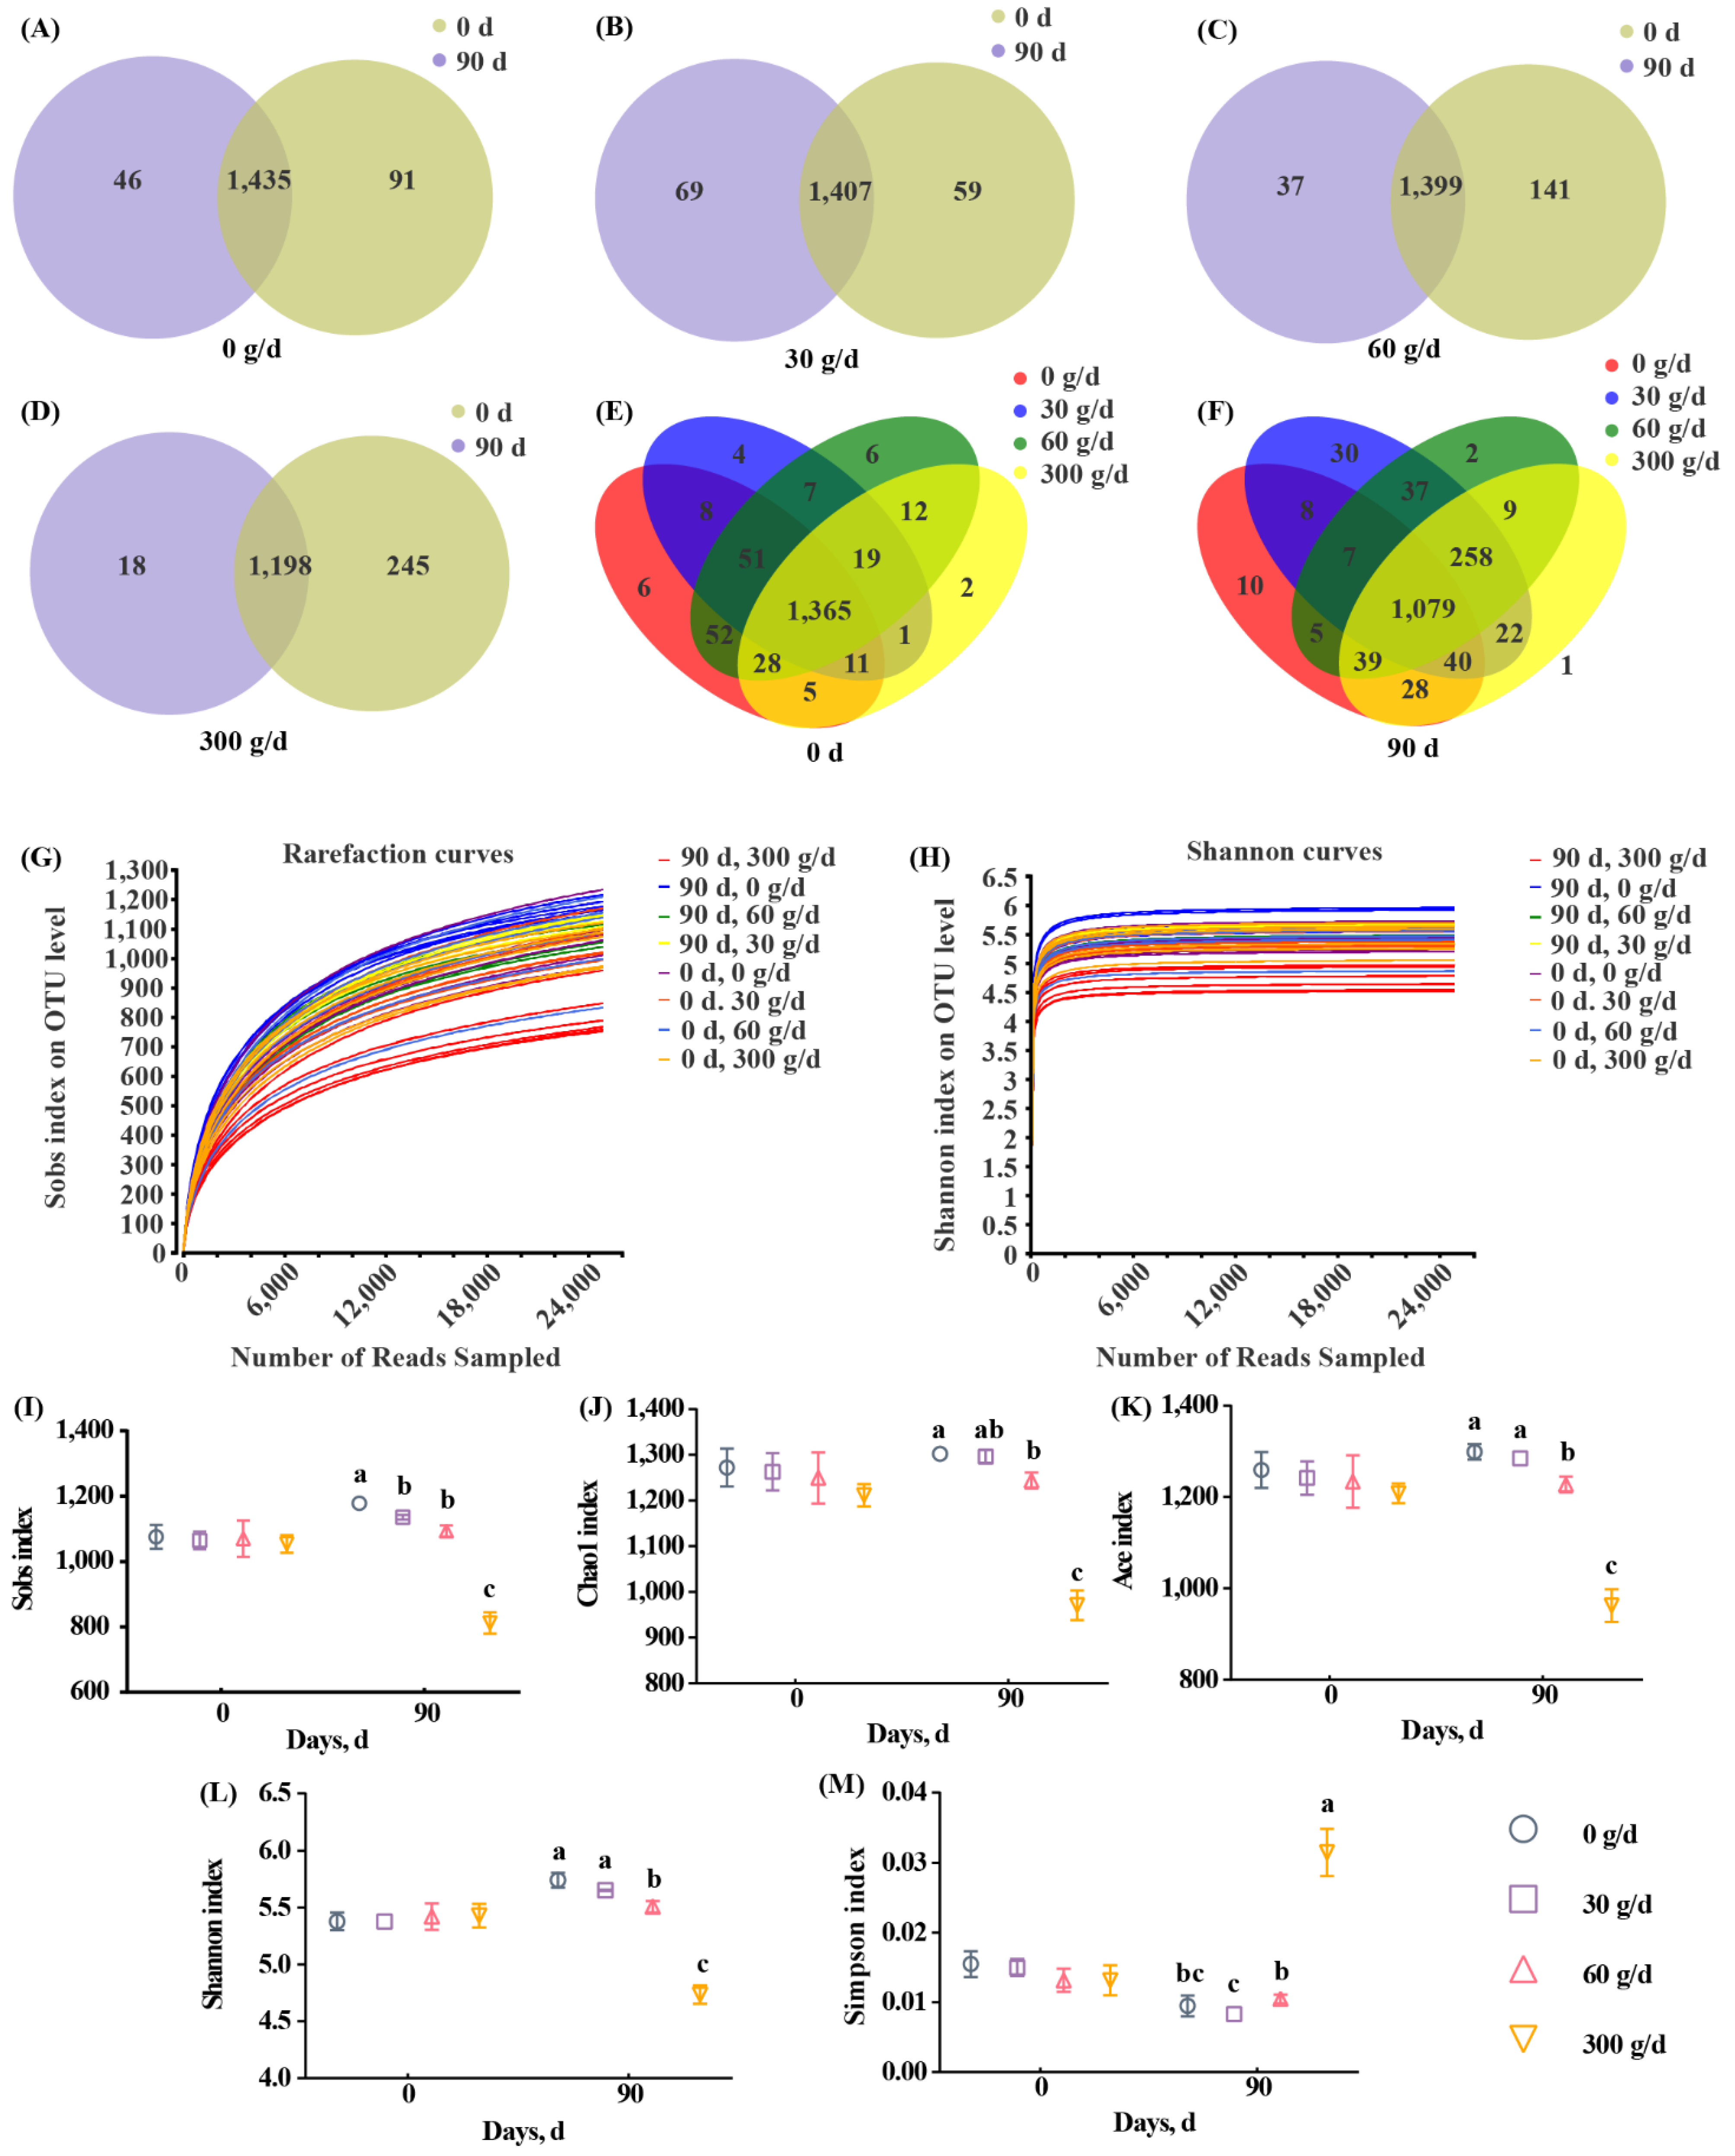
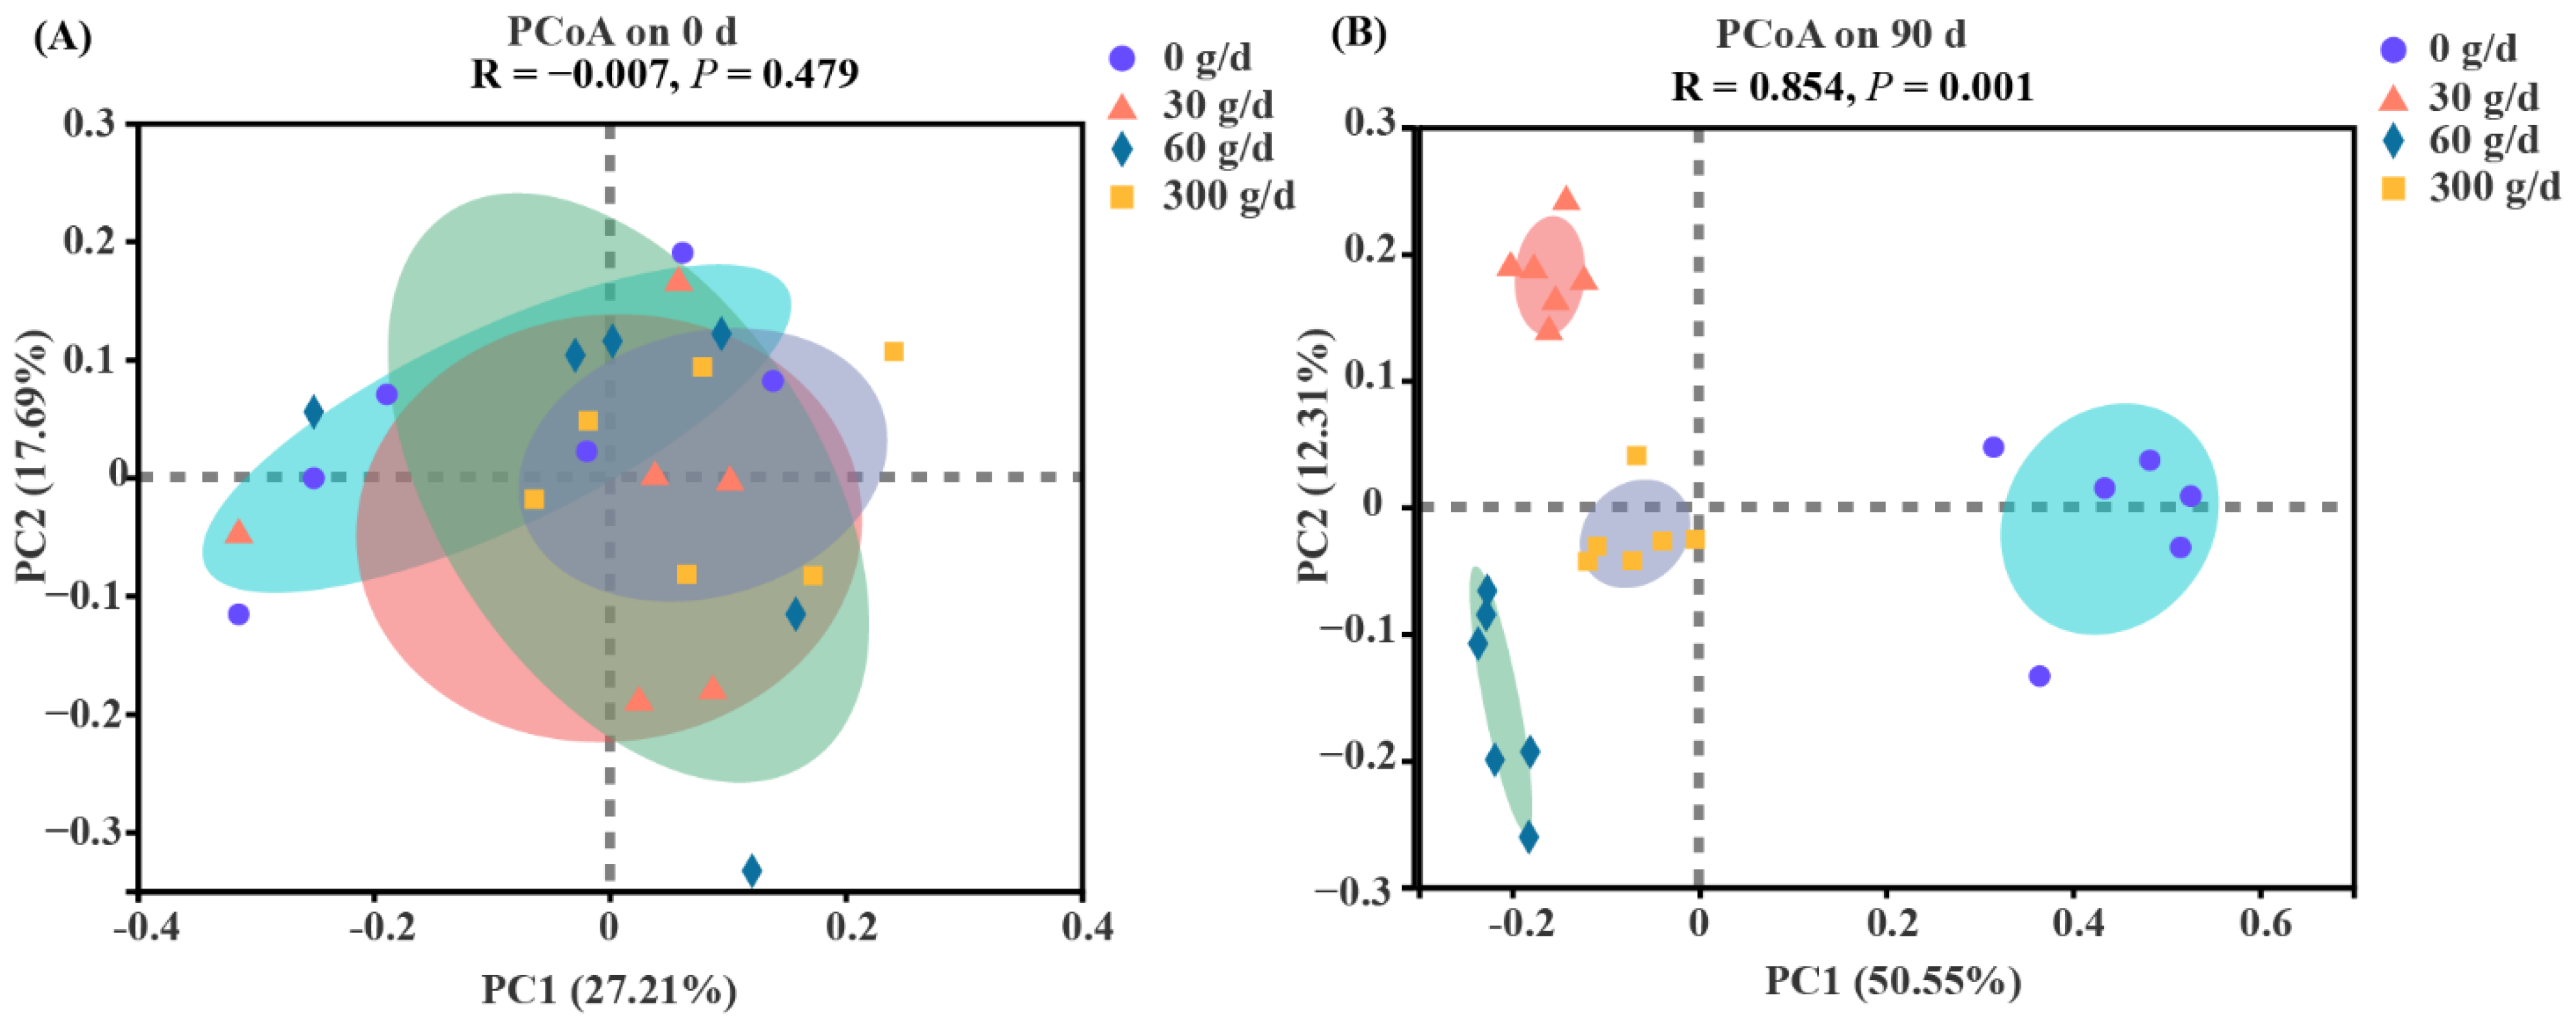
3.5. Diversity of Rumen Microbiota

Next, we assessed the diversity of rumen microbiota. The range for Good’s coverage was 99.05–99.25%, indicating a good sequencing depth (Supplementary Table S3). The 16S rRNA sequencing showed a total of 1583 OTUs across all samples, with 97% similarity (Figure 3A–F). Rarefaction curves and Shannon curves showed a decreased number of new OTUs and Shannon index as the sequencing number increased (Figure 3G,H). A total of 1435, 1407, 1399, and 1198 OTUs were shared between day 0 and day 90 in the 0, 30, 60, and 300 g/d groups, respectively (Figure 3A–D). A total of 1365 and 1079 OTUs were shared among the four groups on day 0 and day 90, respectively. The alpha diversity analysis shows that there were no significant differences among these groups at day 0 (Figure 3I–M). At day 90, 300 g/d ATC supplementation significantly decreased Sobs, Chao1, ACE, and Shannon indices, and significantly increased the Simpson index when compared with those of other groups (Figure 3I–M; p < 0.05). There were significant differences between the 60 g/d group and the 0 g/d group with regards to alpha diversity indices, except for the Simpson index (Figure 3I–M; p < 0.05). The 30 g/d ATC supplementation only significantly decreased the Sobs index when compared with that of the 0 g/d group (Figure 3I; p < 0.05).
The PCoA was conducted based on the OTU level with ANOSIM analysis to test the statistical differences among the groups (Figure 4). No clear separation was found for rumen bacteria at day 0 (p > 0.05). The results showed distinct clustering according to the amount of ATC at day 90 (p < 0.05).

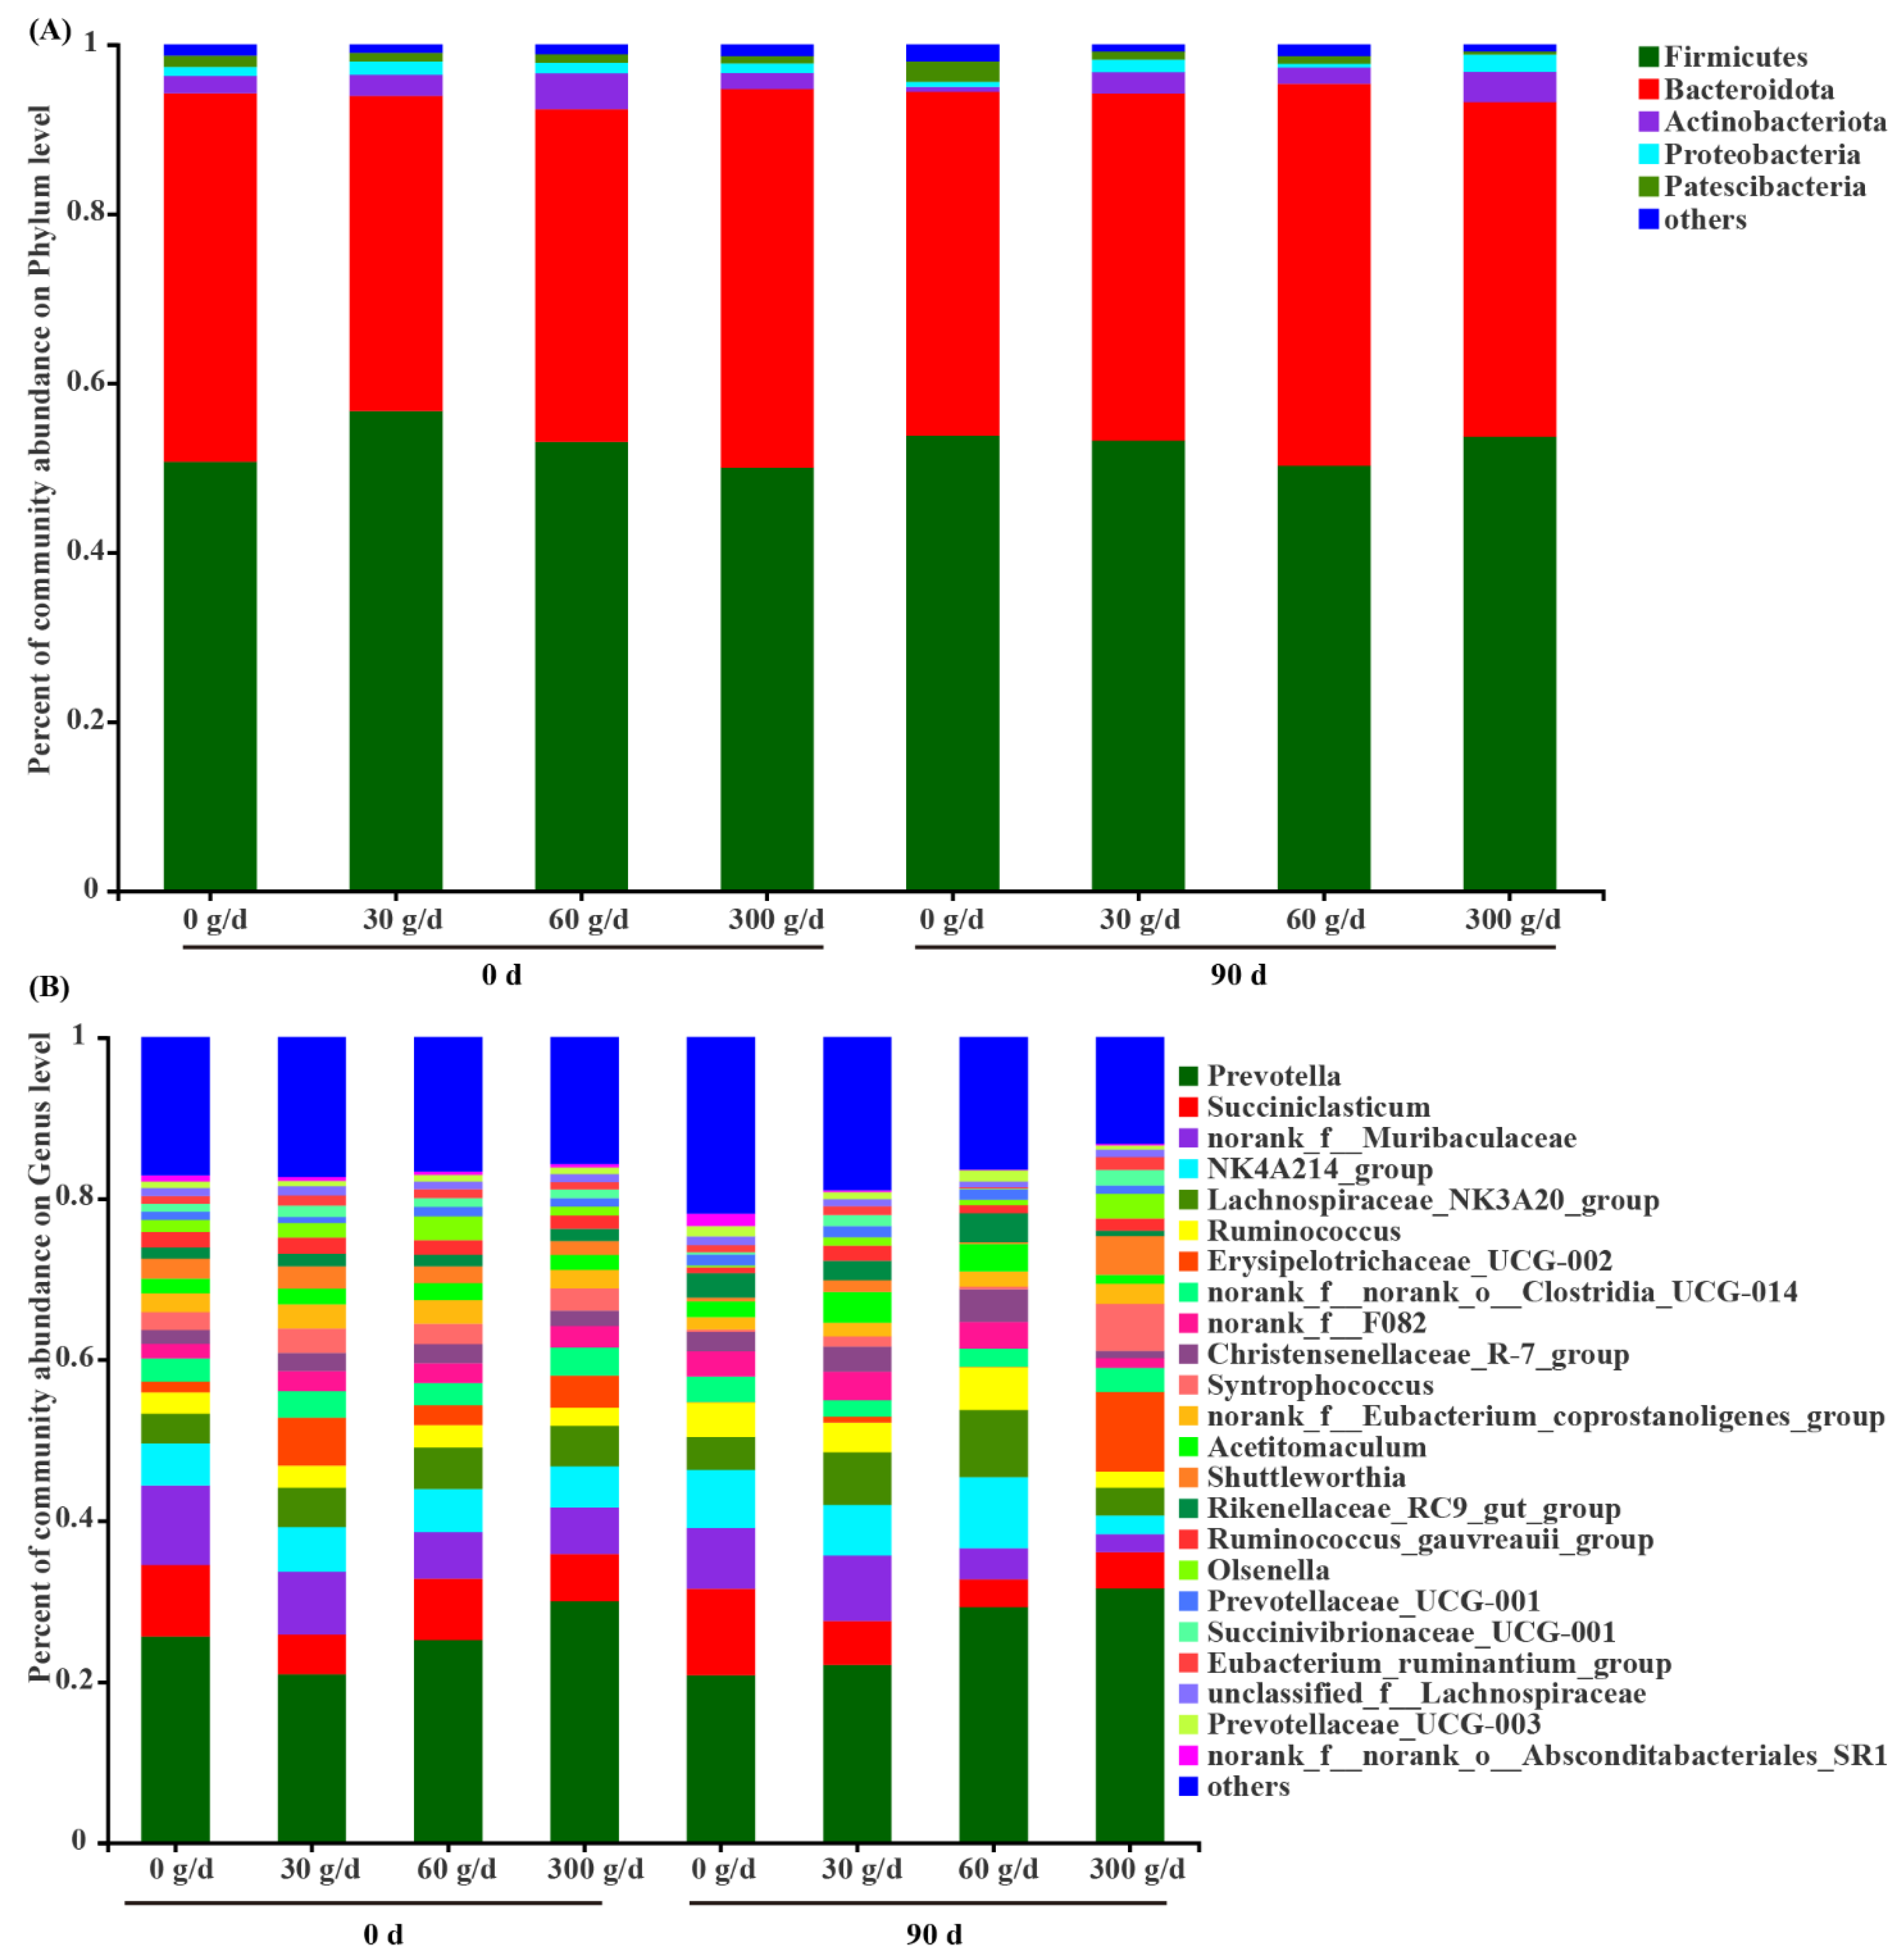
3.6. Microbial Profiles of Rumen Microbiota

Among the phyla detected in the rumen (Figure 5A), Firmicutes (52.65 ± 1.17), Bacteroidota (41.39 ± 1.24), Actinobacteriota (2.41 ± 0.40), Proteobacteria (1.20 ± 0.20), and Patescibacteria (1.11 ± 0.10) were predominant, followed by Spirochaetota (0.57 ± 0.05). The predominant genera (Figure 4B) were Prevotella (25.91 ± 1.94), NK4A214_group (6.18 ± 0.58), Succiniclasticum (6.04 ± 0.84), Lachnospiraceae_NK3A20_group (5.59 ± 0.52), Ruminococcus (3.83 ± 0.39), Erysipelotrichaceae_UCG–002 (2.69 ± 0.95), Christensenellaceae_R–7_group (2.65 ± 0.28), Acetitomaculum (2.58 ± 0.32), Rikenellaceae_RC9_gut_group (2.44 ± 0.27), Syntrophococcus (1.92 ± 0.61), Shuttleworthia (1.73 ± 0.47), Ruminococcus_gauvreauii_group (1.28 ± 0.19), Prevotellaceae_UCG–001 (1.26 ± 0.08), Olsenella (1.25 ± 0.37), and Prevotellaceae_UCG–003 (1.02 ± 0.10). Notably, 14.87% of reads recovered from the rumen could not be confidently assigned at the genus level.

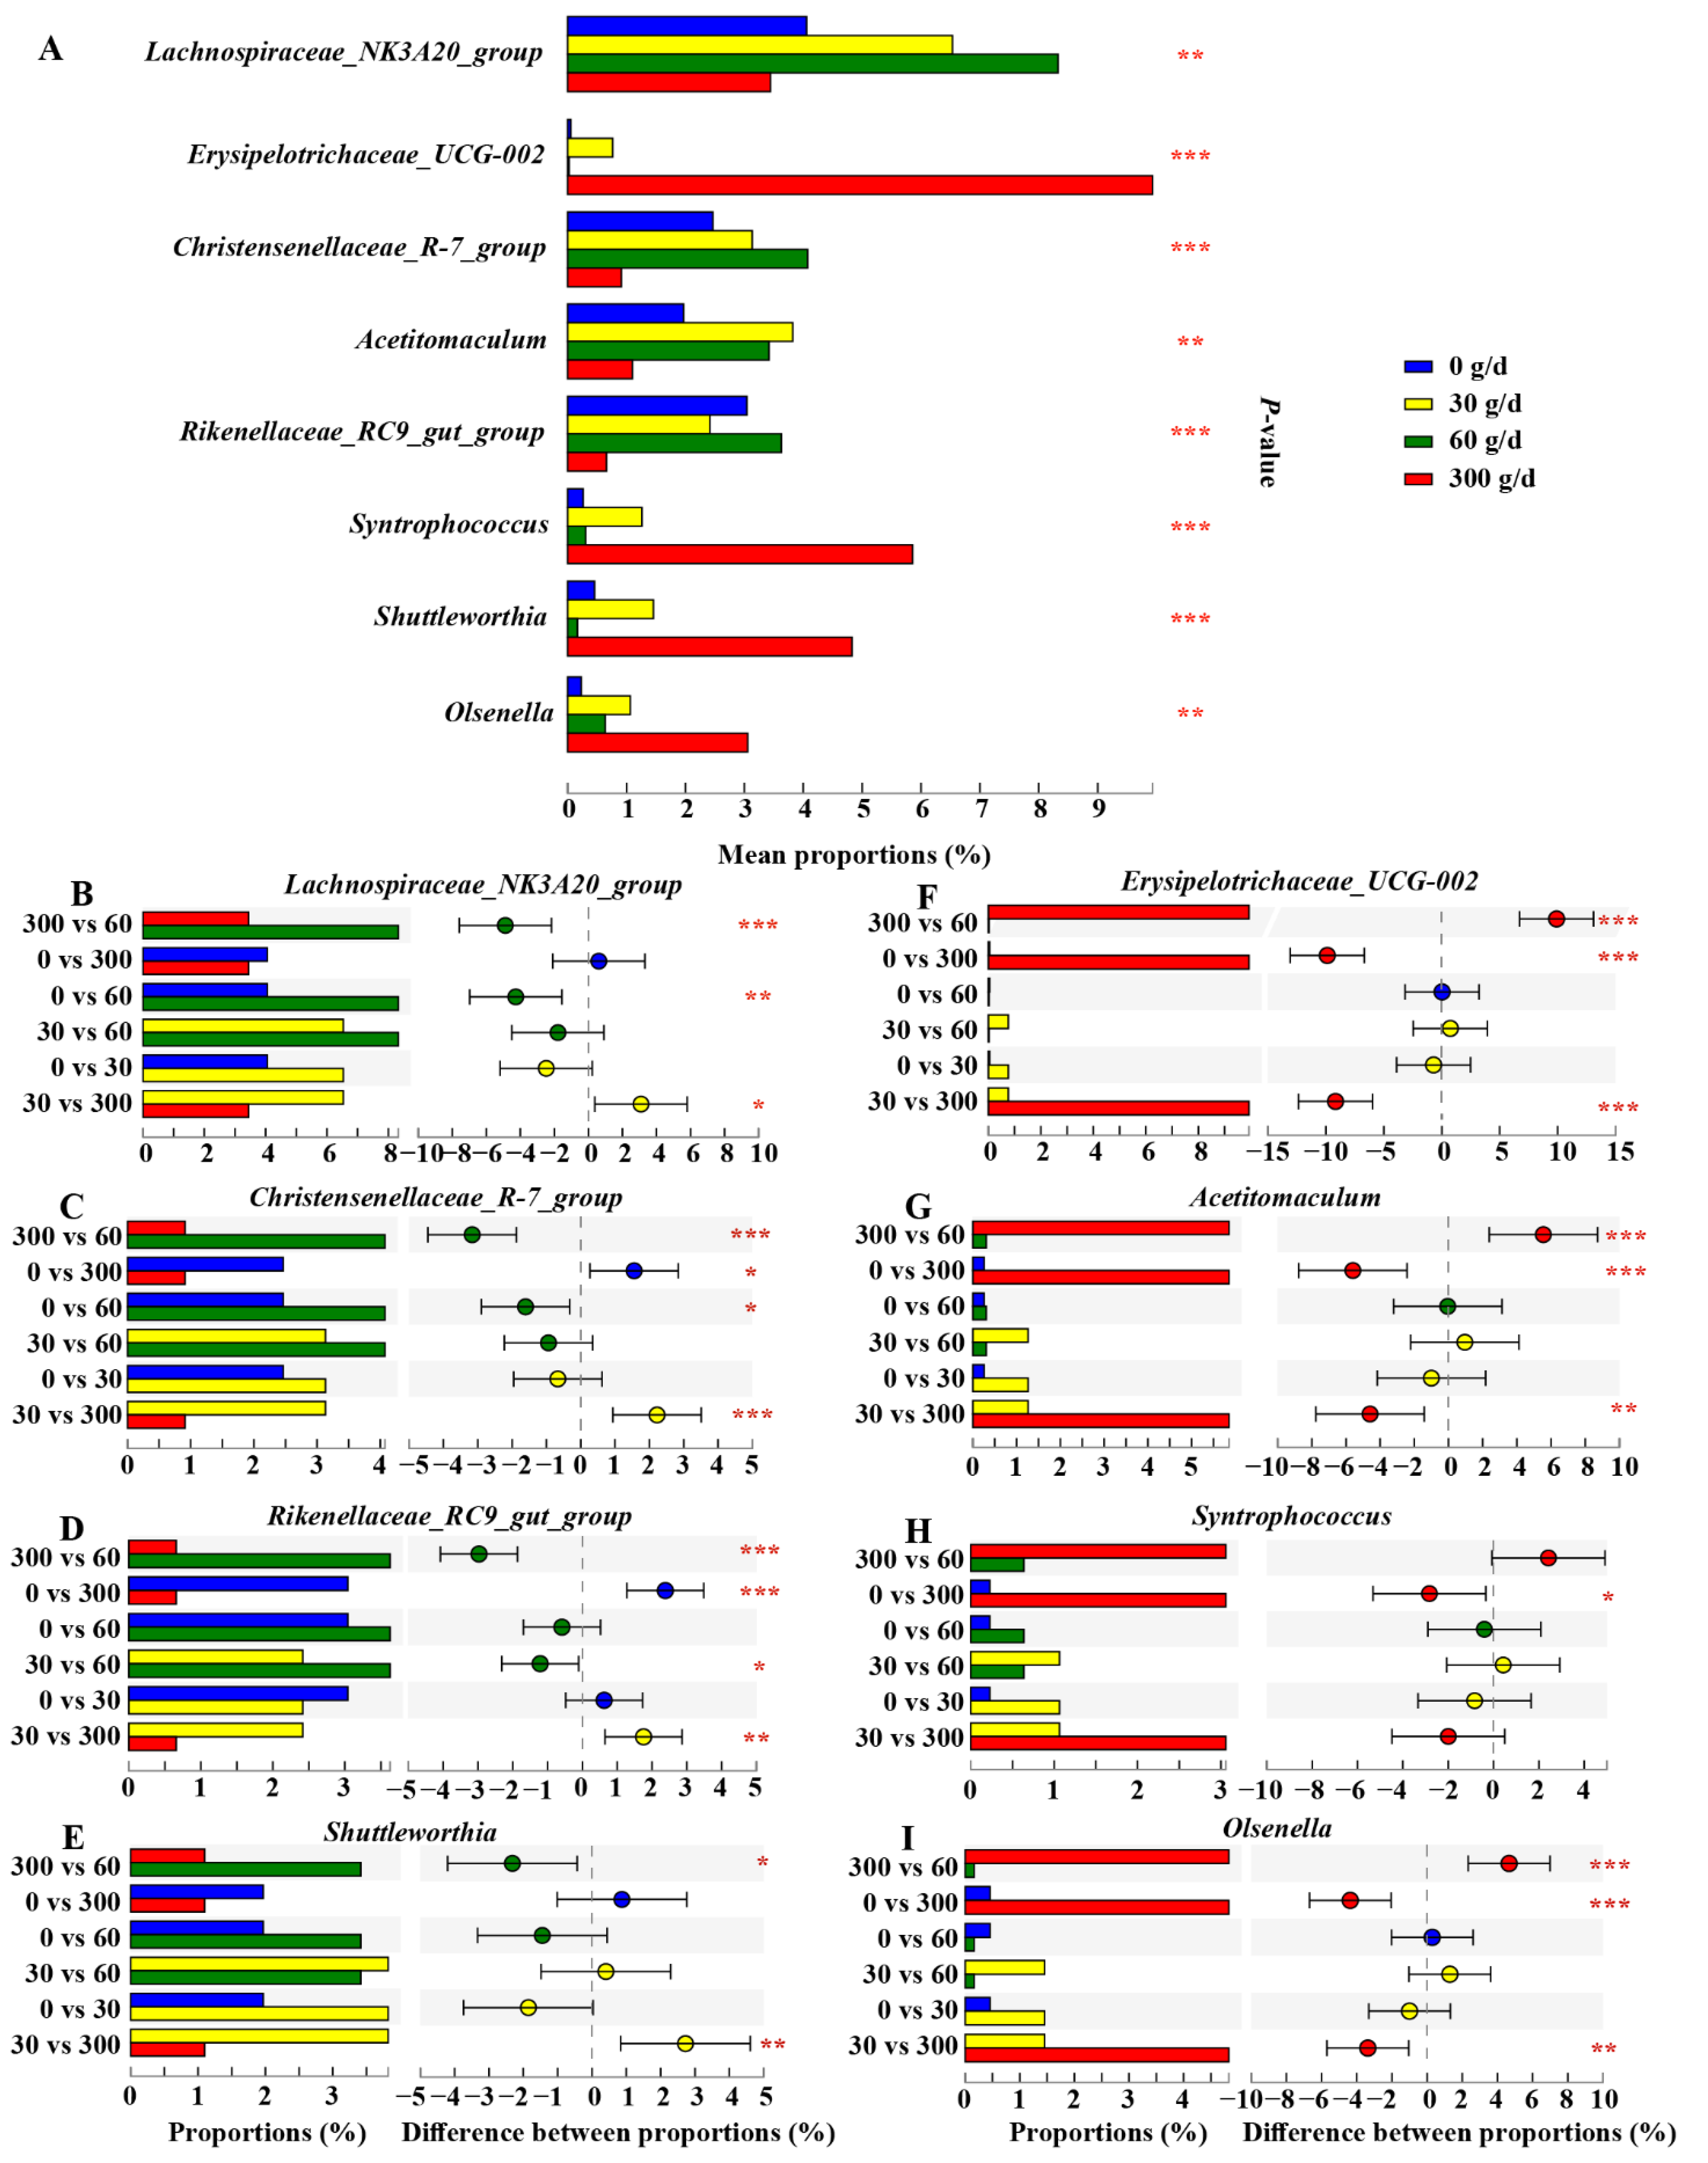
3.7. Changes in the Rumen Bacterial Composition with Acremonium terricola Culture Supplementation

To explore the interactions within genera, we used network analysis based on strong and significant correlations of core genera between the 0 g/d group and ATC-treatment groups. The network, including both 0 g/d and 30 g/d groups (Figure 6A), consisted of eight nodes (core genera) and seven edges (relations). Acetitomaculum and Lachnospiraceae_NK3A20_group had positive correlations, and Syntrophococcus and Ruminococcus_gauvreauii_group also had positive correlations (Figure 6A). Similar to the network mentioned above, the network analysis from 0 g/d and 60 g/d showed that Lachnospiraceae_NK3A20_group had a positive correlation with Acetitomaculum and Christensenellaceae_R–7_group (Figure 6B). This network consisted of 15 nodes and 19 edges, whereas 11 of the 15 nodes belonged to Firmicutes (Figure 6B). The last network of 0 g/d and 300 g/d showed 17 nodes and 33 edges. Acetitomaculum and Christensenellaceae_R–7_group were also found in the networks (Figure 6C). Furthermore, 10 of the 17 nodes belonged to Firmicutes (Figure 6C). The genera Syntrophococcus, Shuttleworthia, Erysipelotrichaceae_UCG–003, and Olsenella were part of the network (Figure 6C).
We then conducted the Kruskal–Wallis H test to filter significantly different core genera (relative abundance ≥ 1%), as shown in Figure 7. The results showed that the relative abundance of Lachnospiraceae_NK3A20_group and Christensenellaceae_R–7_group increased after 60 g/d supplementation compared to that in the 0 g/d group (p > 0.05). The cows fed 300 g/d ATC had a lower relative abundance of Lachnospiraceae_NK3A20_group, Christensenellaceae_R–7_group, Rilkenellaceae_RC9_gut_group, and Shuttleworthia than that of cows fed 30 g/d and 60 g/d (p < 0.05), while there was a higher relative abundance of Erysipelotrichaceae_UCG_002, Acetitomaculum, and Olsenella than that of cows fed 0, 30, and 60 g/d (p > 0.05). The relative abundance of Syntrophococcus was also significantly increased in the 300 g/d group compared to that in the 0 g/d group (p > 0.05).

4. Discussion

ATC is a new type of new feed additive with functional components similar to those of Cordyceps. The positive effects of ATC on livestock production and health have been reported in rats [16], calves [17], and dairy cows [19]. However, their pharmacological and biochemical actions, particularly in applications in ruminants, have not been clearly elucidated. In our study, DMI was not affected, regardless of the ATC dosage. Individual DMI is critical, because insufficient intake represents limited milk synthesis. The unaltered DMI agreed with the results of previous studies showing that ATC or Cordyceps spp. supplementation improved body weight and feed efficiency rather than DMI [17,19,46,47]. However, we noted differences in feeding behavior. Dairy cows treated with ATC had a shorter feeding duration. Although lying time and rumination time were not measured in this study, this result implied that the dairy cows might have a longer time to lie and ruminate after feeding. Increased rumination time and lying time have long been associated with increased milk performance, with the general belief that rumination increases the surface area of feed particles, making them more accessible to microbes [48], and increased lying time is associated with decreased lameness [49]. This is in agreement with the higher milk performance observed in this study.
Consistent with the report of Li et al. [32], we observed that supplemental ATC improved milk yield linearly without influencing DMI, resulting in improved milk efficiency. Although maximum yields of milk and milk efficiency were obtained at 300 g/d ATC, increasing the dosage from 60 g/d to 300 g/d had a limited positive effect on milk performance. Many factors may have contributed to this response. Lactose yield determines the amount of absorbed water in the alveoli, and thus, the volume of the produced milk [50]. Approximately 20% of the circulating blood glucose in dairy cows is converted into lactose [50]. Thus, it is not surprising that ATC supplementation increased milk lactose yield. Moreover, Costa et al. [51] demonstrated that SCC was negatively correlated with milk yield and milk lactose percentage. SCC is a well-established indicator of mammary gland inflammation, which is highly correlated with the presence of a mammary infection. The dairy cows used in our study had less than 150,000 cells/mL SCC among all treatments, which was considered healthy, and had low clinical mastitis incidence [52]. The SCC in milk decreased quadratically in cows fed different levels of supplemental ATC, with the highest decrease in cows fed ATC at 300 g/d. Many studies have demonstrated that cordycepin and galactomannan in Cordyceps or ATC functioned as antioxidants. Li et al. [16] indicated that ATC played anti-inflammatory and antioxidant roles by inhibiting the mitogen-activated protein kinase signaling pathway, and ATC increased the TAC and GSH-Px concentrations in dairy cows when fed up to 30 g/d [32]. Waewaree et al. [53] also indicated that weaned pigs fed a diet supplemented with the spent mushroom compost of Cordyceps militaris displayed greater immunoglobulin secretion, lower inflammation, and a lower pathogenic population. These data indicated that ATC had positive effects on immune and antioxidant functions, which was consistent with the serum variables and SCC changes in our study. We speculated that a possible explanation for our results was that ATC improved the immune function and antioxidant capacity of cows, thereby decreasing SCC and improving milk yield. Moreover, when cows were fed with 60 g/d and 300 g/d of ATC, ECM and FCM yields were greater at 60–90 days than those in 0 g/d and 30 g/d, which might have been due to the adaptation periods of the cows to the ATC.
According to the CP concentration in ATC in our study, 30, 60, and 300 g/d ATC supplementation supplied a total of 7.36, 14.72, and 73.59 g/d CP for cows, respectively. Barros et al. [54] found that a linear response to increasing dietary CP concentration increased MUN concentration and milk protein yield, which was inconsistent with the unchanged MUN and SUN concentrations in our study. This discrepancy is potentially explained by the benefits of balancing more adequate amounts of AA in the diet for N efficiency [55]. SUN and MUN concentrations can be used as indicators of microbial protein synthesis and N efficiency. Some N-NH3 in the rumen, which is not used for microbial protein synthesis and absorbed from the rumen, would be used to produce urea in the liver, which consumes energy and reduces N utilization [56]. Thus, the unchanged N-NH3 concentration in the rumen indicated that extra N intake from ATC supplementation contributed to microbial protein synthesis, rather than N-NH3 production. Many studies have demonstrated that the supply of intestinally available limiting AA is pertinent to milk yield and milk protein yield by decreasing protein mobilization and increasing accretion [57,58]. According to the AA profile of ATC, TAA accounted for 17.27% of ATC (DM basis). Hence, under the current experimental conditions, ATC supplementation improved milk protein yield in a quadratic manner, possibly by reducing urea synthesis to save energy for protein synthesis and improve the balance of available AA in the mammary gland of lactating cows. Further studies on ruminal digestibility and intestinal availability of ingredients (cordycepin, D-mannitol, galactomannan, AA) of ATC will be useful in formulating an accurate ration.
Chen et al. [59] reviewed the toxicity of known metabolites identified from Cordyceps fungi and concluded that different compounds showed antimicrobial activity, and may have the potential to threaten the safety of the poultry industry. However, Ramos et al. [60] revealed that weaned pigs fed 1.5 g/kg of Cordyceps militaris spent mushroom compost showed reduced populations of pathogenic Gram-negative E. coli and increased populations of beneficial Lactobacillus spp. These different observations were partially attributed to the different species (over 1000) of Cordyceps fungi [59]. Hence, we evaluated the effects of ATC on the microbiota responses of dairy cows. No differences in bacterial diversity on day 0, and decreases in bacterial richness and evenness at day 90 after ATC treatment, were identified in this study, indicating that ATC supplementation depressed the microbiota. Furthermore, the common OTUs between day 0 and day 90 among these groups, as well as alpha diversity on day 90, changed with increasing levels of ATC supplementation, suggesting that ATC depressed the microbiota in a dose-dependent manner in dairy cows fed with increasing levels of ATC.
The pH and VFA concentrations are the indicators of rumen function and the ruminal environment. It has been reported that ATC increased CP digestibility of three types of roughage [19], and dairy cows fed ATC had an increased abundance of cellulolytic, proteolytic, and amylolytic bacteria in the rumen, which resulted in enhanced ruminal fermentation with increased VFA production and a decreased pH [32]. Unlike RT–PCR detection of selected bacterial species in a previous study [32], the changes in rumen microbiota in our study were analyzed using 16S gene sequencing. Although the microbiota was depressed, 30, 60, and 300 g/d ATC supplementation resulted in decreased pH and increased TVFA concentration. Reductions in the richness and diversity of microbiota in the rumen have been associated with higher production efficiency in dairy cattle [61]. According to the network of co-occurring genera and the Kruskal–Wallis H test, certain genera showed a strong and significant interaction with each other, and may contribute to increased milk performance. As the most abundant genera in the Firmicutes, Lachnospiraceae_NK3A20_group was characterized by cellulose-decomposing activity and starch hydrolysis, which could produce acetate and formate, among others [62]. The Christensenellaceae_R–7_group, belonging to the family Christensenellaceae, produces acetate and butyrate, with the ability to utilize arabinose, glucose, and mannose [63]. Galactomannan in ATC may support the growth of Christensenellaceae_R–7_group. Acetitomaculum is also an acetogenic genus that utilizes formate, glucose, and hydrogen to reduce methane production [64]. Finally, Olsenella ferments starch and glycogen substrates and produces lactic, acetic, and formic acids [65]. These findings corroborated our results, in which TVFA and acetate concentrations and molar proportions of acetate were increased. In truth, different taxa are associated with feed efficiency and methane emissions. Ramayo-Caldas et al. [66] identified a higher abundance of the Christensenellaceae and Lachnospiraceae families associated with methane production in dairy cows, and McLoughlin et al. [67] found that the genera Olsenella and Acetitomaculum exhibited negative associations with the feed conversion ratio and average daily gain, respectively. Our study was limited by the absence of methane emissions analysis, and further studies could provide more reliable estimates of the microbiota contribution to energy flow. Overall, although 30 g/d and 60 g/d ATC supplementation were linked to lower richness of microbiota, a simpler bacterial composition could result in increased dominance of specific functional components, which led to higher concentrations of products that were relevant to the dairy cows.
The extent of variability in OTU richness and diversity between groups was mostly associated with significant alterations in the microbiota [68,69]. The greatest changes in microbiota were obtained from the 0 g/d group to 300 g/d group, rather than the 30 g/d or 60 g/d groups. As described above, the abundance of Lachnospiraceae_NK3A20_group, Christensenellaceae_R–7_group, and Acetitomaculum was increased in the 30 g/d and 60 g/d groups, but decreased in the 300 g/d group, compared with that in the 0 g/d group, followed by that of Rilkenellaceae_RC9_gut_group. Rilkenellaceae_RC9_gut_group belongs to the family Rilkenellaceae, which are specialized for the tract environment, with anaerobic metabolisms, and the metabolic end-products (acetate, propionate, and succinic acid) are produced from glucose, lactose, and mannose [70]. Conversely, the decrease in the relative abundance of these genera may be attributed to high doses of cordycepin. A previous study found that just 30 g/d of ATC supplementation decreased the relative abundance of Fibrobacter succinogenes in the rumen of dairy cows, which are highly specialized in cellulose degradation [32]. This was similar to the findings of Huang et al. [71], who also observed cordycepin as an efficient killer of Mycobacterium tuberculosis and Mycobacterium bovis. Cordycepin showed antibacterial activity in these studies. Additionally, the interaction between protozoa and bacteria (influenced by ATC) also partly explained the depressed genera. The interaction of ciliates with other microbial groups in the rumen has been previously reported, documenting predation on other rumen microbes, such as bacteria, fungi, and protozoa as well [72]. Li et al. [32] reported that ATC supplementation improved the relative abundance of ciliate protozoa. Hence, we speculated that ATC reshaped the bacterial structure in the rumen of dairy cows by regulating ciliate protozoa. Moreover, we noted that inoculation of defaunated sheep with protozoa further promoted an increase in the abundance of Syntrophococcus [73], which agreed with our results.
The relative abundance of the three genera showed significant enrichment in the 300 g/d group; namely, Erysipelotrichaceae_UCG_002, Syntrophococcus, and Shuttleworthia, rather than in the 30 g/d or 60 g/d groups. Erysipelotrichaceae_UCG_002 belongs to the Erysipelotrichaceae family and has been previously reported to be associated with VFA synthesis and energy generation. Hao et al. [74] indicated that Erysipelotrichaceae_UCG_002, Syntrophococcus, and Shuttleworthia were negatively correlated with rumen pH, and speculated that these genera were involved in fiber digestion. Acetate is the end product of fiber decomposition. Our results indicated that 300 g/d ATC supplementation changed the bacterial composition and enhanced fiber digestion differently compared with the 30 g/d or 60 g/d groups, and resulted in the same improvement of VFA production and modification of pH.

5. Conclusions

Feeding different levels of ATC to lactating dairy cows improved milk yield without affecting DMI, thus increasing milk protein yield. The improvement in milk yield was likely related to improved immune function and antioxidant capacity, which led to decreased SCC, or possibly was due to the improvement in rumen fermentation with a simpler bacterial composition, which favored more effective digestion to produce VFA. Under the current experimental conditions, the optimal dose of ATC supplementation was approximately 60 g/d. The 300 g/d high-dose ATC reshaped the microbiota differently without effects on milk performance when compared with 60 g/d ATC, suggesting that the microbiota responded differently to the individual active components in ATC at increased concentrations. Hence, experiments to test the effects of purified active components (e.g., cordycepin, D-mannitol, galactomannan) on microbiota are needed to provide more information on ATC as a feed additive.

Supplementary Materials

The following are available online at https://www.mdpi.com/article/10.3390/antiox11010175/s1, Table S1: Functional composition of Acremonium terricola culture; Table S2: Ingredients and nutrient composition of the experiment diet; Table S3: Sample information and sequencing statistics.

Author Contributions

Conceptualization, F.K.; methodology, S.W.; software, F.K. and Y.Z.; validation, Y.Z.; resources, Z.C., Y.L. and Z.Z.; writing—original draft preparation, F.K. and Y.Z.; writing—review and editing, F.K. and Y.Z.; visualization, F.K.; supervision, W.W., N.L. and S.L.; project administration, N.L. and S.L.; funding acquisition, N.L. and S.L. All authors have read and agreed to the published version of the manuscript.

Funding

This research was funded by the China Agriculture Research System of Ministry of Finance and Ministry of Agriculture and Rural Affairs (grant number: CARS36).

Institutional Review Board Statement

This study was approved by the experimental animal welfare and animal ethics committee of China Agricultural University (CAU2021009-2, approval on 15 May 2021).

Informed Consent Statement

Not applicable.

Data Availability Statement

The data presented in this study are available in this manuscript. The raw reads were deposited in the NCBI Sequence Read Archive (SRA) database (Accession Numbers: SRR16916794–SRR16916841).

Conflicts of Interest

The companies at which Z.C., Y.L., Z.Z., and N.L. are employed had no role in the design of the study; in the collection, analyses, or interpretation of data; in the writing of the manuscript; or in the decision to publish the results.

References

  1. Fiore, E.; Arfuso, F.; Gianesella, M.; Vecchio, D.; Morgante, M.; Mazzotta, E.; Badon, T.; Rossi, P.; Bedin, S.; Piccione, G. Metabolic and hormonal adaptation in Bubalus bubalis around calving and early lactation. PLoS ONE 2018, 13, e0193803. [Google Scholar] [CrossRef]
  2. Avondo, M.; Pagano, R.I.; Guastella, A.M.; Criscione, A.; Di Gloria, M.; Valenti, B.; Piccione, G.; Pennisi, P. Diet selection and milk production and composition in Girgentana goats with different alpha s1-casein genotype. J. Dairy Res. 2009, 76, 202–209. [Google Scholar] [CrossRef]
  3. Armato, L.; Gianesella, M.; Morgante, M.; Fiore, E.; Rizzo, M.; Giudice, E.; Piccione, G. Rumen volatile fatty acids× dietary supplementation with live yeast and yeast cell wall in feedlot beef cattle. Acta Agric. Scand. A—Anim. Sci. 2016, 66, 119–124. [Google Scholar] [CrossRef]
  4. Monteverde, V.; Congiu, F.; Vazzana, I.; Dara, S.; Di Pietro, S.; Piccione, G. Serum lipid profile modification related to polyunsaturated fatty acid supplementation in thoroughbred horses. J. Appl. Anim. Res. 2017, 45, 615–618. [Google Scholar] [CrossRef]
  5. Đuričić, D.; Ljubić, B.B.; Vince, S.; Turk, R.; Valpotić, H.; Žaja, I.Ž.; Maćešić, N.; Benić, M.; Getz, I.; Samardžija, M. Effects of dietary clinoptilolite supplementation on β-hydroxybutirate serum level and milk fat to protein ratio during early lactation in holstein-friesian cows. Microporous Mesoporous Mater. 2020, 292, 109766. [Google Scholar] [CrossRef]
  6. Folnožić, I.; Samardžija, M.; Đuričić, D.; Vince, S.; Perkov, S.; Jelušić, S.; Valpotić, H.; Ljubić, B.B.; Lojkić, M.; Gračner, D. Effects of in-feed clinoptilolite treatment on serum metabolic and antioxidative biomarkers and acute phase response in dairy cows during pregnancy and early lactation. Res. Vet. Sci. 2019, 127, 57–64. [Google Scholar] [CrossRef] [PubMed]
  7. Folnožić, I.; Đuričić, D.; Žaja, I.Ž.; Vince, S.; Perkov, S.; Turk, R.; Valpotić, H.; Gračner, D.; Maćešić, N.; Lojkić, M. The influence of dietary clinoptilolite on blood serum mineral profile in dairy cows. Vet. Arh. 2019, 89, 447–462. [Google Scholar] [CrossRef]
  8. Đuričić, D.; Sukalić, T.; Marković, F.; Kočila, P.; Žura Žaja, I.; Menčik, S.; Dobranić, T.; Benić, M.; Samardžija, M. Effects of dietary vibroactivated clinoptilolite supplementation on the intramammary microbiological findings in dairy cows. Animals 2020, 10, 202. [Google Scholar] [CrossRef] [PubMed] [Green Version]
  9. Ashraf, S.A.; Elkhalifa, A.E.O.; Siddiqui, A.J.; Patel, M.; Awadelkareem, A.M.; Snoussi, M.; Ashraf, M.S.; Adnan, M.; Hadi, S. Cordycepin for Health and Wellbeing: A Potent Bioactive Metabolite of an Entomopathogenic Cordyceps Medicinal Fungus and Its Nutraceutical and Therapeutic Potential. Molecules 2020, 25, 2735. [Google Scholar] [CrossRef] [PubMed]
  10. Chuang, W.Y.; Hsieh, Y.C.; Lee, T.-T. The Effects of Fungal Feed Additives in Animals: A Review. Animals 2020, 10, 805. [Google Scholar] [CrossRef]
  11. Das, G.; Shin, H.-S.; Leyva-Gómez, G.; Prado-Audelo, M.L.D.; Cortes, H.; Singh, Y.D.; Panda, M.K.; Mishra, A.P.; Nigam, M.; Saklani, S.; et al. Cordyceps spp.: A Review on Its Immune-Stimulatory and Other Biological Potentials. Front. Pharmacol. 2021, 11, 602364. [Google Scholar] [CrossRef] [PubMed]
  12. Li, R.; Tang, N.; Jia, X.; Xu, Y.; Cheng, Y. Antidiabetic activity of galactomannan from Chinese Sesbania cannabina and its correlation of regulating intestinal microbiota. J. Funct. Foods 2021, 83, 104530. [Google Scholar] [CrossRef]
  13. Cho, H.J.; Cho, J.Y.; Rhee, M.H.; Park, H.J. Cordycepin (3′-deoxyadenosine) inhibits human platelet aggregation in a cyclic AMP- and cyclic GMP-dependent manner. Eur. J. Pharmacol. 2007, 558, 43–51. [Google Scholar] [CrossRef]
  14. Kang, N.; Lee, H.-H.; Park, I.; Seo, Y.-S. Development of High Cordycepin-Producing Cordyceps militaris Strains. Mycobiology 2017, 45, 31–38. [Google Scholar] [CrossRef] [Green Version]
  15. Raethong, N.; Wang, H.; Nielsen, J.; Vongsangnak, W. Optimizing cultivation of Cordyceps militaris for fast growth and cordycepin overproduction using rational design of synthetic media. Comput. Struct. Biotechnol. J. 2019, 18, 1–8. [Google Scholar] [CrossRef]
  16. Li, Y.; Jiang, X.; Xu, H.; Lv, J.; Zhang, G.; Dou, X.; Zhang, Y.; Li, X. Acremonium terricola culture plays anti-inflammatory and antioxidant roles by modulating MAPK signaling pathways in rats with lipopolysaccharide-induced mastitis. Food Nutr. Res. 2020, 64. [Google Scholar] [CrossRef]
  17. Li, Y.; Wang, Y.-z.; Ding, X.; Zhang, Y.-g.; Xue, S.-c.; Lin, C.; Xu, W.-b.; Dou, X.-J.; Zhang, L.-Y. Effects of Acremonium terricola culture on growth performance, antioxidant status and immune functions in weaned calves. Livest Sci. 2016, 193, 66–70. [Google Scholar] [CrossRef]
  18. Li, Y.; Sun, Y.-K.; Li, X.; Zhang, G.-N.; Xin, H.-S.; Xu, H.-J.; Zhang, L.-Y.; Li, X.-X.; Zhang, Y.-G. Effects of Acremonium terricola culture on performance, milk composition, rumen fermentation and immune functions in dairy cows. Anim. Feed Sci. Technol. 2018, 240, 40–51. [Google Scholar] [CrossRef]
  19. Li, Y.; Wang, Y.-Z.; Zhang, G.-N.; Zhang, X.-Y.; Lin, C.; Li, X.-X.; Zhang, Y.-G. Effects of Acremonium terricola culture supplementation on apparent digestibility, rumen fermentation, and blood parameters in dairy cows. Anim. Feed Sci. Technol. 2017, 230, 13–22. [Google Scholar] [CrossRef]
  20. Bradford, B.J.; Yuan, K.; Farney, J.K.; Mamedova, L.K.; Carpenter, A.J. Invited review: Inflammation during the transition to lactation: New adventures with an old flame. J. Dairy Sci. 2015, 98, 6631–6650. [Google Scholar] [CrossRef]
  21. Dobos, A.; Fodor, I.; Kreizinger, Z.; Makrai, L.; Dénes, B.; Kiss, I.; Đuričić, D.; Kovačić, M.; Szeredi, L. Infertility in dairy cows–Possible bacterial and viral causes. Vet. Stanica 2022, 53, 35–43. [Google Scholar] [CrossRef]
  22. Đuričić, D.; Vince, S.; Lojkić, M.; Jelušić, S.; Turk, R.; Valpotić, H.; Gračner, D.; Maćešić, N.; Folnožić, I.; Šostar, Z. Effects of dietary clinoptilolite on reproductive performance, serum progesterone and insulin-like growth factor-1 concentrations in dairy cows during pregnancy and lactation. Pol. J. Vet. Sci. 2020, 23, 69–75. [Google Scholar] [CrossRef] [PubMed]
  23. Wang, Y.-Z.; Li, Y.; Xu, Q.-B.; Zhang, X.-Y.; Zhang, G.-N.; Lin, C.; Zhang, Y.-G. Effects of Acremonium terricola culture on production performance, antioxidant status, and blood biochemistry in transition dairy cows. Anim. Feed Sci. Technol. 2019, 256, 114261. [Google Scholar] [CrossRef]
  24. Winarti, S.; Prasetyo, A. The Consumption of Galactomannan Effervescent Drinks made from Coconut Pulp Waste and Colonic Microbiota in Wistar Rats. Int. J. Probiotics Prebiotics 2020, 15, 52–56. [Google Scholar] [CrossRef]
  25. Majeed, M.; Majeed, S.; Nagabhushanam, K.; Arumugam, S.; Natarajan, S.; Beede, K.; Ali, F. Galactomannan from Trigonella foenum-graecum L. seed: Prebiotic application and its fermentation by the probiotic Bacillus coagulans strain MTCC 5856. Food Sci. Nutr. 2018, 6, 666–673. [Google Scholar] [CrossRef] [PubMed]
  26. Newbold, C.J.; McIntosh, F.M.; Wallace, R.J. Changes in the microbial population of a rumen-simulating fermenter in response to yeast culture. Can. J. Anim. Sci. 1998, 78, 241–244. [Google Scholar] [CrossRef]
  27. Malmuthuge, N.; Guan, L.L. Understanding host-microbial interactions in rumen: Searching the best opportunity for microbiota manipulation. J. Anim. Sci. Biotechnol. 2017, 8, 8. [Google Scholar] [CrossRef] [Green Version]
  28. Tuli, H.S.; Sandhu, S.S.; Sharma, A.K. Pharmacological and therapeutic potential of Cordyceps with special reference to Cordycepin. 3 Biotech 2014, 4, 1–12. [Google Scholar] [CrossRef] [Green Version]
  29. Shashidhar, M.G.; Giridhar, P.; Udaya Sankar, K.; Manohar, B. Bioactive principles from Cordyceps sinensis: A potent food supplement—A review. J. Funct. Foods 2013, 5, 1013–1030. [Google Scholar] [CrossRef]
  30. Yu, X.; Mao, Y.; Shergis, J.L.; Coyle, M.E.; Wu, L.; Chen, Y.; Zhang, A.L.; Lin, L.; Xue, C.C.; Xu, Y. Effectiveness and Safety of Oral Cordyceps sinensis on Stable COPD of GOLD Stages 2-3: Systematic Review and Meta-Analysis. Evid. Based Complement. Altern. Med. 2019, 2019, 4903671. [Google Scholar] [CrossRef] [PubMed]
  31. Rodman, L.E.; Farnell, D.R.; Coyne, J.M.; Allan, P.W.; Hill, D.L.; Duncan, K.L.K.; Tomaszewski, J.E.; Smith, A.C.; Page, J.G. Toxicity of Cordycepin in Combination with the Adenosine Deaminase Inhibitor 2′-Deoxycoformycin in Beagle Dogs. Toxicol. Appl. Pharmacol. 1997, 147, 39–45. [Google Scholar] [CrossRef] [PubMed]
  32. Wang, C.; Zhao, F.; Liu, J.; Liu, H. Dipeptide (Methionyl-Methionine) Transport and Its Effect on β-Casein Synthesis in Bovine Mammary Epithelial Cells. Cell. Physiol. Biochem. 2018, 49, 479–488. [Google Scholar] [CrossRef]
  33. National Research Council. Nutrient Requirements of Dairy Cattle; National Academy Press: Washington, DC, USA, 2001. [Google Scholar]
  34. Association of Official Analytical Chemists. Official Methods of Analysis; AOAC International: Gaithersburg, MD, USA, 2000. [Google Scholar]
  35. Van Soest, P.J.; Robertson, J.B.; Lewis, B.A. Methods for dietary fiber, neutral detergent fiber, and nonstarch polysaccharides in relation to animal nutrition. J. Dairy Sci. 1991, 74, 3583–3597. [Google Scholar] [CrossRef]
  36. Chang, C.Y.; Lue, M.Y.; Pan, T.M. Determination of Adenosine, Cordycepin and Ergosterol Contents in Cultivated Antrodia camphorata by HPLC Method. J. Food Drug Anal. 2005, 13, 338–342. [Google Scholar] [CrossRef]
  37. Kong, F.; Lu, N.; Liu, Y.; Zhang, S.; Li, S. Aspergillus oryzae and Aspergillus niger Co-Cultivation Extract Affects In Vitro Degradation, Fermentation Characteristics, and Bacterial Composition in a Diet-Specific Manner. Animals 2021, 11, 1248. [Google Scholar] [CrossRef] [PubMed]
  38. Kong, F.; Gao, Y.; Tang, M.; Fu, T.; Diao, Q.; Bi, Y.; Tu, Y. Effects of dietary rumen–protected Lys levels on rumen fermentation and bacterial community composition in Holstein heifers. Appl. Microbiol. Biotechnol. 2020, 104, 6623–6634. [Google Scholar] [CrossRef] [PubMed]
  39. Chen, S.; Zhou, Y.; Chen, Y.; Gu, J. fastp: An ultra-fast all-in-one FASTQ preprocessor. Bioinformatics 2018, 34, i884–i890. [Google Scholar] [CrossRef]
  40. Magoč, T.; Salzberg, S.L. FLASH: Fast length adjustment of short reads to improve genome assemblies. Bioinformatics 2011, 27, 2957–2963. [Google Scholar] [CrossRef]
  41. Huang, S.; Ji, S.; Wang, F.; Huang, J.; Alugongo, G.M.; Li, S. Correction to: Dynamic changes of the fecal bacterial community in dairy cows during early lactation. AMB Express 2021, 11, 40. [Google Scholar] [CrossRef]
  42. Edgar, R.C. UPARSE: Highly accurate OTU sequences from microbial amplicon reads. Nat. Methods 2013, 10, 996–998. [Google Scholar] [CrossRef]
  43. Wang, Q.; Garrity, G.M.; Tiedje, J.M.; Cole, J.R. Naive Bayesian classifier for rapid assignment of rRNA sequences into the new bacterial taxonomy. Appl. Environ. Microbiol. 2007, 73, 5261–5267. [Google Scholar] [CrossRef] [Green Version]
  44. Pruesse, E.; Quast, C.; Knittel, K.; Fuchs, B.M.; Ludwig, W.; Peplies, J.; Glöckner, F.O. SILVA: A comprehensive online resource for quality checked and aligned ribosomal RNA sequence data compatible with ARB. Nucleic Acids Res. 2007, 35, 7188–7196. [Google Scholar] [CrossRef] [PubMed] [Green Version]
  45. Caporaso, J.G.; Kuczynski, J.; Stombaugh, J.; Bittinger, K.; Bushman, F.D.; Costello, E.K.; Fierer, N.; Peña, A.G.; Goodrich, J.K.; Gordon, J.I.; et al. QIIME allows analysis of high-throughput community sequencing data. Nat. Methods 2010, 7, 335–336. [Google Scholar] [CrossRef] [PubMed] [Green Version]
  46. Boontiam, W.; Wachirapakorn, C.; Wattanachai, S. Growth performance and hematological changes in growing pigs treated with Cordyceps militaris spent mushroom substrate. Vet. World 2019, 13, 768–773. [Google Scholar] [CrossRef] [Green Version]
  47. Chanjula, P.; Cherdthong, A. Effects of spent mushroom Cordyceps militaris supplementation on apparent digestibility, rumen fermentation, and blood metabolite parameters of goats. J. Anim. Sci. 2018, 96, 1150–1158. [Google Scholar] [CrossRef] [Green Version]
  48. Kaufman, E.I.; Asselstine, V.H.; LeBlanc, S.J.; Duffield, T.F.; DeVries, T.J. Association of rumination time and health status with milk yield and composition in early-lactation dairy cows. J. Dairy Sci. 2018, 101, 462–471. [Google Scholar] [CrossRef] [PubMed]
  49. Galindo, F.; Broom, D.M. The relationships between social behaviour of dairy cows and the occurrence of lameness in three herds. Res. Vet. Sci. 2000, 69, 75–79. [Google Scholar] [CrossRef]
  50. Costa, A.; Lopez-Villalobos, N.; Sneddon, N.W.; Shalloo, L.; Franzoi, M.; De Marchi, M.; Penasa, M. Invited review: Milk lactose—Current status and future challenges in dairy cattle. J. Dairy Sci. 2019, 102, 5883–5898. [Google Scholar] [CrossRef]
  51. Costa, A.; Neglia, G.; Campanile, G.; De Marchi, M. Milk somatic cell count and its relationship with milk yield and quality traits in Italian water buffaloes. J. Dairy Sci. 2020, 103, 5485–5494. [Google Scholar] [CrossRef]
  52. Rainard, P.; Foucras, G.; Boichard, D.; Rupp, R. Invited review: Low milk somatic cell count and susceptibility to mastitis. J. Dairy Sci. 2018, 101, 6703–6714. [Google Scholar] [CrossRef] [Green Version]
  53. Boontiam, W.; Wachirapakorn, C.; Phaengphairee, P.; Wattanachai, S. Effect of Spent Mushroom (Cordyceps militaris) on Growth Performance, Immunity, and Intestinal Microflora in Weaning Pigs. Animals 2020, 10, 2360. [Google Scholar] [CrossRef] [PubMed]
  54. Barros, T.; Quaassdorff, M.A.; Aguerre, M.J.; Colmenero, J.J.O.; Bertics, S.J.; Crump, P.M.; Wattiaux, M.A. Effects of dietary crude protein concentration on late-lactation dairy cow performance and indicators of nitrogen utilization. J. Dairy Sci. 2017, 100, 5434–5448. [Google Scholar] [CrossRef]
  55. Schwab, C.G.; Broderick, G.A. A 100-Year Review: Protein and amino acid nutrition in dairy cows. J. Dairy Sci. 2017, 100, 10094–10112. [Google Scholar] [CrossRef] [Green Version]
  56. Moharrery, A. Investigation of different levels of RDP in the rations of lactating cows and their effects on MUN, BUN and urinary N excretion. Ital. J. Anim. Sci. 2010, 3, 157–165. [Google Scholar] [CrossRef] [Green Version]
  57. Morris, D.L.; Kononoff, P.J. Effects of rumen-protected lysine and histidine on milk production and energy and nitrogen utilization in diets containing hydrolyzed feather meal fed to lactating Jersey cows. J. Dairy Sci. 2020, 103, 7110–7123. [Google Scholar] [CrossRef] [PubMed]
  58. Fehlberg, L.K.; Guadagnin, A.R.; Thomas, B.L.; Sugimoto, Y.; Shinzato, I.; Cardoso, F.C. Feeding rumen-protected lysine prepartum increases energy-corrected milk and milk component yields in Holstein cows during early lactation. J. Dairy Sci. 2020, 103, 11386–11400. [Google Scholar] [CrossRef]
  59. Chen, B.; Sun, Y.; Luo, F.; Wang, C. Bioactive Metabolites and Potential Mycotoxins Produced by Cordyceps Fungi: A Review of Safety. Toxins 2020, 12, 410. [Google Scholar] [CrossRef] [PubMed]
  60. Ramos, S.C.; Jeong, C.D.; Mamuad, L.L.; Kim, S.H.; Kang, S.H.; Kim, E.T.; Cho, Y.I.; Lee, S.S.; Lee, S.S. Diet Transition from High-Forage to High-Concentrate Alters Rumen Bacterial Community Composition, Epithelial Transcriptomes and Ruminal Fermentation Parameters in Dairy Cows. Animals 2021, 11, 838. [Google Scholar] [CrossRef]
  61. Shabat, S.K.; Sasson, G.; Doron-Faigenboim, A.; Durman, T.; Yaacoby, S.; Berg Miller, M.E.; White, B.A.; Shterzer, N.; Mizrahi, I. Specific microbiome-dependent mechanisms underlie the energy harvest efficiency of ruminants. ISME J. 2016, 10, 2958–2972. [Google Scholar] [CrossRef] [PubMed] [Green Version]
  62. Russell, J.B.; Rychlik, J.L. Factors that alter rumen microbial ecology. Science 2001, 292, 1119–1122. [Google Scholar] [CrossRef]
  63. Waters, J.L.; Ley, R.E. The human gut bacteria Christensenellaceae are widespread, heritable, and associated with health. BMC Biol. 2019, 17, 83. [Google Scholar] [CrossRef] [PubMed]
  64. Greening, R.C.; Leedle, J.A. Enrichment and isolation of Acetitomaculum ruminis, gen. nov., sp. nov.: Acetogenic bacteria from the bovine rumen. Arch. Microbiol. 1989, 151, 399–406. [Google Scholar] [CrossRef]
  65. Göker, M.; Held, B.; Lucas, S.; Nolan, M.; Yasawong, M.; Glavina Del Rio, T.; Tice, H.; Cheng, J.F.; Bruce, D.; Detter, J.C.; et al. Complete genome sequence of Olsenella uli type strain (VPI D76D-27C). Stand. Genom. Sci. 2010, 3, 76–84. [Google Scholar] [CrossRef] [PubMed] [Green Version]
  66. Ramayo-Caldas, Y.; Zingaretti, L.; Popova, M.; Estellé, J.; Bernard, A.; Pons, N.; Bellot, P.; Mach, N.; Rau, A.; Roume, H.; et al. Identification of rumen microbial biomarkers linked to methane emission in Holstein dairy cows. J. Anim. Breed. Genet. 2020, 137, 49–59. [Google Scholar] [CrossRef] [PubMed] [Green Version]
  67. McLoughlin, S.; Spillane, C.; Claffey, N.; Smith, P.E.; O’Rourke, T.; Diskin, M.G.; Waters, S.M. Rumen Microbiome Composition Is Altered in Sheep Divergent in Feed Efficiency. Front. Microbiol. 2020, 11, 1981. [Google Scholar] [CrossRef]
  68. Casanova-Martí, À.; Serrano, J.; Portune, K.J.; Sanz, Y.; Blay, M.T.; Terra, X.; Ardévol, A.; Pinent, M. Grape seed proanthocyanidins influence gut microbiota and enteroendocrine secretions in female rats. Food Funct. 2018, 9, 1672–1682. [Google Scholar] [CrossRef] [Green Version]
  69. Dong, Y.; Cheng, H.; Liu, Y.; Xue, M.; Liang, H. Red yeast rice ameliorates high-fat diet-induced atherosclerosis in Apoe−/− mice in association with improved inflammation and altered gut microbiota composition. Food Funct. 2019, 10, 3880–3889. [Google Scholar] [CrossRef] [Green Version]
  70. Graf, J. The Family Rikenellaceae. In The Prokaryotes: Other Major Lineages of Bacteria and The Archaea; Rosenberg, E., DeLong, E.F., Lory, S., Stackebrandt, E., Thompson, F., Eds.; Springer: Berlin/Heidelberg, Germany, 2014; pp. 857–859. [Google Scholar] [CrossRef]
  71. Huang, F.; Li, W.; Xu, H.; Qin, H.; He, Z.G. Cordycepin kills Mycobacterium tuberculosis through hijacking the bacterial adenosine kinase. PLoS ONE 2019, 14, e0218449. [Google Scholar] [CrossRef] [Green Version]
  72. Williams, A.G.; Coleman, G.S. The rumen protozoa. In The Rumen Microbial Ecosystem; Hobson, P.N., Stewart, C.S., Eds.; Springer: Dordrecht, The Netherlands, 1997; pp. 73–139. [Google Scholar]
  73. De la Fuente, G.; Belanche, A.; Girwood, S.E.; Pinloche, E.; Wilkinson, T.; Newbold, C.J. Pros and cons of ion-torrent next generation sequencing versus terminal restriction fragment length polymorphism T-RFLP for studying the rumen bacterial community. PLoS ONE 2014, 9, e101435. [Google Scholar] [CrossRef] [Green Version]
  74. Hao, Y.; Guo, C.; Gong, Y.; Sun, X.; Wang, W.; Wang, Y.; Yang, H.; Cao, Z.; Li, S. Rumen Fermentation, Digestive Enzyme Activity, and Bacteria Composition between Pre-Weaning and Post-Weaning Dairy Calves. Animals 2021, 11, 2527. [Google Scholar] [CrossRef]
Figure 1. Effects of different amounts of Acremonium terricola culture on serum variables in lactating dairy cows. The serum variables were divided into three groups, including antioxidant capacity (AE), immune function (FH), and metabolites (IK). Serum variables of dairy cows fed a diet with supplementation of ATC at 0, 30, 60, or 300 g/d were used. The effects included group effect and the interaction effect of group and time, as well as linear and quadratic effects. Different lowercase letters denote significant differences among treatments (p < 0.05). ATC, Acremonium terricola culture; CAT, catalase; MDA, malonaldehyde; TAC, total oxidative capacity; GSH–Px, glutathione peroxidase; SOD, superoxide dismutase; IgA, immunoglobulin A; IgG, immunoglobulin G; IgM, immunoglobulin M; SUN, serum urea nitrogen; TAA, total amino acids. Mean ± SEM. n = 15.
Antioxidants 11 00175 g001
Figure 2. Effects of different amounts of Acremonium terricola culture on rumen pH (A), NH3-N (B), and volatile fatty acids (CK) in lactating dairy cows. The VFA are expressed as concentration (CH) and molar proportion (IK). The effects included group effect and the interaction effect of group and time, as well as linear and quadratic effects. Different lowercase letters denote significant differences among treatments (p < 0.05). ATC, Acremonium terricola culture; TVFA, total volatile fatty acid; BVFA, branched volatile fatty acid; Mean ± SEM. n = 15.
Antioxidants 11 00175 g002
Figure 3. OTU number and alpha diversity responses of the ruminal microbiota to Acremonium terricola culture supplementation in lactating dairy cows. (AF) Venn diagrams showing the number of OTUs in the 0 g/d (A), 30 g/d (B), 60 g/d (C), and 300 g/d (D) groups at day 0 (E) and day 90 (F); (G) Shannon curves; (H) rarefaction curves; (IM) alpha diversity. Different lowercase letters denote significant differences among treatments (Figure 3I–M, p < 0.05). OTU, operational taxonomic unit. Mean ± SEM. n = 6.
Antioxidants 11 00175 g003
Figure 4. Bate diversity responses of the rumen microbiota to Acremonium terricola culture supplementation in lactating dairy cows on day 0 (A) and day 90 (B). Rumen microbiota of dairy cows fed a diet with supplementation of ATC at 0, 30, 60, or 300 g/d were used. Analysis of similarities (ANOSIM) using Bray–Curtis distance matrices was used to test the statistical differences. n = 6.
Antioxidants 11 00175 g004
Figure 5. Composition of the rumen microbiota at the phylum level (A) and genus level (B) before (day 0) and after (day 90) of Acremonium terricola culture supplementation in lactating dairy cows. The relative abundance of taxa ≤ 0.01% belonged to others. n = 6.
Antioxidants 11 00175 g005
Figure 6. The network of co-occurring genera within the rumen microbiota supplied with different amounts of Acremonium terricola culture: (A) 0 and 30 g/d; (B) 0 and 60 g/d; (C) 0 and 300 g/d. The figure shows genera based on Spearman’s correlation. The nodes represent the core genera, and the size of each node is proportional to the degree. The edges stand for strong (Spearman’s correlation coefficient r > 0.7 or r < −0.7) and significant (p < 0.05) correlations between core genera. The nodes are colored based on phylum. Red and blue lines represent positive and negative correlations between two nodes, respectively.
Antioxidants 11 00175 g006
Figure 7. Effects of different levels of Acremonium terricola culture supplementation on the relative abundance of ruminal core genera (≥1%) in lactating dairy cows. The figure only shows the significantly different genera. The Kruskal–Wallis H test was used. *, 0.01 < p ≤ 0.05; **, 0.001 < p ≤ 0.01; ***, p ≤ 0.001. n = 6.
Antioxidants 11 00175 g007
Table 1. Effect of different amounts of Acremonium terricola culture on feeding behavior in lactating dairy cows.
ItemsATC Supplementation, g/d per HeadSEMp-Value
03060300GG × TLQ
DMI, kg/d
Average21.7021.9521.9121.870.1030.360.560.710.66
0–30 d21.9322.0122.1621.840.1820.17
30–60 d21.3821.5221.5921.680.1700.21
60–90 d21.81 b22.32 a21.97 ab22.10 ab0.1590.04
Feeding frequency, bouts/d
Average20.3320.7121.6521.150.5400.270.320.350.90
0–30 d19.85 b21.28 ab22.38 a20.28 ab0.8840.04
30–60 d19.9119.4519.8621.470.8260.09
60–90 d21.2421.4122.7021.700.7690.22
Feeding duration, h/d
Average4.40 a3.67 c3.57 c3.97 b0.038<0.010.01<0.01<0.01
0–30 d4.13 a3.56 b3.30 c3.60 b0.068<0.01
30–60 d4.48 a3.64 c3.53 c3.96 b0.064<0.01
60–90 d4.61 a3.80 c3.87 c4.34 b0.059<0.01
DMI/Feeding frequency, kg/bouts
Average1.081.071.031.040.0260.370.320.500.83
0–30 d1.131.051.021.100.0430.06
30–60 d1.081.121.091.010.0400.06
60–90 d1.031.050.971.020.0370.16
Feeding duration/Feeding frequency, min/bouts
Average13.07 a10.74 b10.01 c11.35 b0.261<0.010.45<0.010.20
0–30 d12.70 a10.17 bc9.13 c10.90 b0.464<0.01
30–60 d13.52 a11.32 b10.68 b11.12 b0.434<0.01
60–90 d12.99 a10.73 b10.24 b12.04 a0.404<0.01
DMI/Feeding duration, kg/h
Average4.94 d6.01 b6.18 a5.55 c0.066<0.010.01<0.010.04
0–30 d5.37 c6.20 b6.73 a6.08 b0.107<0.01
30–60 d4.75 c5.93 a6.12 a5.48 b0.100<0.01
60–90 d4.71 c5.89 a5.70 a5.10 b0.093<0.01
ATC, Acremonium terricola culture; SEM, standard error; DMI, dry-matter intake. The effects included group effect (G) and the interaction effect of group and time (G × T), as well as linear (L) and quadratic effects (Q). Different lowercase letters in the same row show significant differences (p < 0.05). n = 15.
Table 2. Effects of different amounts of Acremonium terricola culture on milk performance in lactating dairy cows.
ItemsATC Supplementation, g/d per HeadSEMp-Value
03060300GG × TLQ
Milk yield, kg/d
Average27.33 c28.98 b30.15 a30.35 a0.376<0.010.98<0.01<0.01
0–30 d28.56 b29.75 ab30.87 a31.00 a0.9180.01
30–60 d27.53 b29.28 ab30.38 a30.57 a0.896<0.01
60–90 d25.90 b27.90 a29.20 a29.49 a0.882<0.01
FCM yield, kg/d
Average32.73 b34.95 ab36.73 a36.95 a0.947<0.011.00<0.010.04
0–30 d33.9336.3437.6437.991.5520.05
30–60 d33.3034.9837.2236.951.4510.06
60–90 d30.95 b33.52 ab35.32 a35.92 a1.3500.02
ECM, kg/d
Average31.36 c33.41 b34.88 a35.18 a0.623<0.010.98<0.01<0.01
0–30 d33.2634.8935.9636.131.1070.05
30–60 d31.38 b33.54 ab35.46 a35.30 a1.0350.01
60–90 d29.44 b31.80 ab33.24 a34.10 a0.963<0.01
Milk yield/DMI
Average1.26 c1.32 b1.38 ab1.39 a0.018<0.010.99<0.010.09
0–30 d1.31 b1.35 ab1.40 a1.42 a0.0210.01
30–60 d1.29 b1.36 ab1.41 a1.41 a0.0200.01
60–90 d1.19 b1.26 ab1.33 a1.34 a0.017<0.01
FCM/DMI
Average1.51 b1.60 ab1.68 a1.69 a0.0370.011.000.020.17
0–30 d1.551.651.701.740.0730.06
30–60 d1.561.631.731.700.0680.08
60–90 d1.421.511.611.630.0630.06
ECM/DMI
Average1.45 b1.53 b1.60 a1.61 a0.032<0.010.98<0.010.07
0–30 d1.521.591.631.660.0530.05
30–60 d1.52 b1.56 ab1.65 a1.66 a0.0500.01
60–90 d1.35 b1.43 ab1.52 a1.55 a0.0460.01
ATC, Acremonium terricola culture; SEM, standard error; ECM, energy-corrected milk; FCM, fat-corrected milk; DMI, dry-matter intake; Milk yield/DMI, kg of milk yield/kg of DMI; FCM/DMI, kg of FCM/kg of DMI; ECM/DMI, kg of ECM/kg of DMI; ECM = 0.3246 × milk yield + 13.86 × milk fat yield + 7.04 × milk protein yield; FCM = milk yield × 0.432 + milk fat yield × 16. The effects included group effect (G) and the interaction effect of group and time (G × T), as well as linear (L) and quadratic effects (Q). Different lowercase letters in the same row show significant differences (p < 0.05). n = 15.
Table 3. Effects of different amounts of Acremonium terricola culture on milk composition in lactating dairy cows.
ItemsATC Supplementation, g/d per HeadSEMp-Value
03060300GG × TLQ
Milk protein, %
Average3.813.833.823.830.0640.990.800.480.37
0–30 d3.983.933.883.860.1050.37
30–60 d3.713.813.883.830.0980.22
60–90 d3.733.743.703.800.0910.46
Milk protein yield, kg/d
Average1.04 b1.11 a1.15 a1.16 a0.026<0.010.85<0.01<0.01
0–30 d1.141.171.201.200.0420.30
30–60 d1.02 b1.12 ab1.18 a1.17 a0.0390.01
60–90 d0.97 b1.04 ab1.08 a1.13 a0.0370.01
Milk fat, %
Average4.734.774.834.840.1520.941.000.880.99
0–30 d4.684.874.854.910.2700.51
30–60 d4.794.704.864.770.2530.65
60–90 d4.714.744.794.850.2350.69
Milk fat yield, kg/d
Average1.29 b1.38 ab1.46 a1.47 a0.0530.041.000.030.15
0–30 d1.331.451.501.520.0870.11
30–60 d1.321.381.481.460.0810.16
60–90 d1.221.321.401.430.0760.07
Milk lactose, %
Average5.085.095.045.060.0340.730.950.180.45
0–30 d5.155.125.085.100.0600.41
30–60 d4.995.055.025.030.0560.48
60–90 d5.095.095.015.040.0520.29
Milk lactose yield, kg/d
Average1.39 c1.48 b1.52 ab1.54 a0.02<0.01<0.01<0.010.04
0–30 d1.47 b1.52 ab1.57 a1.58 a0.030.02
30–60 d1.38 b1.48 a1.52 a1.54 a0.03<0.01
60–90 d1.32 b1.42 a1.46 a1.49 a0.03<0.01
Milk urea nitrogen, mg/dL
Average17.2316.7017.1318.180.7150.490.950.840.74
0–30 d14.7614.2615.3317.071.1050.10
30–60 d16.3215.2915.7016.101.2700.56
60–90 d20.6120.5620.3721.381.1050.54
SCC, ×1000/mL
Average68.06 a52.23 b47.90 bc43.68 c2.705<0.010.42<0.01<0.01
0–30 d67.23 a58.60 ab52.98 bc41.85 c4.809<0.01
30–60 d70.73 a44.73 b44.64 b45.25 b4.496<0.01
60–90 d66.23 a53.35 ab46.09 b43.96 b4.182<0.01
ATC, Acremonium terricola culture; SEM, standard error; SCC, somatic cell count. The effects included group effect (G) and the interaction effect of group and time (G × T), as well as linear (L) and quadratic effects (Q). Different lowercase letters in the same row show significant differences (p < 0.05). n = 15.
Publisher’s Note: MDPI stays neutral with regard to jurisdictional claims in published maps and institutional affiliations.

