Article

Role of Oxidative Stress in the Senescence Pattern of Auditory Cells in Age-Related Hearing Loss

by
Luz del Mar Rivas-Chacón
1,
Sofía Martínez-Rodríguez
2,
Raquel Madrid-García
2,
Joaquín Yanes-Díaz
3,
Juan Ignacio Riestra-Ayora
2,3,
Ricardo Sanz-Fernández
3 and
Carolina Sánchez-Rodríguez
2,*
1
Department Clinical Analysis, Hospital Universitario de Getafe, Carretera de Toledo, km 12.500, Getafe, 28905 Madrid, Spain
2
Department of Medicine, Faculty of Biomedical and Health Sciences, Universidad Europea de Madrid, Villaviciosa de Odón, 28670 Madrid, Spain
3
Department Otolaryngology, Hospital Universitario de Getafe, Carretera de Toledo, km 12.500, Getafe, 28905 Madrid, Spain
*
Author to whom correspondence should be addressed.
Antioxidants 2021, 10(9), 1497; https://doi.org/10.3390/antiox10091497
Submission received: 12 August 2021 / Revised: 9 September 2021 / Accepted: 18 September 2021 / Published: 21 September 2021

Abstract

:
Age-related hearing loss (ARHL) is an increasing and gradual sensorineural hearing dysfunction. Oxidative stress is an essential factor in developing ARHL; additionally, premature senescence of auditory cells induced by oxidative stress can produce hearing loss. Hydrogen peroxide (H2O2) represents a method commonly used to generate cellular senescence in vitro. The objective of the present paper is to study H2O2-induced senescence patterns in three auditory cell lines (House Ear Institute-Organ of Corti 1, HEI-OC1; organ of Corti, OC-k3, and stria vascularis, SV-k1 cells) to elucidate the intrinsic mechanisms responsible for ARHL. The auditory cells were exposed to H2O2 at different concentrations and times. The results obtained show different responses of the hearing cells concerning cell growth, β-galactosidase activity, morphological changes, mitochondrial activation, levels of oxidative stress, and other markers of cell damage (Forkhead box O3a, FoxO3a, and 8-oxoguanine, 8-oxoG). Comparison between the responses of these auditory cells to H2O2 is a helpful method to evaluate the molecular mechanisms responsible for these auditory cells’ senescence. Furthermore, this in vitro model could help develop anti-senescent therapeutic strategies for the treatment of AHRL.

1. Introduction

Age-related hearing loss (ARHL), or presbycusis, is a pathology that affects 33% of the population worldwide [1]. ARHL is observed simultaneously in both ears in the high frequency spectrum and is a multi-factorial process involving complex interactions between intrinsic (genetic) and extrinsic (environmental) factors [1,2]. ARHL is characterized by cochlear dysfunction, which includes loss of sensory cells, atrophy of the stria vascularis, and loss of the spiral ganglion neurons [1,2]. Establishing the intrinsic mechanisms responsible for the disease will drive the development of preventive therapies [1]. The mechanisms that have been described are: imbalance between the production of radical oxygen species (ROS) and antioxidants, cumulative mitochondrial dysfunction, accumulation of mitochondrial DNA damage, excitotoxicity, and cellular senescence leading to apoptotic and necrotic auditory cell death [3,4]. However, the exact biological mechanism of ARHL is still unknown.
Senescence is considered a basic mechanism of aging [5]. Cellular senescence limits the proliferation of damaged or aged cells [6,7]. Although senescence plays an essential role in tissue homeostasis and physiology in normal development, senescence is a response to stress associated with aging, such as telomere attrition and genomic alterations, which are aging characteristics. Cellular senescence can be divided into several types, such as replicative senescence resulted from telomere shortening [8], stress-induced premature senescence (SIPS), which is caused by an oncogene [9], or a variety of stressors (chemotherapeutic agents or oxidative stress) [10].
Numerous aging pathologies associated with senescence have been studied, as in glaucoma [11], cataracts [12], the diabetic pancreas [13], osteoarthritis [14], and cancer [15]. In age-related disorders, senescent cells accumulate in tissues associated with the aging process through the senescence-associated secretory phenotype (SASP). As the disease advances, an additional surge of senescent cells is produced at the damaged sites [16]. In addition, senescent cells induce high production of mitochondrial-derived ROS [15]. The SASP and enhanced ROS production contribute to cellular senescence in both autocrine [17,18] and paracrine ways [19,20].
In recent years, different studies have confirmed that senescent cells act on their environment through mitochondrial dysfunction. Mitochondrial dysfunction is considered a further “hallmark of aging” [21], and, together with cellular senescence, both have been independently recognized as important leads of aging [22,23,24,25]. Furthermore, cellular senescence promotes senescence-associated mitochondrial dysfunction (SAMD) [17]. Cumulative evidence indicates that mitochondria in senescent cells exhibit various changes in mass, function, and structure. In general, the number of mitochondria increases in senescent cells [17,26,27]. However, although mitochondria are more abundant, they are dysfunctional. In senescent cells, mitochondria show increased ROS production [17,25].
Senescence of different cells is the most used in vitro experimental model for cellular aging [28]. The induction of oxidative stress is often used for studies based on SIPS. To date, distinct inducers of oxidative stresses have been utilized to induce SIPS in vitro, such as hydrogen peroxide (H2O2) [29], ultra-violet light [30], tert-butyl hydroperoxide [31], and ethanol [31]. H2O2 is the foremost ordinarily utilized inducer of senescence because it is a natural inducer of oxidative stress [28]. Oxidative stress can induce premature senescence in auditory cells, resulting in ARHL. Understanding auditory cell behavior under oxidative stress would be important to study how to prevent, reverse or postpone senescence induced by oxidative stress in auditory cells cultures.
In recent years, different approaches have been used to establish the molecular mechanisms of ARHL, but these are often limited by the low amount of tissue available for assays, the difficulty of obtaining organotypic cultures along with the need to perform multiple explants for each experimental condition or the few animal models available [32]. One solution to the problem would be the culture of auditory cells, but this is complicated because the mammalian organ of Corti cells do not proliferate. Currently, this has been resolved by the obtaining of several auditory cell lines from transgenic mice (Immortomouse1) as HEI-OC1 (House Ear Institute-Organ of Corti 1), OC-k3 (from organ of Corti), and SV-k1 (from stria vascularis) cells [33,34,35], which proliferate indefinitely.
The data of this study showed that H2O2 induced senescence in HEI-OC1, OC-k3, and SV-k1 auditory cells. Different lines of evidence obtained in this research support these results. Therefore, this model of senescence induced by oxidative stress in the cell lines HEI-OC1, OC-k3, and SV-k1 can be a useful tool to study the intrinsic mechanisms responsible for ARHL and allow the development of anti-senescence therapies and prevent ARHL.

2. Materials and Methods

A comprehensive overview of the experimental timeline and procedures that have been used in this study is described in Figure 1.

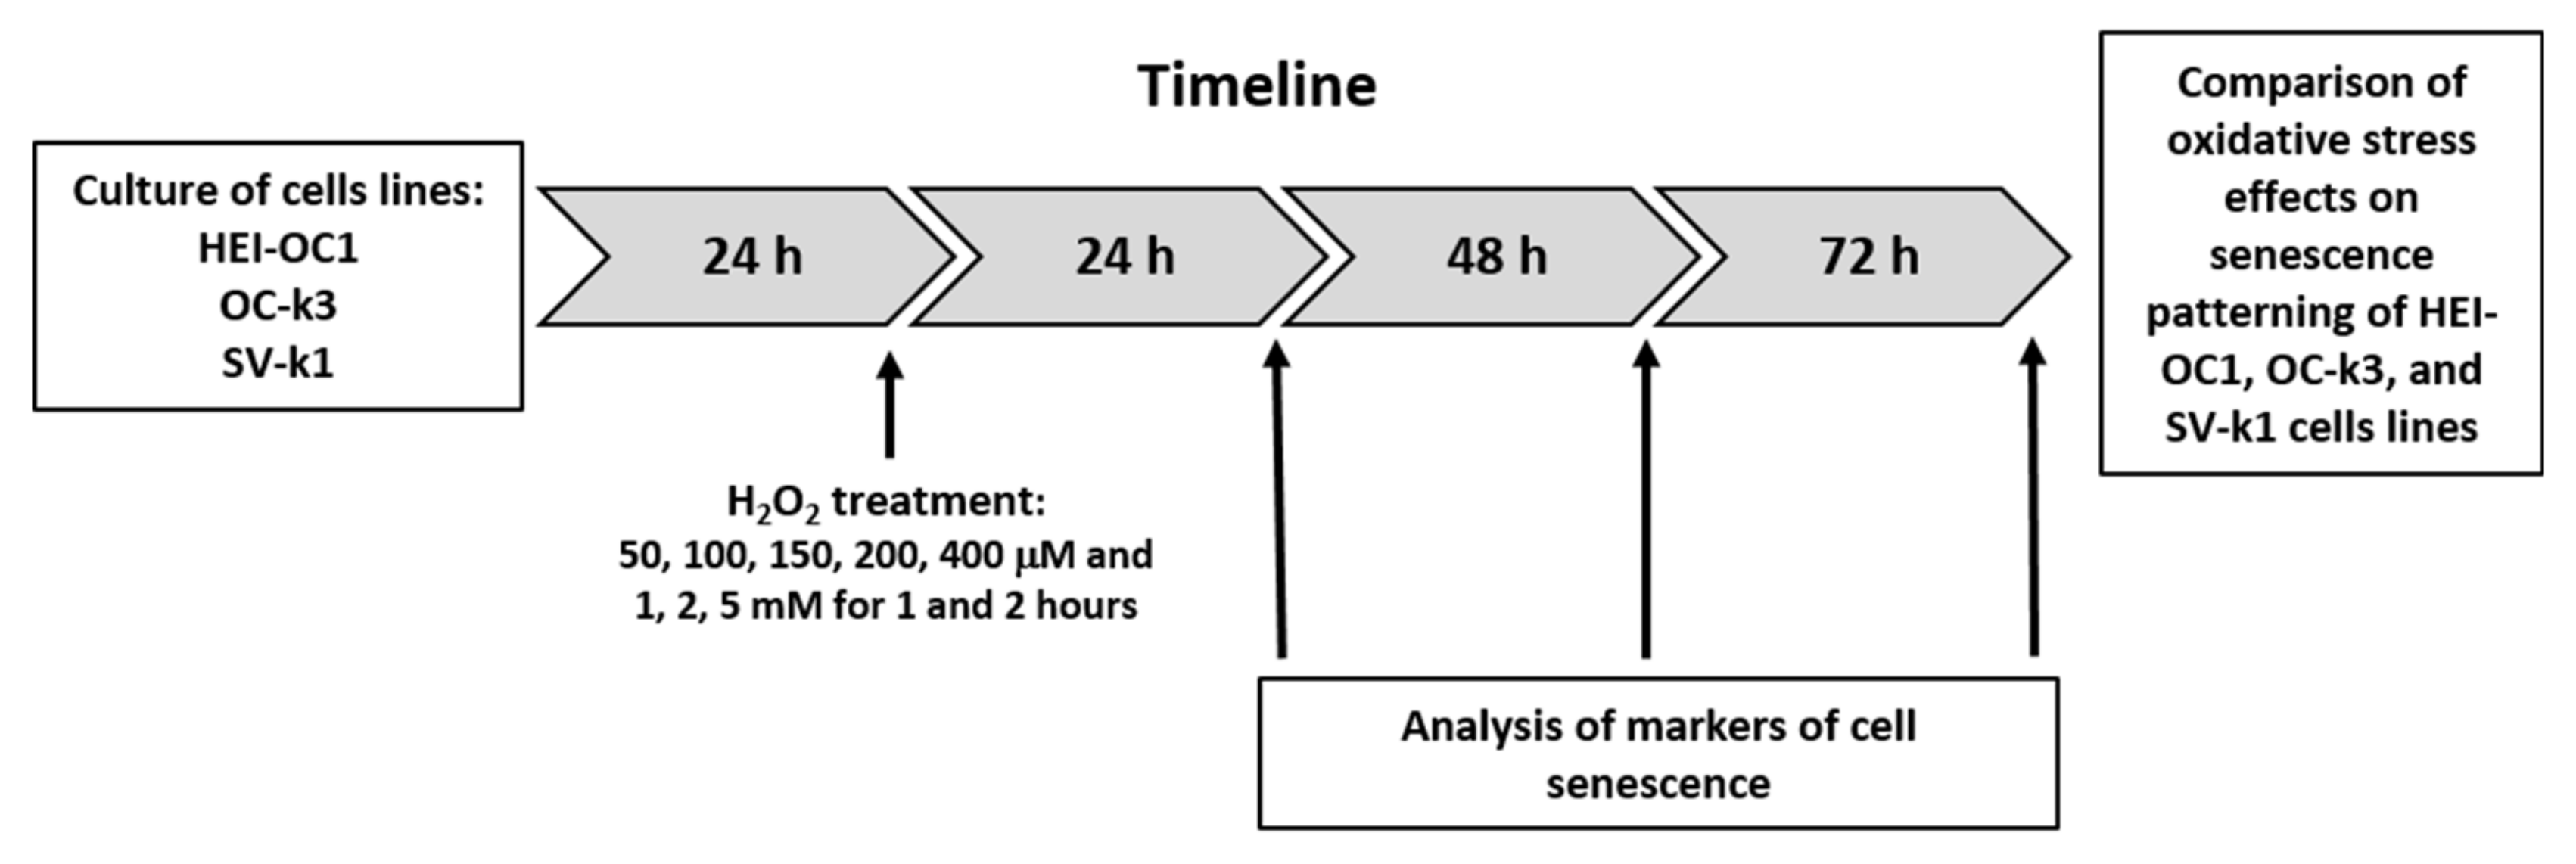
2.1. Cell Culture and H2O2 Treatment

The three mouse auditory cell lines, SV-k1, HEI-OC1 and OC-k3, were kindly provided by: Dr. F. Kalinec (House Research Institute, Los Angeles, CA, USA), Dr. Maria Rosa Aguilar (Department of Nanomaterials and Polymeric Biomaterials Institute of Science and Technology of Polymers CSIC, Madrid, Spain), and Dr. Beatriz Duran Alonso (Institute of Molecular Biology and Genetics (IBGM), University of Valladolid, Valladolid, Spain), respectively. The cells were cultured in Dulbecco’s high glucose Eagle’s medium (DMEM; Gibco BRL, Waltham, MA USA) with 10% fetal bovine serum (FBS; Gibco BR, Waltham, MA USA), without antibiotics at 33 °C and 10% CO2, as previously described [36].
Cells were treated with H2O2 (VWR Inc., West Chester, PA USA) at different concentrations (50, 100, 150, 200 or 400 μM; 1, 2 or 5 mM) for 1 or 2 h and post-treatment analysis was performed at 24, 48, and 72 h. Cell viability assays were performed under these experimental conditions. In the following experiment settings, H2O2 concentrations, the treatment times (1 and 2 h) and post-treatment analysis (24, 48, and 72 h) varied depending on the experiments.

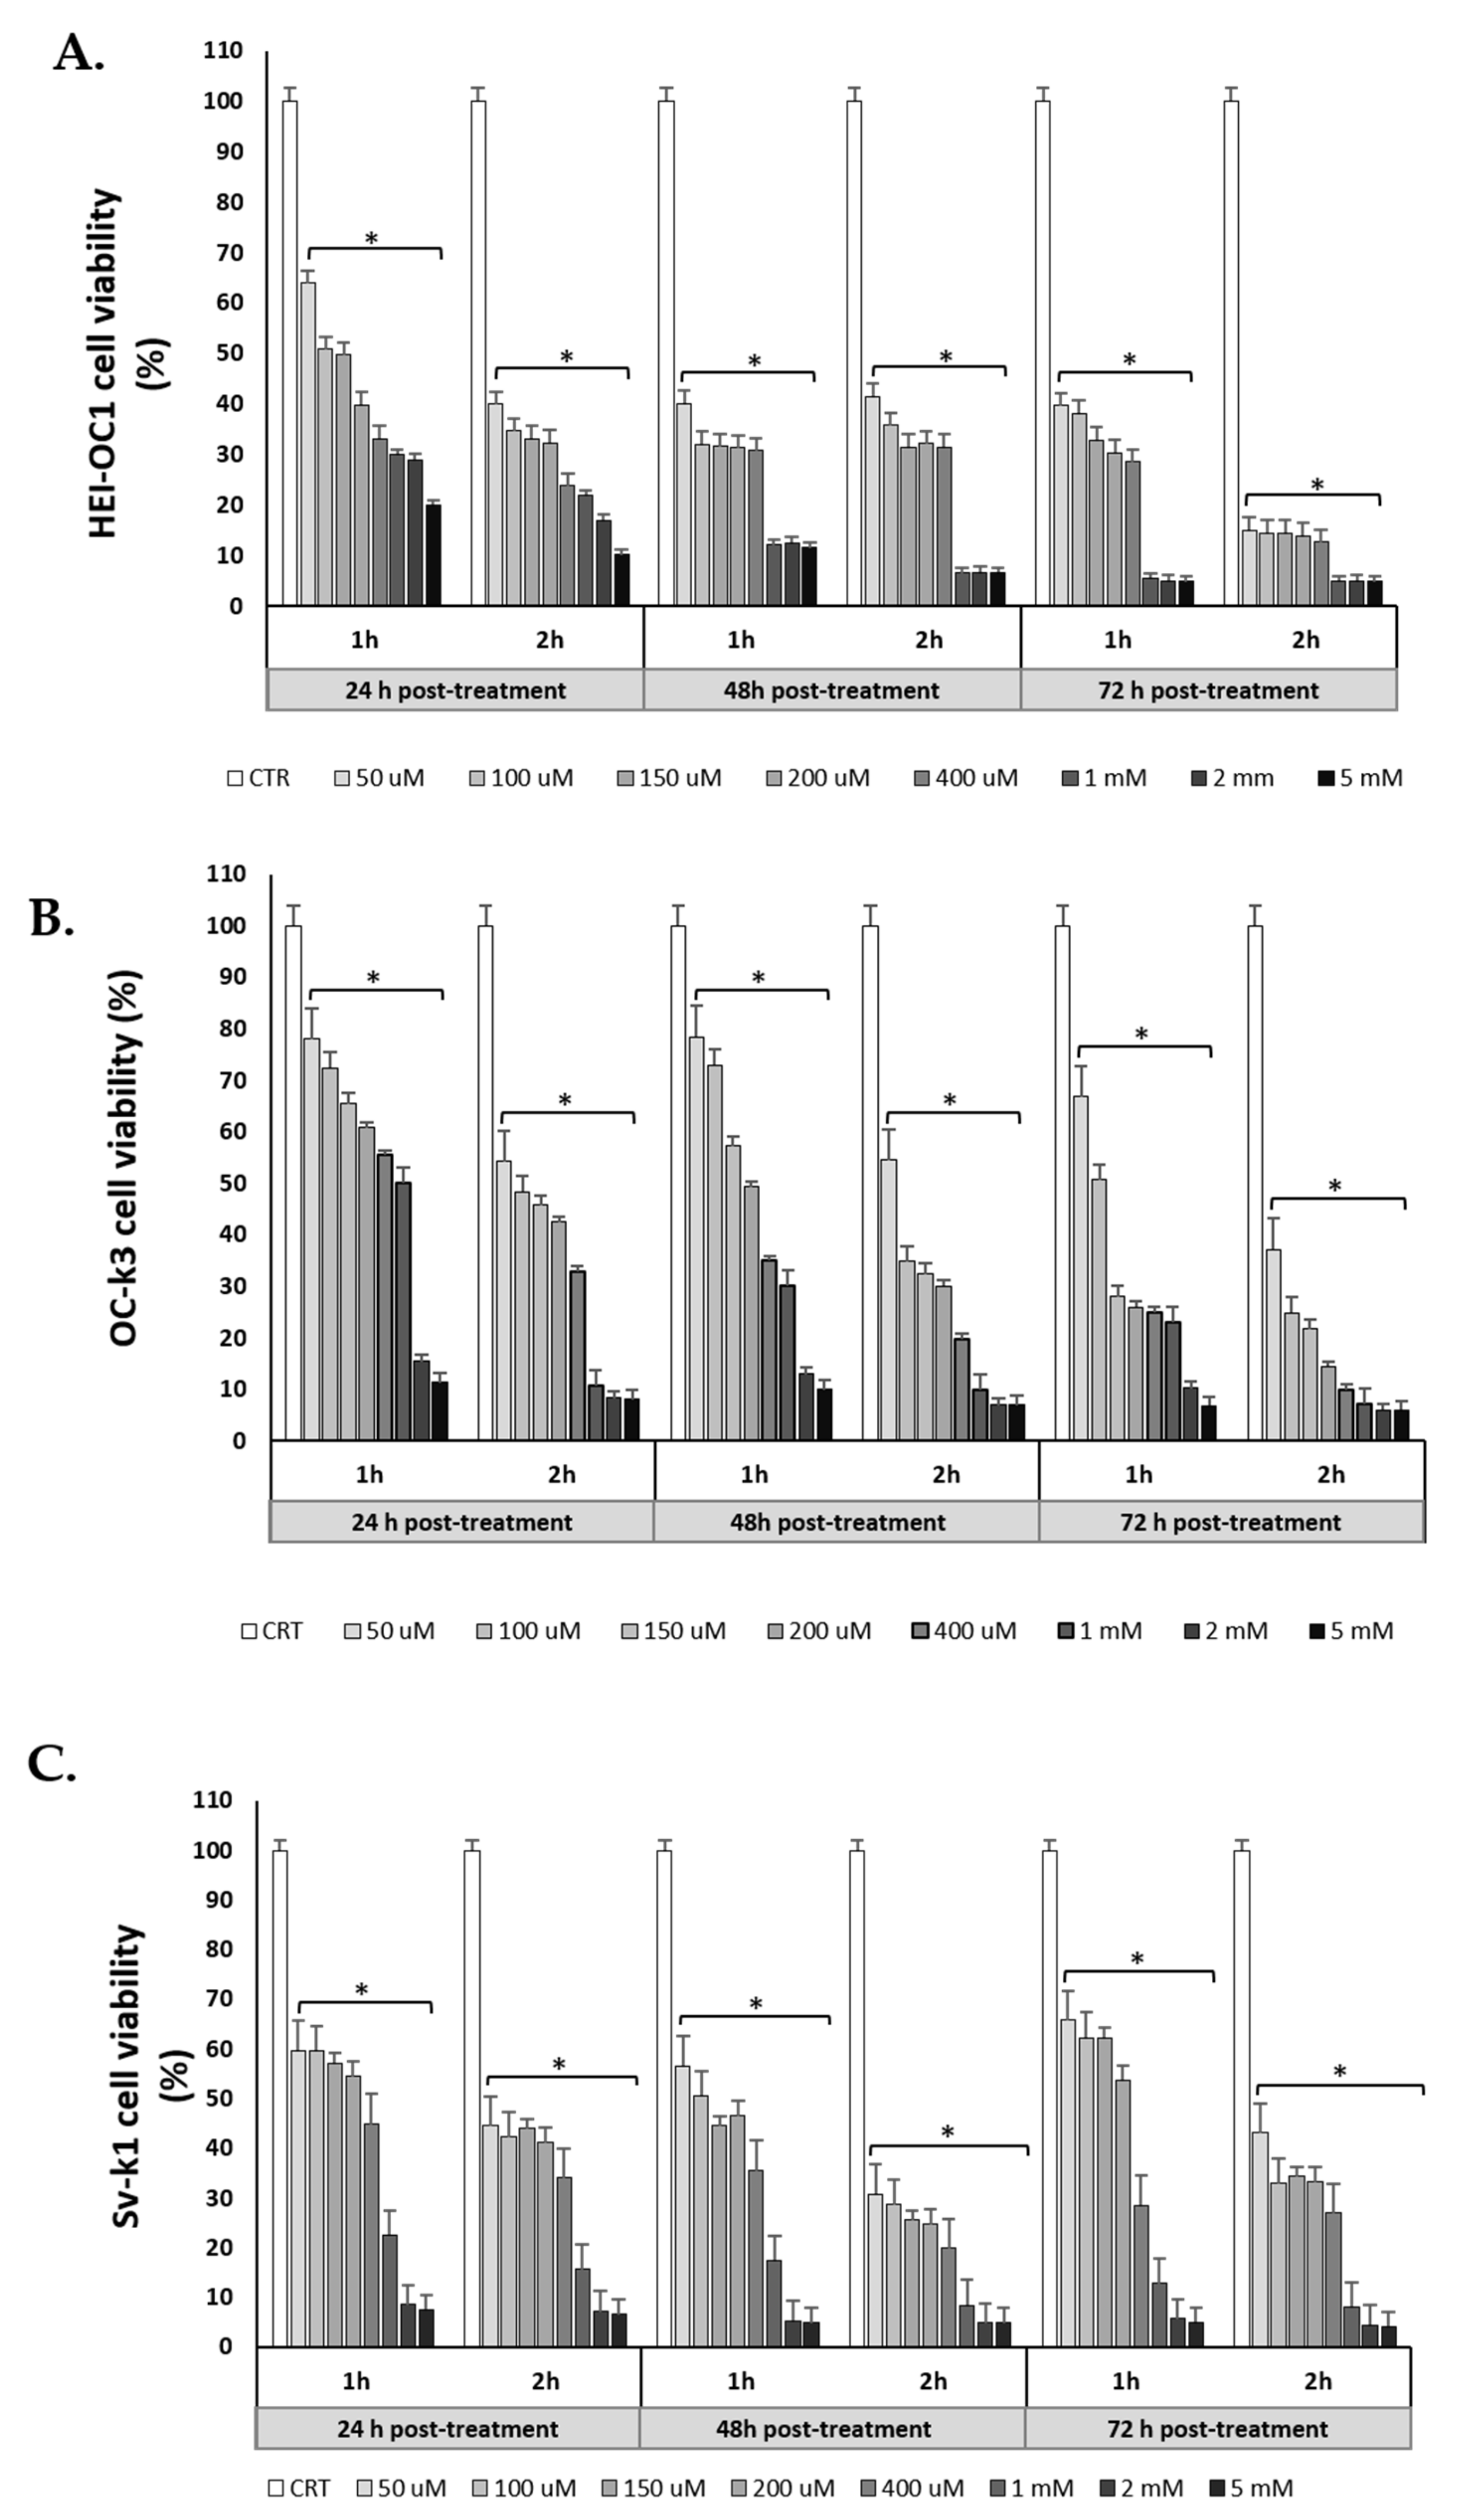
2.2. Cell Viability Assay

HEI-OC1, OC-k3, and SV-k1 were seeded on 96-well plates at 2 × 10⁴ cells/mL. After 24 h, cells were treated with eight H2O2 concentrations for 1 or 2 h. Then, a new medium was added until cell viability assay was performed. At 24, 48, or 72 h post-treatment, PrestoBlue cell viability assay (Invitrogen, Waltham, MA USA) was performed following the manufacturer’s protocol. Fluorescence was measured with a FLUOstar Omega (BMG Labtech, Ortenberg, Baden-Württemberg, Germany) plate reader. In the control cells group, the average OD was taken as 100% of viability.

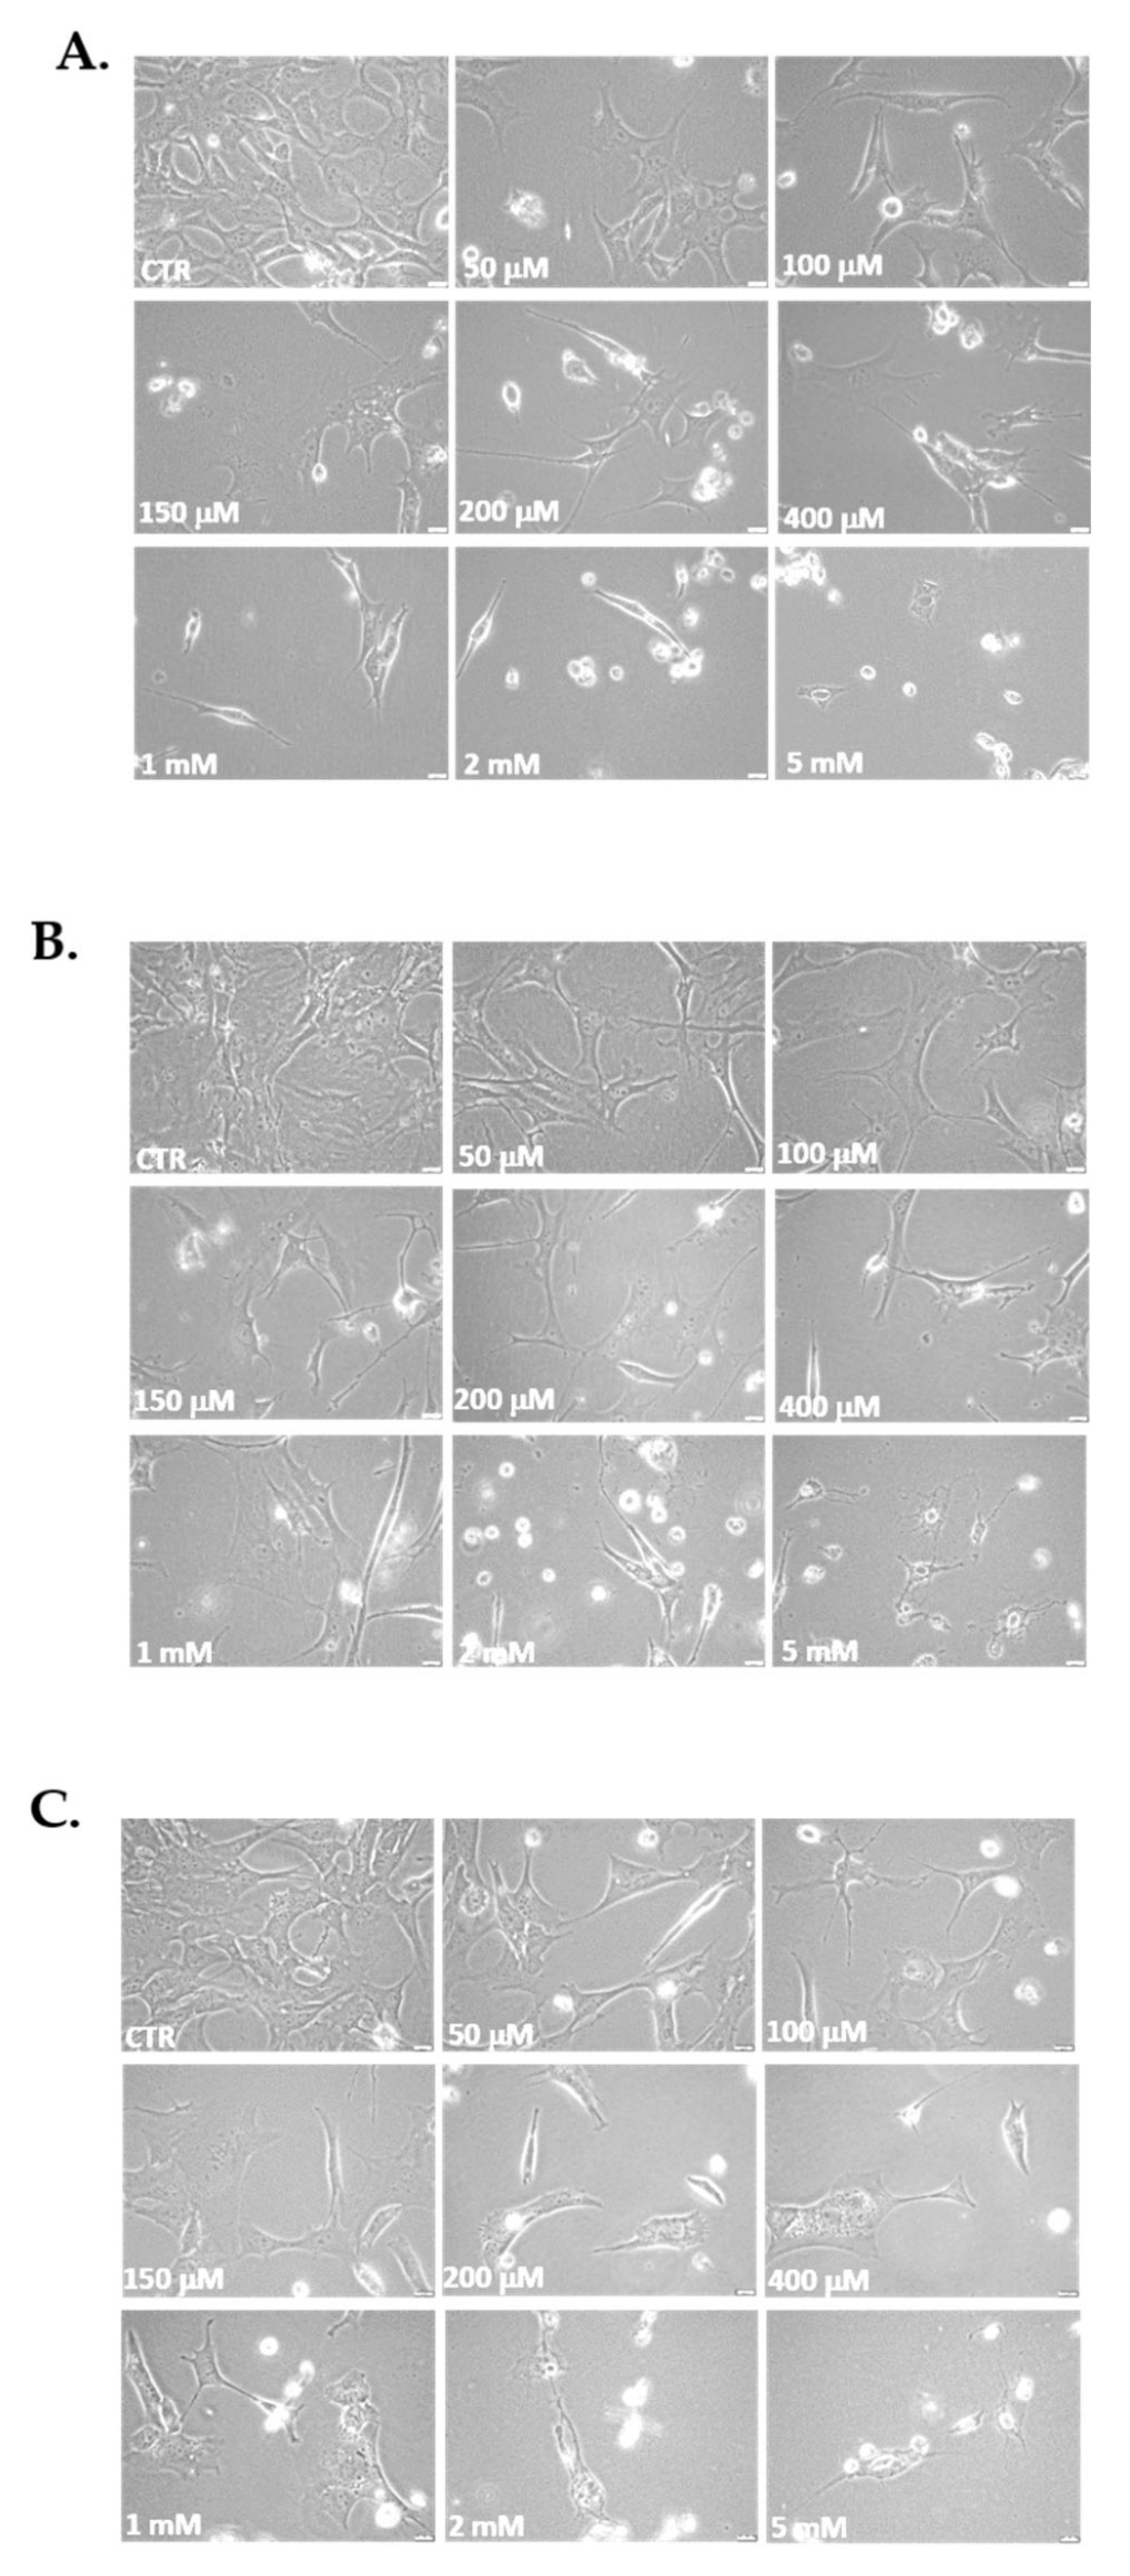
2.3. Analysis of the Morphological Characteristics of Cells

Cells were seeded in 24-well plates at 5 × 10⁴ cells/well and treated as described above. The study of the morphological characteristics of cells was performed under a bright field with the Olympus CKX41 microscope and the coupled cellSens Entry imaging system.

2.4. Capacity of Cells to Reseeding Post H2O2 Treatments

After treatment with H2O2 (1 and 2 h), the adhesion cell capacity was verified by replating in 24-well plates upon reaching 80% confluence. H2O2-treated cells were seeded at a 1:1 ratio, and untreated cells were seeded at a 1:3 ratio. Cells were observed on successive days to check for complete growth arrest and cell proliferation capacity.

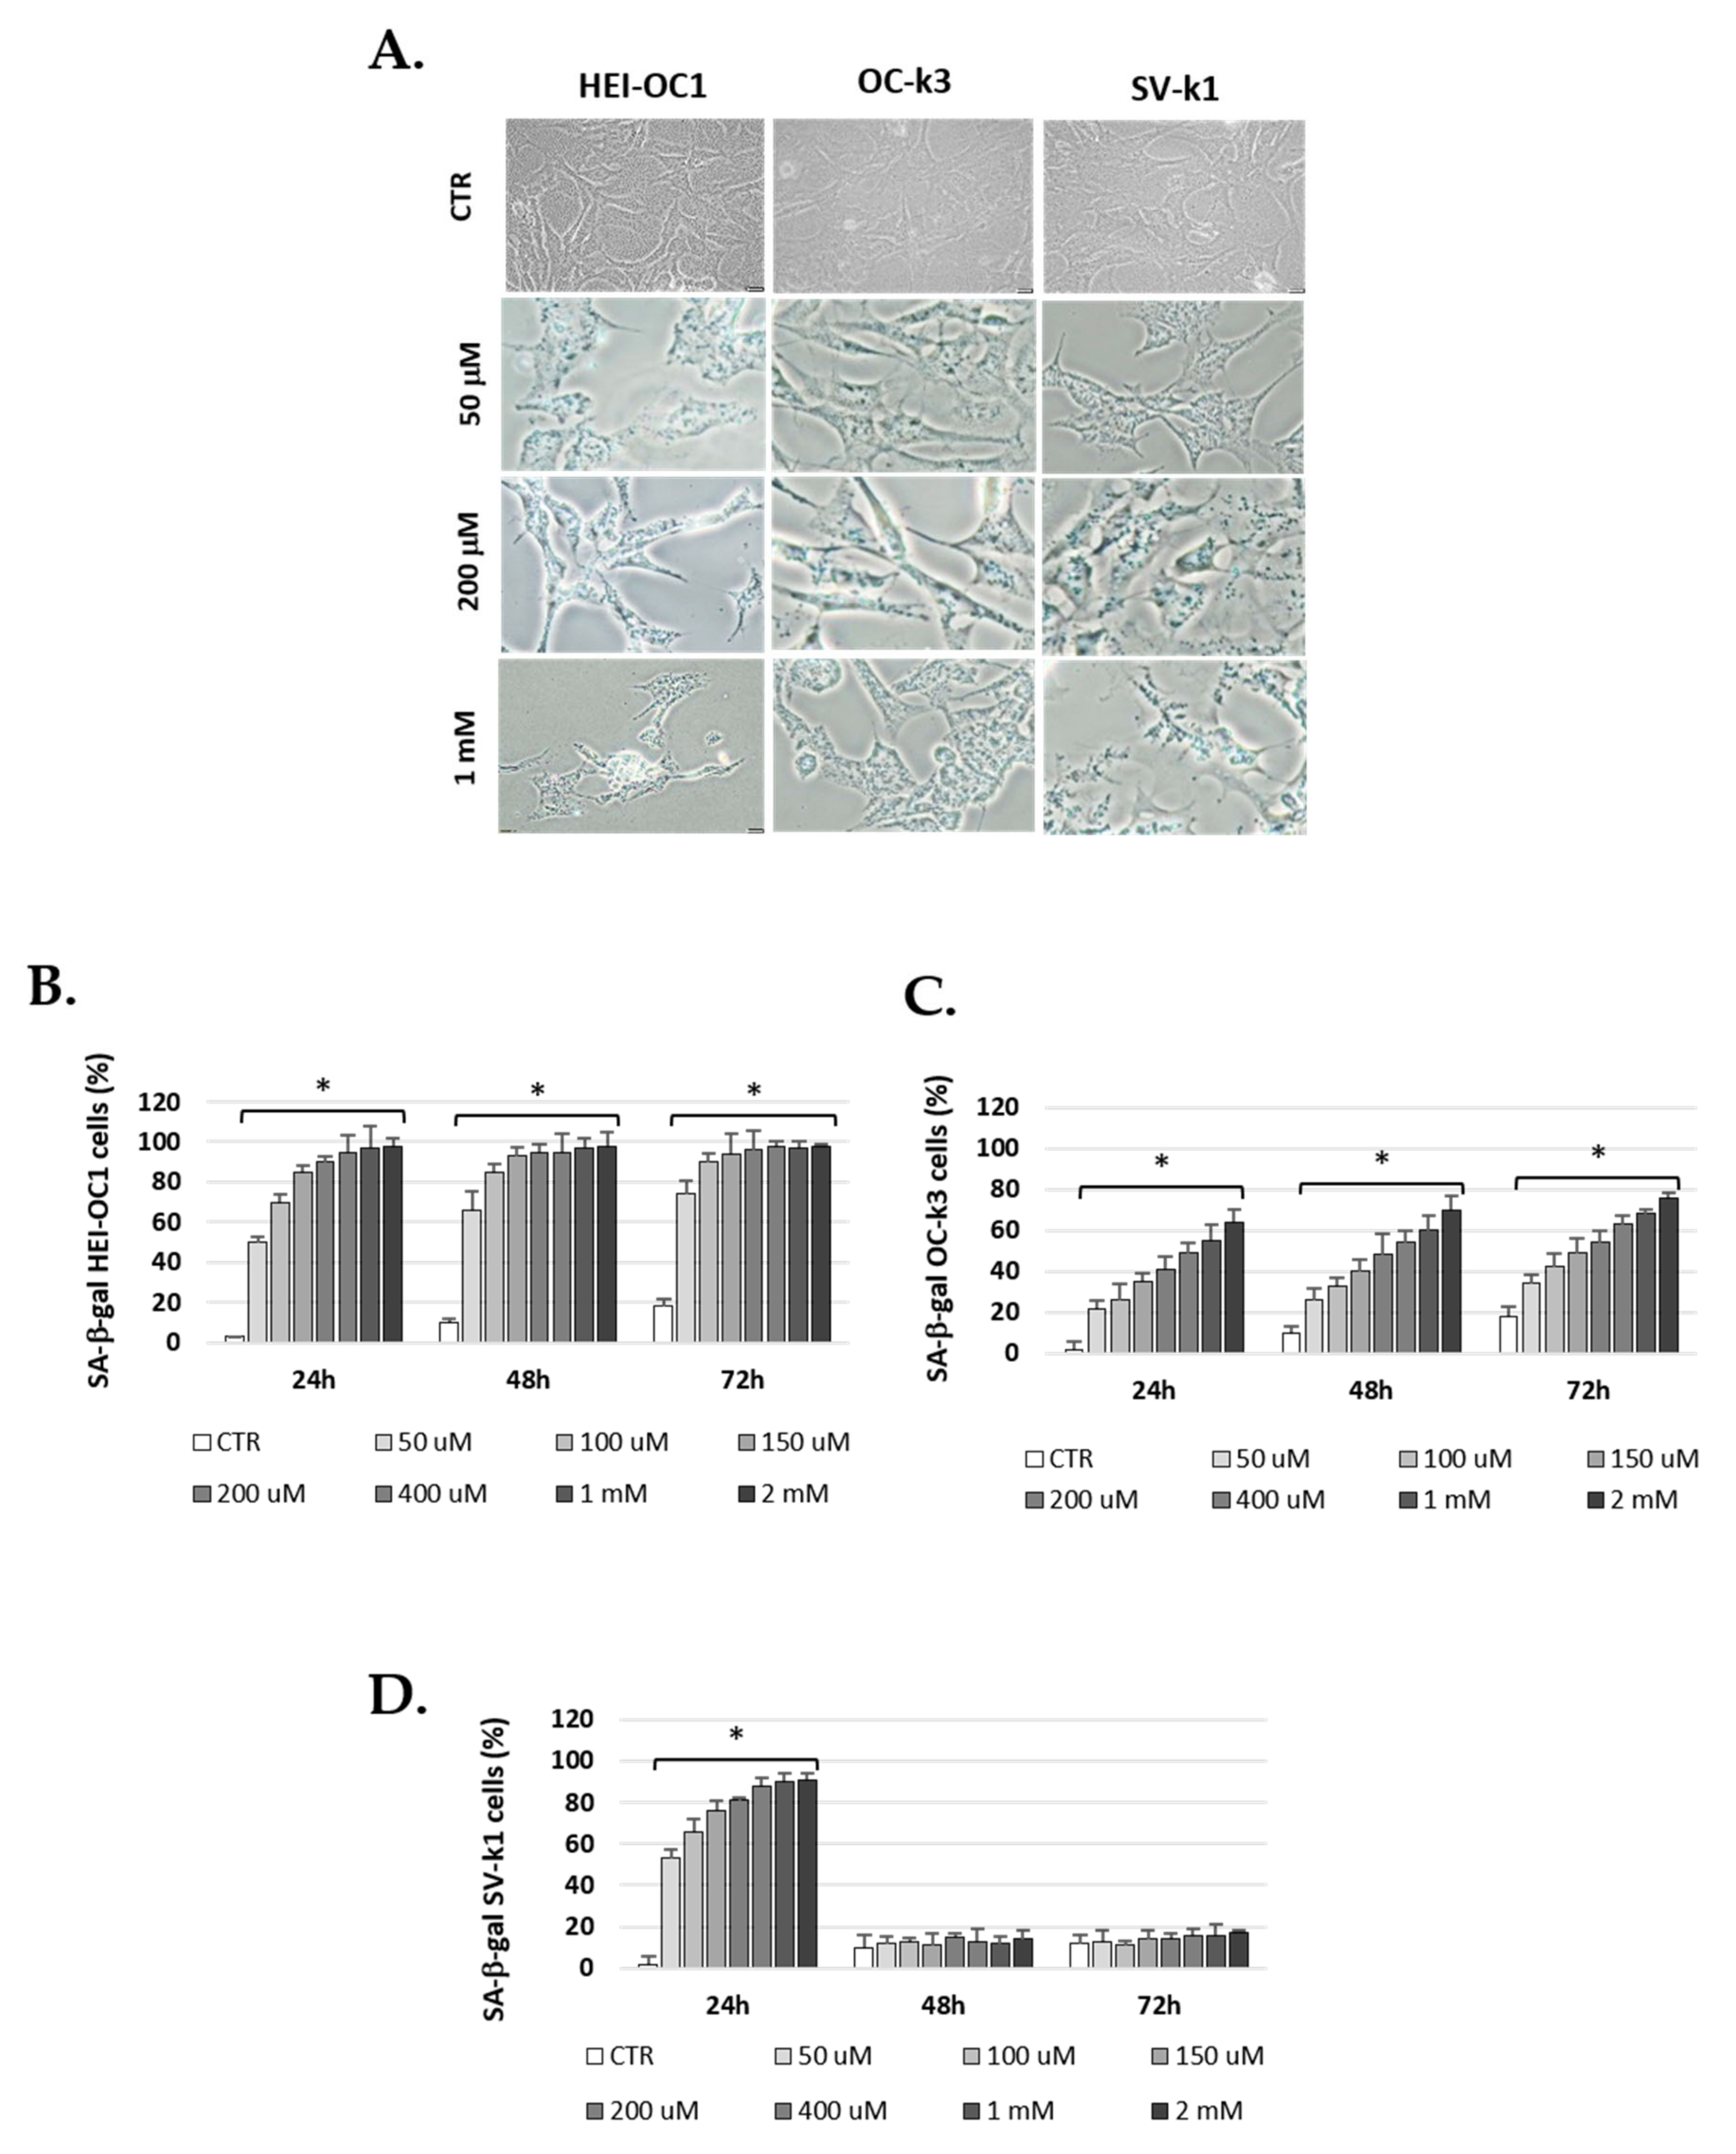
2.5. Senescence-Associated β-Galactosidase Assay

Cells were seeded in the Lab-Tek II Chamber Slide System of 8-well plates (Nunc) at 3 × 10⁴ cells/well. After 24 h, cells were treated with H2O2 (50, 100, 150, 200 and 400 μM) for 1h. To evaluate senescence, the Galactosidase Detection Kit (Abcam, Cambridge, UK) was used after the end of H2O2 treatment (at 24, 48, or 72 h) according to the fabricator’s instructions. The number of not colored (negatives) and blue (positive, biomarker of cellular senescence) cells were counted in a minimum of three random fields in each sample. Cells were visualized in an Olympus BX51 microscopy.

2.6. Determination of Population Doubling Rate

The cell population doubling rate was determined by the method described above by Young et al., 2010 [37]. Cells were cultured in 6-well plates at 1 × 10⁵ cells/well; after 24 h, cells were treated 1 h with H2O2, replaced with a standard culture medium, and then incubated. Then, 1 × 10⁵ cells/well were reseeding for the following recount, every 72 h, up to 3 passages. The population doubling rate was calculated using the formula: [log (number of cells counted/well)−log (number of cells seeding)]/log 2.

2.7. Mitochondrial Superoxide Anion Detection

We used MitoSOX Red fluorochrome (Invitrogen, Waltham, MA USA) to determine the superoxide anions produced in mitochondrial. Cell lines were plated onto a Lab-Tek II Chamber Slide System of 8-well plates at 2 × 10⁴ cells per well. After 24 h in standard conditions, cells were treated with different concentrations of H2O2 for 1 h. MitoSOX assay was performed at 24 h post-H2O2 treatment. Then, cells were washed and incubated with 2.5 μM MitoSOX-Red reagent for 45 min at 33 °C in the dark. Cell’s fluorescence was visualized by Olympus BX51 microscope.
The cells were then stained with 200 nM of Tracker Green staining kit (Abcam, Cambridge, UK) for 45 min at 33 °C in the dark to corroborate the mitochondrial localization of MitoSOX-Red. Once active mitochondria are labeled with MitoTracker, they can be detected by fluorescence microscopy. The fluorescence intensities of MitoTracker-Green, MitoSOX-Red, and merge were quantified using the Image J program.
Briefly, the level of fluorescence in a given region (e.g., nucleus or cytoplasm) was determined by the ImageJ program as follows: (1) the cell of interest was selected using the freeform drawing/selection tools; (2) the area, integrated density and mean gray value were selected; (3) from the Analyze menu “set measurements” was selected; (4) “measure” was then selected from the analyze menu, prompting a pop-up box to appear with the values for that first cell; (5) then, a region next to the cell that has no fluorescence was selected to serve as the background; (6) this step was repeated for the other cells in the field of view of measurement; (7) all data in the results window were selected, and copied and pasted into a new Excel worksheet; (8) finally, the following formula was used to calculate the corrected total cell fluorescence (CTCF): CTCF = integrated density—(area of selected cell * mean fluorescence of background readings).

2.8. Reactive Oxygen Species Detection

To measure cytosolic superoxide generation, red fluorescent probe dihydroethidium (DHE; Calbiochem, San Diego, CA USA) was used [38]. However, DHE can also detect ONOO or OH [38,39]. Briefly, cells were seeded in the Lab-Tek II Chamber Slide System of 8-well plates at 2 × 10⁴ cell/well. After 24 h, cells were treated with different H2O2 concentrations and incubated for 24 h. Then, after fixing the cells with 4% paraformaldehyde (PFA) for 10 min, they were incubated with probe DHE (4 µmol/L) at 37 °C for 90 min in the dark. After, cells were stained with 300 nM of 4′,6-diamidino-2-phenylindole dihydrochloride (DAPI) (Sigma-Aldrich, San Luis, AZ USA) at 37 °C for 5 min in the dark. DAPI is a reagent that emits blue fluorescence marking the cell nucleus. Cells were observed on an Olympus BX51 microscope, and the ImageJ program analyzed the images as described above.

2.9. Indirect Inmmunofluorescence

After treatment with H2O2, the cells were fixed with 4% PFA for 10 min and blocked at 37 °C for 1 h. Then, cells were incubated with the antibodies Forkhead box O3a (FoxO3a) (1/200) and 8-oxoguanine (8-oxoG) (1/50) (Abcam, Cambridge, UK) overnight at 4 °C. Following this, the secondary antibody Alexa Fluor 546 (1/250; Molecular Probes, Eugene, OR, USA) was added to the cells at 37 °C for 45 min. Subsequently, the cells were stained with DAPI (Sigma-Aldrich, San Luis, CA, USA) at 37 °C for 5 min. Cells were observed on an Olympus BX51 microscope, and the ImageJ program analyzed the images as described above. The suppression of the primary antibody evaluated the specificity.

2.10. Statistical Analysis

Statistical values were calculated by variance ANOVA test and Tukey’s multiple comparison test using the SPSS 19.0 software. Data are shown as mean ± standard deviation (SD). p < 0.05 values indicate statistical significance.

3. Results

3.1. Preliminary Screening of H2O2 Treated Cells: Cell Viability Analysis

Cell viability results underline that HEI-OC1, OC-k3, and SV-k1 cells treated with H2O2 exhibited decreased cell viability compared to untreated cells in a dose and time-dependent manner. In Figure 2A, we show the HEI-OC1 cell viability after 1 h of treatment. H2O2 reduced cell viability below 70% (cell viability lower than 70% is cytotoxic according to ISO 10993-5: 2009) at 24, 48 and 72 h, and when treatment was equal or higher than 50 μM H2O2, the differences between untreated and treated cells were significant (p < 0.05). Treatment of HEI-OC1 for 2 h with H2O2 decreased cell viability more markedly, with respect to 1 h of treatment for concentrations of 50 μM onwards. In particular, the decrease in cell viability is more pronounced at 72 h (p < 0.05) in cells treated with high concentrations of H2O2 (Figure 2A).
As for OC-k3, we analyzed cell viability also at 1 and 2 h of exposure to H2O2 and at 24, 48 and 72 h post-treatment. In general, at 1 h, we found that a decrease in cell viability below 70% was observed at concentrations greater than 100 μM for 24 and 48 h, while at 72 h, this concentration decreased to 50 μM (Figure 2B). When comparing these results with 2 h of treatment, we verify that cell viability decreases more markedly from lower concentrations, such as 50 μM, at 24, 48 and 72 h post-treatment. It should be noted that, at 72 h post-treatment, the decrease in cell viability is significantly lower, at all concentrations, with respect to 24 and 48 h.
Cell viability data for the SV-k1 cell line are similar to those for the other two cell lines, with viability decreasing as a function of concentration and time. Thus, it is observed that the decrease in viability is more pronounced at 2 h of treatment and at 72 h post-treatment (Figure 2C).
In brief, of the three cell lines, HEI-OC1 cells are the most sensitive to H2O2 treatment, with a significant decrease in cell viability at lower concentrations (50 μM) compared to OC-k3 and SV-k1 cells.
Since we obtained a very marked decrease in cell viability with exposure to H2O2 for 2 h, we choose the 1 h condition for additional assays.

3.2. Morphological Changes and Capacity of Cells to Reseeding Post H2O2 Treatments

The three cell lines studied post-H2O2 administration revealed changes in their morphology as a function of the increase in H2O2 concentrations. In fact, morphological changes were found from the smallest concentration (50 μM), with these changes being more pronounced at the highest concentrations (200, 400 μM; 1, 2 and 5 mM) at 1 h (Figure 3). The changes were also more pronounced depending on the time elapsed after the end of the treatment (24, 48 and 72 h). In general, cells exhibited marked morphological changes observed to range from thinner and longer cells to enlarged and ramified cells and alterations in the organelles, all characteristics of senescent cells [40,41] (Figure 3). Data for 24 and 48 h after H2O2 treatment are not shown. It should be noted that following the results of cell viability (Figure 3), the number of cells in all types significantly decreases concerning their respective controls as a function of time and H2O2 concentration. Additionally, increasing the exposure time and H2O2 concentration slowed down auditory cell growth after 2 and 5 mM H2O2 treatment, and the cells were not viable on re-seeding. In contrast, cells that had been treated with 50,100, 150, 200, 400 μM, and 1 mM H2O2 were able to undergo a minimum of 3 passages.

3.3. H2O2 Increase SA β-Galactosidase Activity in Cells

The next step was to evaluate the H2O2 effect on SA β-Gal activity in the three cells lines. In all experimental conditions, the enzyme activity increased with H2O2 treatment in comparison with the controls (untreated cells). Under these experimental conditions, after a treatment of 1 h, all concentrations of H2O2 tested effectively increased the activity of β-Gal of SA at 24 and 48 h post-treatment, with a prolonged effect up to 72 h (Figure 4). Figure 4 also shows results from an illustrative experiment and the corresponding cell images of 1 h H2O2 exposure and 24 h post-treatment (Figure 4A). We determined that the percentage of positive cells (blue cells) after each treatment with H2O2 was higher than in controls (Figure 4B–D).
Comparing assay results, HEI-OC1, OC-k3, and SV-k1 cells have different ways of responding to oxidative stress (Figure 4B–D). The SA β-Gal activity observed in HEI-OC1 and OC-k3 cells depended on exposure time and H2O2 concentration, reaching a maximum activity with 2 mM concentration of H2O2 for 1 h and 72 h post-treatment, while SV-k1 cells showed the highest increase with 2 mM H2O2 for 1 h and 24 h post-treatment. When the time elapsed at the end of the treatment with H2O2 is 48 and 72 h, the SV-k1 cells do not present differences concerning the control, no SA β-Gal activity is observed even in high concentrations (Figure 4B–D).
At each experimental time point, 1, 2, and 5 mM H2O2 produced a cytotoxic effect and, therefore, these high concentrations were not used for the following tests.

3.4. Population Doubling Rate Post H2O2 Treatments

In addition, we determined the cell duplication rate to test the aging model. Lower rates indicate a slower speed of cell growth, indicating cell senescence. A progressive decrease in the doubling rate of the cell population was obtained depending on the concentration of H2O2. Figure 5A shows that the HEI-OC1 cell line decreased the duplication rate in the first two passages, and in the third, it increased again. Control cells grew normally during all passages, maintaining the doubling rate.
In the OC-k3 and SV-k1 cell lines (Figure 5B,C), the control cells showed a high capacity to duplicate again in all passages. On the contrary, the treated cells progressively decreased their duplication capacity as the H2O2 concentration increased, decreasing dramatically from the 100 µM concentration at the third passage.

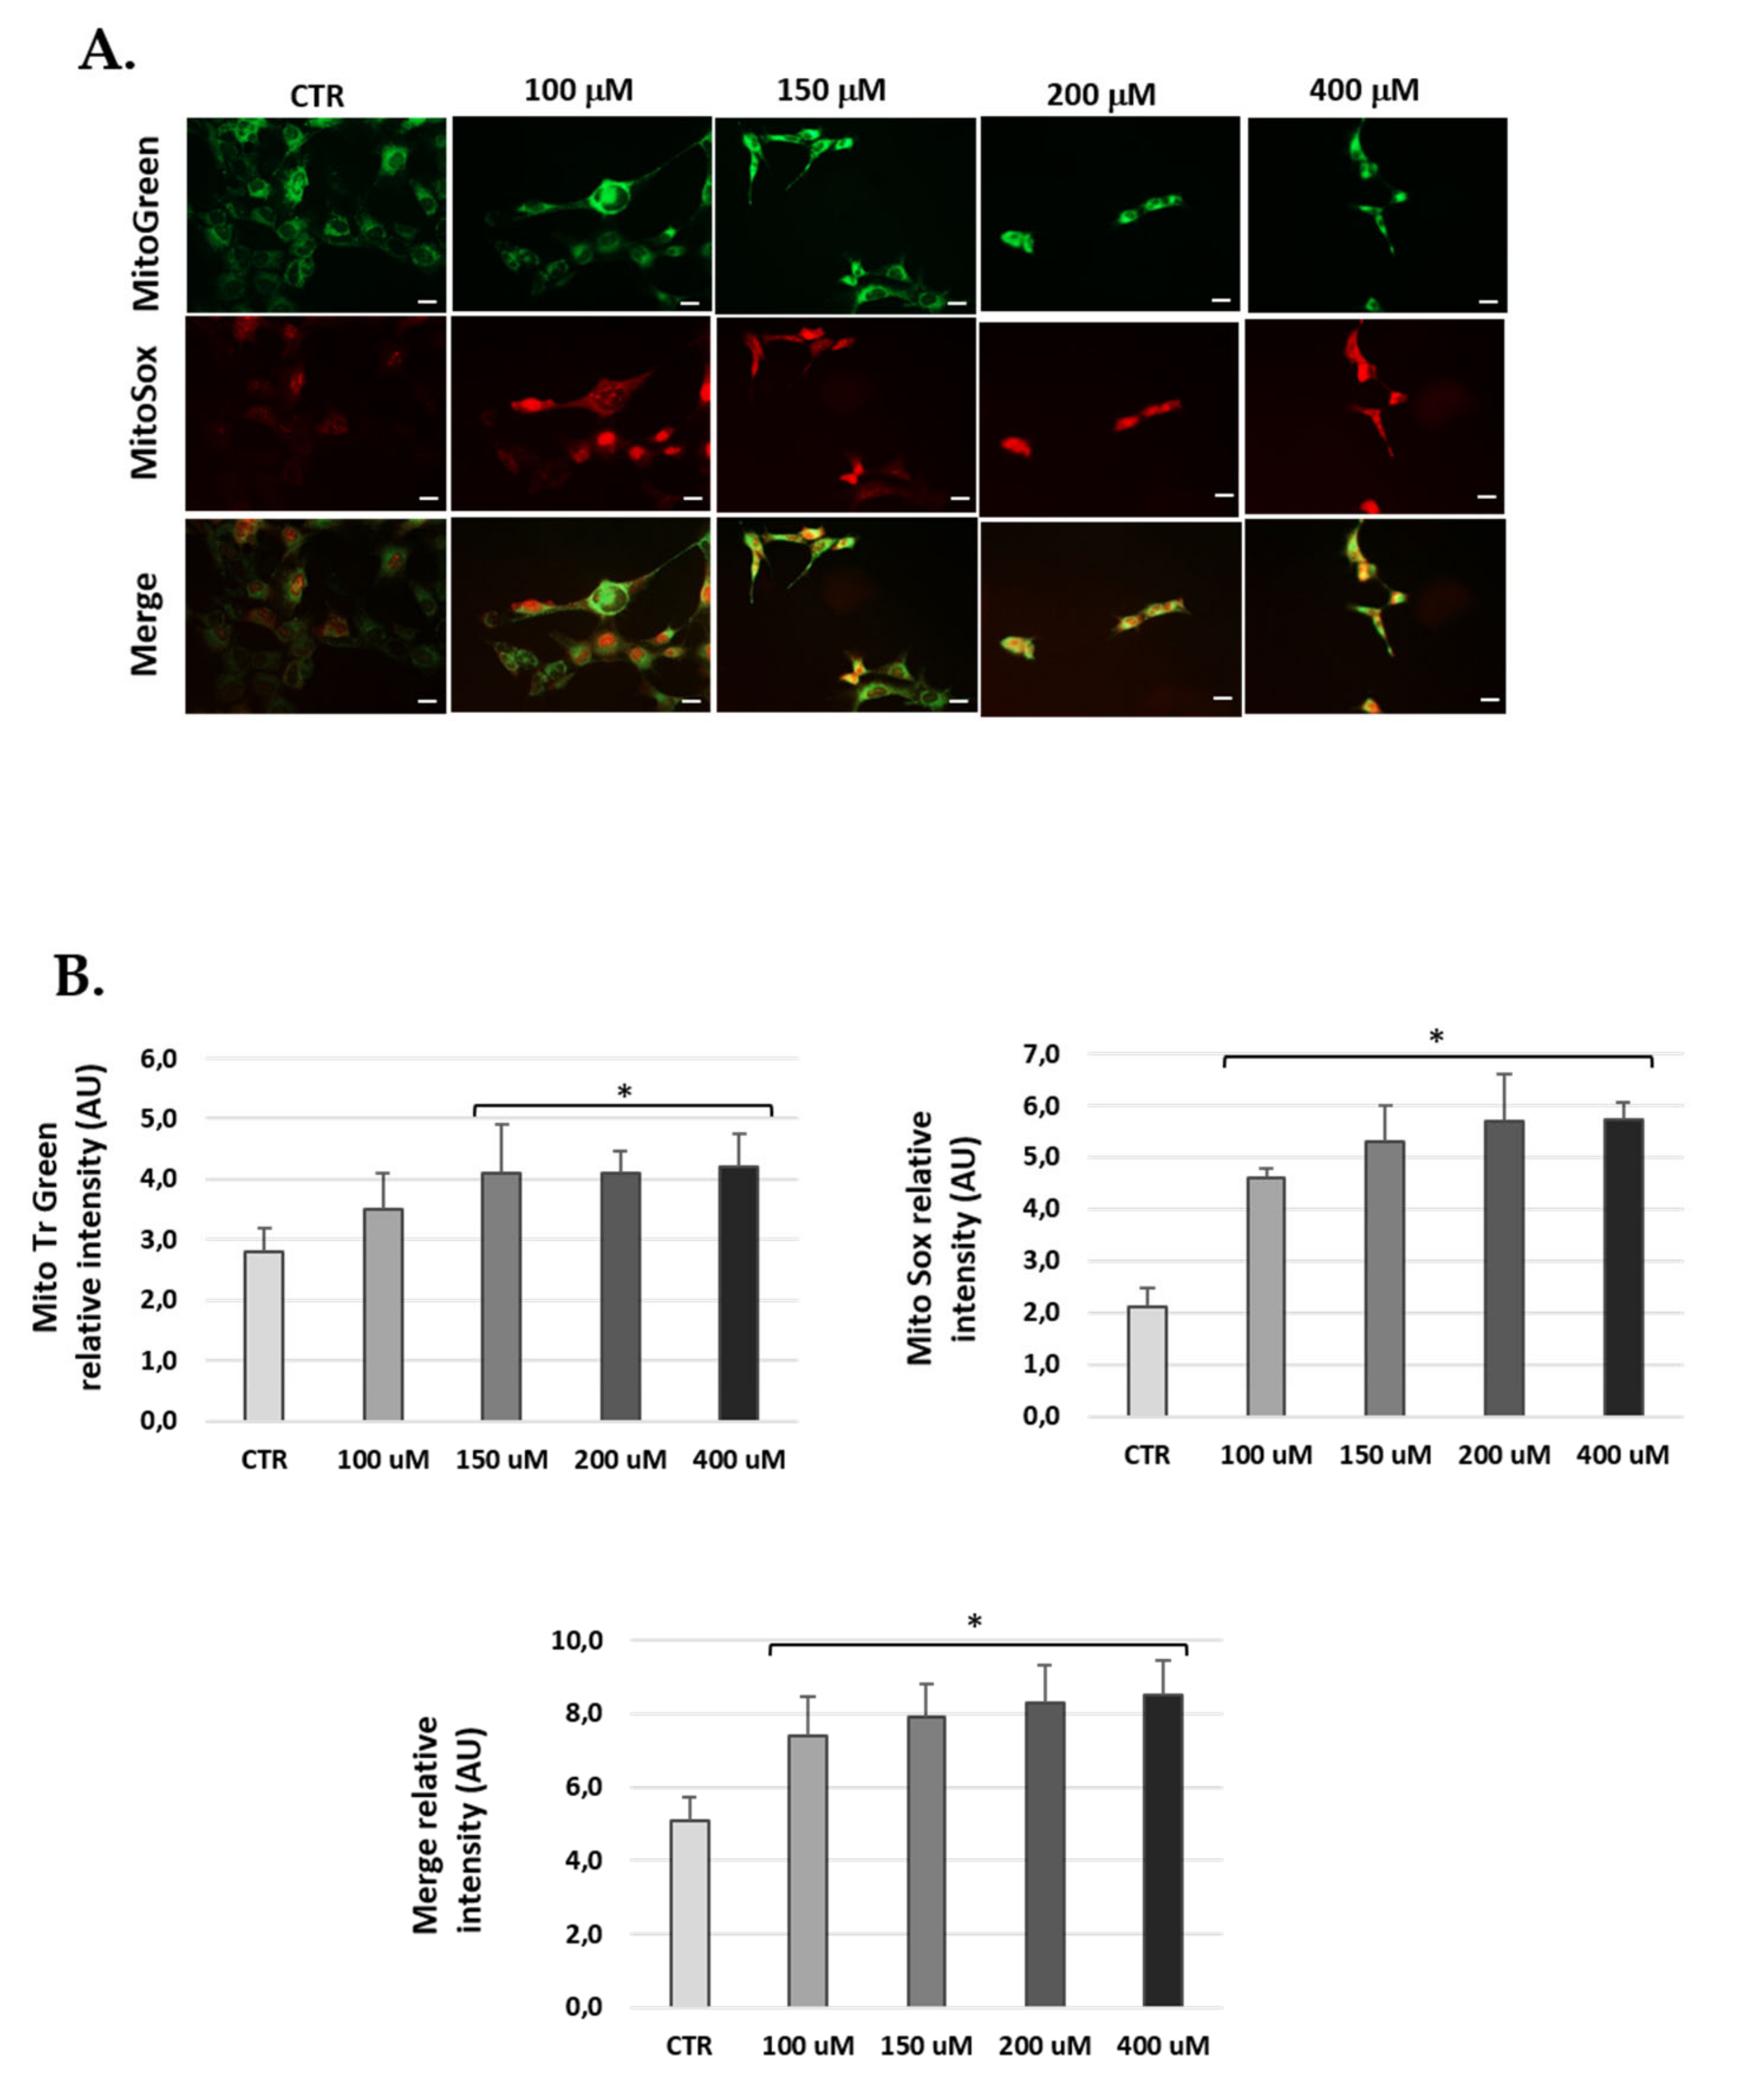
3.5. H2O2-Treatment Induced Mitochondrial ROS in Cells

H2O2-treated cells were marked with Mitotracker-Green to localize active mitochondria and control for the total amount of mitochondria, and with MitoSOX-Red to check mitochondrial ROS production. The data obtained show significantly increased ROS at 24 h H2O2 post-treatment compared to untreated conditions in the three cell lines (Figure 6, Figure 7 and Figure 8). Of note, H2O2 treatment modified the total number of mitochondria (Figure 6, Figure 7 and Figure 8). We found an increase of mitochondria in cells treated with H2O2 vs. control.

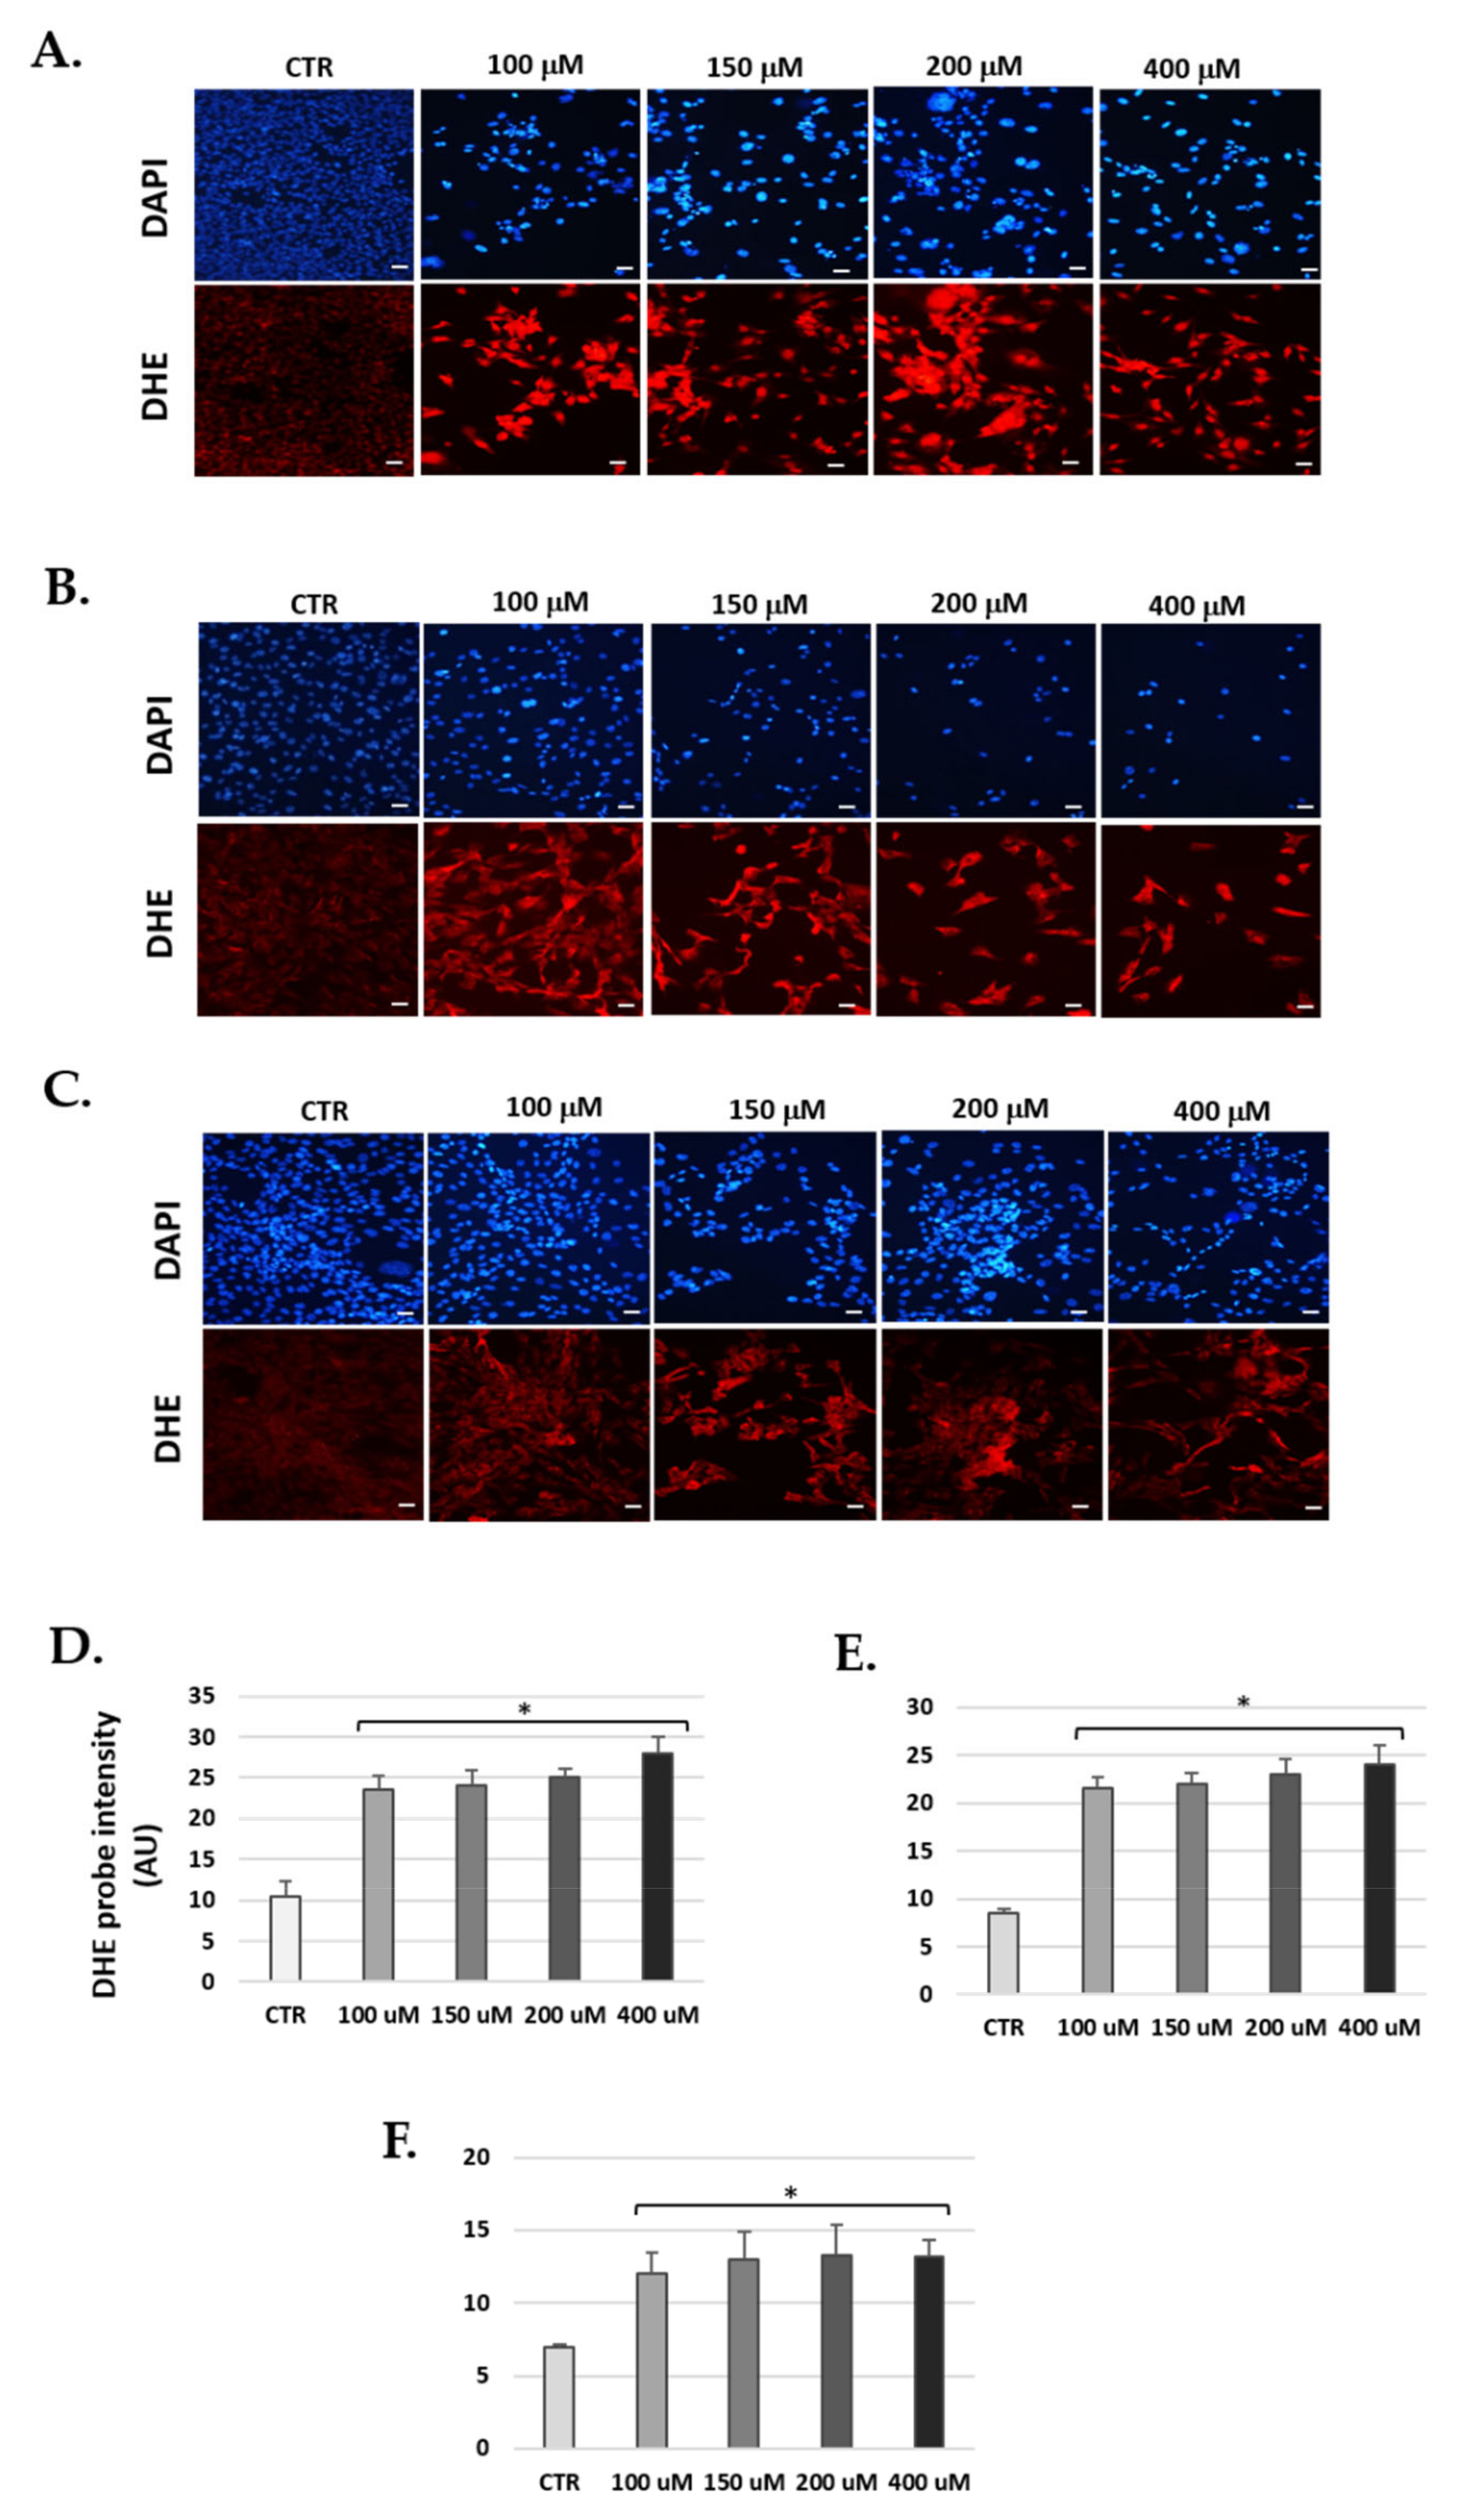
3.6. H2O2 Increase Levels of Reactive Oxygen Species

Fluorescence for an oxidized dihydroethidium (DHE) probe was used to detect ROS by visualizing the increased intensity of red fluorescence in the nuclei of cells. Cells cultured in the H2O2 groups (Figure 9) showed increased fluorescence compared to the control group. Of the three cell lines, SV-k1 cells showed lower levels of ROS than HEI-OC1 and OC-k3. Statistical significance was obtained by analyzing fluorescence using ImageJ software; thus, for HEI-OC1 cells, H2O2 showed a DHE intensity of 28.1 ± 0.6 at 400 μg/mL arbitrary units (AU) (p < 0.05) vs. the CTR group, which showed 11.0 ± 0.4 AU (Figure 9D).
ROS levels in OC-k3 cells increased to levels of 24.2 ± 0.8 AU at a concentration of 400 μg/mL, as compared to the control, which was 8.5 ± 0.2 AU (Figure 9E). In SV-k1 cells, for the concentration of 400 μg/mL, levels of 13.2 ± 0.3 AU were obtained, while for the control, the value was 7.4 ± 0.06 AU (Figure 9F).

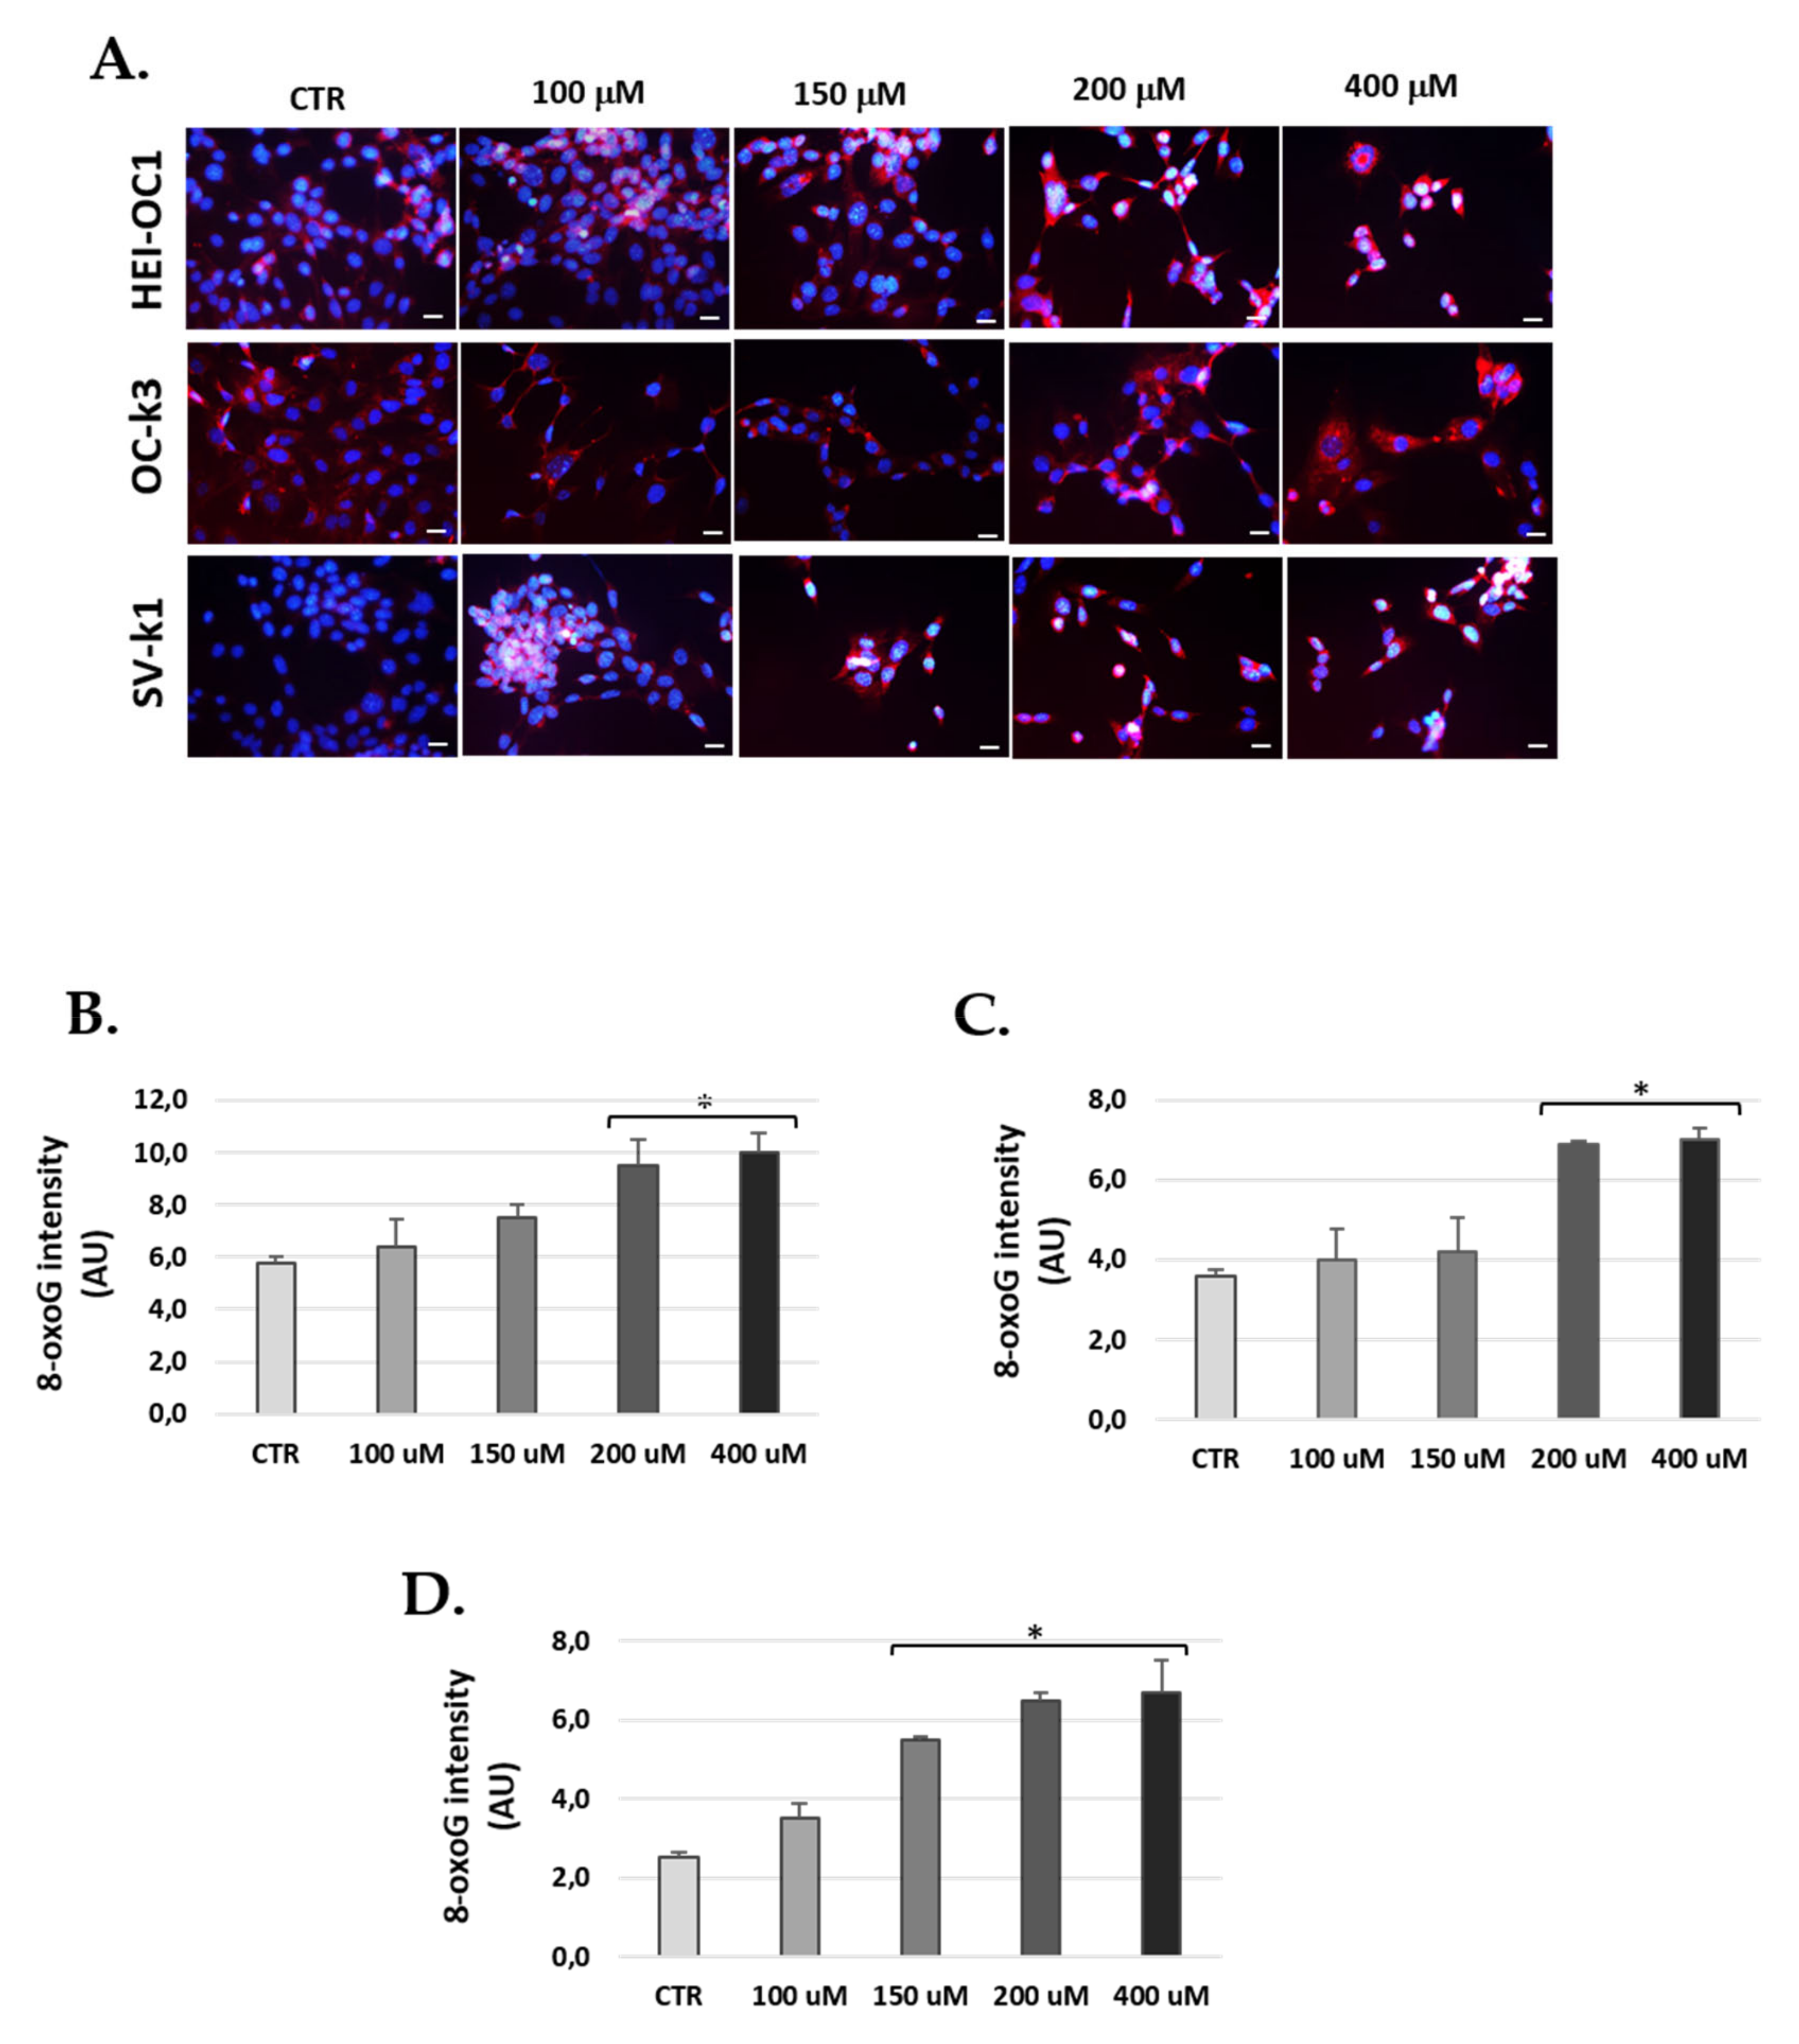
3.7. H2O2 Treatment Increased Levels of 8-Oxoguanine in Cells

Oxidative stress, which causes DNA damage through 8-oxoG formation, was measured in cells at 24 h after 1 h of H2O2 treatment (Figure 10). We did not obtain differences in nuclear 8-oxoG levels between auditory cells treated and not treated with H2O2 (Figure 10); however, we visualized that cytoplasmic 8-oxoG immunoreactivity was significantly increased in auditory cells in the presence of H2O2 (Figure 10). Previous studies have shown that 8-oxoG staining also occurs in the presence of mitochondrial RNA and DNA [42].
At 24 h post-exposure of H2O2 (1 h), the three lines of auditory cells increased 8-oxoG fluorescence intensity at the maximum concentrations of H2O2 (Figure 10). In HEI-OC1 and OC-k3 cells, treatment with H2O2 increased 8-oxoG fluorescence, but only significantly from the 200 μM concentration. In contrast, 8-oxoG staining was significantly increased from 150 μM in SV-k1 cells (Figure 10).

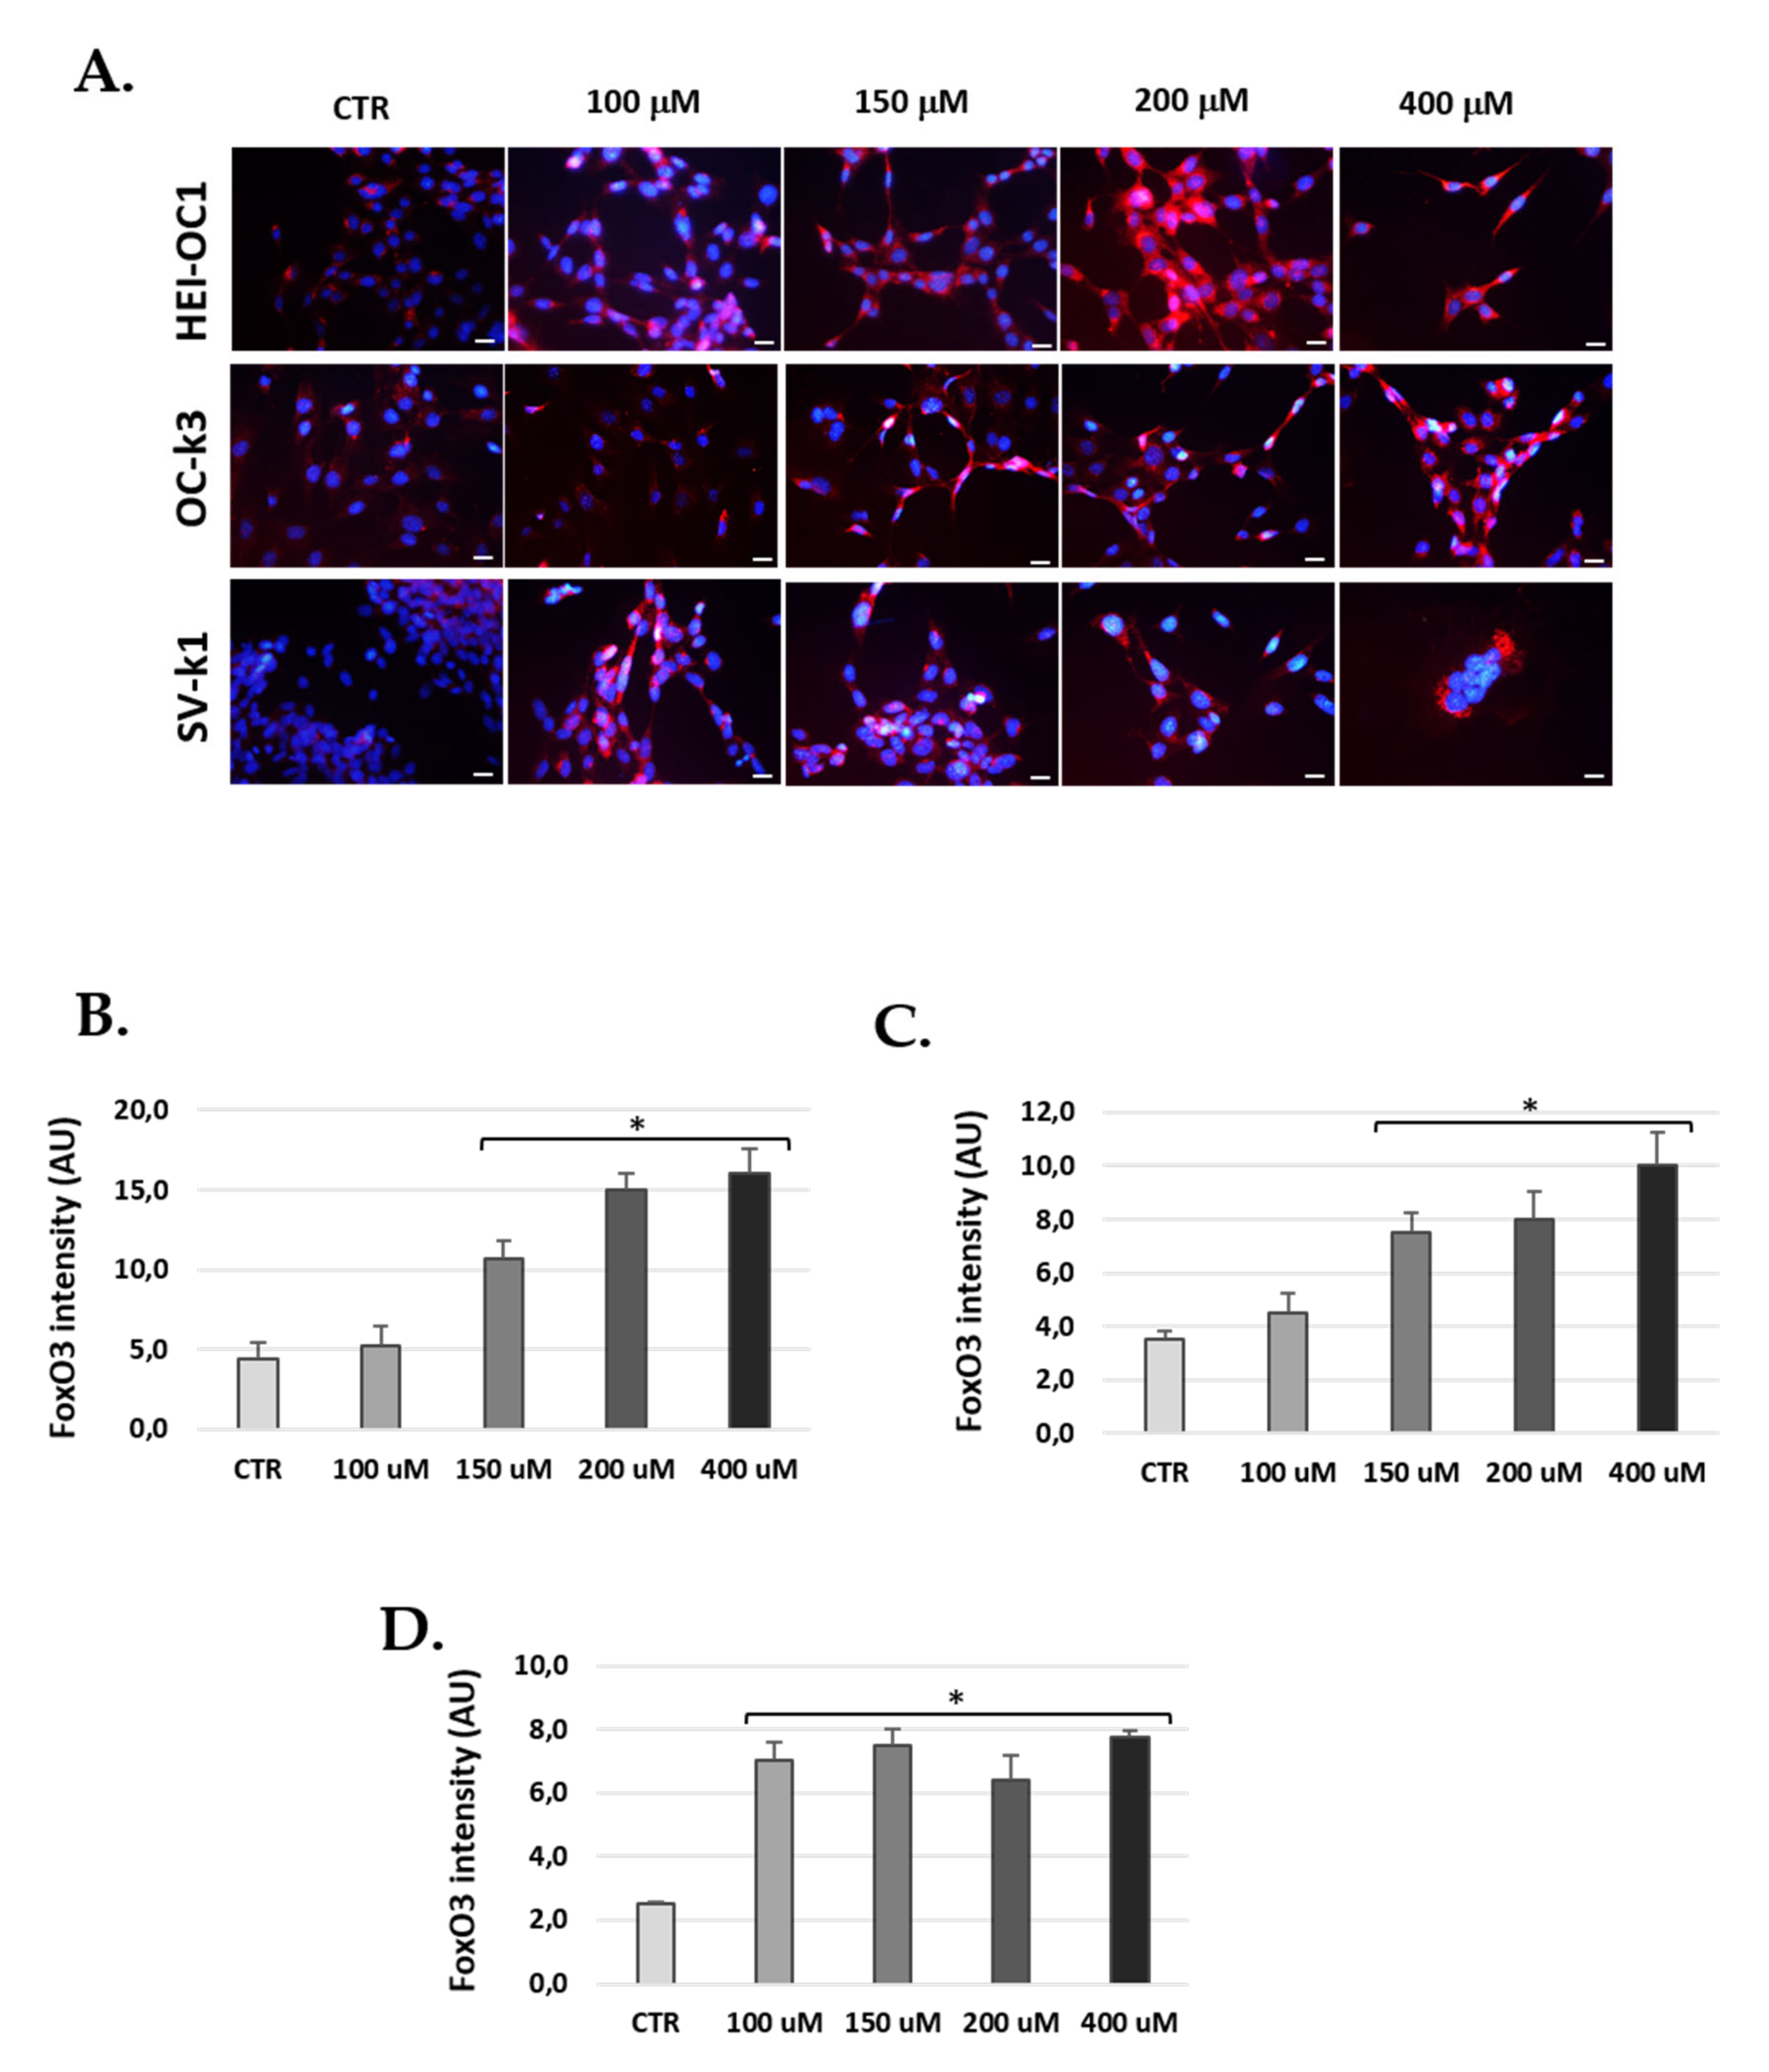
3.8. Foxo3 Increased in Cells Post H2O2 Treatments

Finally, we measured the expression of transcription factor Foxo3, because it is involved in a variety of functions, such as cellular differentiation, control of cell cycle, resistance to apoptosis and oxidative stress, and inhibition of cellular proliferation [43]. The results showed a significant increase in Foxo3 levels for cells after H2O2 treatment. In fact, we observed significant increases of Foxo3 in the cell lines HEI-OC1 and OC-k3 from the concentration of 150 µM of H2O2, while in the SV-k1 cells, it was significant from a concentration of 100 µM (Figure 11).

4. Discussion

Cellular senescence contributes to age-associated tissue damage as well as age-related pathologies, such as ARHL. The availability of valid and rapid methods to produce senescence in vitro will facilitate the investigation of the mechanisms of senescence, the susceptibility to senescence among different populations of auditory cells, and potential anti-senescence therapeutic targets. To this end, we developed an auditory cell model of senescence by using several concentrations of H2O2 as an inductor of premature senescence in HEI-OC1, OC-k3 and SV-k1 auditory cells. This study is the first to demonstrate that oxidative stress induced senescence in three types of auditory cell populations. H2O2 has been utilized to induce senescence in other cell types, such as vascular endothelial cells [44], human adult and perinatal tissue-derived stem cells [45], and HEI-OC1 cells [46,47].
In the present study, we attained exciting findings on the induction of senescence in an in vitro model with auditory cell lines from transgenic mice. These findings are as follows: 1. Cell viability is impaired in auditory cells treated with H2O2; 2. The population doubling rate decreases in auditory cells treated with H2O2; 3. β-galactosidase activity increases in auditory cells treated with H2O2; 4. There is increased mitochondrial mass and ROS overproduction post-H2O2 treatment; 5. There is an increase of 8-oxoG levels (DNA damage by oxidative stress) post-H2O2 treatment; and 6. Foxo3 levels increased in auditory cells after H2O2 treatment. Combining the above features is the best choice for detecting senescent cells, because any single feature can be found outside of senescence or may appear at different times during transformation to a senescent cell state [48,49]. No single marker that unequivocally identifies senescent cells has been identified so far [48,49].
To this end, we demonstrated that H2O2 decreased cell viability in a dose- and time-dependent manner in all three cell lines but also affected antiproliferative effects at a long time after the end of exposure (up to 24, 48, or 72 h). Our results are coherent with the decrease of cell vitality shown in human adipose tissue-derived stem cells (hASCs) and human Wharton’s jelly-derived MSCs (hWJ-MSCs) treated with concentrations of H2O2 (up to 400 µM) [45]. The obtained differences in cell viability between HEI-OC1 cells and the other two cell lines may entail the finding confirming different senescence susceptibilities. The same H2O2 concentrations markedly inhibited proliferation in HEI-OC1 cells and did not significantly affect OC-k3 and SV-k1 cells.
We also found a growth deceleration and an inability to re-seed cells treated with H2O2 at 2 and 5 mM. These results do not agree with those obtained by Tsuchihashi et al. (2015) and Lin et al. (2019), where HEI-OC1 cells exposed to 1, 2, and 5 mM H2O2 for 1 h resulted in the absence of a notable decrease in cell viability [46,47]. In our study, for the concentration of 5 mM at 1 h of treatment and 24 h to the end of treatment, cell viability was reduced below 20%. Moreover, cells treated with 50, 100, 150, 200, 400 µM and 1 mM H2O2 were able to undergo a minimum 3 passages. H2O2 exposure induced morphology changes in these cells. These results agreed with those obtained by Facchin et al. (2018), in which hASC and hWJ-MSC cells treated with H2O2 increased in size, with an increase of granules in the cytoplasm and with the ability to withstand up to 3–4 passages post- H2O2 treatment [45].
We confirmed that the population doubling rate post-H2O2 treatments in the three cells lines were significantly decreased in our model in a concentration-dependent manner. Lower rates indicate a slower cell growth rate. Our data are supported by previous reports that H2O2 concentrations (1, 2, and 5 mM) did affect the growth rate of HEI-OC1 cells treated for 1 h [46,47].
These results were confirmed by data obtained from our test of β-Galactosidase activity after 24, 48, and 72 h post-H2O2 treatment, where HEI-OC1, OC-k3, and SV-k1 cells showed a rise in β-galactosidase activity. In concrete terms, the major senescent effect was evident at 72 h for HEI-OC1 and OC-k3 cells but not for SV-k1 cells. The same trend was found in other research with different cell types, such as HEI-OC1 cells, although these results were obtained at different experimental times [46,47,50,51].
In senescent cells, not only is the cell size increased but the mitochondrial mass is also increased [52]. Previous studies have shown that an increase in mitochondrial accumulation occurs when senescence occurs in different cell types, such as fibroblasts [23], epithelial cells [53], neurons [54], or enterocytes, which develop a senescence phenotype in response to continuous DNA damage [55]. The mitochondria of senescent cells frequently show a reduced membrane potential and, simultaneously, an increased production of ROS [17,56], suggesting dysfunctionality. The present study results were consistent with these concepts, first due to the increase in the mass/number of mitochondria, and second, due to the increase in the generation of mitochondrial and intracellular ROS associated with cellular senescence. ROS occur in numerous forms, including radical hydroxyl radical species (˙OH) and superoxide anions (O2), as well as non-radical species, such as H2O2. These events are associated with the aging process in many tissues and an increase in the number of senescent cells in the same tissues [55,57]. Therefore, during the development of cellular senescence, mitochondrial dysfunction could activate different cellular signaling pathways.
ROS can induce cellular damage by damaging lipids and proteins, as well as attacking DNA directly or indirectly, leading to various pathologies, cancer, and aging [58,59]. One type of this ROS damage is the direct attack on the guanine bases of DNA, resulting in 7,8-dihydro-8-oxoguanine (8-oxoG) [60]. This change has been associated with aging, cancer, and mutagenesis. Our findings highlighted that exposure of cells to H2O2 induced high 8-oxoG levels, supporting its ability to induce oxidative DNA damage. In agreement with our results, Shen et al. [61] demonstrated that DNA damage caused by 8-oxoG to cochlear hair cells (HC) is essential for developing noise-induced hearing loss (NIHL). In addition, several studies have demonstrated the increase of 8-oxoG levels in age-related pathologies, such as Alzheimer’s, Parkinson’s, and Huntington’s disease [62,63,64]. Specifically, Leon et al. [65] showed that 8-oxoG in mitochondrial DNA, induced by oxidative stress, causes mitochondrial dysfunction and alters neuritogenesis in cultured mouse cortical neurons.
The Forkhead (Foxo) family are key regulators of longevity that promote cell survival through stress repair mechanisms [66,67]. In response to severe stress, Foxo factors can induce cell death in senescent cells, such as apoptosis by the p53 protein [68]. In this study, we found that Foxo3 levels increased predominantly in the cytoplasm of auditory cells after H2O2 treatment. In agreement with our results, Du et al. [69] demonstrated that circular Foxo3 RNA (circ-Foxo3) was highly expressed in the cytoplasm of cardiac cells from aged patients and mice and induced cellular senescence by modulating multiple stressors and senescence responses. Finally, they also showed that by silencing circ-Foxo3, they inhibited cellular senescence. Other investigations suggest that Foxo3 is related to the ROS of mitochondria in HC of the mouse cochlea. Liu et al. [70] report that neomycin-induced HC damage triggered up-regulation of Foxo3 and production of mitochondrial ROS along with low expression of antioxidant enzymes. β-catenin overexpression in HC inhibited Foxo3 expression and decreased ROS accumulation after injury by neomycin.

5. Conclusions

Our findings show, for the first time, the effect of the H2O2 treatment method in the acquisition over time of the senescence phenotype in three types of auditory cell populations. Identifying the so-called hallmarks of aging has helped develop aging research and focus on delaying different age-related pathologies by targeting the senescence process. In-depth knowledge of the senescence effect in the ARHL will help understand this disease pathogenesis and aid in the development of effective preventive and therapeutic strategies.
In summary, recent years have revealed a crucial role for senescence in the aging process. The development of powerful tools to analyze this relationship should improve our comprehension of the mechanisms through which the growth of senescent cells in organisms leads to age-related diseases. It should also contribute to the development of new therapeutic advances, which could improve the treatment of specific disorders, such as ARHL, and the general health span of aged persons.

Author Contributions

Conceptualization, C.S.-R. and L.d.M.R.-C.; methodology, C.S.-R., S.M.-R. and L.d.M.R.-C.; software, R.M.-G.; validation, C.S.-R., J.Y.-D. and J.I.R.-A.; formal analysis, C.S.-R., L.d.M.R.-C. and R.M.-G.; investigation, L.d.M.R.-C., S.M.-R. and R.M.-G.; resources, L.d.M.R.-C., S.M.-R.; data curation, L.d.M.R.-C., C.S.-R.; writing—original draft preparation, L.d.M.R.-C., S.M.-R. and R.M.-G.; writing—review and editing, C.S.-R., J.Y.-D. and J.I.R.-A.; visualization, C.S.-R.; supervision, C.S.-R. and R.S.-F.; project administration, C.S.-R. and R.S.-F.; funding acquisition, C.S.-R. and R.S.-F. All authors have read and agreed to the published version of the manuscript.

Funding

This research was funded by the Instituto de Salud Carlos III (Ministerio de Ciencia, Innovación y Universidades), grant number P19/01524.

Institutional Review Board Statement

Not applicable.

Informed Consent Statement

Not applicable.

Data Availability Statement

Data is contained within the article.

Acknowledgments

We thank Federico Kalinec (UCLA, Los Angeles, CA, USA) for providing SV-k1 auditory cells, Maria Rosa Aguilar (Department of Polymeric Nanomaterials and Biomaterials Institute of Polymer Science and Technology CSIC, Madrid, Spain) for providing HEI-OC1 auditory cells and Beatriz Duran Alonso (Institute of Molecular Biology and Genetics (IBGM), University of Valladolid, Valladolid, Spain) for providing OC-k3 auditory cells.

Conflicts of Interest

The authors declare no conflict of interest.

References

  1. Jayakody, D.M.P.; Friedland, P.L.; Martins, R.N.; Sohrabi, H.R. Impact of Aging on the Auditory System and Related Cognitive Functions: A Narrative Review. Front. Neurosci. 2018, 12, 125. [Google Scholar] [CrossRef] [PubMed]
  2. Fetoni, A.R.; Picciotti, P.M.; Paludetti, G.; Troiani, D. Pathogenesis of presbycusis in animal models: A review. Exp. Gerontol. 2011, 46, 413–425. [Google Scholar] [CrossRef]
  3. Menardo, J.; Tang, Y.; Ladrech, S.; Lenoir, M.; Casas, F.; Michel, C.; Bourien, J.; Ruel, J.; Rebillard, G.; Maurice, T.; et al. Oxidative stress, inflammation, and autophagic stress as the key mechanisms of premature age-related hearing loss in SAMP8 mouse Cochlea. Antioxid. Redox Signal. 2012, 16, 263–274. [Google Scholar] [CrossRef]
  4. Wong, A.C.; Ryan, A.F. Mechanisms of sensorineural cell damage, death and survival in the cochlea. Front. Aging Neurosci. 2015, 7, 58. [Google Scholar] [CrossRef] [PubMed]
  5. Fontana, L.; Mitchell, S.E.; Wang, B.; Tosti, V.; van Vliet, T.; Veronese, N.; Bertozzi, B.; Early, D.S.; Maissan, P.; Speakman, J.; et al. The effects of graded caloric restriction: XII. Comparison of mouse to human impact on cellular senescence in the colon. Aging Cell 2018, 17, e12746. [Google Scholar] [CrossRef] [PubMed]
  6. Muñoz-Espín, D.; Serrano, M. Cellular senescence: From physiology to pathology. Nat. Rev. Mol. Cell Biol. 2014, 15, 482–496. [Google Scholar] [CrossRef]
  7. Muñoz-Espín, D.; Cañamero, M.; Maraver, A.; Gómez-López, G.; Contreras, J.; Murillo-Cuesta, S.; Rodríguez-Baeza, A.; Varela-Nieto, I.; Ruberte, J.; Collado, M.; et al. Programmed cell senescence during mammalian embryonic development. Cell 2013, 155, 1104–1118. [Google Scholar] [CrossRef] [PubMed] [Green Version]
  8. Yu, G.; Bradley, J.D.; Attardi, L.D.; Blackburn, E.H. In vivo alteration of telomere sequences and senescence caused by mutated Tetrahymena telomerase RNAs. Nature 1990, 344, 126–132. [Google Scholar] [CrossRef]
  9. Collado, M.; Blasco, M.A.; Serrano, M. Cellular senescence in cancer and aging. Cell 2007, 130, 223–233. [Google Scholar] [CrossRef] [PubMed] [Green Version]
  10. Campisi, J.; d’Adda di Fagagna, F. Cellular senescence: When bad things happen to good cells. Nat. Rev. Mol. Cell Biol. 2007, 8, 729–740. [Google Scholar] [CrossRef] [PubMed]
  11. Liton, P.B.; Challa, P.; Stinnett, S.; Luna, C.; Epstein, D.L.; Gonzalez, P. Cellular senescence in the glaucomatous outflow pathway. Exp. Gerontol. 2005, 4, 745–748. [Google Scholar] [CrossRef] [PubMed] [Green Version]
  12. Baker, D.J.; Wijshake, T.; Tchkonia, T.; LeBrasseur, N.K.; Childs, B.G.; van de Sluis, B.; Kirkland, J.L.; van Deursen, J.M. Clearance of p16Ink4a-positive senescent cells delays ageing-associated disorders. Nature 2011, 479, 232–236. [Google Scholar] [CrossRef] [PubMed]
  13. Shimizu, I.; Yoshida, Y.; Katsuno, T.; Tateno, K.; Okada, S.; Moriya, J.; Yokoyama, M.; Nojima, A.; Ito, T.; Zechner, R.; et al. p53-induced adipose tissue inflammation is critically involved in the development of insulin resistance in heart failure. Cell Metab. 2012, 15, 51–64. [Google Scholar] [CrossRef] [Green Version]
  14. Martin, J.A.; Brown, T.D.; Heiner, A.D.; Buckwalter, J.A. Chondrocyte senescence, joint loading and osteoarthritis. Clin. Orthop. Relat. Res. 2004, 427, S96–S103. [Google Scholar] [CrossRef] [PubMed]
  15. Thangavel, C.; Dean, J.L.; Ertel, A.; Knudsen, K.E.; Aldaz, C.M.; Witkiewicz, A.K.; Clarke, R.; Knudsen, E.S. Therapeutically activating RB: Reestablishing cell cycle control in endocrine therapy-resistant breast cancer. Endocr. Relat. Cancer 2011, 18, 333–345. [Google Scholar] [CrossRef]
  16. Childs, B.G.; Durik, M.; Baker, D.J.; van Deursen, J.M. Cellular senescence in aging and age-related disease: From mechanisms to therapy. Nat. Med. 2015, 21, 1424–1435. [Google Scholar] [CrossRef] [Green Version]
  17. Passos, J.F.; Nelson, G.; Wang, C.; Richter, T.; Simillion, C.; Proctor, C.J.; Miwa, S.; Olijslagers, S.; Hallinan, J.; Wipat, A.; et al. Feedback between p21 and reactive oxygen production is necessary for cell senescence. Mol. Syst. Biol. 2010, 6, 347. [Google Scholar] [CrossRef]
  18. Acosta, J.C.; O’Loghlen, A.; Banito, A.; Guijarro, M.V.; Augert, A.; Raguz, S.; Fumagalli, M.; Da Costa, M.; Brown, C.; Popov, N.; et al. Chemokine signaling via the CXCR16 receptor reinforces senescence. Cell 2008, 133, 1006–1018. [Google Scholar] [CrossRef] [Green Version]
  19. Acosta, J.C.; Banito, A.; Wuestefeld, T.; Georgilis, A.; Janich, P.; Morton, J.P.D.; Kang, T.W.; Lasitschka, F.; Andrulis, M.; Pascual, G.; et al. A complex secretory program orchestrated by the inflammasome controls paracrine senescence. Nat. Cell Biol. 2013, 15, 978–990. [Google Scholar] [CrossRef]
  20. Nelson, G.; Wordsworth, J.; Wang, C.; Jurk, D.; Lawless, C.; Martin-Ruiz, C.; von Zglinicki, T. A senescent cell bystander effect: Senescence-induced senescence. Aging Cell 2012, 11, 345–349. [Google Scholar] [CrossRef] [Green Version]
  21. Lopez-Otin, C.; Blasco, M.A.; Partridge, L.; Serrano, M.; Kroemer, G. The hallmarks of aging. Cell 2013, 153, 1194–1217. [Google Scholar] [CrossRef] [Green Version]
  22. Finkel, T. The metabolic regulation of aging. Nat. Med. 2015, 21, 1416–1423. [Google Scholar] [CrossRef] [PubMed]
  23. Correia-Melo, C.; Marques, F.D.; Anderson, R.; Hewitt, G.; Hewitt, R.; Cole, J.; Carroll, B.M.; Miwa, S.; Birch, J.; Merz, A.; et al. Mitochondria are required for pro-ageing features of the senescent phenotype. EMBO J. 2016, 35, 724–742. [Google Scholar] [CrossRef]
  24. Wiley, C.D.; Velarde, M.C.; Lecot, P.; Liu, S.; Sarnoski, E.A.; Freund, A.; Shirakawa, K.; Lim, H.W.; Davis, S.S.; Ramanathan, A.; et al. Mitochondrial dysfunction induces senescence with a distinct secretory phenotype. Cell Metab. 2016, 23, 303–314. [Google Scholar] [CrossRef] [Green Version]
  25. Passos, J.F.; Saretzki, G.; Ahmed, S.; Nelson, G.; Richter, T.; Peters, H.; Wappler, I.; Birket, M.J.; Harold, G.; Schaeuble, K.; et al. Mitochondrial dysfunction accounts for the stochastic heterogeneity in telomere-dependent senescence. PLoS Biol. 2007, 5, e110. [Google Scholar] [CrossRef] [PubMed]
  26. Kaplon, J.; Zheng, L.; Meissl, K.; Chaneton, B.; Selivanov, V.A.; Mackay, G.; van der Burg, S.H.; Verdegaal, E.M.; Cascante, M.; Shlomi, T.; et al. A key role for mitochondrial gatekeeper pyruvate dehydrogenase in oncogene-induced senescence. Nature 2013, 498, 109–112. [Google Scholar] [CrossRef] [PubMed]
  27. Moiseeva, O.; Bourdeau, V.; Roux, A.; Deschenes-Simard, X.; Ferbeyre, G. Mitochondrial dysfunction contributes to oncogene-induced senescence. Mol. Cell Biol. 2009, 29, 4495–4507. [Google Scholar] [CrossRef] [PubMed] [Green Version]
  28. Wang, Z.; Wei, D.; Xiao, H. Methods of cellular senescence induction using oxidative stress. Methods Mol. Biol. 2013, 1048, 135–144. [Google Scholar] [CrossRef] [PubMed]
  29. Duan, J.; Duan, J.; Zhang, Z.; Tong, T. Irreversible cellular senescence induced by prolonged exposure to H2O2 involves DNA-damage-and-repair genes and telomere shortening. Int. J. Biochem. Cell Biol. 2005, 37, 1407–1420. [Google Scholar] [CrossRef]
  30. Debacq-Chainiaux, F.; Borlon, C.; Pascal, T.; Royer, V.; Eliaers, F.; Ninane, N.; Carrard, G.; Friguet, B.; de Longueville, F.; Boffe, S.; et al. Repeated exposure of human skin fibroblasts to UVB at subcytotoxic level triggers premature senescence through the TGF-beta1 signaling pathway. J. Cell Sci. 2005, 118 Pt 4, 743–758. [Google Scholar] [CrossRef] [Green Version]
  31. Dumont, P.; Chainiaux, F.; Eliaers, F.; Petropoulou, C.; Remacle, J.; Koch-Brandt, C.; Gonos, E.S.; Toussaint, O. Overexpression of apolipoprotein J in human fibroblasts protects against cytotoxicity and premature senescence induced by ethanol and tertbutylhydroperoxide. Cell Stress Chaperones 2002, 7, 23–35. [Google Scholar] [CrossRef] [Green Version]
  32. Bowl, M.R.; Dawson, S.J. Age-Related Hearing Loss. Cold Spring Harb. Perspect. Med. 2019, 1, a033217. [Google Scholar] [CrossRef] [PubMed] [Green Version]
  33. Rivolta, M.N.; Grix, N.; Lawlor, P.; Ashmore, J.F.; Jagger, D.J.; Holley, M.C. Auditory hair cell precursors immortalized from the mammalian ear. Proc. R. Soc. Lond. B 1998, 265, 1595–1603. [Google Scholar] [CrossRef] [Green Version]
  34. Kalinec, F.; Kalinec, G.; Boukhvalova, M.; Kachar, B. Establishment and characterization of conditionally immortalized organ of Corti cell lines. Cell Biol. Int. 1999, 23, 175–184. [Google Scholar] [CrossRef] [PubMed]
  35. Belyantseva, I.; Kalinec, G.M.; Kalinec, F.; Kachar, B. In vitro differentiation of two immortalized cell lines derived from the stria vascularis of a transgenic mouse. 21st Midwinter Meet. Assoc. Res. Otolaryngol. 1998, 620a. [Google Scholar]
  36. Kalinec, G.M.; Park, C.; Thein, P.; Kalinec, F. Working with Auditory HEI-OC1 Cells. J. Vis. Exp. 2016, 115, e54425. [Google Scholar] [CrossRef] [Green Version]
  37. Young, J.J.; Patel, A.; Rai, P. Suppression of thioredoxin-1 induces premature senescence in normal human fibroblasts. B Biochem. Biophys. Res. Commun. 2010, 392, 363–368. [Google Scholar] [CrossRef]
  38. Wardman, P. Fluorescent and luminescent probes for measurement of oxidative and nitrosative species in cells and tissues: Progress, pitfalls, and prospects. Free Radic. Biol. Med. 2007, 43, 995–1022. [Google Scholar] [CrossRef] [PubMed]
  39. Kalyanaramana, B.; Darley-Usmarb, V.; Daviescd, K.J.A.; Dennerye, P.A.; Formancf, H.J.; Grishamg, M.B.; Mannh, G.E.; Moorei, K.; Jackson Roberts IIj, L.; Ischiropoulose, H. Measuring reactive oxygen and nitrogen species with fluorescent probes: Challenges and limitations. Free Radic. Biol. Med. 2012, 52, 1–6. [Google Scholar] [CrossRef] [Green Version]
  40. Rodier, F.; Campisi, J. Four faces of cellular senescence. J. Cell Biol. 2011, 192, 547–556. [Google Scholar] [CrossRef]
  41. Campisi, J.; Andersen, J.K.; Kapahi, P.; Melov, S. Cellular senescence: A link between cancer and age-related degenerative disease? Semin. Cancer Biol. 2011, 21, 354–359. [Google Scholar] [CrossRef] [Green Version]
  42. Thompson, C.M.; Fedorov, Y.; Brown, D.D.; Suh, M.; Proctor, D.M.; Kuriakose, L.; Haws, L.C.; Harris, M.A. Assessment of Cr(VI)-Induced Cytotoxicity and Genotoxicity Using High Content Analysis. PLoS ONE 2012, 7, e42720. [Google Scholar] [CrossRef]
  43. Morris, B.J.; Willcox, D.C.; Donlon, T.A.; Willcox, B.J. FOXO3: A Major Gene for Human Longevity—A Mini-Review. Gerontology 2015, 61, 515–525. [Google Scholar] [CrossRef] [Green Version]
  44. Luo, Y.; Zou, P.; Zou, J.; Wang, J.; Zhou, D.; Liu, L. Autophagy regulates ROS-induced cellular senescence via p21 in a p38 MAPKα dependent manner. Exp. Gerontol. 2012, 46, 860–867. [Google Scholar] [CrossRef] [Green Version]
  45. Facchin, F.; Bianconi, E.; Romano, M.; Impellizzeri, A.; Alviano, F.; Maioli, M.; Canaider, S.; Ventura, C. Comparison of Oxidative Stress Effects on Senescence Patterning of Human Adult and Perinatal Tissue-Derived Stem Cells in Short and Long-term Cultures. Int. J. Med. Sci. 2018, 20, 1486–1501. [Google Scholar] [CrossRef] [Green Version]
  46. Tsuchihashi, N.A.; Hayashi, K.; Dan, K.; Goto, F.; Nomura, Y.; Fujioka, M.; Kanzaki, S.; Komune, S.; Ogawa, K. Autophagy through 4EBP1 and AMPK regulates oxidative stress-induced premature senescence in auditory cells. Oncotarget 2015, 6, 3644–3655. [Google Scholar] [CrossRef] [Green Version]
  47. Lin, H.; Xiong, H.; Su, Z.; Pang, J.; Lai, L.; Zhang, H.; Jian, B.; Zhang, W.; Zheng, Y. Inhibition of DRP-1-Dependent Mitophagy Promotes Cochlea Hair Cell Senescence and Exacerbates Age-Related Hearing Loss. Front. Cell Neurosci. 2019, 13, 550. [Google Scholar] [CrossRef] [Green Version]
  48. Hernandez-Segura, A.; Nehme, J.; Demaria, M. Hallmarks of Cellular Senescence. Trends Cell Biol. 2018, 28, 436–453. [Google Scholar] [CrossRef] [PubMed]
  49. Dodig, S.; Čepelak, I.; Pavić, I. Hallmarks of senescence and aging. Biochem. Med. 2019, 29, 30501. [Google Scholar] [CrossRef] [PubMed]
  50. Rajamani, K.; Lin, Y.C.; Wen, T.C.; Hsieh, J.; Subeq, Y.M.; Liu, J.W.; Lin, P.C.; Harn, H.J.; Lin, S.Z.; Chiou, T.W. The antisenescence effect of trans-cinnamaldehyde on adipose-derived stem cells. Cell Transplant. 2015, 24, 493–507. [Google Scholar] [CrossRef] [PubMed] [Green Version]
  51. Choo, K.B.; Tai, L.; Hymavathee, K.S.; Wong, C.Y.; Nguyen, P.N.; Huang, C.J.; Cheong, S.K.; Kamarul, T. Oxidative stress-induced premature senescence in Wharton’s jelly-derived mesenchymal stem cells. Int. J. Med. Sci. 2014, 11, 1201–1207. [Google Scholar] [CrossRef] [Green Version]
  52. Korolchuk, V.I.; Miwa, S.; Carroll, B.; von Zglinicki, T. Mitochondria in Cell Senescence: Is Mitophagy the Weakest Link? EBioMedicine 2017, 21, 7–13. [Google Scholar] [CrossRef] [Green Version]
  53. Hara, H.; Araya, J.; Ito, S.; Kobayashi, K.; Takasaka, N.; Yoshii, Y.; Wakui, H.; Kojima, J.; Shimizu, K.; Numata, T.; et al. Mitochondrial fragmentation in cigarette. Am. J. Physiol. Lung Cell. Mol. Physiol. 2013, 305, L737–L746. [Google Scholar] [CrossRef] [PubMed] [Green Version]
  54. Jurk, D.; Wang, C.; Miwa, S.; Maddick, M.; Korolchuk, V.; Tsolou, A.; Gonos, E.S.; Thrasivoulou, C.; Saffrey, M.J.; Cameron, K.; et al. Postmitotic neurons develop a p21-dependent senescence-like phenotype driven by a DNA damage response. Aging Cell 2012, 11, 996–1004. [Google Scholar] [CrossRef] [Green Version]
  55. Jurk, D.; Wilson, C.; Passos, J.F.; Oakley, F.; Correia-Melo, C.; Greaves, L.; Saretzki, G.; Fox, C.; Lawless, C.; Anderson, R.; et al. Chronic inflammation induces telomere dysfunction and accelerates ageing in mice. Nat. Commun. 2014, 2, 4172. [Google Scholar] [CrossRef] [PubMed]
  56. Tai, H.; Wang, Z.; Gong, H.; Han, X.; Zhou, J.; Wang, X.; Wei, X.; Ding, Y.; Huang, N.; Qin, J.; et al. Autophagy impairment with lysosomal and mitochondrial dysfunction is an important characteristic of oxidative stress-induced senescence. Autophagy 2017, 13, 99–113. [Google Scholar] [CrossRef] [PubMed] [Green Version]
  57. Wang, C.; Jurk, D.; Maddick, M.; Nelson, G.; Martin-Ruiz, C.; Von Zglinicki, T. DNA damage response and cellular senescence in tissues of aging mice. Aging Cell 2009, 8, 311–323. [Google Scholar] [CrossRef] [PubMed]
  58. Cooke, M.S.; Olinski, R.; Evans, M.D. Does measurement of oxidative damage to DNA have clinical significance? Clin. Chim. Acta 2006, 365, 30–49. [Google Scholar] [CrossRef] [PubMed]
  59. Ray, P.D.; Huang, B.W.; Tsuji, Y. Reactive oxygen species (ROS) homeostasis and redox regulation in cellular signaling. Cell Signal. 2012, 24, 981–990. [Google Scholar] [CrossRef] [Green Version]
  60. Beard, W.A.; Batra, V.K.; Wilson, S.H. DNA polymerase structure-based insight on the mutagenic properties of 8-oxoguanine. Mutat. Res. 2010, 703, 18–23. [Google Scholar] [CrossRef] [Green Version]
  61. Shen, H.; Cao, J.; Hong, Z.; Liu, K.; Shi, J.; Ding, L.; Zhang, H.; Du, C.; Li, Q.; Zhang, Z.; et al. A functional Ser326Cys polymorphism in hOGG1 is associated with noise-induced hearing loss in a Chinese population. PLoS ONE 2014, 9, e89662. [Google Scholar] [CrossRef] [PubMed] [Green Version]
  62. Bradley-Whitman, M.A.; Timmons, M.D.; Beckett, T.L.; Murphy, M.P.; Lynn, B.C.; Lovell, M.A. Nucleic acid oxidation: An early feature of Alzheimer’s disease. J. Neurochem. 2014, 128, 294–304. [Google Scholar] [CrossRef] [PubMed] [Green Version]
  63. Shimura-Miura, H.; Hattori, N.; Kang, D.; Miyako, K.; Nakabeppu, Y.; Mizuno, Y. Increased 8-oxo-dGTPase in the mitochondria of substantia nigral neurons in Parkinson’s disease. Ann. Neurol. 1999, 46, 920–924. [Google Scholar] [CrossRef]
  64. Siddiqui, A.; Rivera-Sánchez, S.; Castro Mdel, R.; Acevedo-Torres, K.; Rane, A.; Torres-Ramos, C.A.; Nicholls, D.G.; Andersen, J.K.; Ayala-Torres, S. Mitochondrial DNA damage is associated with reduced mitochondrial bioenergetics in Huntington’s disease. Free Radic. Biol. Med. 2012, 53, 1478–1488. [Google Scholar] [CrossRef] [PubMed] [Green Version]
  65. Leon, J.; Sakumi, K.; Castillo, E.; Sheng, Z.; Oka, S.; Nakabeppu, Y. 8-Oxoguanine accumulation in mitochondrial DNA causes mitochondrial dysfunction and impairs neuritogenesis in cultured adult mouse cortical neurons under oxidative conditions. Sci. Rep. 2016, 6, 22086. [Google Scholar] [CrossRef] [Green Version]
  66. Martins, R.; Lithgow, G.J.; Link, W. Long live FOXO: Unraveling the role of FOXO proteins in aging and longevity. Aging Cell 2016, 15, 196–207. [Google Scholar] [CrossRef]
  67. Salih, D.A.; Brunet, A. FoxO transcription factors in the maintenance of cellular homeostasis during aging. Curr. Opin. Cell Biol. 2008, 20, 126–136. [Google Scholar] [CrossRef] [PubMed] [Green Version]
  68. Baar, M.P.; Brandt, R.M.C.; Putavet, D.A.; Klein, J.D.D.; Derks, K.W.J.; Bourgeois, B.R.M.; Stryeck, S.; Rijksen, Y.; van Willigenburg, H.; Feijtel, D.A.; et al. Targeted apoptosis of senescent cells restores tissue homeostasis in response to chemotoxicity and aging. Cell 2017, 169, 132–147.e16. [Google Scholar] [CrossRef] [Green Version]
  69. Du, W.W.; Yang, W.; Chen, Y.; Wu, Z.K.; Foster, F.S.; Yang, Z.; Li, X.; Yang, B.B. Foxo3 circular RNA promotes cardiac senescence by modulating multiple factors associated with stress and senescence responses. Eur. Heart J. 2017, 7, 1402–1412. [Google Scholar] [CrossRef] [Green Version]
  70. Liu, L.; Chen, Y.; Qi, J.; Zhang, Y.; He, Y.; Ni, W.; Li, W.; Zhang, S.; Sun, S.; Taketo, M.M.; et al. Wnt activation protects against neomycin-induced hair cell damage in the mouse cochlea. Cell Death Dis. 2016, 10, e2136. [Google Scholar] [CrossRef] [PubMed] [Green Version]
Figure 1. Comprehensive overview of the experimental timeline and procedures.
Antioxidants 10 01497 g001
Figure 2. H2O2 decreases the viability of cells. Experimental conditions: untreated cells are control (CTR) and H2O2 concentrations are as follows: 50, 100, 150, 200 and 400 μM, and 1, 2 and 5 mM, for 1 and 2 h. Cell viability was measured by PrestoBlue assay in cells after the end of the H2O2 treatments at 24, 48 and 72 h. (A) HEI-OC1 cells; (B) OC-k3 cells; and (C) SV-k1 cells. Data represent means ± SD (n = 3). * p < 0.05 vs. CTR group.
Antioxidants 10 01497 g002
Figure 3. Morphological changes and capacity of cells to reseed post-H2O2 treatments. Representative images of morphological changes of cells after replated at 72 h post-treatment: control (CTR) cells and cells treated with H2O2 50, 100, 150, 200 and 400 μM and 1, 2 and 5 mM for 1 h. (A) HEI-OC1 cell line; (B) OC-k3 cell line; and (C) SV-k1 cell line. Cells were observed (at 40×) with the Olympus CKX41 microscope and the coupled cellSens Entry imaging system. Scale bars: 100 μm.
Antioxidants 10 01497 g003
Figure 4. H2O2 induces early senescence in cells. (A) Representative imaging of SA-β-gal staining corresponding to HEI-OC1, OC-k3, and SV-k1 cells, treated with H2O2 50, 200 mM and 1 mM for 1 h and 24 h post-treatment; (BD) Percentage of SA-β-gal-stained auditory cells treated with H2O2 50, 100, 150, 200, 400 μM and 1 and 2 mM for 1 h and 24, 48 and 72 h post-treatment. Data represent the means ± SD (n = 3). * p < 0.05 vs. CTR group.
Antioxidants 10 01497 g004
Figure 5. Decrease in population doubling rate in cells post-H2O2 treatment. Population doubling experiments were performed post-H2O2 treatments with 50, 100, 150, 200 and 400 μM H2O2 for 1 h. (A) HEI-OC1 cell line; (B) OC-k3 cell line; and (C) SV-k1 cell line. All values are means ± SD (n = 3). *p < 0.05 vs. CTR group.
Antioxidants 10 01497 g005
Figure 6. Mitochondria-derived ROS production in HEI-OC1 cells post-H2O2 treatment. (A) Representative fluorescence micrographs of MitoTracker Green, MitoSOX red and merge (yellow) in HEI-OC1 cells treated with 100, 150, 200 and 400 μM H2O2 for 1 h and 24 h post-treatment. (B) The graphs show the fluorescence intensity obtained by the ImageJ program. Data represent the mean ± SD of arbitrary units (AU) (n = 3). * p < 0.05 vs. CTR (n = 3).
Antioxidants 10 01497 g006
Figure 7. Mitochondria-derived ROS production in OC-k3 cells post-H2O2 treatment. (A) Representative fluorescence micrographs of MitoTracker Green, MitoSOX red and merge (yellow) in OC-k3 cell treated with 100, 150, 200 and 400 μM H2O2 for 1 h and 24 h post-treatment. (B) The graphs show the fluorescence intensity obtained by the ImageJ program. Data represent the mean ± SD of arbitrary units (AU) (n = 3). * p < 0.05 vs. CTR (n = 3).
Antioxidants 10 01497 g007
Figure 8. Mitochondria-derived ROS production in SV-k1 cells post-H2O2 treatment. (A) Representative fluorescence micrographs of MitoTracker Green, MitoSOX red and merge (yellow) in SV-k1 cell treated with 100, 150, 200 and 400 μM H2O2 for 1 h and 24 h post-treatment. (B) The graphs show the fluorescence intensity obtained by the ImageJ program. Data represent the mean ± SD of arbitrary units (AU) (n = 3). * p < 0.05 vs. CTR (n = 3).
Antioxidants 10 01497 g008
Figure 9. H2O2 increases the production of ROS in cells. Representative images of fluorescence micrographs of (A) HEI-OC1, (B) OC-k3 and (C) SV-k1 cells (×40). Scale bar 100 μm. (n = 4). ROS detection with probe DHE (red fluorescence), and DAPI dye (a marker of cell nuclei with blue fluorescence) in cell cultures at 24 h post-H2O2 treatment. Experimental groups: CTR (control); 100, 150, 200 and 400 μM for 1 h. (DF) Quantification of fluorescence intensity was performed by ImageJ program. (D) HEI-OC1, (E) OC-k3 and (F) SV-k1 cells. Graphs represent the mean ± SD of arbitrary units (AU). * p < 0.05 vs. CTR. (n = 4).
Antioxidants 10 01497 g009
Figure 10. H2O2 increase production of 8-oxoG in cells. (A) Representative images of immunostaining of 8-oxoG in cell cultures treated with 100, 150, 200 and 400 μM H2O2 for 1 h and 24 h post-H2O2 treatment. DAPI: blue fluorescence (nuclei marker) and 8-oxoG immunoreactivity: red fluorescence. Scale bar: 100 μm. (BD) Bar graphs show the immunofluorescence intensity changes calculated by ImageJ. (B) HEI-OC1, (C) OC-k3 and (D) SV-k1 cells. The values represent the mean ± SD (n = 3). * p < 0.05 vs. CTR (n = 4).
Antioxidants 10 01497 g010
Figure 11. H2O2 increased production of Foxo3 in cells. (A) Representative images of immunostaining of Foxo3 in cells cultures treated with 100, 150, 200 and 400 μM H2O2 for 1 h and 24 h post-H2O2 treatment. DAPI: blue fluorescence (nuclei marker) and Foxo3 immunoreactivity: red fluorescence. Scale bar: 100 μm. (BD) Bar graphs show the immunoflu-orescence intensity changes calculated by ImageJ. (B) HEI-OC1, (C) OC-k3 and (D) SV-k1 cells. The values represent the mean ± SD (n = 3). * p < 0.05 vs. CTR (n = 4).
Antioxidants 10 01497 g011
Publisher’s Note: MDPI stays neutral with regard to jurisdictional claims in published maps and institutional affiliations.

