
An Exploration of the Effects of an Early Postpartum Intravenous Infusion with Carnosic Acid on Physiological Responses of Transition Dairy Cows


Abstract
:1. Introduction
2. Materials and Methods
2.1. Experimental Design and Treatments
2.2. Animal Management
2.3. Blood Collection and Analyses
2.4. Milk and Feed Samples
2.5. Statistical Analysis
3. Results
3.1. Peripartal DMI, BW, and BCS
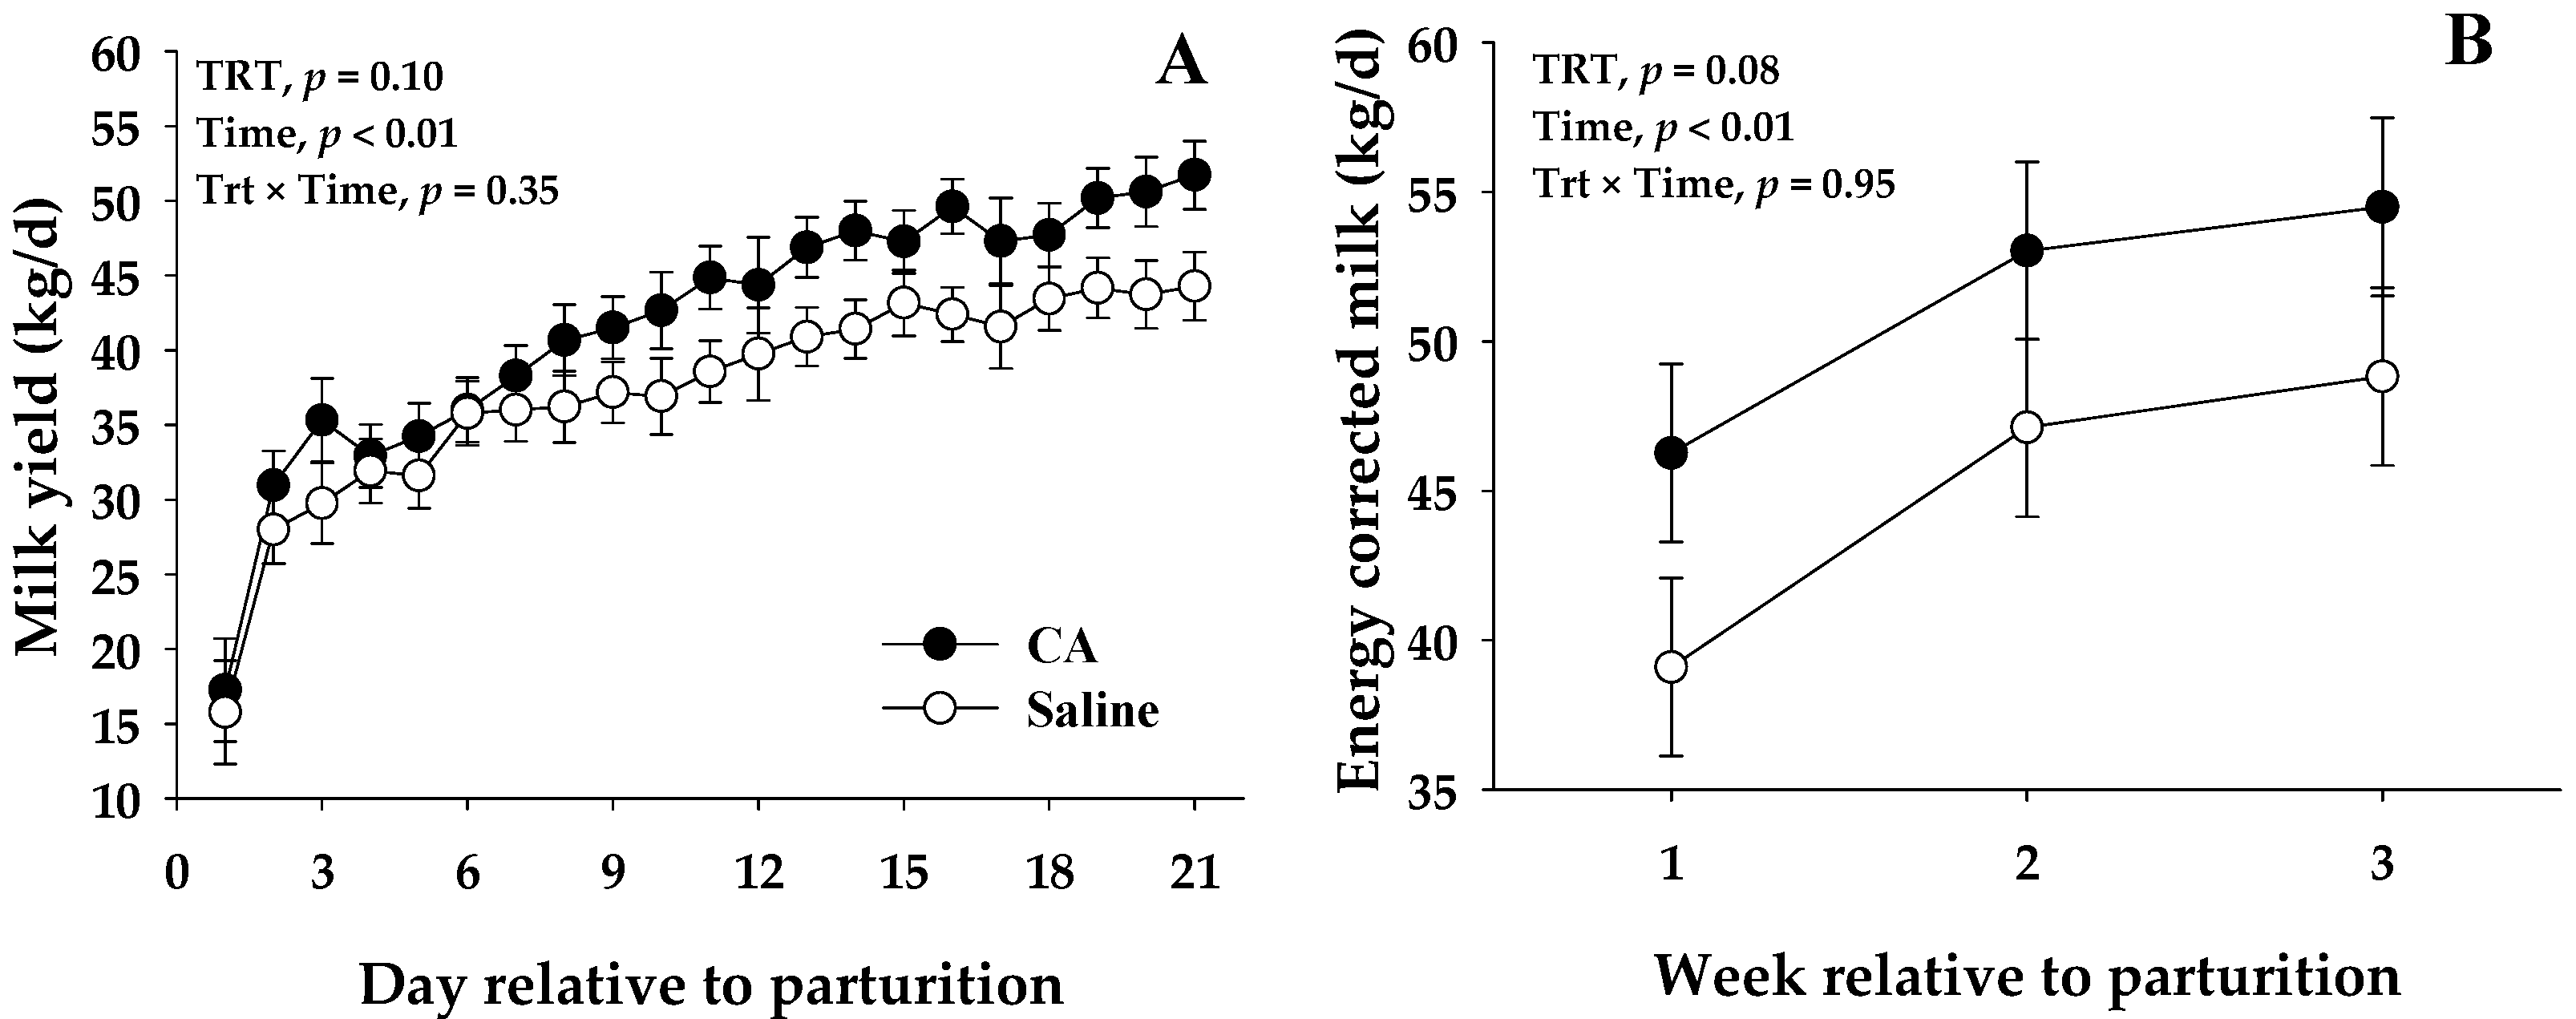
3.2. Milk Production and Composition
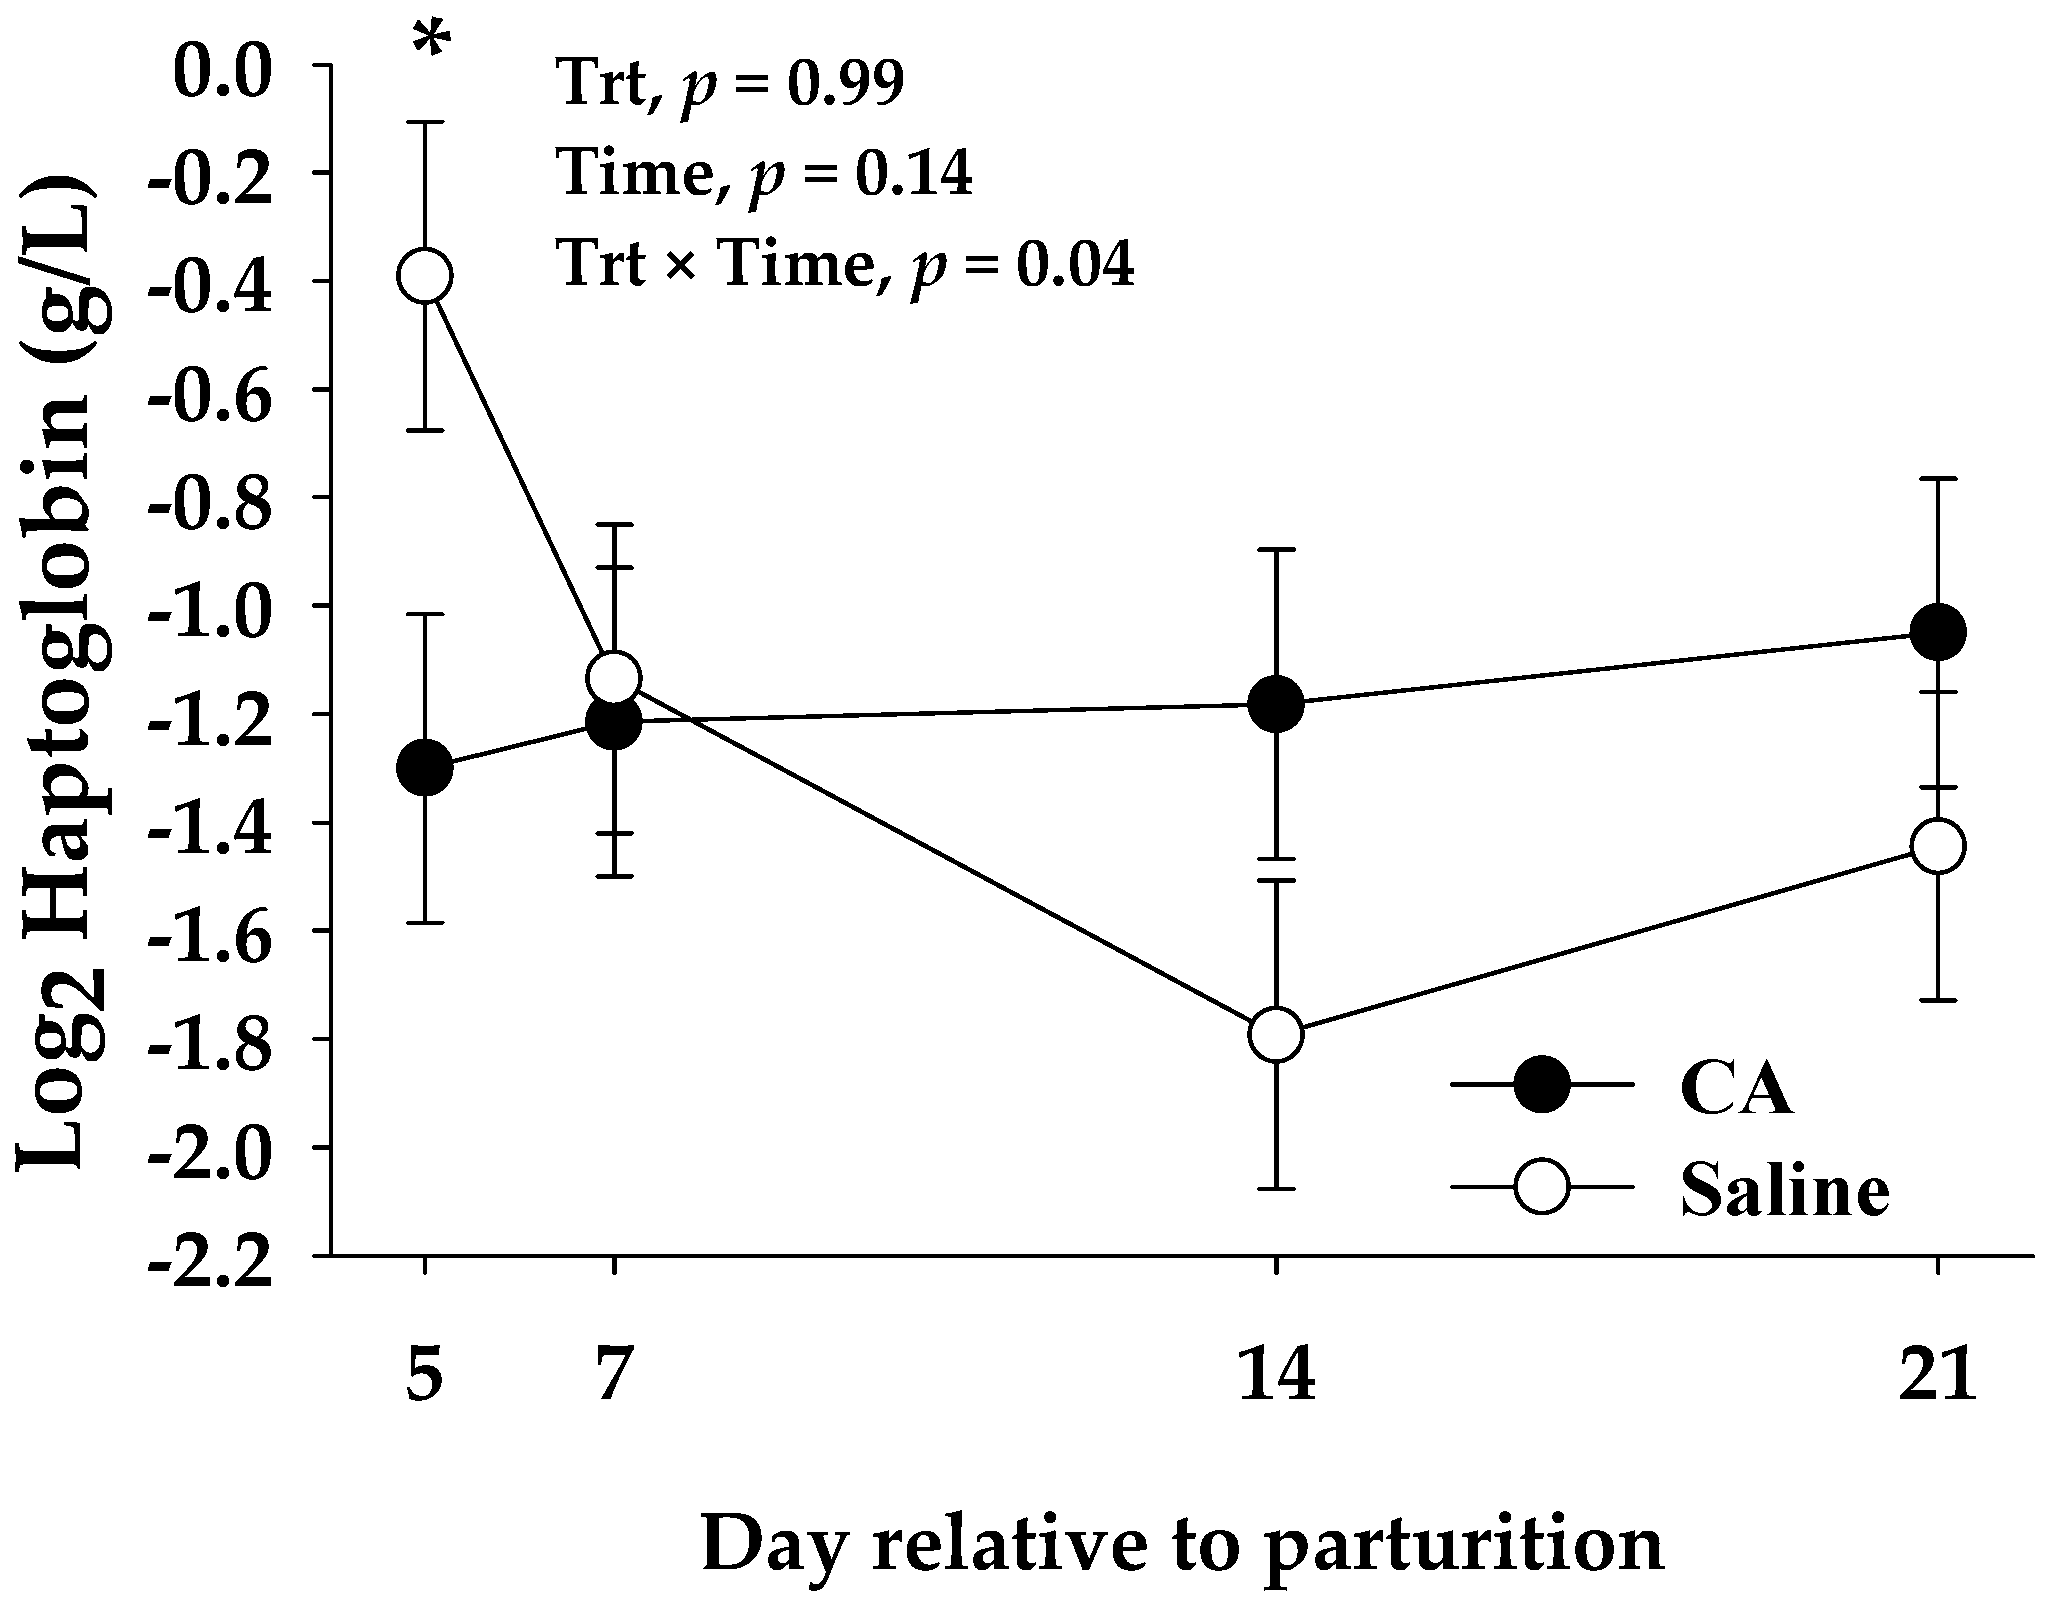
3.3. Blood Biomarkers
4. Discussion
4.1. Performance Parameters
4.2. Inflammation and Liver Function
4.3. Oxidative Stress
5. Conclusions
Supplementary Materials
Author Contributions
Funding
Institutional Review Board Statement
Informed Consent Statement
Data Availability Statement
Acknowledgments
Conflicts of Interest
References
- LeBlanc, S.J.; Lissemore, K.D.; Kelton, D.F.; Duffield, T.F.; Leslie, K.E. Major advances in disease prevention in dairy cattle. J. Dairy Sci. 2006, 89, 1267–1279. [Google Scholar] [CrossRef] [Green Version]
- Sordillo, L.M.; Aitken, S.L. Impact of oxidative stress on the health and immune function of dairy cattle. Vet. Immunol. Immunopathol. 2009, 128, 104–109. [Google Scholar] [CrossRef]
- Drackley, J.K. Biology of Dairy Cows During the Transition Period: The Final Frontier? J. Dairy Sci. 1999, 82, 2259–2273. [Google Scholar] [CrossRef]
- Bertoni, G.; Trevisi, E. Use of the liver activity index and other metabolic variables in the assessment of metabolic health in dairy herds. Vet. Clin. North Am. Food Anim. Pract. 2013, 29, 413–431. [Google Scholar] [CrossRef]
- Trevisi, E.; Minuti, A. Assessment of the innate immune response in the periparturient cow. Res. Vet. Sci. 2018, 116, 47–54. [Google Scholar] [CrossRef]
- Kehrli, M.E., Jr.; Nonnecke, B.J.; Roth, J.A. Alterations in bovine lymphocyte function during the periparturient period. Am. J. Vet. Res. 1989, 50, 215–220. [Google Scholar]
- Kehrli, M.E., Jr.; Nonnecke, B.J.; Roth, J.A. Alterations in bovine neutrophil function during the periparturient period. Am. J. Vet. Res. 1989, 50, 207–214. [Google Scholar] [PubMed]
- Mezzetti, M.; Minuti, A.; Piccioli-Cappelli, F.; Amadori, M.; Bionaz, M.; Trevisi, E. The role of altered immune function during the dry period in promoting the development of subclinical ketosis in early lactation. J. Dairy Sci. 2019, 102, 9241–9258. [Google Scholar] [CrossRef] [PubMed]
- Hayirli, A.; Grummer, R.R. Factors affecting dry matter intake prepartum in relationship to etiology of peripartum lipid-related metabolic disorders: A review. Can. J. Anim. Sci. 2004, 84, 337–347. [Google Scholar] [CrossRef]
- Contreras, G.A.; Sordillo, L.M. Lipid mobilization and inflammatory responses during the transition period of dairy cows. Comp. Immunol. Microbiol. Infect. Dis. 2011, 34, 281–289. [Google Scholar] [CrossRef]
- Abuelo, A.; Hernandez, J.; Benedito, J.L.; Castillo, C. The importance of the oxidative status of dairy cattle in the periparturient period: Revisiting antioxidant supplementation. J. Anim. Physiol. Anim. Nutr. 2015, 99, 1003–1016. [Google Scholar] [CrossRef] [PubMed]
- Nelson, D.L. Lehninger Principles of Biochemistry, 4th ed.; W.H. Freeman: New York, NY, USA, 2005. [Google Scholar]
- McArt, J.A.; Nydam, D.V.; Oetzel, G.R.; Overton, T.R.; Ospina, P.A. Elevated non-esterified fatty acids and beta-hydroxybutyrate and their association with transition dairy cow performance. Vet. J. 2013, 198, 560–570. [Google Scholar] [CrossRef] [PubMed]
- Ospina, P.A.; Nydam, D.V.; Stokol, T.; Overton, T.R. Evaluation of nonesterified fatty acids and beta-hydroxybutyrate in transition dairy cattle in the northeastern United States: Critical thresholds for prediction of clinical diseases. J. Dairy Sci. 2010, 93, 546–554. [Google Scholar] [CrossRef] [PubMed]
- Gross, J.J.; Schwarz, F.J.; Eder, K.; van Dorland, H.A.; Bruckmaier, R.M. Liver fat content and lipid metabolism in dairy cows during early lactation and during a mid-lactation feed restriction. J. Dairy Sci. 2013, 96, 5008–5017. [Google Scholar] [CrossRef] [PubMed] [Green Version]
- Sordillo, L.M.; Raphael, W. Significance of metabolic stress, lipid mobilization, and inflammation on transition cow disorders. Vet. Clin. North Am. Food Anim. Pract. 2013, 29, 267–278. [Google Scholar] [CrossRef]
- Halliwell, B. Biochemistry of oxidative stress. Biochem. Soc. Trans. 2007, 35, 1147–1150. [Google Scholar] [CrossRef]
- Mavangira, V.; Sordillo, L.M. Role of lipid mediators in the regulation of oxidative stress and inflammatory responses in dairy cattle. Res. Vet. Sci. 2018, 116, 4–14. [Google Scholar] [CrossRef] [PubMed]
- Abuelo, A.; Hernandez, J.; Benedito, J.L.; Castillo, C. Association of oxidative status and insulin sensitivity in periparturient dairy cattle: An observational study. J Anim Physiol Anim Nutr (Berl) 2016, 100, 279–286. [Google Scholar] [CrossRef]
- Bernabucci, U.; Ronchi, B.; Lacetera, N.; Nardone, A. Influence of Body Condition Score on Relationships Between Metabolic Status and Oxidative Stress in Periparturient Dairy Cows. J. Dairy Sci. 2005, 88, 2017–2026. [Google Scholar] [CrossRef] [Green Version]
- NRC. Nutrient Requirements of Dairy Cattle, 7th Revised Edition, 2001; The National Academies Press: Washington DC, USA, 2001; p. 405. [Google Scholar]
- Abuelo, A.; Hernandez, J.; Benedito, J.L.; Castillo, C. Redox Biology in Transition Periods of Dairy Cattle: Role in the Health of Periparturient and Neonatal Animals. Antioxidants 2019, 8, 20. [Google Scholar] [CrossRef] [PubMed] [Green Version]
- Spears, J.W.; Weiss, W.P. Role of antioxidants and trace elements in health and immunity of transition dairy cows. Vet. J. 2008, 176, 70–76. [Google Scholar] [CrossRef] [PubMed]
- Yang, C.; Chowdhury, M.A.; Huo, Y.; Gong, J. Phytogenic compounds as alternatives to in-feed antibiotics: Potentials and challenges in application. Pathogens 2015, 4, 137–156. [Google Scholar] [CrossRef] [PubMed] [Green Version]
- Ciampi, F.; Sordillo, L.M.; Gandy, J.C.; Caroprese, M.; Sevi, A.; Albenzio, M.; Santillo, A. Evaluation of natural plant extracts as antioxidants in a bovine in vitro model of oxidative stress. J. Dairy Sci. 2020, 103, 8938–8947. [Google Scholar] [CrossRef]
- Lopreiato, V.; Mezzetti, M.; Cattaneo, L.; Ferronato, G.; Minuti, A.; Trevisi, E. Role of nutraceuticals during the transition period of dairy cows: A review. J. Anim. Sci. Biotechnol. 2020, 11, 96. [Google Scholar] [CrossRef]
- Bhagat, A.R.; Delgado, A.M.; Issaoui, M.; Chammem, N.; Fiorino, M.; Pellerito, A.; Natalello, S. Review of the Role of Fluid Dairy in Delivery of Polyphenolic Compounds in the Diet: Chocolate Milk, Coffee Beverages, Matcha Green Tea, and Beyond. J AOAC Int 2019, 102, 1365–1372. [Google Scholar] [CrossRef]
- Birtic, S.; Dussort, P.; Pierre, F.X.; Bily, A.C.; Roller, M. Carnosic acid. Phytochemistry 2015, 115, 9–19. [Google Scholar] [CrossRef] [Green Version]
- Luis, J.C.; Johnson, C.B. Seasonal variations of rosmarinic and carnosic acids in rosemary extracts. Analysis of their in vitro antiradical activity. Span. J. Agric. Res. 2005, 3, 106–112. [Google Scholar] [CrossRef] [Green Version]
- Cuvelier, M.E.; Berset, C.; Richard, H. Antioxidant Constituents in Sage (Salvia officinalis). J. Agric. Food Chem. 1994, 42, 665–669. [Google Scholar] [CrossRef]
- Okamura, N.; Fujimoto, Y.; Kuwabara, S.; Yagi, A. High-performance liquid chromatographic determination of carnosic acid and carnosol in Rosmarinus officinalis and Salvia officinalis. J. Chromatogr. A 1994, 679, 381–386. [Google Scholar] [CrossRef]
- De Oliveira, M.R.; Ferreira, G.C.; Schuck, P.F. Protective effect of carnosic acid against paraquat-induced redox impairment and mitochondrial dysfunction in SH-SY5Y cells: Role for PI3K/Akt/Nrf2 pathway. Toxicol. In Vitro 2016, 32, 41–54. [Google Scholar] [CrossRef]
- De Oliveira, M.R.; Ferreira, G.C.; Schuck, P.F.; Dal Bosco, S.M. Role for the PI3K/Akt/Nrf2 signaling pathway in the protective effects of carnosic acid against methylglyoxal-induced neurotoxicity in SH-SY5Y neuroblastoma cells. Chem. Biol. Interact. 2015, 242, 396–406. [Google Scholar] [CrossRef]
- Liu, Y.; Zhang, Y.; Hu, M.; Li, Y.H.; Cao, X.H. Carnosic acid alleviates brain injury through NFkappaBregulated inflammation and Caspase3associated apoptosis in high fatinduced mouse models. Mol. Med. Rep. 2019, 20, 495–504. [Google Scholar] [CrossRef] [Green Version]
- Hosokawa, I.; Hosokawa, Y.; Ozaki, K.; Matsuo, T. Carnosic acid inhibits inflammatory cytokines production in human periodontal ligament cells. Immunopharmacol. Immunotoxicol. 2020, 42, 373–378. [Google Scholar] [CrossRef]
- Park, M.Y.; Mun, S.T. Dietary carnosic acid suppresses hepatic steatosis formation via regulation of hepatic fatty acid metabolism in high-fat diet-fed mice. Nutr. Res. Pract. 2013, 7, 294–301. [Google Scholar] [CrossRef]
- Moran, L.; Andres, S.; Bodas, R.; Prieto, N.; Giraldez, F.J. Meat texture and antioxidant status are improved when carnosic acid is included in the diet of fattening lambs. Meat Sci. 2012, 91, 430–434. [Google Scholar] [CrossRef]
- Jordan, M.J.; Castillo, J.; Banon, S.; Martinez-Conesa, C.; Sotomayor, J.A. Relevance of the carnosic acid/carnosol ratio for the level of rosemary diterpene transfer and for improving lamb meat antioxidant status. Food Chem. 2014, 151, 212–218. [Google Scholar] [CrossRef] [PubMed]
- Nieto, G.; Diaz, P.; Banon, S.; Garrido, M.D. Dietary administration of ewe diets with a distillate from rosemary leaves (Rosmarinus officinalis L.): Influence on lamb meat quality. Meat Sci. 2010, 84, 23–29. [Google Scholar] [CrossRef] [PubMed]
- Yan, H.; Wang, L.; Li, X.; Yu, C.; Zhang, K.; Jiang, Y.; Wu, L.; Lu, W.; Tu, P. High-performance liquid chromatography method for determination of carnosic acid in rat plasma and its application to pharmacokinetic study. Biomed. Chromatogr. 2009, 23, 776–781. [Google Scholar] [CrossRef]
- Doolaege, E.H.; Raes, K.; De Vos, F.; Verhe, R.; De Smet, S. Absorption, distribution and elimination of carnosic acid, a natural antioxidant from Rosmarinus officinalis, in rats. Plant Foods Hum. Nutr. 2011, 66, 196–202. [Google Scholar] [CrossRef]
- Jordan, M.J.; Monino, M.I.; Martinez, C.; Lafuente, A.; Sotomayor, J.A. Introduction of distillate rosemary leaves into the diet of the Murciano-Granadina goat: Transfer of polyphenolic compounds to goats’ milk and the plasma of suckling goat kids. J Agric. Food Chem. 2010, 58, 8265–8270. [Google Scholar] [CrossRef]
- Mezzetti, M.; Minuti, A.; Piccioli-Cappelli, F.; Gabai, G.; Trevisi, E. Administration of an Immune Stimulant during the Transition Period Improved Lipid Metabolism and Rumination without Affecting Inflammatory Status. Animals 2019, 9, 619. [Google Scholar] [CrossRef] [PubMed] [Green Version]
- Abuelo, A.; Hernandez, J.; Benedito, J.L.; Castillo, C. Oxidative stress index (OSi) as a new tool to assess redox status in dairy cattle during the transition period. Animal 2013, 7, 1374–1378. [Google Scholar] [CrossRef] [Green Version]
- Trevisi, E.; Amadori, M.; Cogrossi, S.; Razzuoli, E.; Bertoni, G. Metabolic stress and inflammatory response in high-yielding, periparturient dairy cows. Res. Vet. Sci. 2012, 93, 695–704. [Google Scholar] [CrossRef] [PubMed]
- Batistel, F.; Osorio, J.S.; Ferrari, A.; Trevisi, E.; Socha, M.T.; Loor, J.J. Immunometabolic Status during the Peripartum Period Is Enhanced with Supplemental Zn, Mn, and Cu from Amino Acid Complexes and Co from Co Glucoheptonate. PLoS ONE 2016, 11, e0155804. [Google Scholar] [CrossRef]
- Jacometo, C.B.; Zhou, Z.; Luchini, D.; Trevisi, E.; Correa, M.N.; Loor, J.J. Maternal rumen-protected methionine supplementation and its effect on blood and liver biomarkers of energy metabolism, inflammation, and oxidative stress in neonatal Holstein calves. J. Dairy Sci. 2016, 99, 6753–6763. [Google Scholar] [CrossRef] [PubMed]
- Skinner, J.G.; Brown, R.A.; Roberts, L. Bovine haptoglobin response in clinically defined field conditions. Vet. Rec. 1991, 128, 147–149. [Google Scholar] [CrossRef] [PubMed]
- Sunderman, F.W., Jr.; Nomoto, S. Measurement of human serum ceruloplasmin by its p-phenylenediamine oxidase activity. Clin. Chem. 1970, 16, 903–910. [Google Scholar] [CrossRef] [PubMed]
- Jacometo, C.B.; Osorio, J.S.; Socha, M.; Correa, M.N.; Piccioli-Cappelli, F.; Trevisi, E.; Loor, J.J. Maternal consumption of organic trace minerals alters calf systemic and neutrophil mRNA and microRNA indicators of inflammation and oxidative stress. J. Dairy Sci. 2015, 98, 7717–7729. [Google Scholar] [CrossRef] [PubMed]
- Benzie, I.F.F.; Strain, J.J. The Ferric Reducing Ability of Plasma (FRAP) as a Measure of “Antioxidant Power”: The FRAP Assay. Anal. Biochem. 1996, 239, 70–76. [Google Scholar] [CrossRef] [PubMed] [Green Version]
- Trevisi, E.; Bertoni, G.; Lombardelli, R.; Minuti, A. Relation of inflammation and liver function with the plasma cortisol response to adrenocorticotropin in early lactating dairy cows. J. Dairy Sci. 2013, 96, 5712–5722. [Google Scholar] [CrossRef] [Green Version]
- Bionaz, M.; Trevisi, E.; Calamari, L.; Librandi, F.; Ferrari, A.; Bertoni, G. Plasma paraoxonase, health, inflammatory conditions, and liver function in transition dairy cows. J. Dairy Sci. 2007, 90, 1740–1750. [Google Scholar] [CrossRef] [PubMed] [Green Version]
- Osorio, J.S.; Ji, P.; Drackley, J.K.; Luchini, D.; Loor, J.J. Supplemental Smartamine M or MetaSmart during the transition period benefits postpartal cow performance and blood neutrophil function. J. Dairy Sci. 2013, 96, 6248–6263. [Google Scholar] [CrossRef] [Green Version]
- Cao, G.; Prior, R.L. Measurement of oxygen radical absorbance capacity in biological samples. In Methods in Enzymology; Academic Press: Cambridge, MA, USA, 1999; Volume 299, pp. 50–62. [Google Scholar]
- Hutjens, M.F. Benchmarking Your Feed Efficiency, Feed Costs, and Income over Feed Cost. WCDS Adv. Dairy Technol. 2010, 22, 3–10. [Google Scholar]
- Sordillo, L.M. Nutritional strategies to optimize dairy cattle immunity. J. Dairy Sci. 2016, 99, 4967–4982. [Google Scholar] [CrossRef]
- Oh, J.; Wall, E.H.; Bravo, D.M.; Hristov, A.N. Host-mediated effects of phytonutrients in ruminants: A review. J. Dairy Sci. 2017, 100, 5974–5983. [Google Scholar] [CrossRef] [PubMed] [Green Version]
- Oh, J.; Giallongo, F.; Frederick, T.; Pate, J.; Walusimbi, S.; Elias, R.J.; Wall, E.H.; Bravo, D.; Hristov, A.N. Effects of dietary Capsicum oleoresin on productivity and immune responses in lactating dairy cows. J. Dairy Sci. 2015, 98, 6327–6339. [Google Scholar] [CrossRef] [PubMed]
- Mezzetti, M.; Minuti, A.; Bionaz, M.; Piccioli-Cappelli, F.; Trevisi, E. Effects of Aloe arborescens Whole Plant Homogenate on Lipid Metabolism, Inflammatory Conditions and Liver Function of Dairy Cows during the Transition Period. Animals 2020, 10. [Google Scholar] [CrossRef] [PubMed]
- Smeti, S.; Hajji, H.; Bouzid, K.; Abdelmoula, J.; Munoz, F.; Mahouachi, M.; Atti, N. Effects of Rosmarinus officinalis L. as essential oils or in form of leaves supplementation on goat’s production and metabolic statute. Trop. Anim. Health Prod. 2015, 47, 451–457. [Google Scholar] [CrossRef]
- Chiofalo, B.; Riolo, E.B.; Fasciana, G.; Liotta, L.; Chiofalo, V. Organic management of dietary rosemary extract in dairy sheep: Effects on milk quality and clotting properties. Vet. Res. Commun. 2010, 34 (Suppl. 1), S197–S201. [Google Scholar] [CrossRef] [Green Version]
- Kholif, A.E.; Matloup, O.H.; Morsy, T.A.; Abdo, M.M.; Abu Elella, A.A.; Anele, U.Y.; Swanson, K.C. Rosemary and lemongrass herbs as phytogenic feed additives to improve efficient feed utilization, manipulate rumen fermentation and elevate milk production of Damascus goats. Livest. Sci. 2017, 204, 39–46. [Google Scholar] [CrossRef]
- Wang, T.; Takikawa, Y.; Tabuchi, T.; Satoh, T.; Kosaka, K.; Suzuki, K. Carnosic acid (CA) prevents lipid accumulation in hepatocytes through the EGFR/MAPK pathway. J. Gastroenterol. 2012, 47, 805–813. [Google Scholar] [CrossRef]
- Allen, M.S.; Piantoni, P. Metabolic control of feed intake: Implications for metabolic disease of fresh cows. Vet. Clin. North Am. Food Anim. Pract. 2013, 29, 279–297. [Google Scholar] [CrossRef] [PubMed]
- Ceciliani, F.; Ceron, J.J.; Eckersall, P.D.; Sauerwein, H. Acute phase proteins in ruminants. J. Proteom. 2012, 75, 4207–4231. [Google Scholar] [CrossRef] [PubMed]
- Eckersall, P.D.; Bell, R. Acute phase proteins: Biomarkers of infection and inflammation in veterinary medicine. Vet. J. 2010, 185, 23–27. [Google Scholar] [CrossRef]
- Bertaggia, E.; Scabia, G.; Dalise, S.; Lo Verso, F.; Santini, F.; Vitti, P.; Chisari, C.; Sandri, M.; Maffei, M. Haptoglobin is required to prevent oxidative stress and muscle atrophy. PLoS ONE 2014, 9, e100745. [Google Scholar] [CrossRef] [PubMed]
- De Oliveira, M.R.; de Souza, I.C.C.; Furstenau, C.R. Carnosic Acid Induces Anti-Inflammatory Effects in Paraquat-Treated SH-SY5Y Cells Through a Mechanism Involving a Crosstalk Between the Nrf2/HO-1 Axis and NF-kappaB. Mol. Neurobiol. 2018, 55, 890–897. [Google Scholar] [CrossRef]
- Oh, J.; Yu, T.; Choi, S.J.; Yang, Y.; Baek, H.S.; An, S.A.; Kwon, L.K.; Kim, J.; Rho, H.S.; Shin, S.S.; et al. Syk/Src pathway-targeted inhibition of skin inflammatory responses by carnosic acid. Mediat. Inflamm. 2012, 2012, 781375. [Google Scholar] [CrossRef] [PubMed]
- Song, H.M.; Li, X.; Liu, Y.Y.; Lu, W.P.; Cui, Z.H.; Zhou, L.; Yao, D.; Zhang, H.M. Carnosic acid protects mice from high-fat diet-induced NAFLD by regulating MARCKS. Int. J. Mol. Med. 2018, 42, 193–207. [Google Scholar] [CrossRef] [Green Version]
- Turk, R.; Juretic, D.; Geres, D.; Turk, N.; Rekic, B.; Simeon-Rudolf, V.; Robic, M.; Svetina, A. Serum paraoxonase activity in dairy cows during pregnancy. Res. Vet. Sci. 2005, 79, 15–18. [Google Scholar] [CrossRef]
- Turk, R.; Juretic, D.; Geres, D.; Turk, N.; Rekic, B.; Simeon-Rudolf, V.; Svetina, A. Serum paraoxonase activity and lipid parameters in the early postpartum period of dairy cows. Res. Vet. Sci. 2004, 76, 57–61. [Google Scholar] [CrossRef]
- Aratani, Y. Myeloperoxidase: Its role for host defense, inflammation, and neutrophil function. Arch. Biochem. Biophys. 2018, 640, 47–52. [Google Scholar] [CrossRef] [PubMed]
- Depreester, E.; Meyer, E.; Demeyere, K.; Van Eetvelde, M.; Hostens, M.; Opsomer, G. Flow cytometric assessment of myeloperoxidase in bovine blood neutrophils and monocytes. J. Dairy Sci. 2017, 100, 7638–7647. [Google Scholar] [CrossRef] [PubMed]
- Rayner, B.S.; Love, D.T.; Hawkins, C.L. Comparative reactivity of myeloperoxidase-derived oxidants with mammalian cells. Free Radic. Biol. Med. 2014, 71, 240–255. [Google Scholar] [CrossRef] [PubMed]
- Li, Q.; Liu, L.; Sun, H.; Cao, K. Carnosic acid protects against lipopolysaccharide-induced acute lung injury in mice. Exp. Ther. Med. 2019, 18, 3707–3714. [Google Scholar] [CrossRef] [PubMed]
- Yang, N.; Xia, Z.; Shao, N.; Li, B.; Xue, L.; Peng, Y.; Zhi, F.; Yang, Y. Carnosic acid prevents dextran sulfate sodium-induced acute colitis associated with the regulation of the Keap1/Nrf2 pathway. Sci. Rep. 2017, 7, 11036. [Google Scholar] [CrossRef]
- Lee, D.K.; Jang, H.D. Carnosic Acid Attenuates an Early Increase in ROS Levels during Adipocyte Differentiation by Suppressing Translation of Nox4 and Inducing Translation of Antioxidant Enzymes. Int. J. Mol. Sci. 2021, 22. [Google Scholar] [CrossRef]
- Liu, P.; Dong, J. Protective effects of carnosic acid against mitochondria-mediated injury in H9c2 cardiomyocytes induced by hypoxia/reoxygenation. Exp. Ther. Med. 2017, 14, 5629–5634. [Google Scholar] [CrossRef]
- Peng, Y.-X.; Chen, C.-Z.; Luo, D.; Yu, W.-J.; Li, S.-P.; Xiao, Y.; Yuan, B.; Liang, S.; Yao, X.-R.; Kim, N.-H.; et al. Carnosic acid improves porcine early embryonic development by inhibiting the accumulation of reactive oxygen species. J. Reprod. Dev. 2020, 66, 555–562. [Google Scholar] [CrossRef]
- Levine, J.J.; Pettei, M.J.; Valderrama, E.; Gold, D.M.; Kessler, B.H.; Trachtman, H. Nitric Oxide and Inflammatory Bowel Disease: Evidence for Local Intestinal Production in Children with Active Colonic Disease. J. Pediatric Gastroenterol. Nutr. 1998, 26, 34–38. [Google Scholar] [CrossRef] [PubMed]
- Burner, U.; Furtmuller, P.G.; Kettle, A.J.; Koppenol, W.H.; Obinger, C. Mechanism of reaction of myeloperoxidase with nitrite. J. Biol. Chem. 2000, 275, 20597–20601. [Google Scholar] [CrossRef] [Green Version]
- Nash, K.M.; Rockenbauer, A.; Villamena, F.A. Reactive nitrogen species reactivities with nitrones: Theoretical and experimental studies. Chem. Res. Toxicol. 2012, 25, 1581–1597. [Google Scholar] [CrossRef] [PubMed] [Green Version]
- Tripathi, P.; Tripathi, P.; Kashyap, L.; Singh, V. The role of nitric oxide in inflammatory reactions. FEMS Immunol. Med. Microbiol. 2007, 51, 443–452. [Google Scholar] [CrossRef] [PubMed] [Green Version]
- Coleman, J.W. Nitric oxide in immunity and inflammation. Int. Immunopharmacol. 2001, 1, 1397–1406. [Google Scholar] [CrossRef]
- Hou, C.-W.; Lin, Y.-T.; Chen, Y.-L.; Wang, Y.-H.; Chou, J.-L.; Ping, L.-Y.; Jeng, K.-C. Neuroprotective effects of carnosic acid on neuronal cells under ischemic and hypoxic stress. Nutr. Neurosci. 2012, 15, 257–263. [Google Scholar] [CrossRef]

| Treatment | ||
|---|---|---|
| Event | CA | Saline |
| Total animals | 10 | 10 |
| Subclinical ketosis 1 | 5 | 4 |
| Clinical ketosis 2 | 0 | 2 |
| Retained placenta 3 | 0 | 1 |
| Displaced abomasum | 0 | 1 |
| Metritis 4 | 1 | 0 |
| Pneumonia | 1 | 0 |
| Total excluded cows 5 | 2 | 2 |
| Diet | ||
|---|---|---|
| Component | Close-up | Lactation |
| Ingredient, % of DM | ||
| Corn silage | 36.9 | 32.5 |
| Alfalfa hay | - | 7.6 |
| Alfalfa haylage | - | 12.1 |
| Grass hay | 24.6 | - |
| Wheat straw | 12.4 | - |
| Soybean meal | 11.5 | 5.7 |
| Cottonseed | - | 6.7 |
| Molasses | - | 5.0 |
| Dry cow grain mix 1 | 14.6 | - |
| Lactating cow grain mix 2 | - | 30.4 |
| Chemical analysis | ||
| DM, % | 46.7 | 47.6 |
| NEL, Mcal/ kg DM | 1.46 | 1.75 |
| CP, % DM | 15.1 | 19.6 |
| NDF, % DM | 43.7 | 31.8 |
| ADF, % DM | 27.4 | 17.7 |
| Starch, % DM | 15.9 | 28.2 |
| DCAD, mEq/100 g | −12.3 | - |
| Treatment | p-Value | |||||
|---|---|---|---|---|---|---|
| Parameter | CA | Saline | SEM 1 | Trt | Time | Trt × T 2 |
| Prepartum | ||||||
| Body weight, kg | 873.3 | 801.6 | 25.0 | 0.06 | 0.01 | 0.34 |
| Body condition score | 3.70 | 3.75 | 0.08 | 0.65 | 0.74 | 0.24 |
| Dry matter intake, kg/d | 15.3 | 13.2 | 0.92 | 0.12 | <0.01 | 0.41 |
| Dry matter intake, % BW | 1.73 | 1.69 | 0.13 | 0.82 | <0.01 | 0.04 |
| Energy balance, Mcal/d | 6.10 | 4.49 | 1.56 | 0.47 | <0.01 | 0.05 |
| Postpartum | ||||||
| Body weight, kg | 735.5 | 739.9 | 7.64 | 0.71 | <0.01 | 0.19 |
| Body condition score | 3.55 | 3.54 | 0.04 | 0.88 | <0.01 | 0.13 |
| BW change 3, % | −13.0 | −11.6 | 0.92 | 0.33 | <0.01 | 0.22 |
| BCS change 3, % | −4.8 | −5.2 | 1.06 | 0.77 | <0.01 | 0.26 |
| Dry matter intake, kg/d | 18.6 | 20.2 | 0.72 | 0.15 | <0.01 | 0.70 |
| Dry matter intake, % BW | 2.48 | 2.85 | 0.11 | 0.03 | <0.01 | 0.33 |
| Energy balance, Mcal/d | −13.51 | −9.53 | 1.82 | 0.14 | 0.02 | 0.19 |
| Treatment | p-Value | |||||
|---|---|---|---|---|---|---|
| Parameter | CA | Saline | SEM 1 | Trt | Time | Trt × T 2 |
| Milk yield, kg/d | 41.8 | 37.3 | 1.76 | 0.10 | <0.01 | 0.35 |
| Energy corrected milk 3, kg/d | 51.3 | 45.0 | 2.35 | 0.08 | <0.01 | 0.95 |
| Milk efficiency, Milk/DMI 4 | 2.37 | 2.04 | 0.12 | 0.06 | 0.02 | 0.56 |
| Milk efficiency, ECM/DMI | 2.75 | 2.47 | 0.17 | 0.25 | 0.03 | 0.11 |
| Milk Composition | ||||||
| Fat, % | 5.07 | 5.26 | 0.23 | 0.56 | <0.01 | 0.78 |
| Fat yield, kg/d | 2.11 | 1.89 | 0.12 | 0.19 | 0.13 | 0.82 |
| Protein, % | 3.52 | 3.53 | 0.14 | 0.96 | <0.01 | 0.60 |
| Protein yield, kg/d | 1.45 | 1.27 | 0.07 | 0.10 | 0.18 | 0.93 |
| Lactose, % | 4.69 | 4.74 | 0.05 | 0.49 | <0.01 | 0.56 |
| Solids, % | 14.35 | 14.62 | 0.25 | 0.47 | <0.01 | 0.70 |
| Milk urea nitrogen, mg/dL | 12.71 | 12.19 | 0.92 | 0.70 | 0.73 | 0.88 |
| Log-transformed SCC 5 | 4.93 | 5.11 | 0.14 | 0.40 | 0.08 | 0.79 |
| Treatment | p-Value | |||
|---|---|---|---|---|
| Parameter | CA | Saline | SEM 1 | Trt |
| Energy metabolites | ||||
| Glucose, mmol/L | 4.10 | 4.03 | 0.11 | 0.68 |
| BHB, mmol/L | 0.83 | 0.82 | 0.12 | 0.98 |
| NEFA, mmol/L | 0.83 | 0.65 | 0.13 | 0.35 |
| Inflammation | ||||
| Ceruloplasmin, µmol/L | 2.30 | 2.41 | 0.07 | 0.38 |
| Haptoglobin 2, g/L | 0.67 | 1.06 | 0.16 | <0.01 |
| Liver function | ||||
| Albumin, g/L | 33.46 | 33.97 | 0.49 | 0.48 |
| Cholesterol, mmol/L | 1.74 | 1.84 | 0.09 | 0.42 |
| Paraoxonase, U/mL | 58.03 | 67.38 | 2.61 | 0.03 |
| Bilirubin 2, µmol/L | 5.17 | 5.21 | 0.42 | 0.99 |
| AST, U/L | 119.9 | 105.3 | 8.20 | 0.23 |
| GGT 2, U/L | 17.39 | 16.34 | 0.09 | 0.48 |
| Muscle mass catabolism | ||||
| Urea, mmol/L | 5.39 | 5.28 | 0.27 | 0.80 |
| Creatinine, µmol/L | 94.25 | 88.27 | 2.97 | 0.21 |
| Oxidative stress | ||||
| FRAP 2, µmol/L | 140.1 | 163.1 | 0.06 | 0.02 |
| Myeloperoxidase, U/L | 485.3 | 519.6 | 12.8 | 0.07 |
| ROM, mg H2O2/100mL | 15.88 | 16.73 | 0.52 | 0.28 |
| NO2–, µmol/L | 2.63 | 4.58 | 0.35 | <0.01 |
| NO3–, µmol/L | 21.85 | 19.62 | 1.13 | 0.19 |
| NOx, µmol/L | 23.9 | 23.65 | 0.87 | 0.84 |
| ORAC, µg/mL | 12.50 | 13.06 | 0.34 | 0.25 |
| ROM/FRAP | 0.11 | 0.10 | 0.01 | 0.44 |
| ROM/ORAC | 1.25 | 1.32 | 0.06 | 0.40 |
| Treatment | p-Value | |||||
|---|---|---|---|---|---|---|
| Parameter | CA | Saline | SEM 1 | Trt | Time | Trt × T 3 |
| Energy metabolites | ||||||
| Glucose, mmol/L | 3.87 | 4.02 | 0.08 | 0.20 | 0.03 | 0.88 |
| BHB, mmol/L | 1.06 | 0.99 | 0.21 | 0.83 | 0.73 | 0.90 |
| NEFA, mmol/L | 0.63 | 0.63 | 0.09 | 0.99 | <0.01 | 0.88 |
| Inflammation | ||||||
| Ceruloplasmin, µmol/L | 2.88 | 2.99 | 0.12 | 0.55 | 0.28 | 0.90 |
| Haptoglobin 2, g/L | 0.44 | 0.44 | 0.17 | 0.99 | 0.14 | 0.04 |
| Liver function | ||||||
| Albumin, g/L | 35.51 | 34.71 | 0.33 | 0.11 | 0.03 | 0.53 |
| Cholesterol, mmol/L | 2.92 | 3.11 | 0.13 | 0.31 | <0.01 | 0.37 |
| Paraoxonase, U/mL | 83.08 | 92.07 | 5.33 | 0.25 | 0.10 | 0.79 |
| Bilirubin 2, µmol/L | 3.46 | 3.66 | 0.20 | 0.78 | <0.01 | 0.79 |
| AST, U/L | 149.2 | 122.9 | 13.43 | 0.19 | 0.21 | 0.34 |
| GGT 2, U/L | 23.92 | 20.25 | 0.16 | 0.32 | 0.06 | 0.40 |
| Muscle mass catabolism | ||||||
| Urea, mmol/L | 5.01 | 5.06 | 0.23 | 0.87 | 0.37 | 0.51 |
| Creatinine, µmol/L | 84.83 | 82.35 | 1.42 | 0.25 | <0.01 | 0.71 |
| Oxidative stress | ||||||
| FRAP 2 ,µmol/L | 128.0 | 132.5 | 0.09 | 0.71 | <0.01 | 0.12 |
| Myeloperoxidase, U/L | 447.4 | 436.1 | 19.9 | 0.70 | 0.01 | 0.95 |
| ROM, mg H2O2/100mL | 17.61 | 18.40 | 0.69 | 0.44 | 0.10 | 0.35 |
| NO2–, µmol/L | 5.78 | 5.90 | 0.42 | 0.85 | <0.01 | 0.92 |
| NO3–, µmol/L | 21.71 | 23.07 | 0.58 | 0.10 | 0.01 | 0.91 |
| NOx, µmol/L | 28.25 | 28.21 | 0.72 | 0.97 | <0.01 | 0.96 |
| ORAC, µg/mL | 12.56 | 12.23 | 0.58 | 0.70 | 0.95 | 0.97 |
| ROM/FRAP | 0.14 | 0.15 | 0.01 | 0.86 | <0.01 | 0.69 |
| ROM/ORAC | 1.48 | 1.56 | 0.09 | 0.53 | 0.74 | 0.56 |
Publisher’s Note: MDPI stays neutral with regard to jurisdictional claims in published maps and institutional affiliations. |
© 2021 by the authors. Licensee MDPI, Basel, Switzerland. This article is an open access article distributed under the terms and conditions of the Creative Commons Attribution (CC BY) license (https://creativecommons.org/licenses/by/4.0/).
Share and Cite
Michelotti, T.C.; Trevisi, E.; Osorio, J.S. An Exploration of the Effects of an Early Postpartum Intravenous Infusion with Carnosic Acid on Physiological Responses of Transition Dairy Cows. Antioxidants 2021, 10, 1478. https://doi.org/10.3390/antiox10091478
Michelotti TC, Trevisi E, Osorio JS. An Exploration of the Effects of an Early Postpartum Intravenous Infusion with Carnosic Acid on Physiological Responses of Transition Dairy Cows. Antioxidants. 2021; 10(9):1478. https://doi.org/10.3390/antiox10091478
Chicago/Turabian StyleMichelotti, Tainara Cristina, Erminio Trevisi, and Johan S. Osorio. 2021. "An Exploration of the Effects of an Early Postpartum Intravenous Infusion with Carnosic Acid on Physiological Responses of Transition Dairy Cows" Antioxidants 10, no. 9: 1478. https://doi.org/10.3390/antiox10091478
APA StyleMichelotti, T. C., Trevisi, E., & Osorio, J. S. (2021). An Exploration of the Effects of an Early Postpartum Intravenous Infusion with Carnosic Acid on Physiological Responses of Transition Dairy Cows. Antioxidants, 10(9), 1478. https://doi.org/10.3390/antiox10091478